

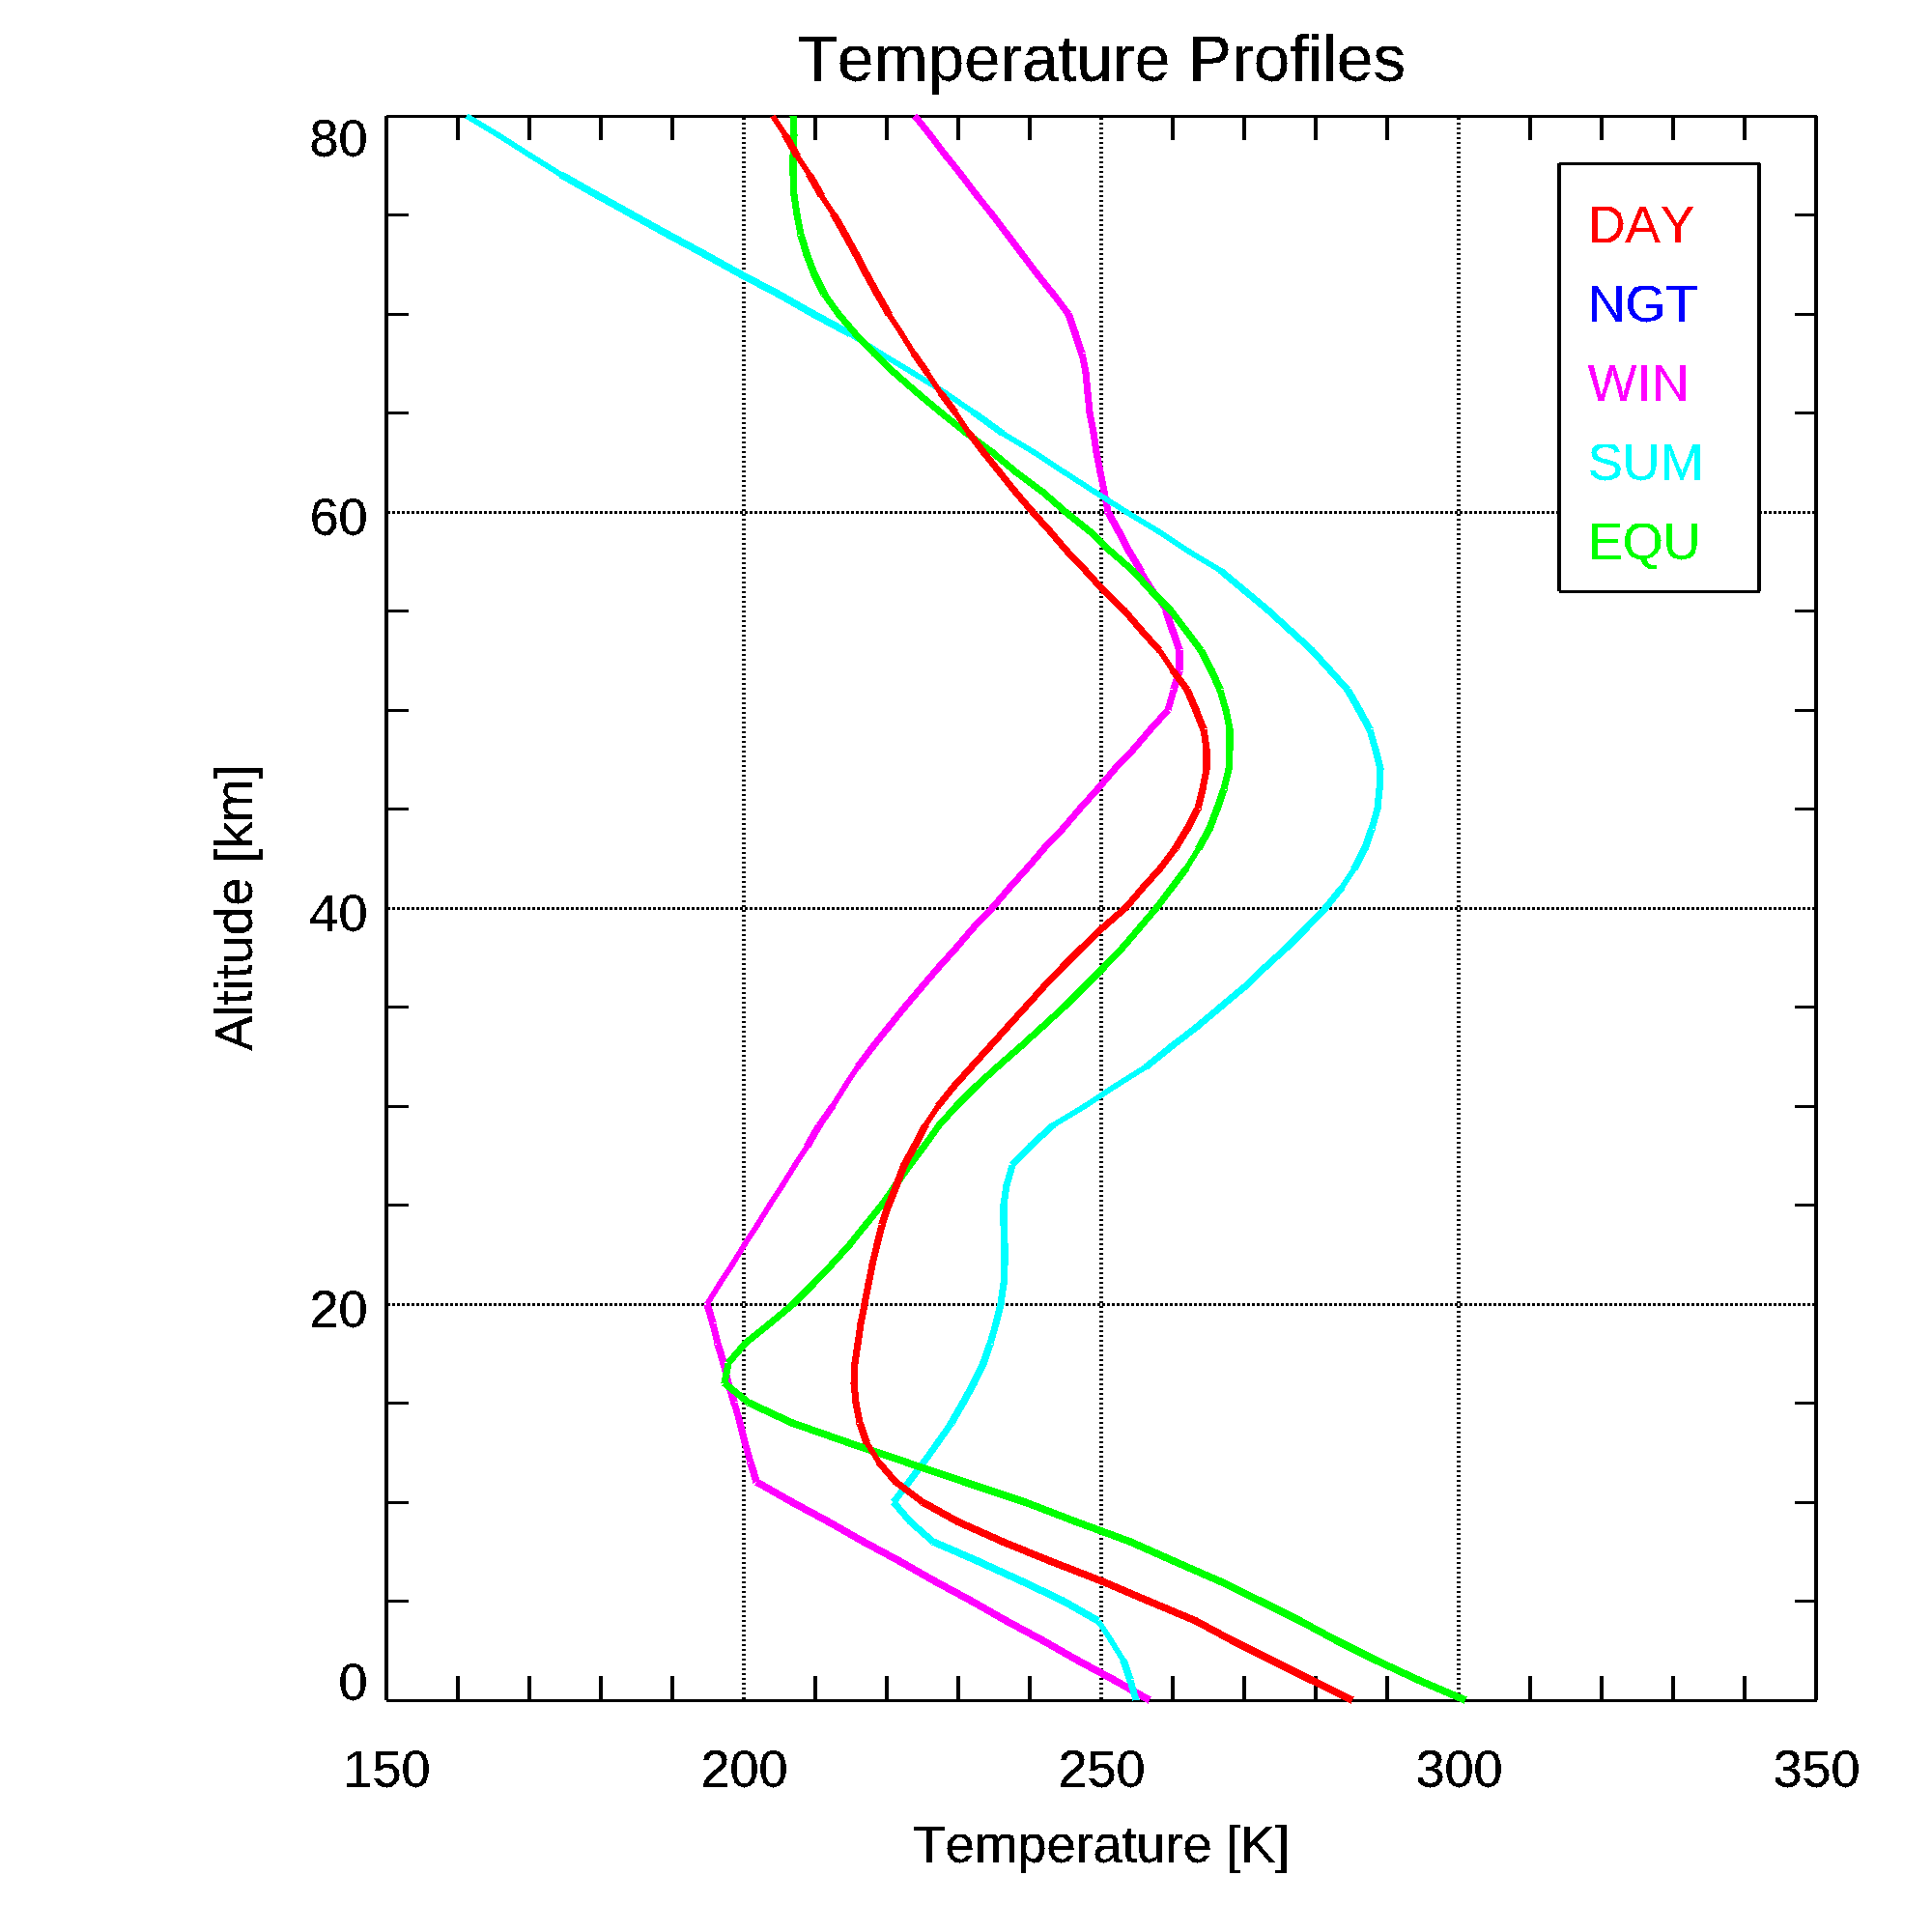
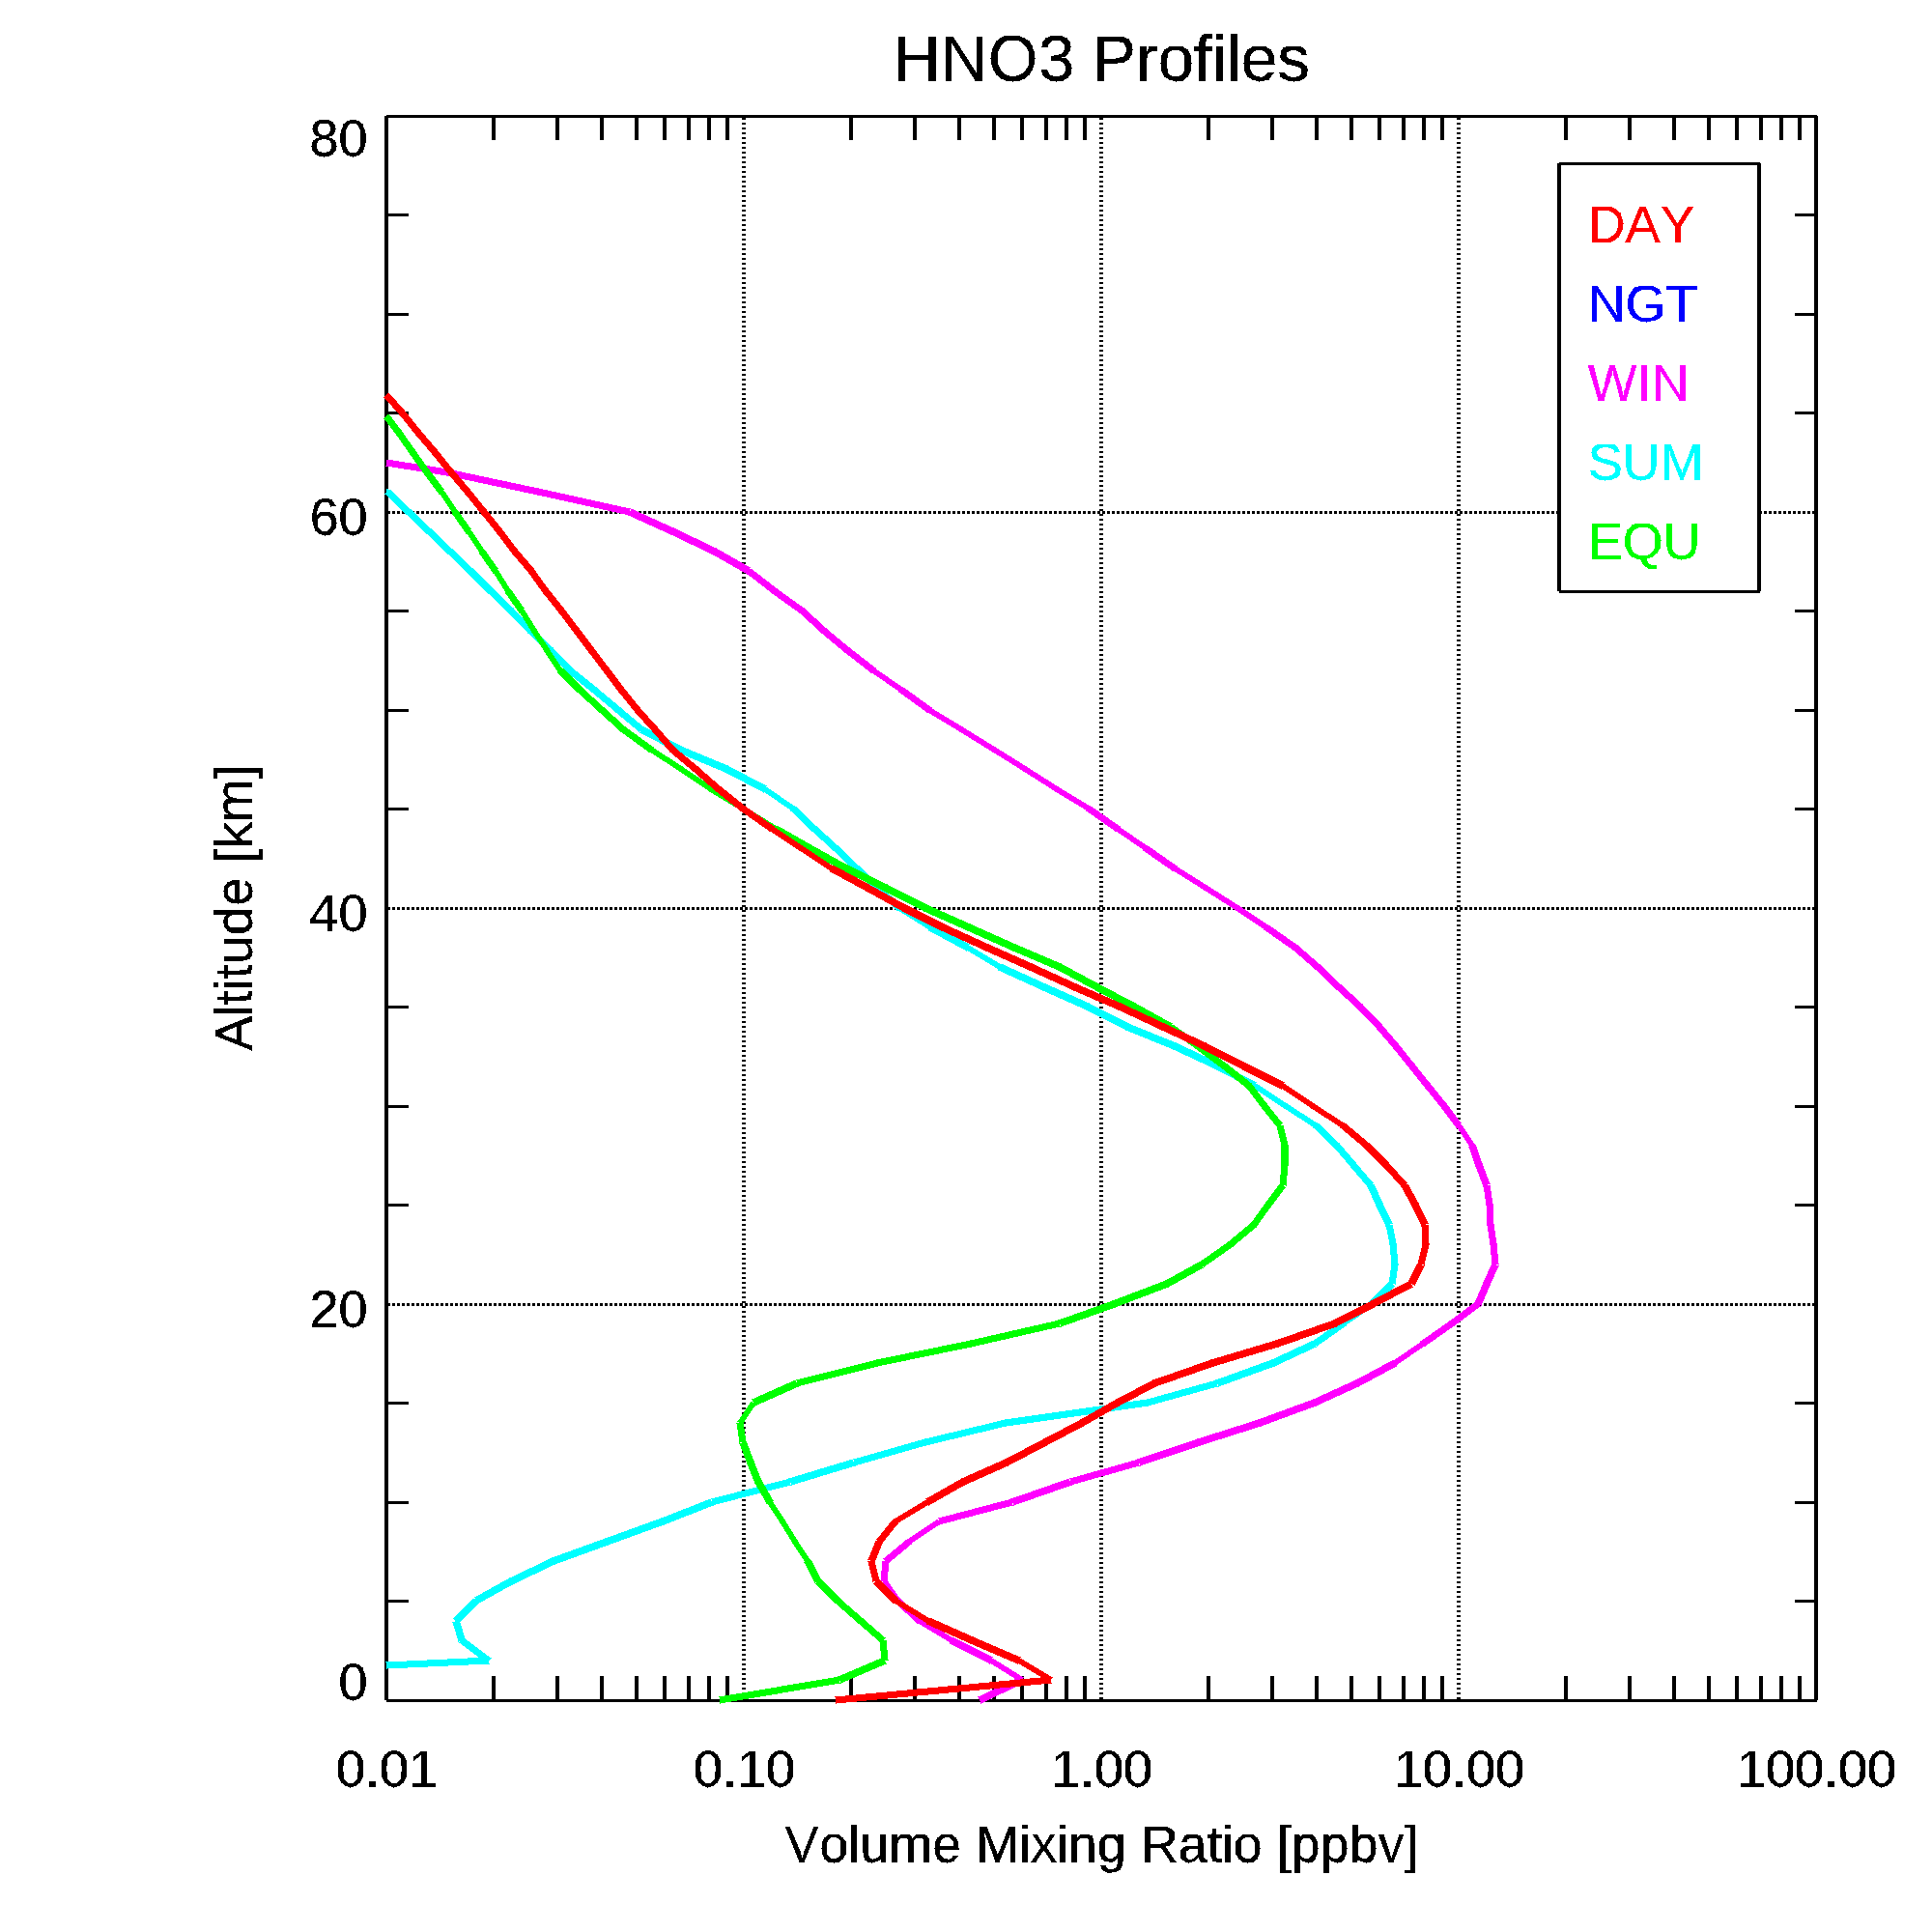
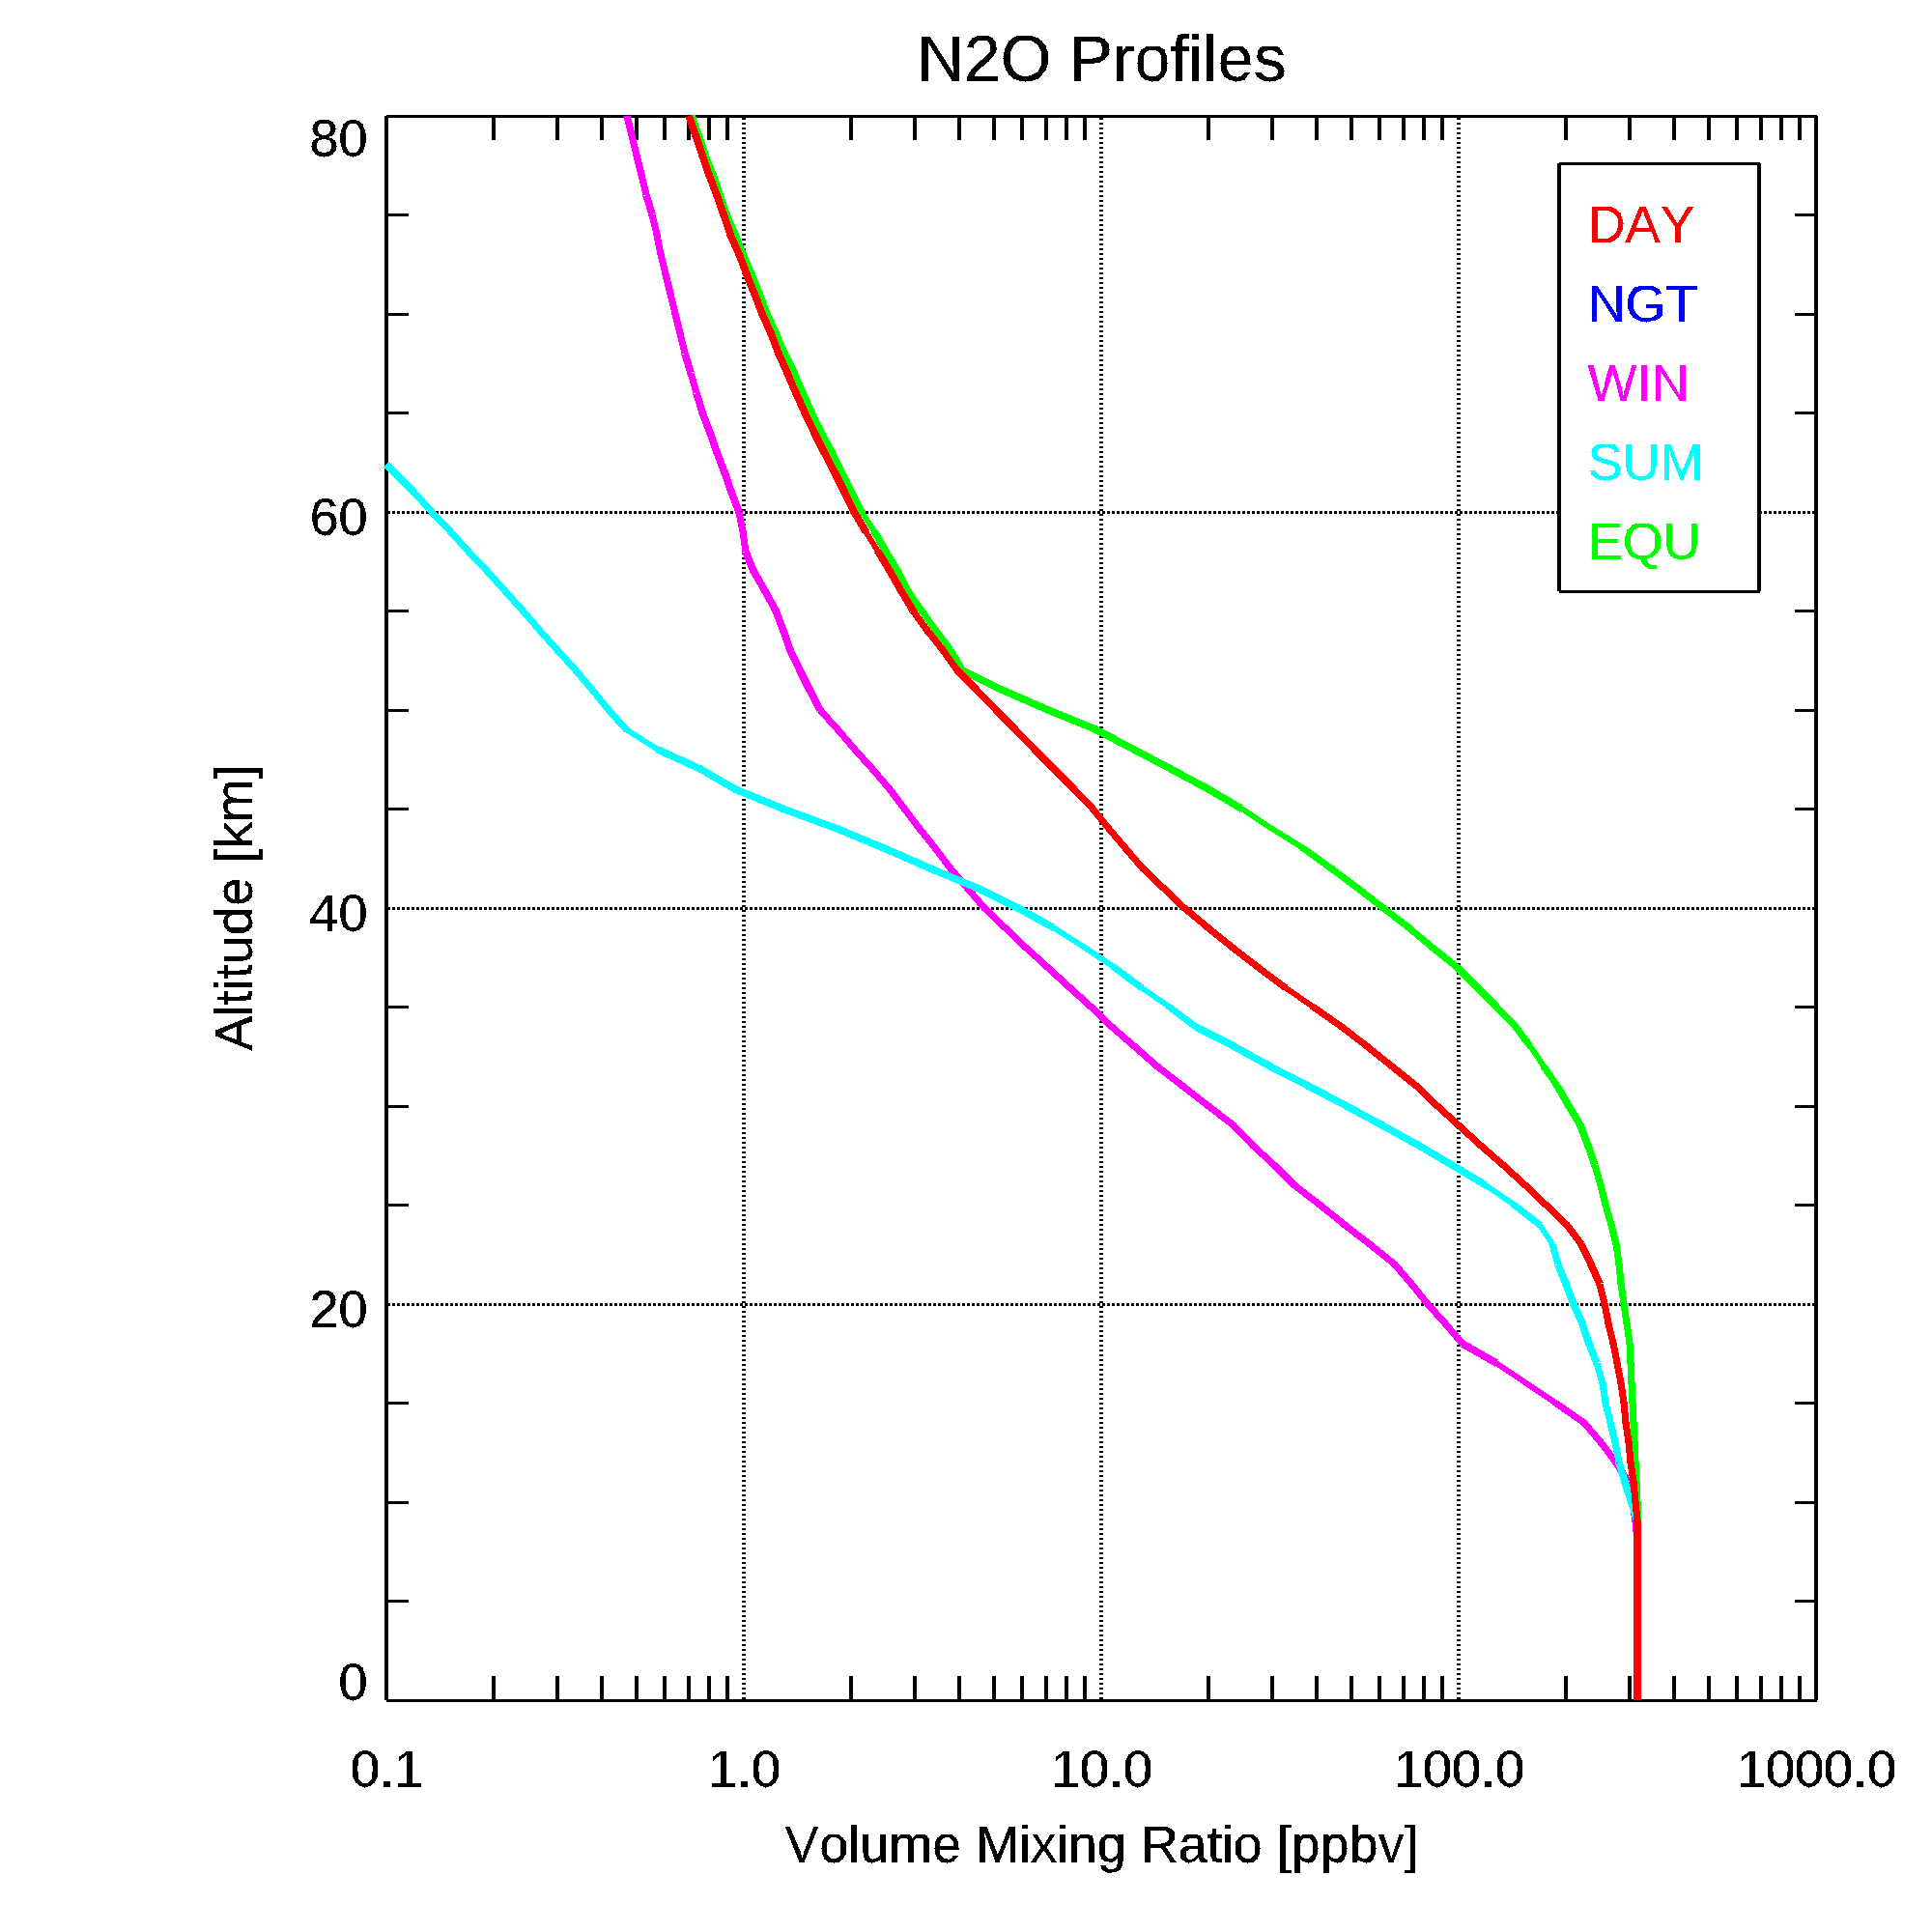
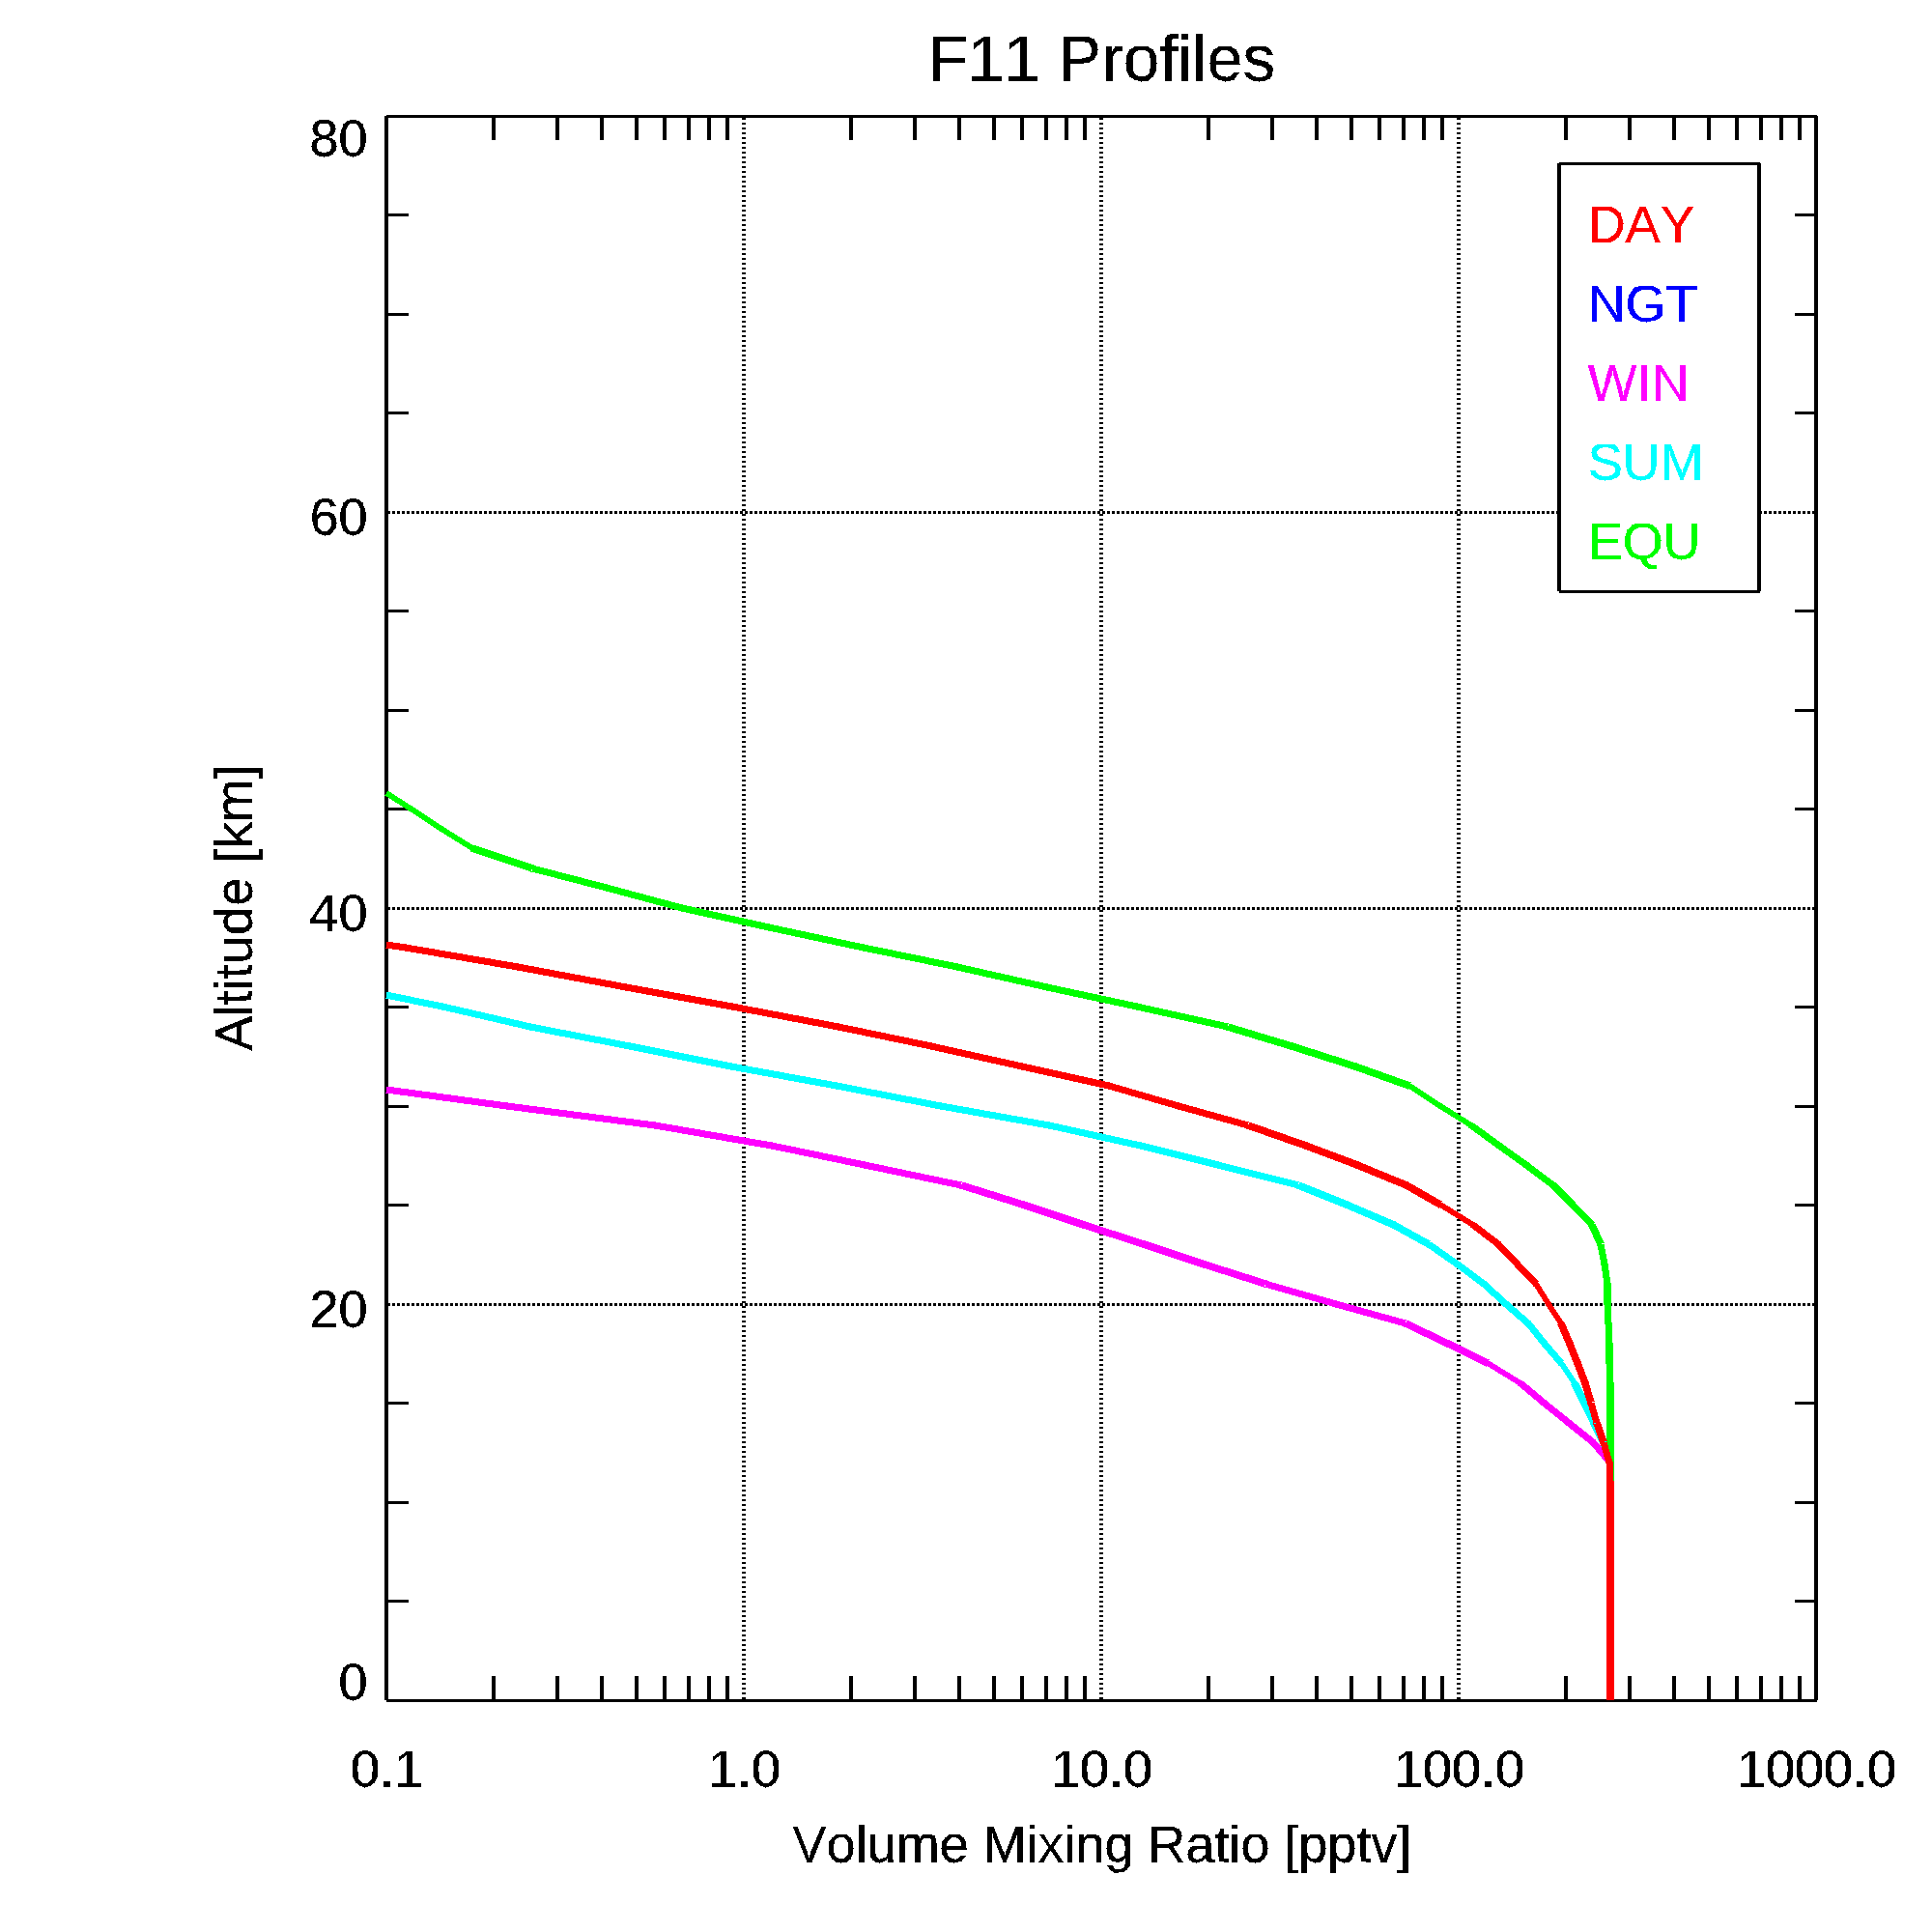
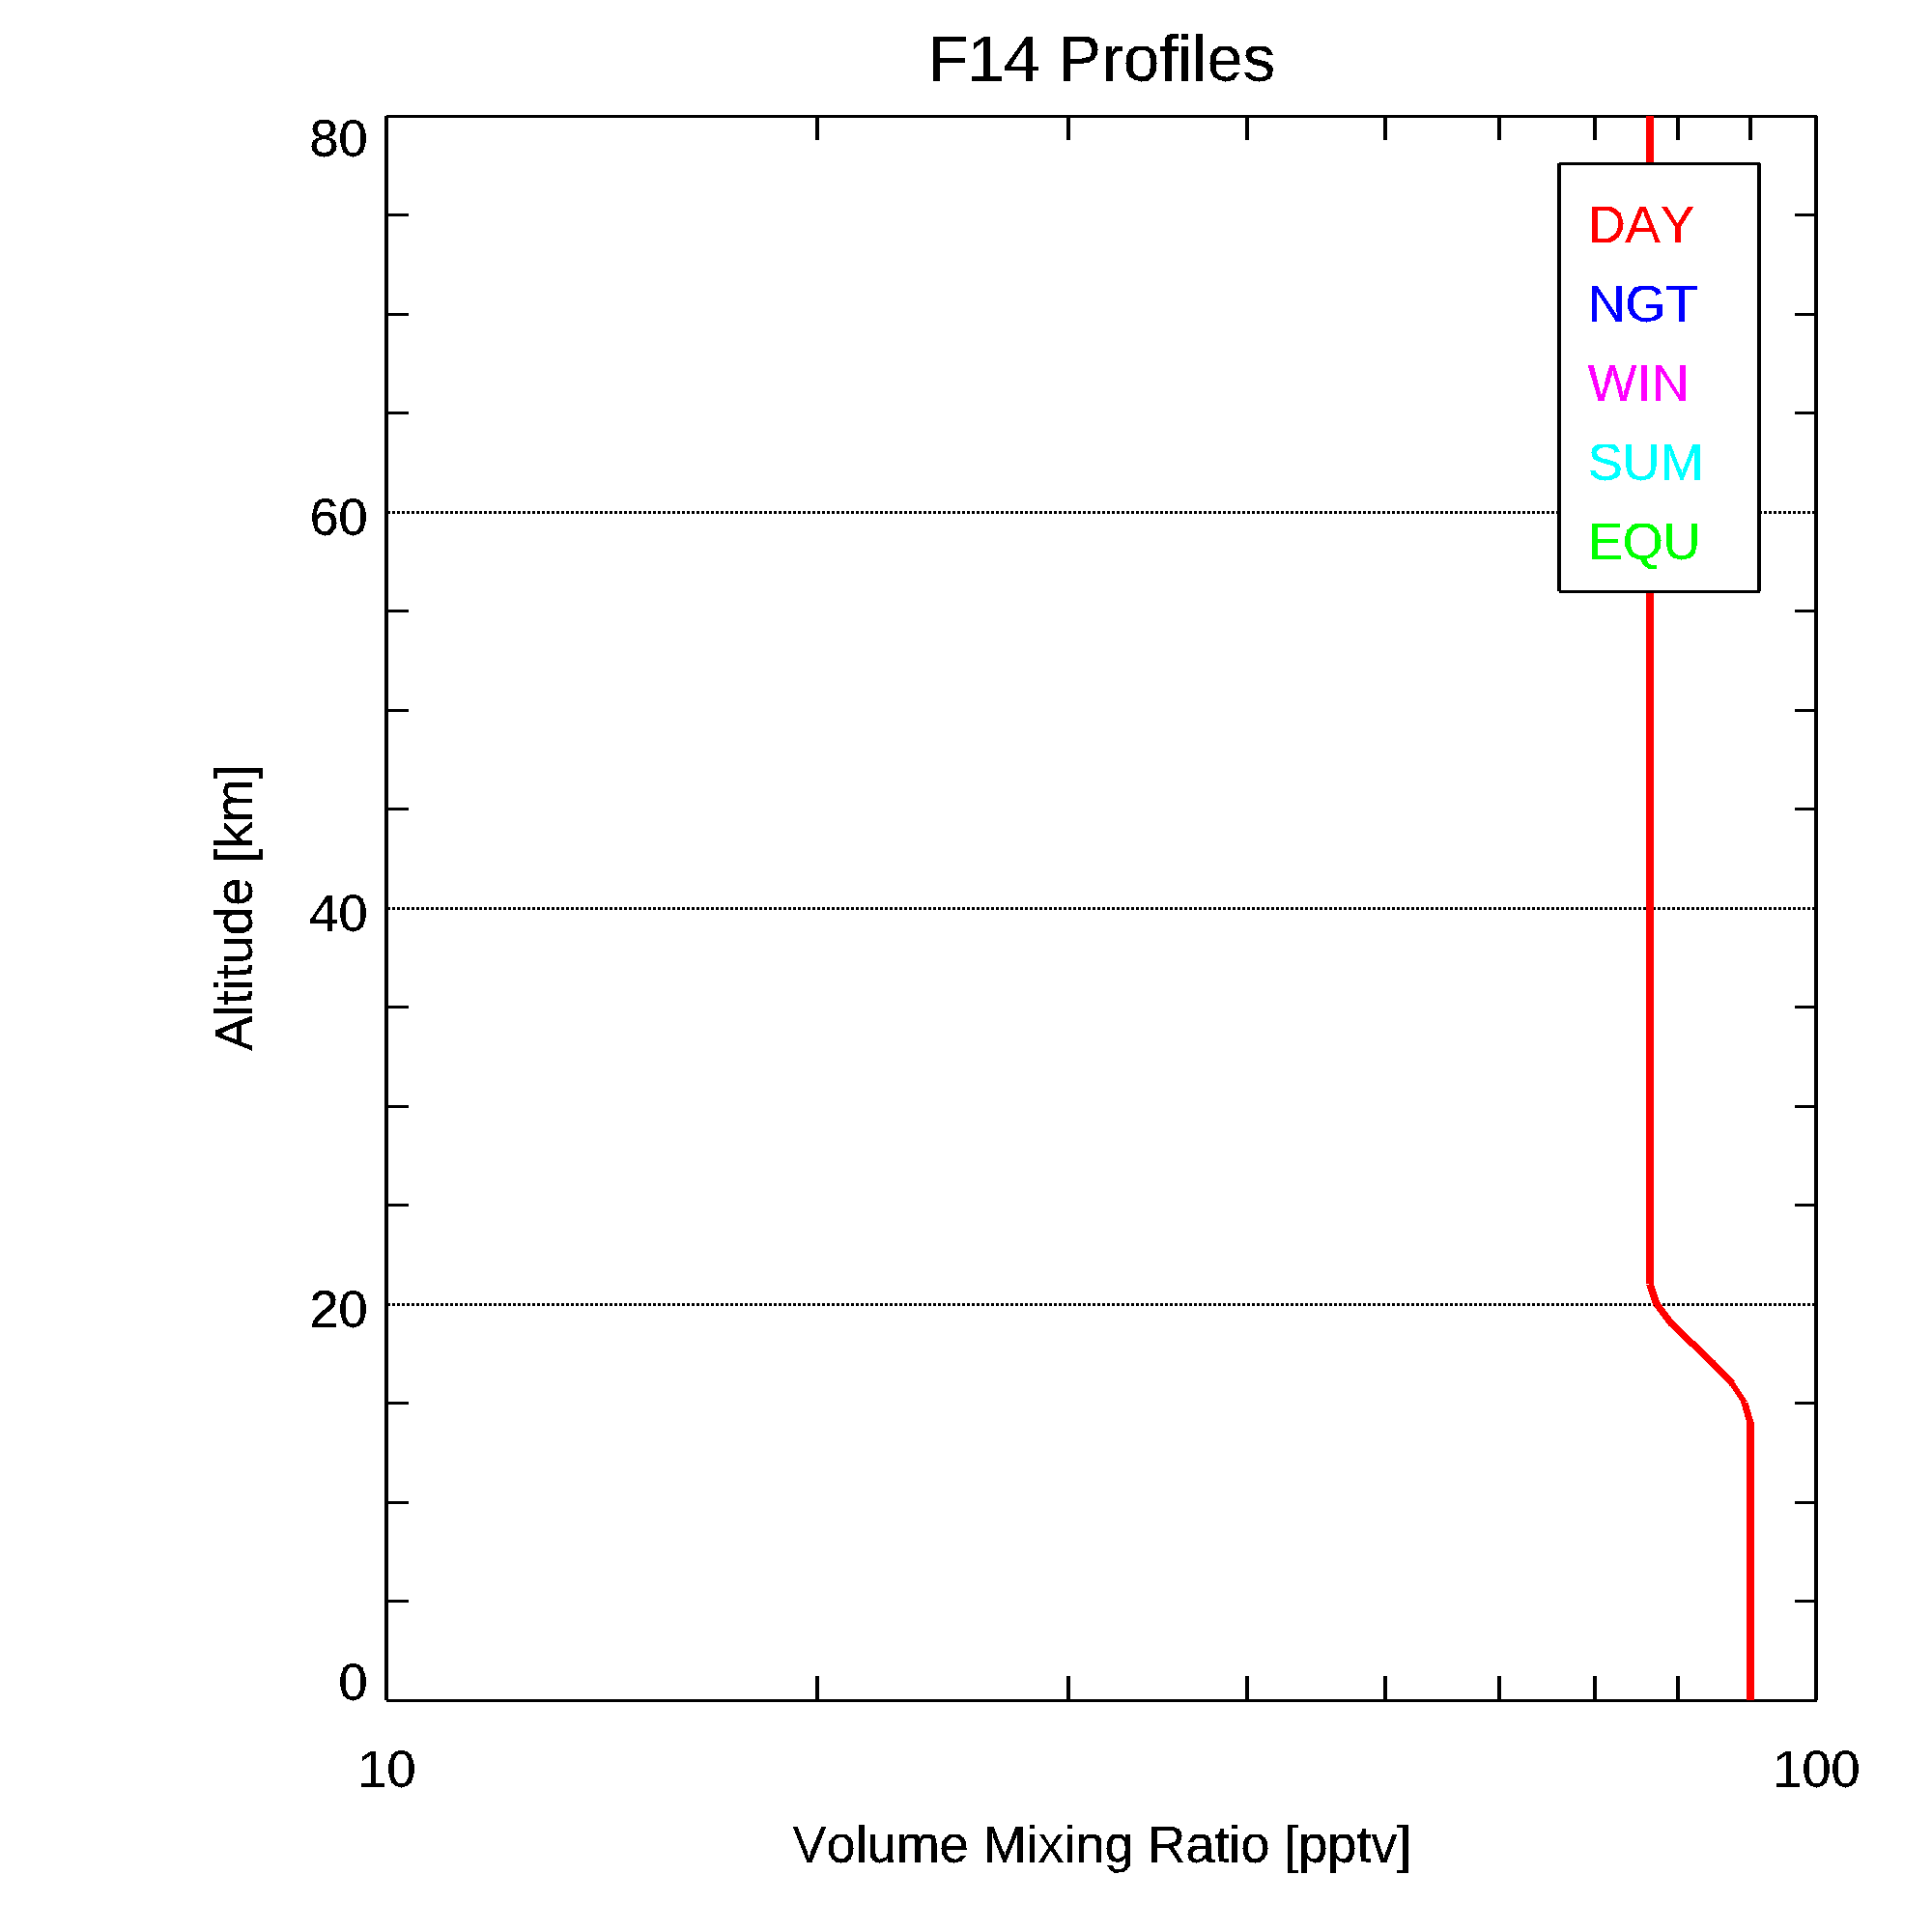
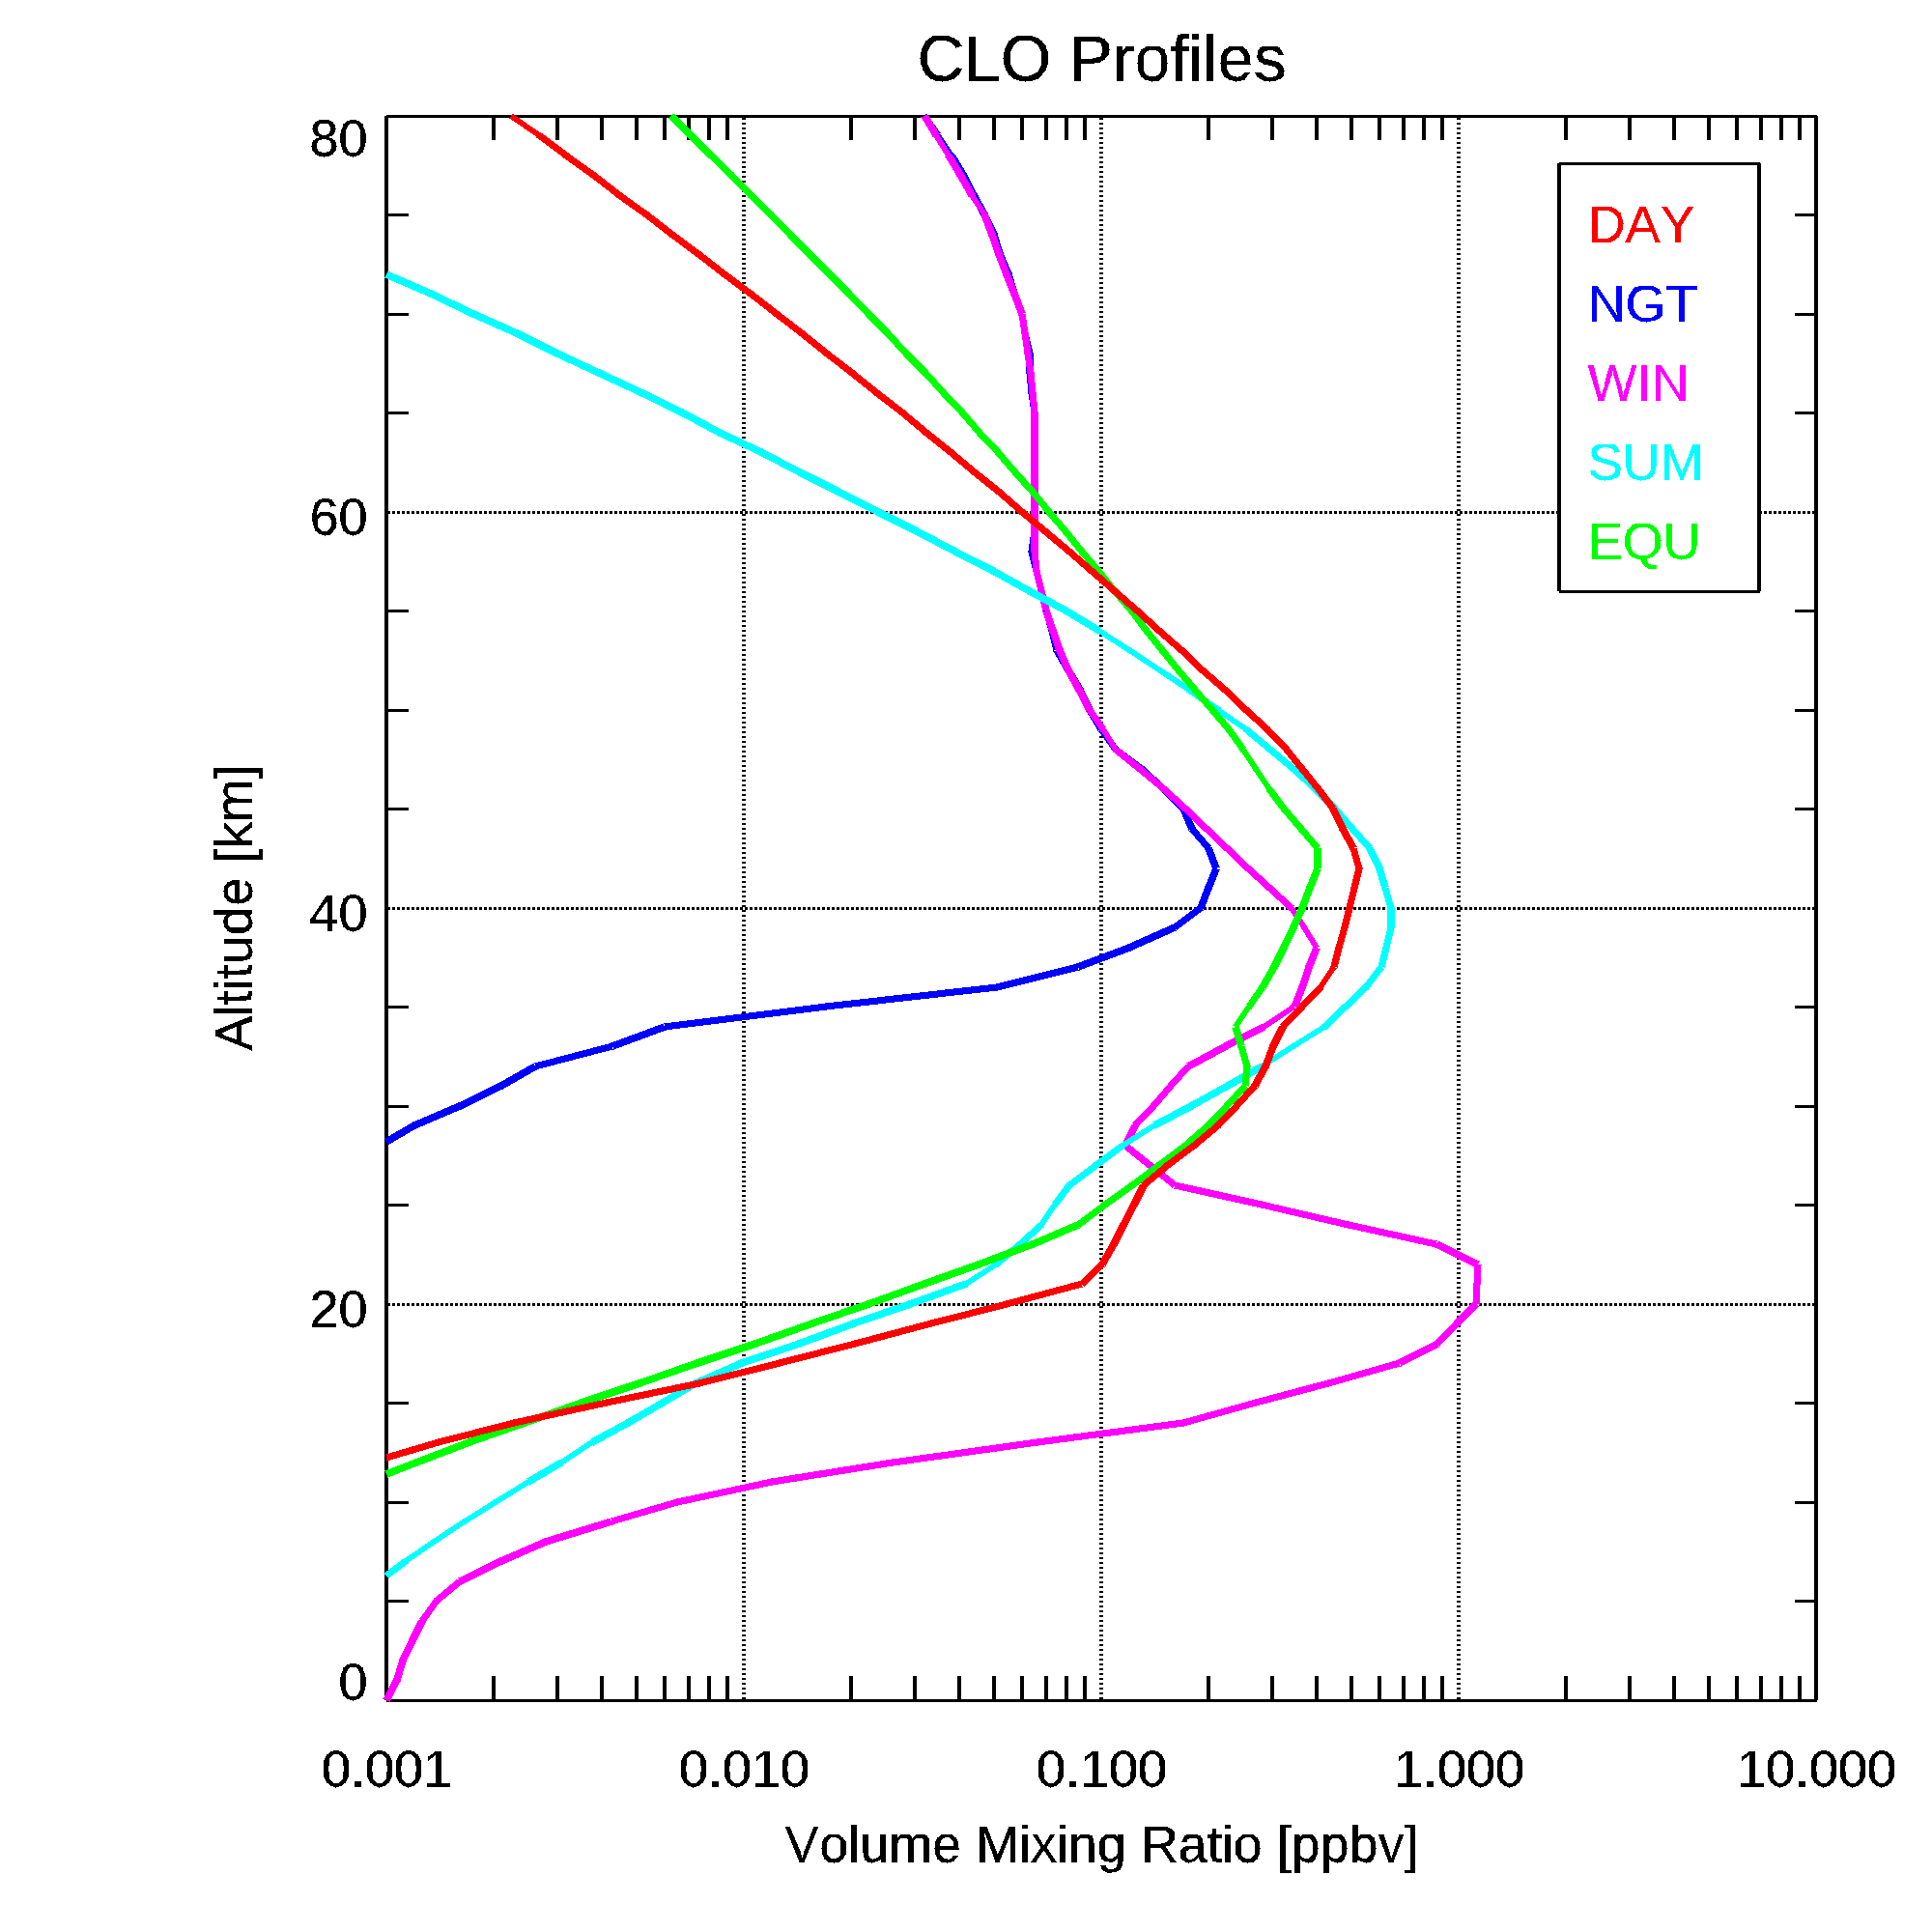
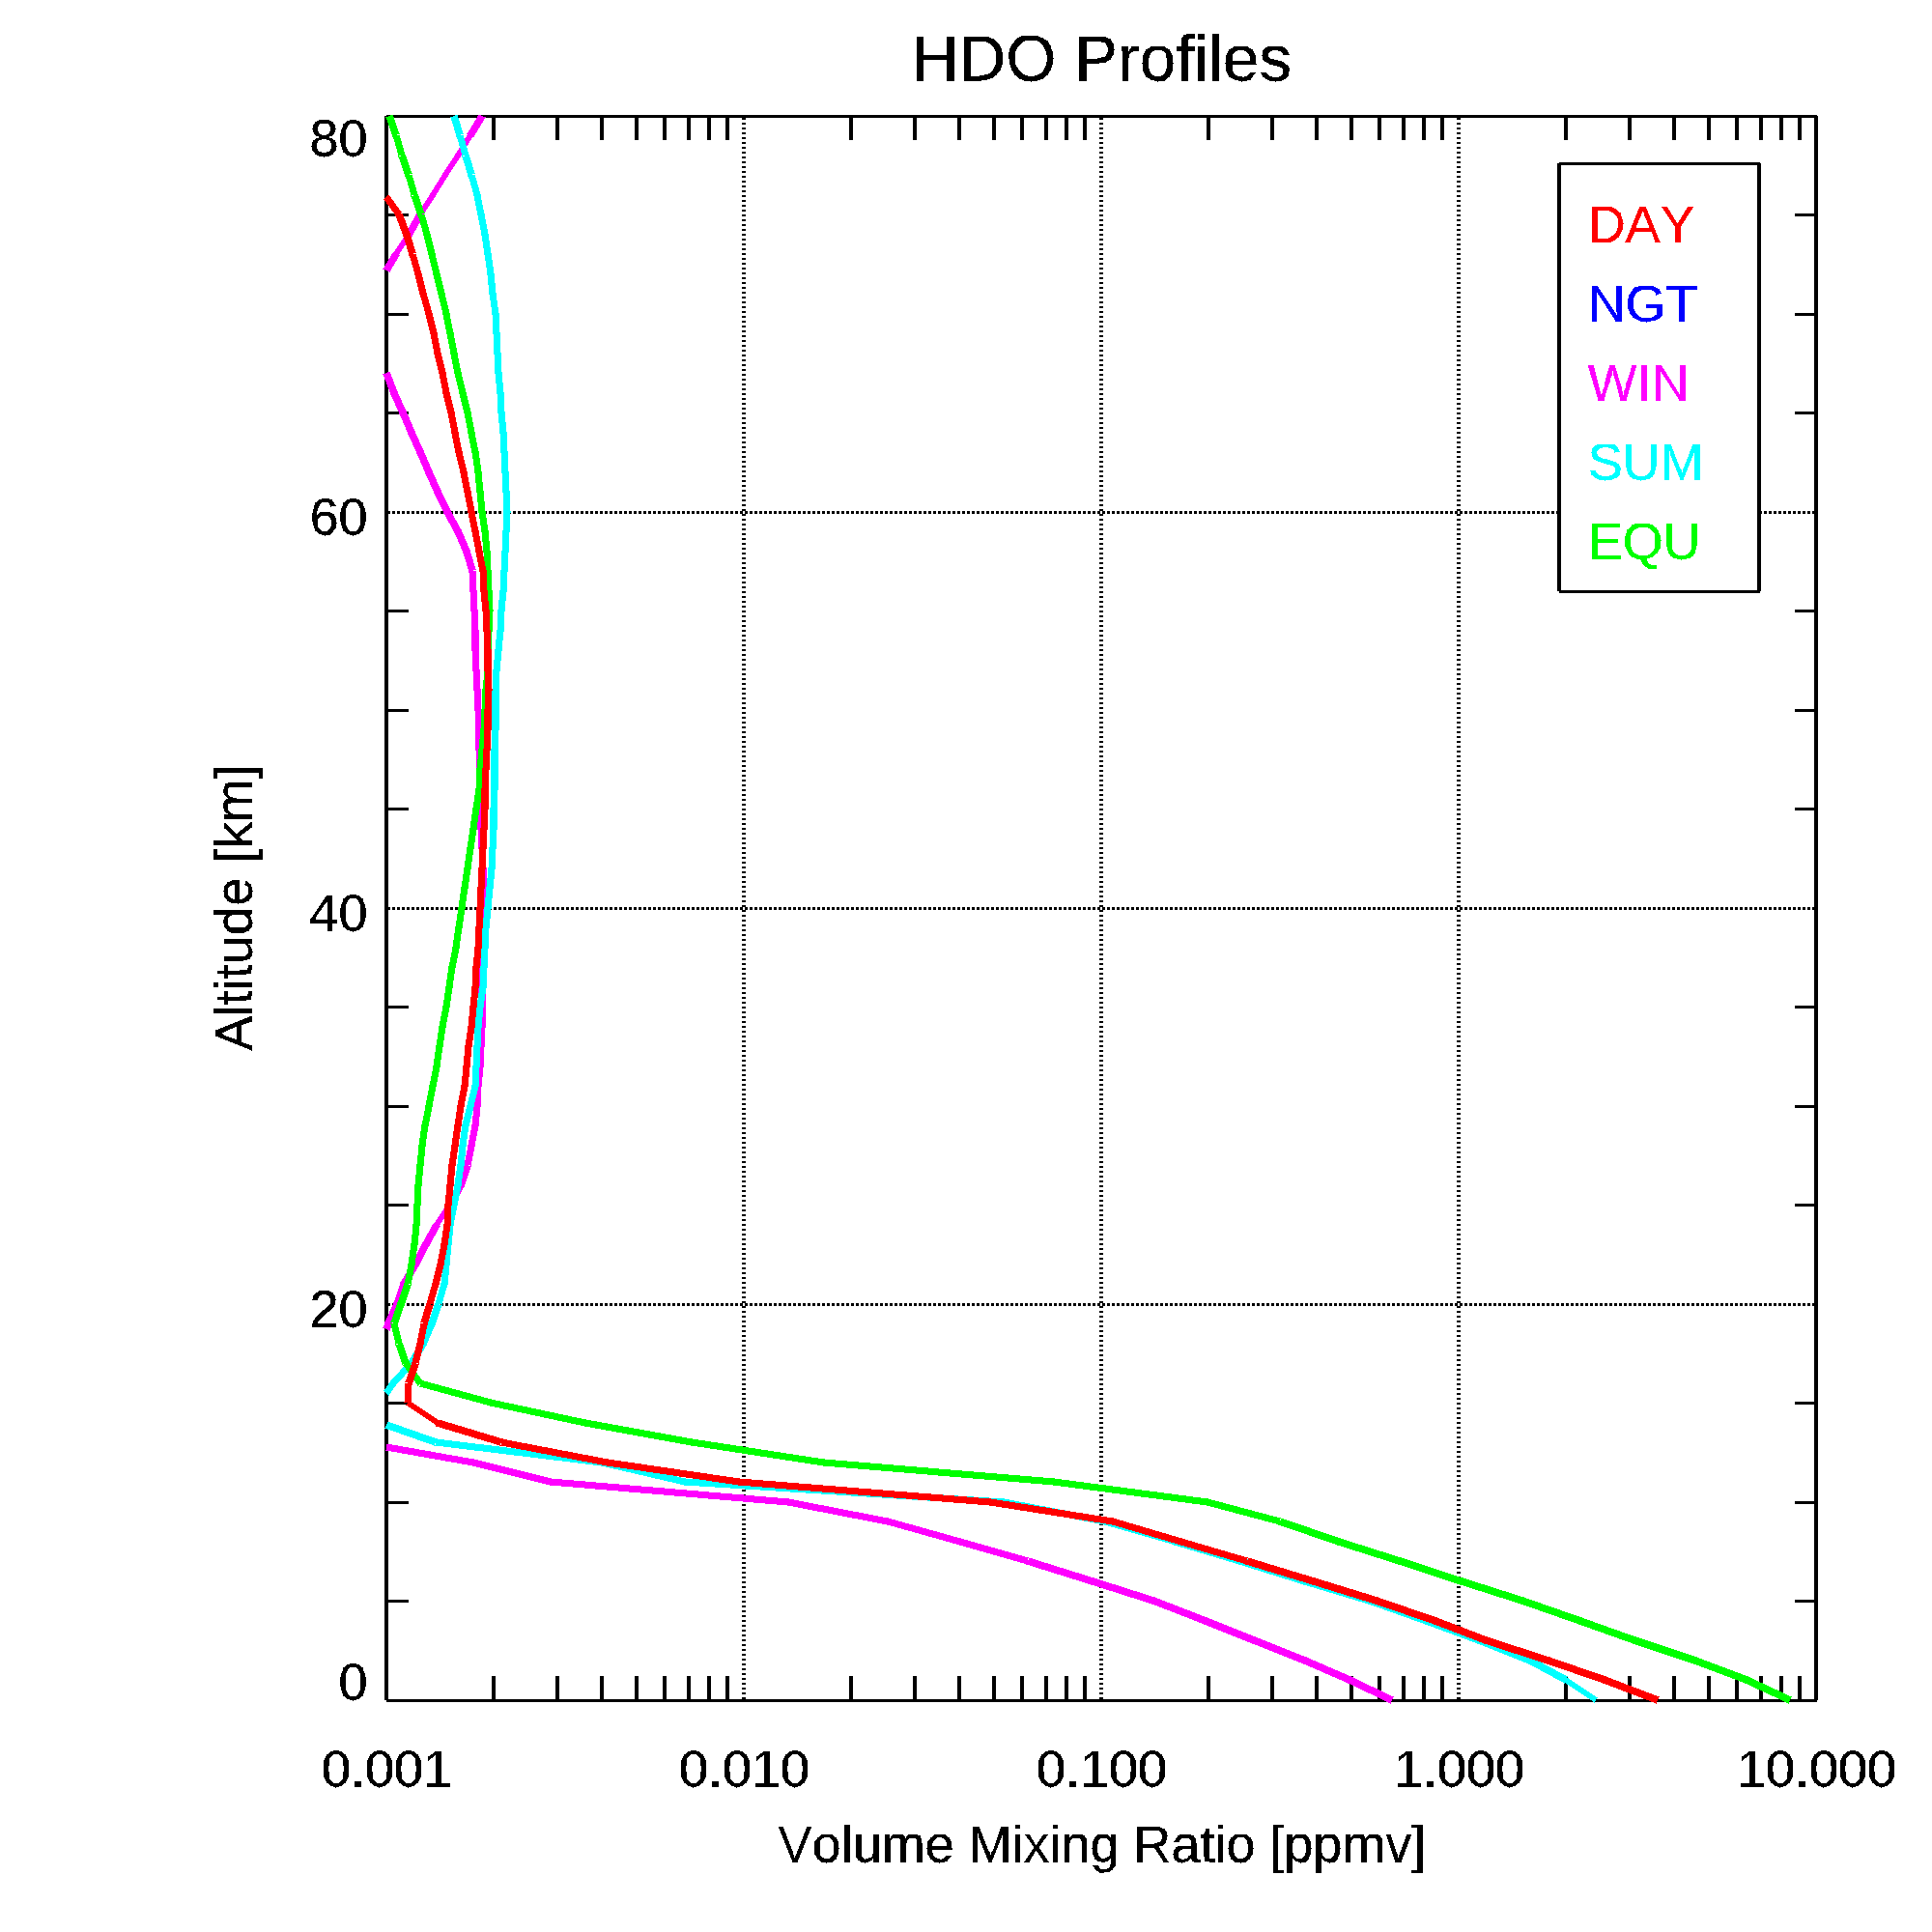
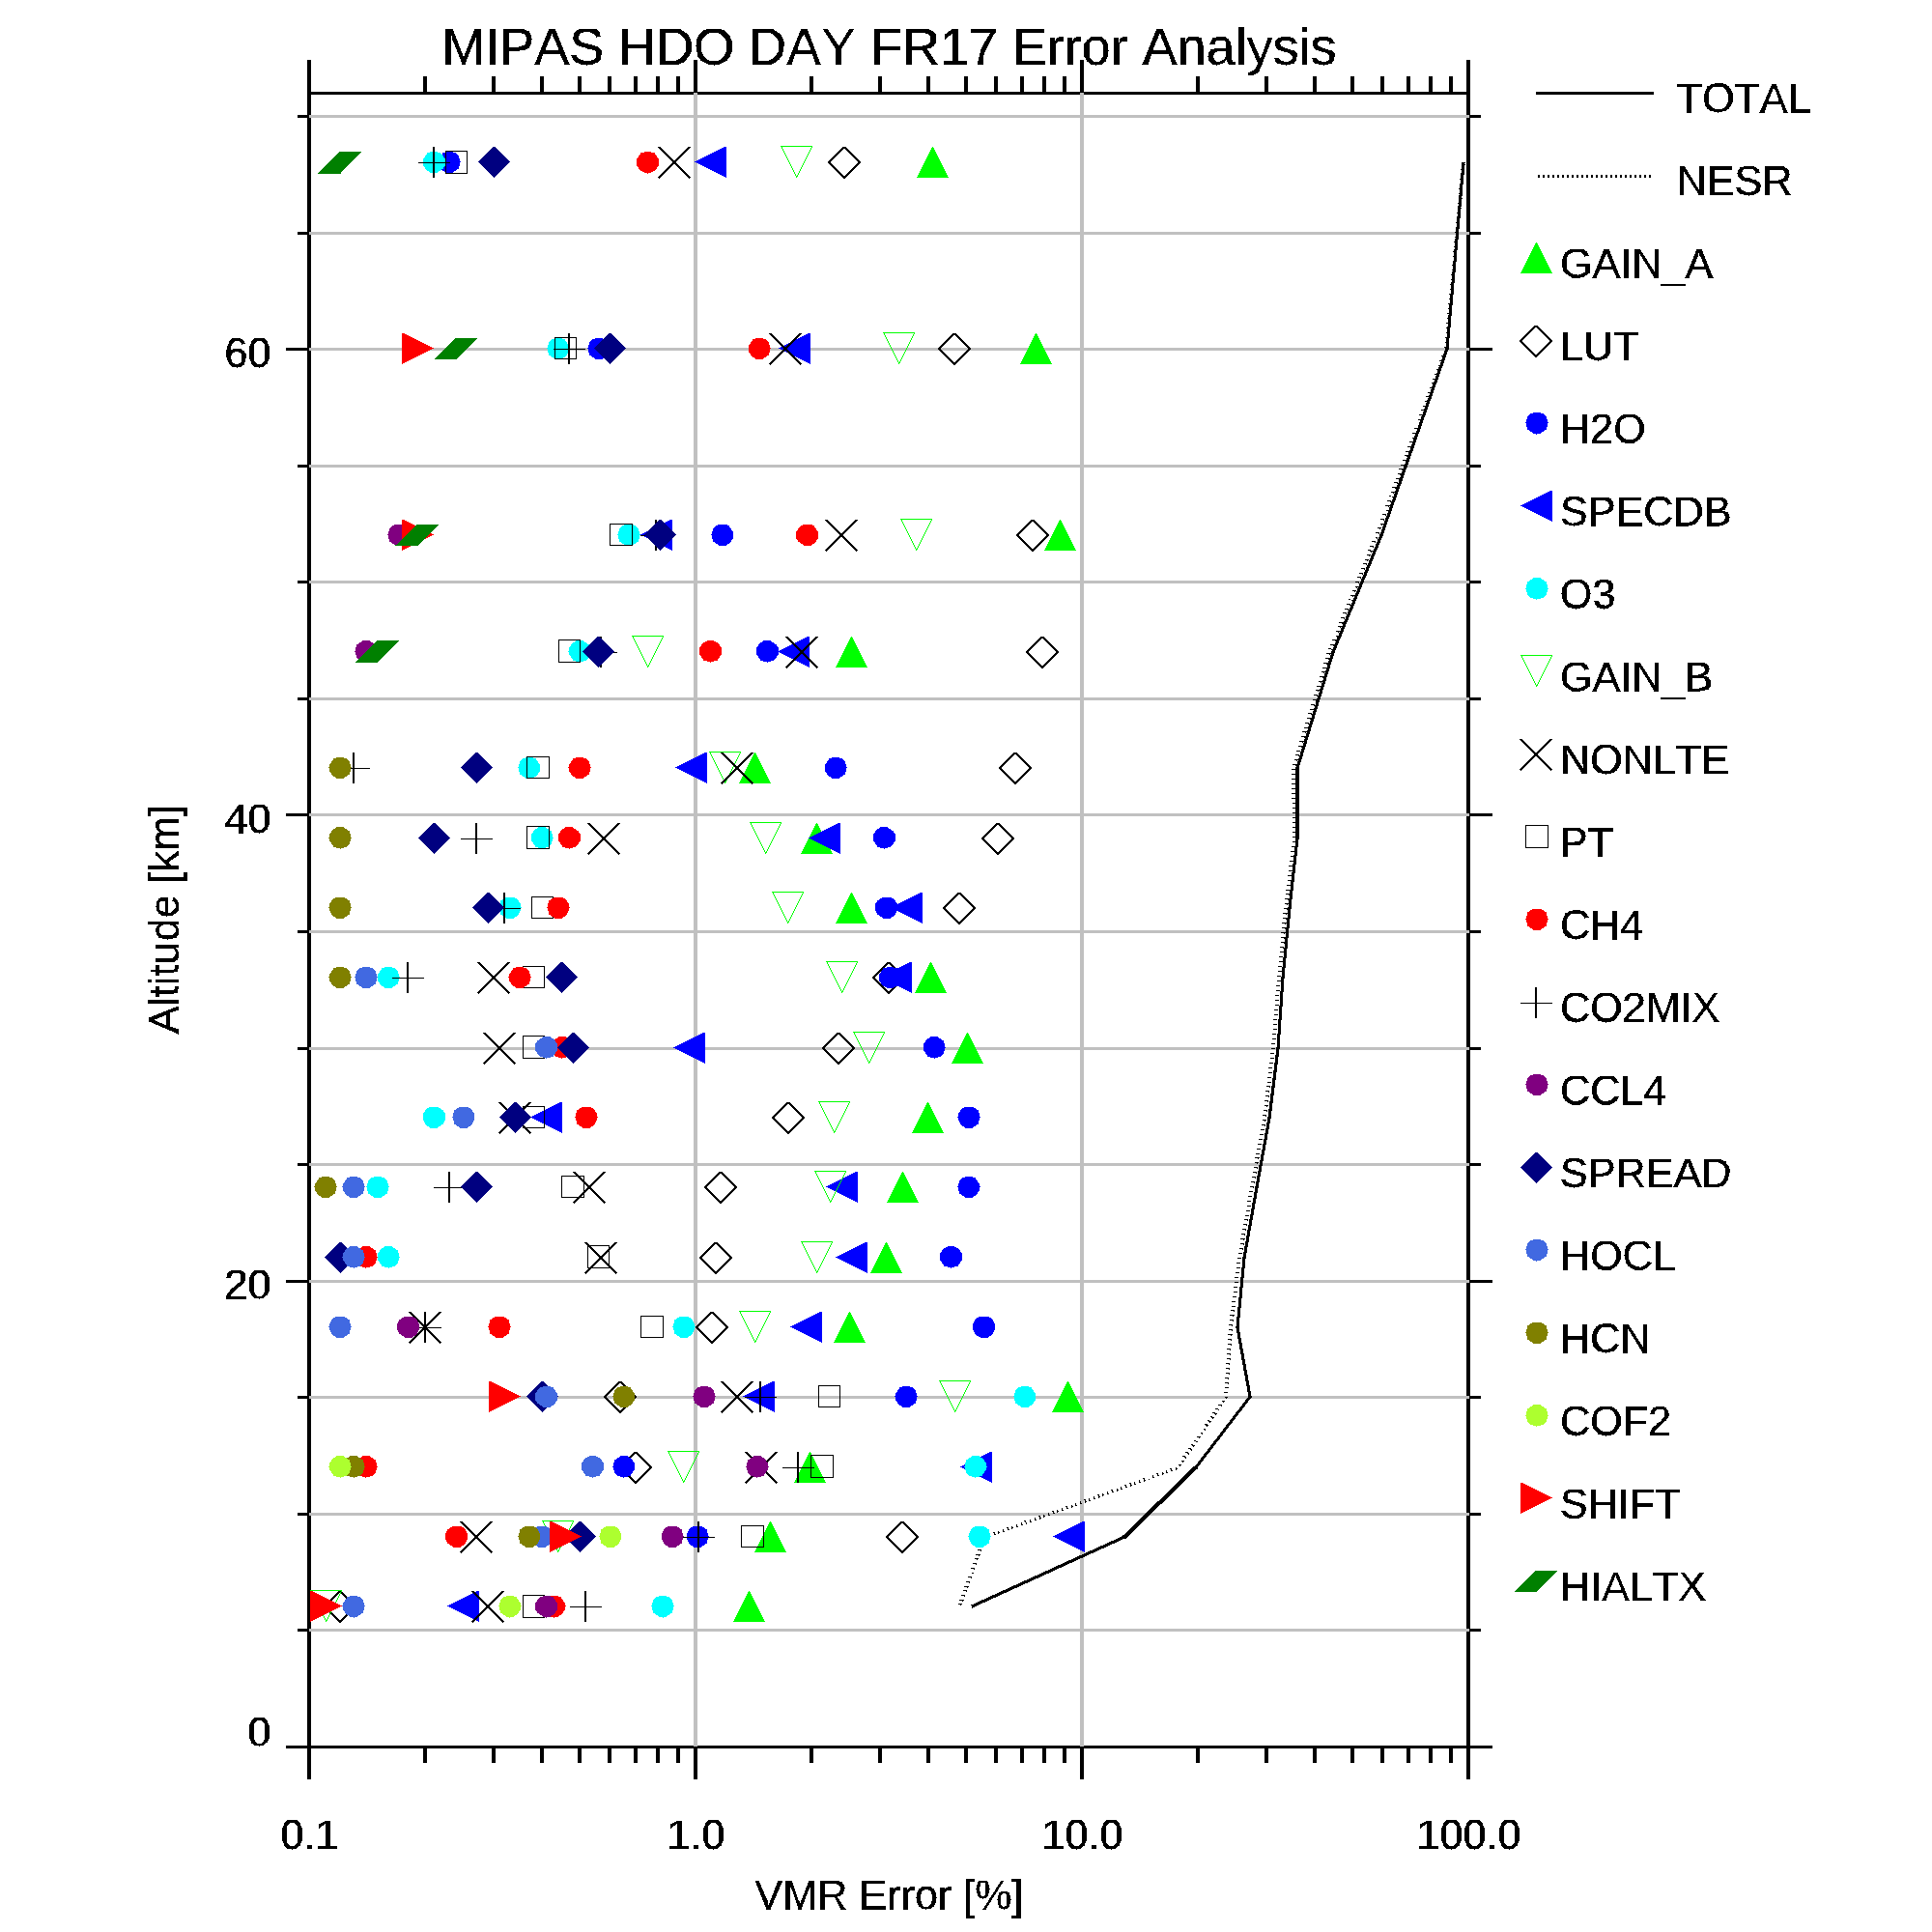
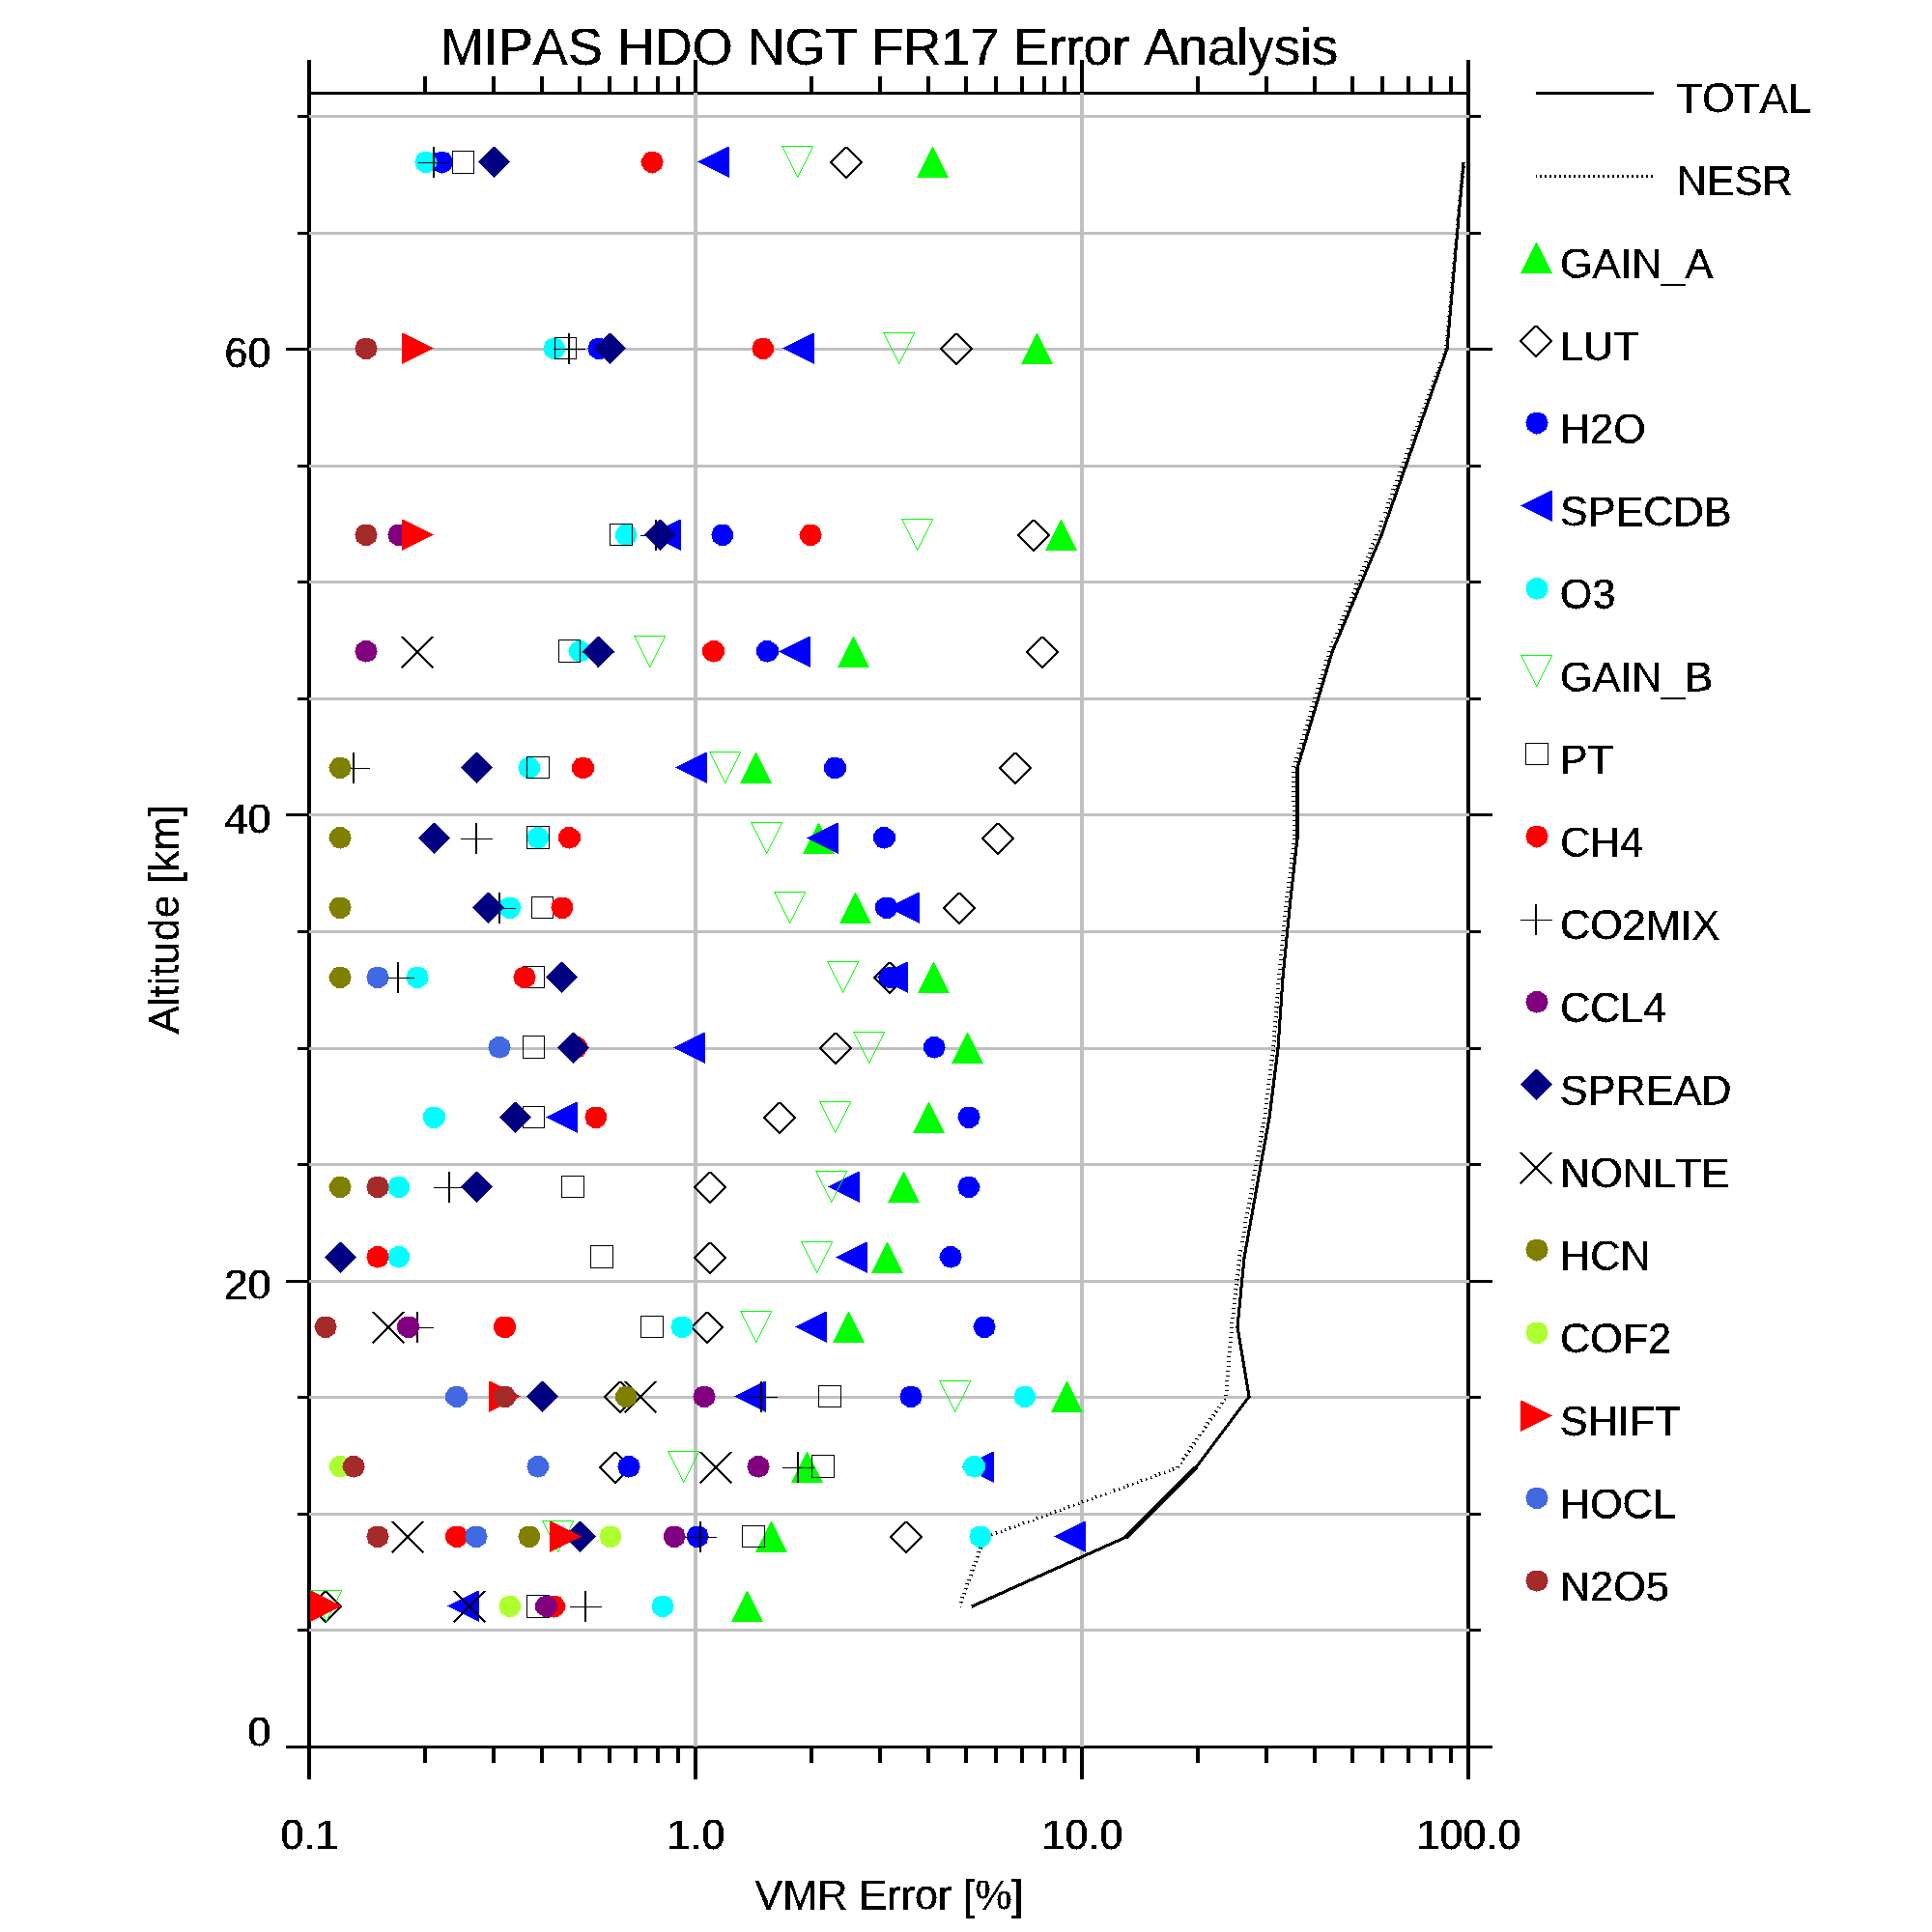
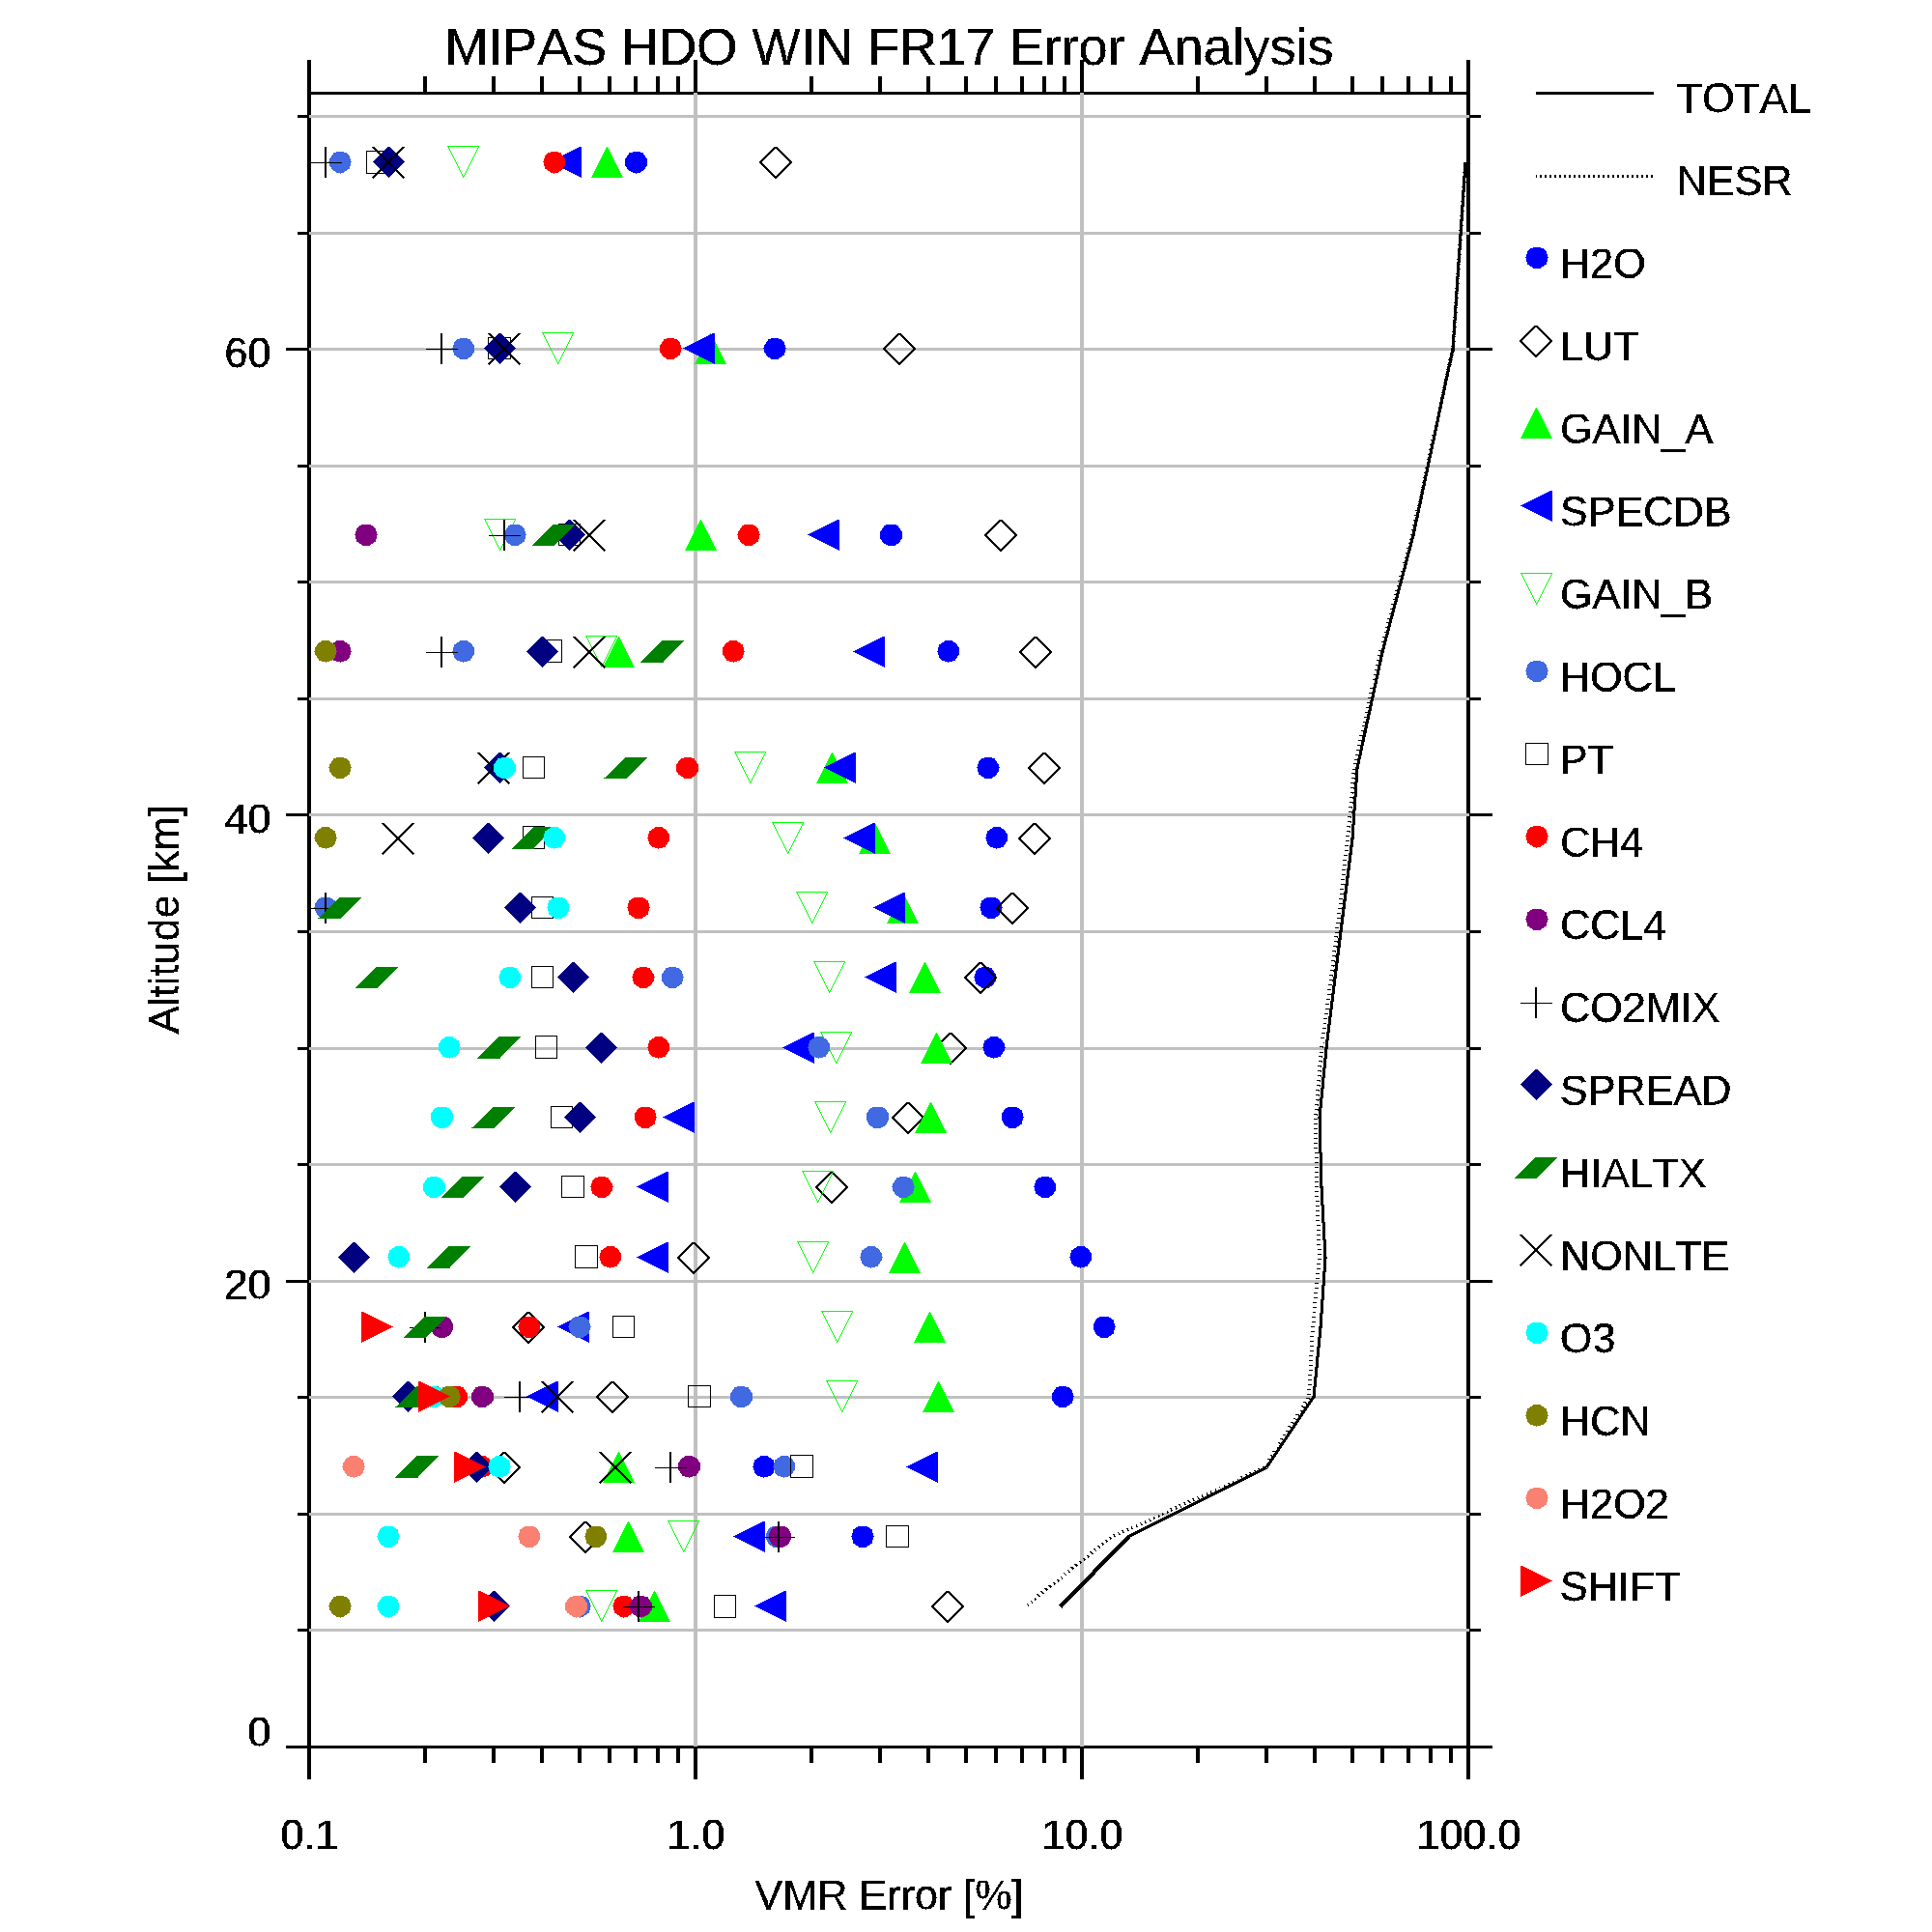
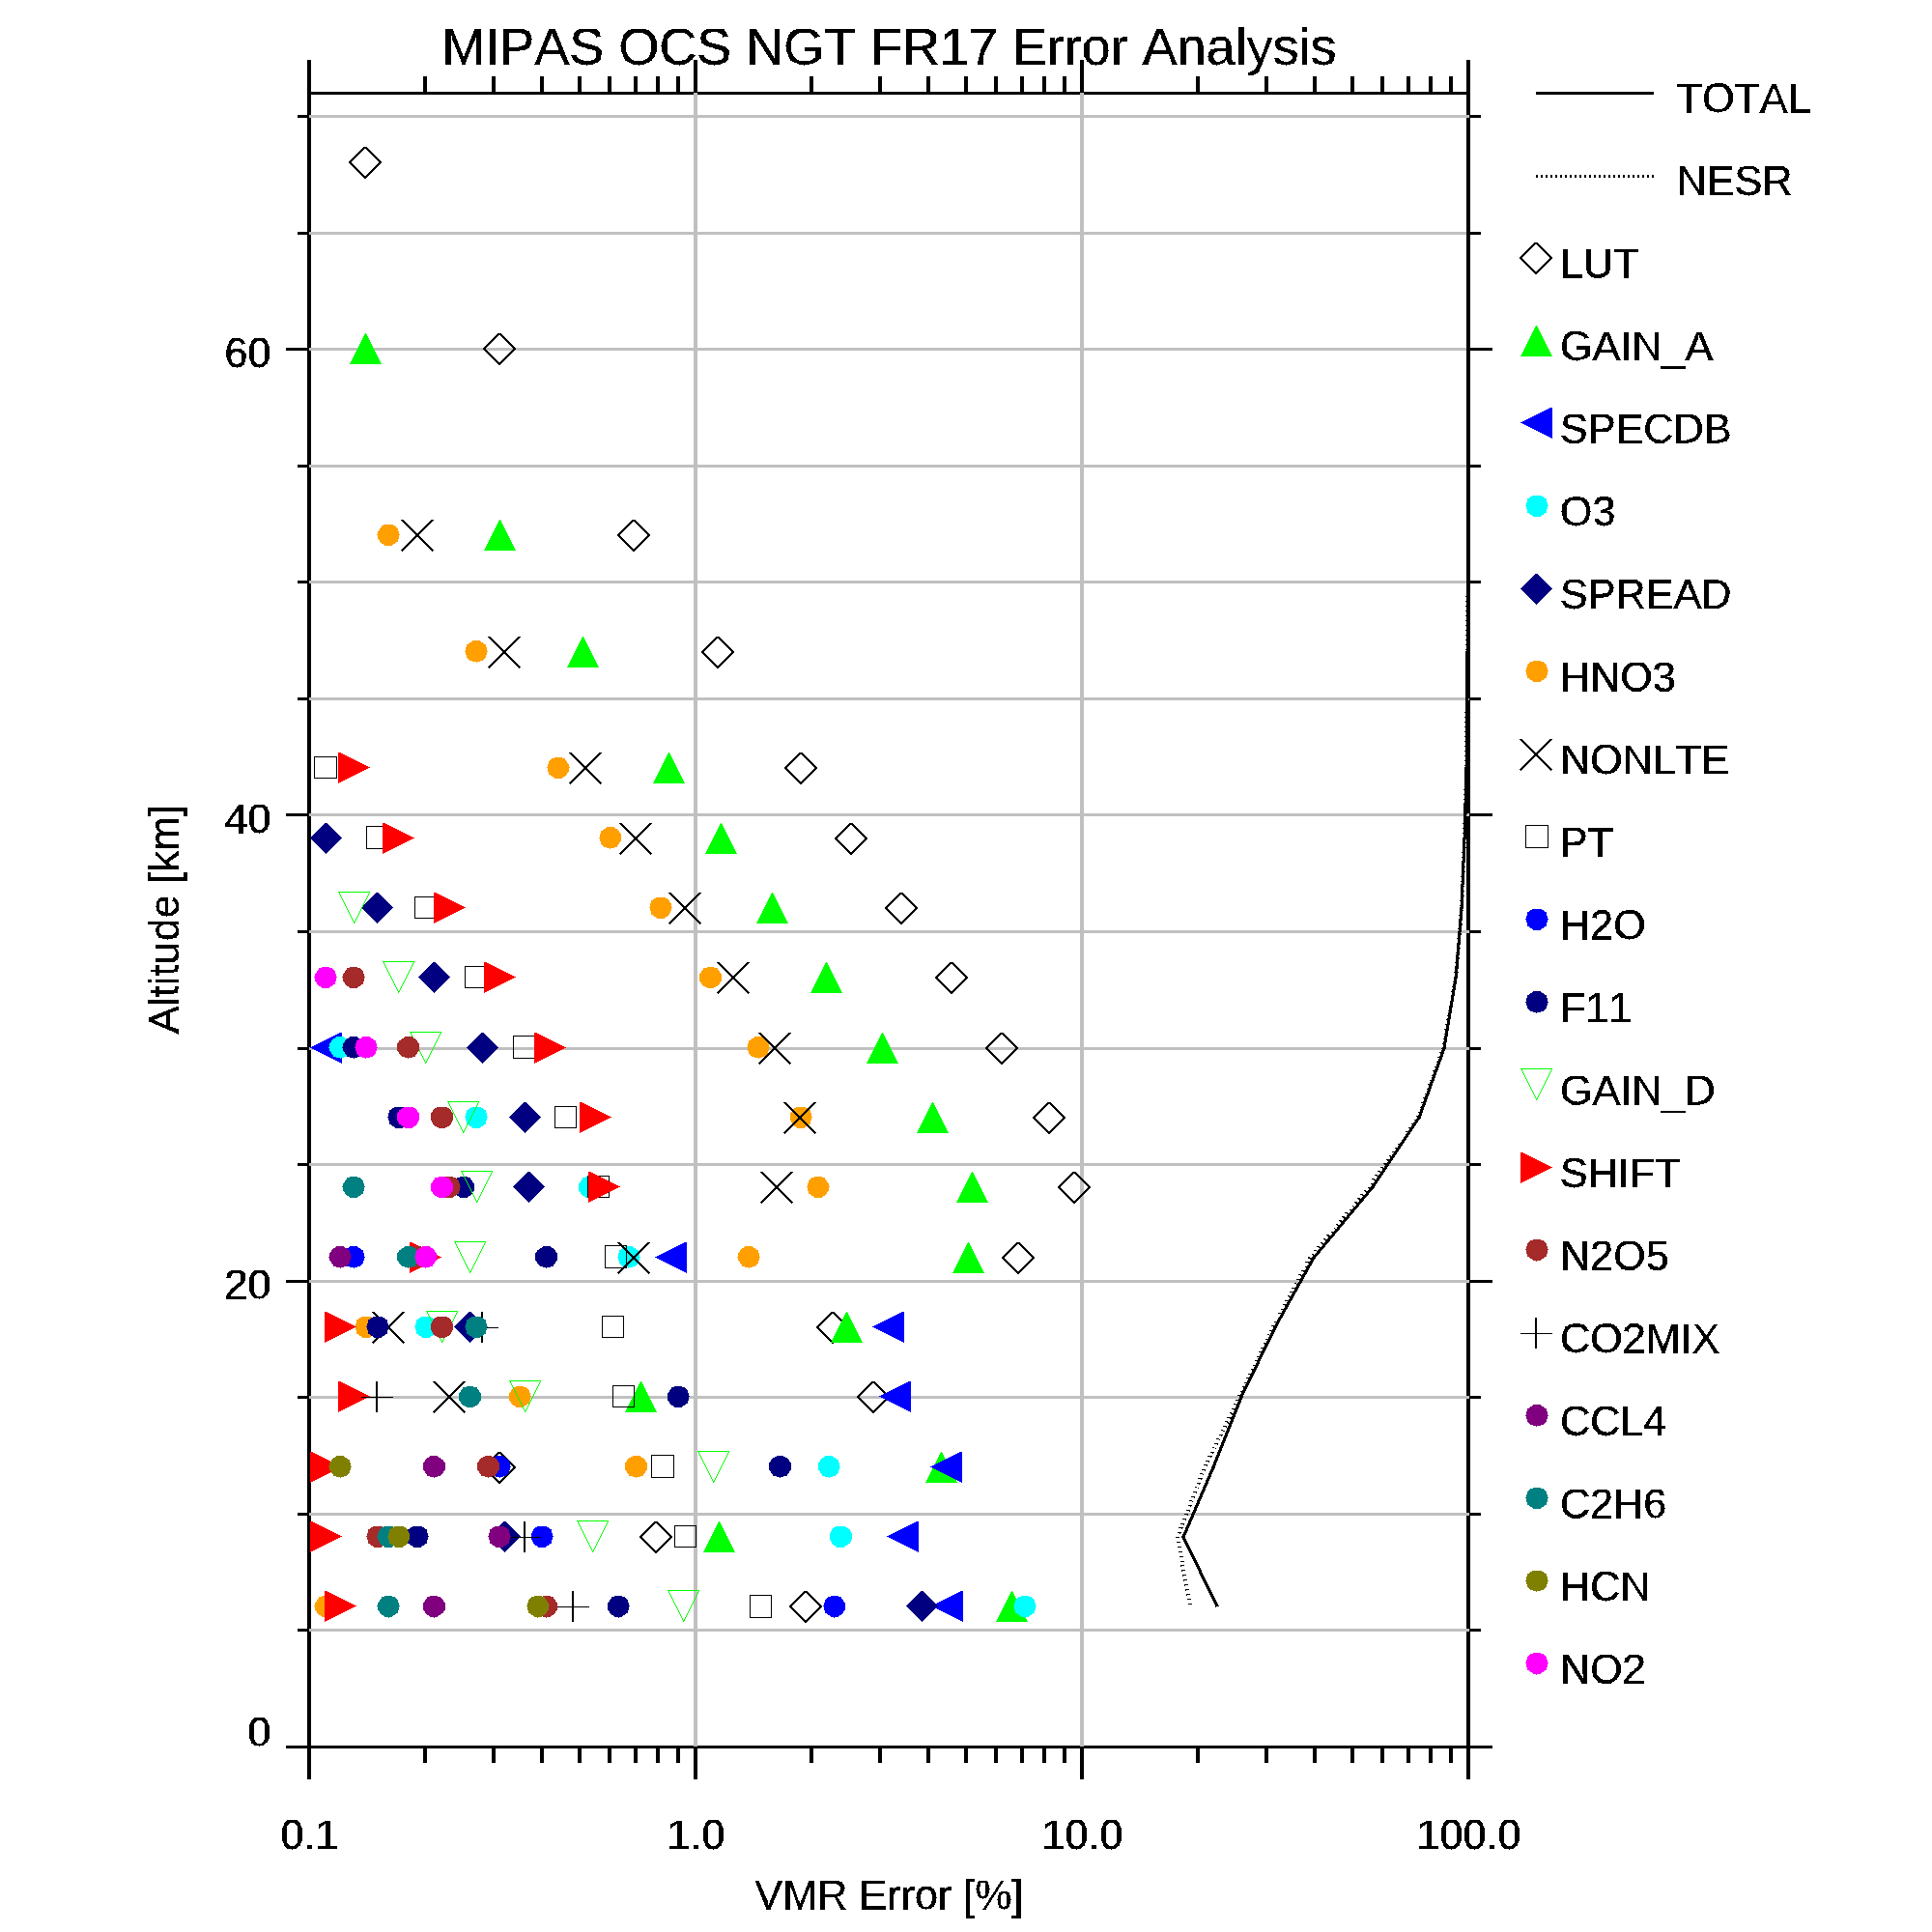
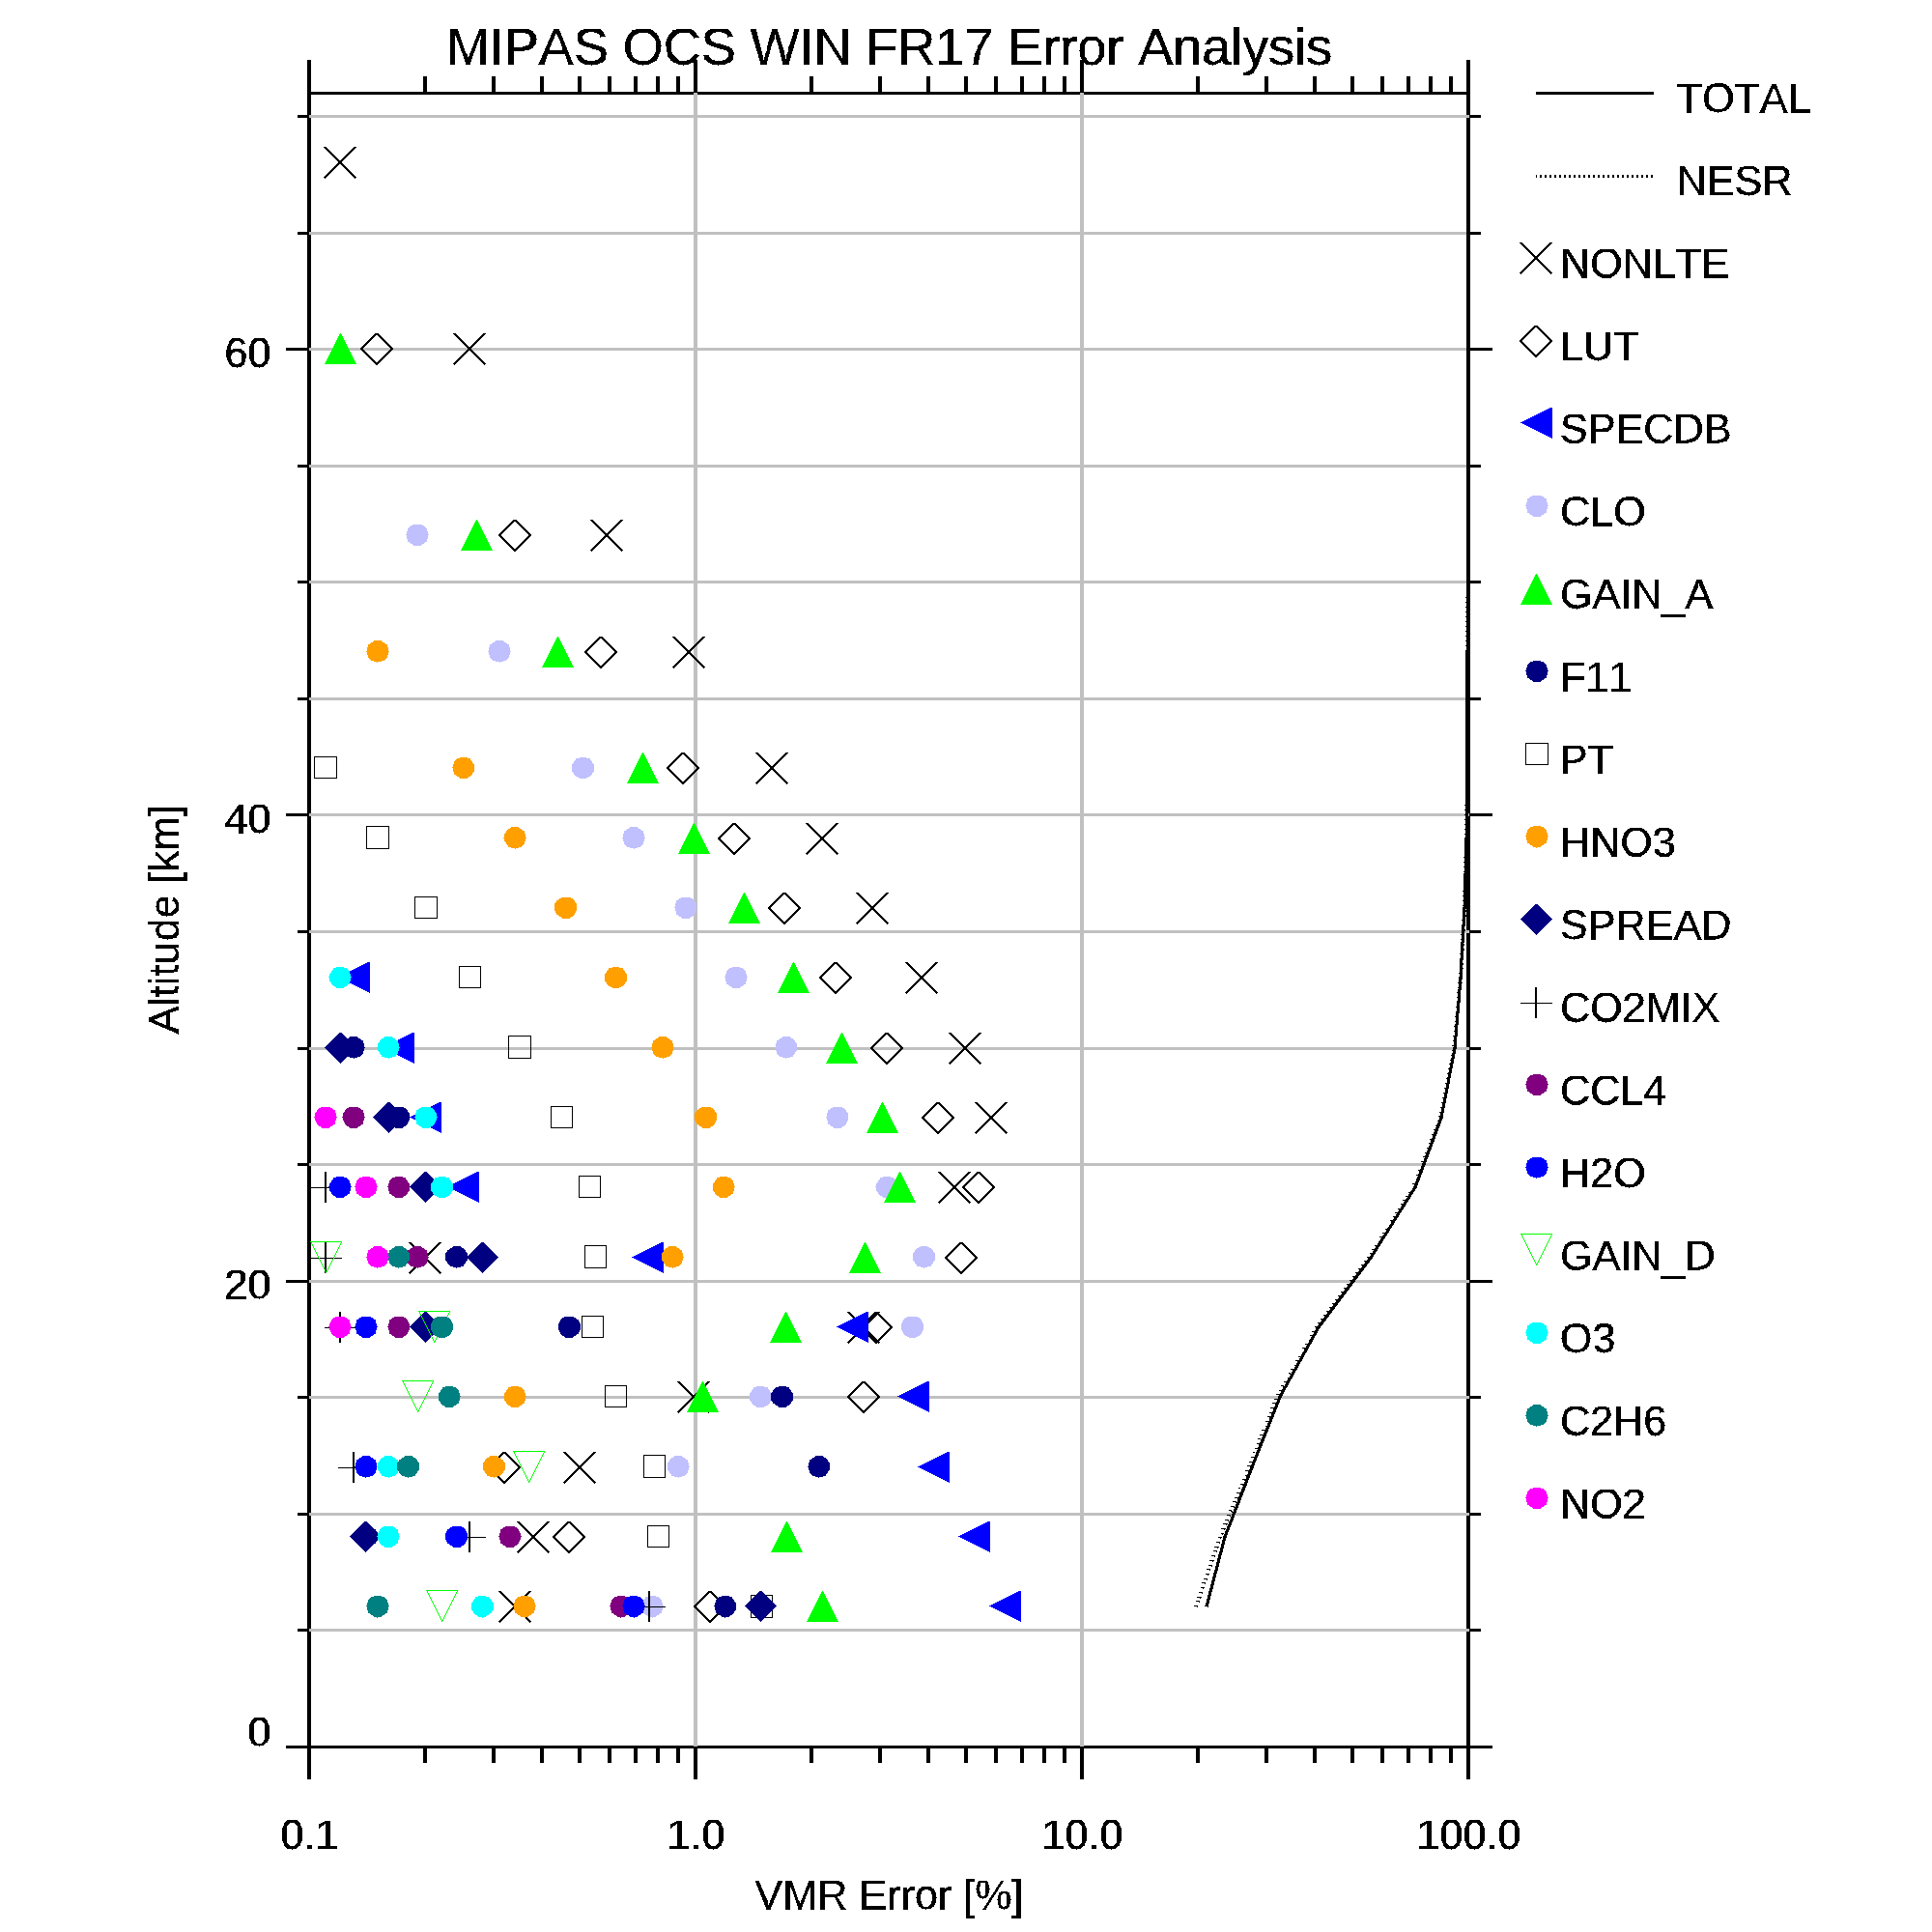
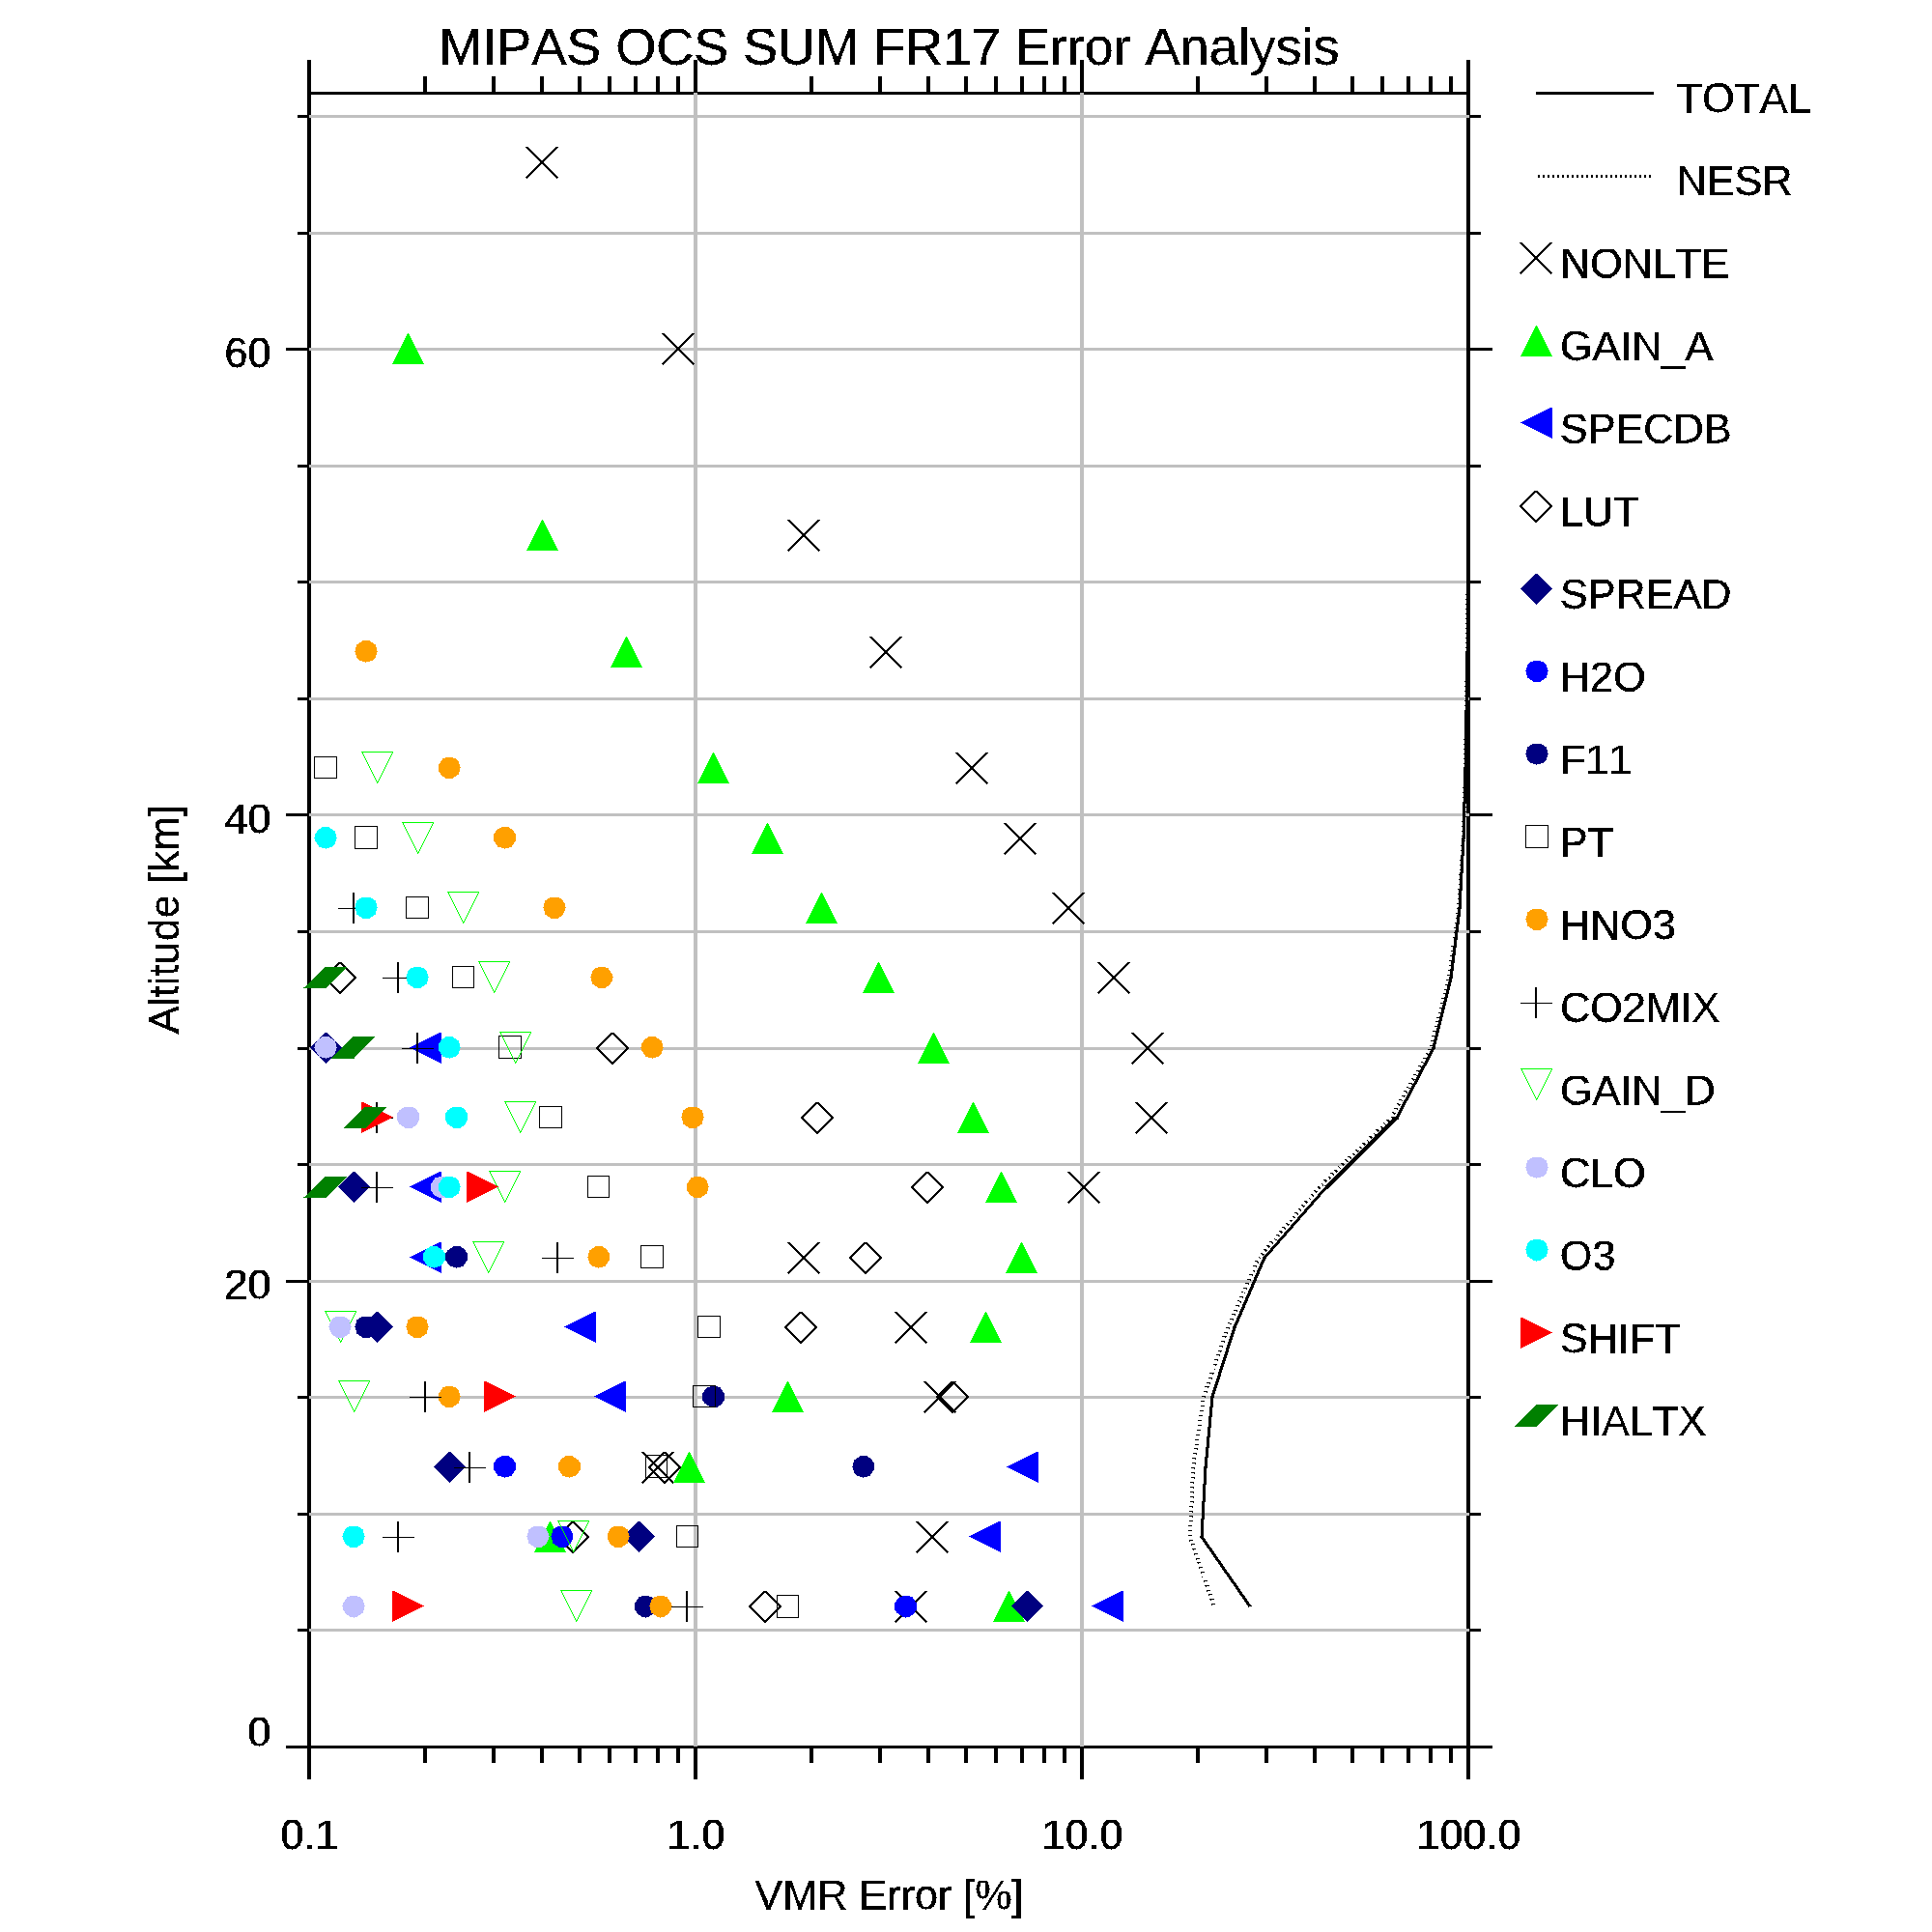
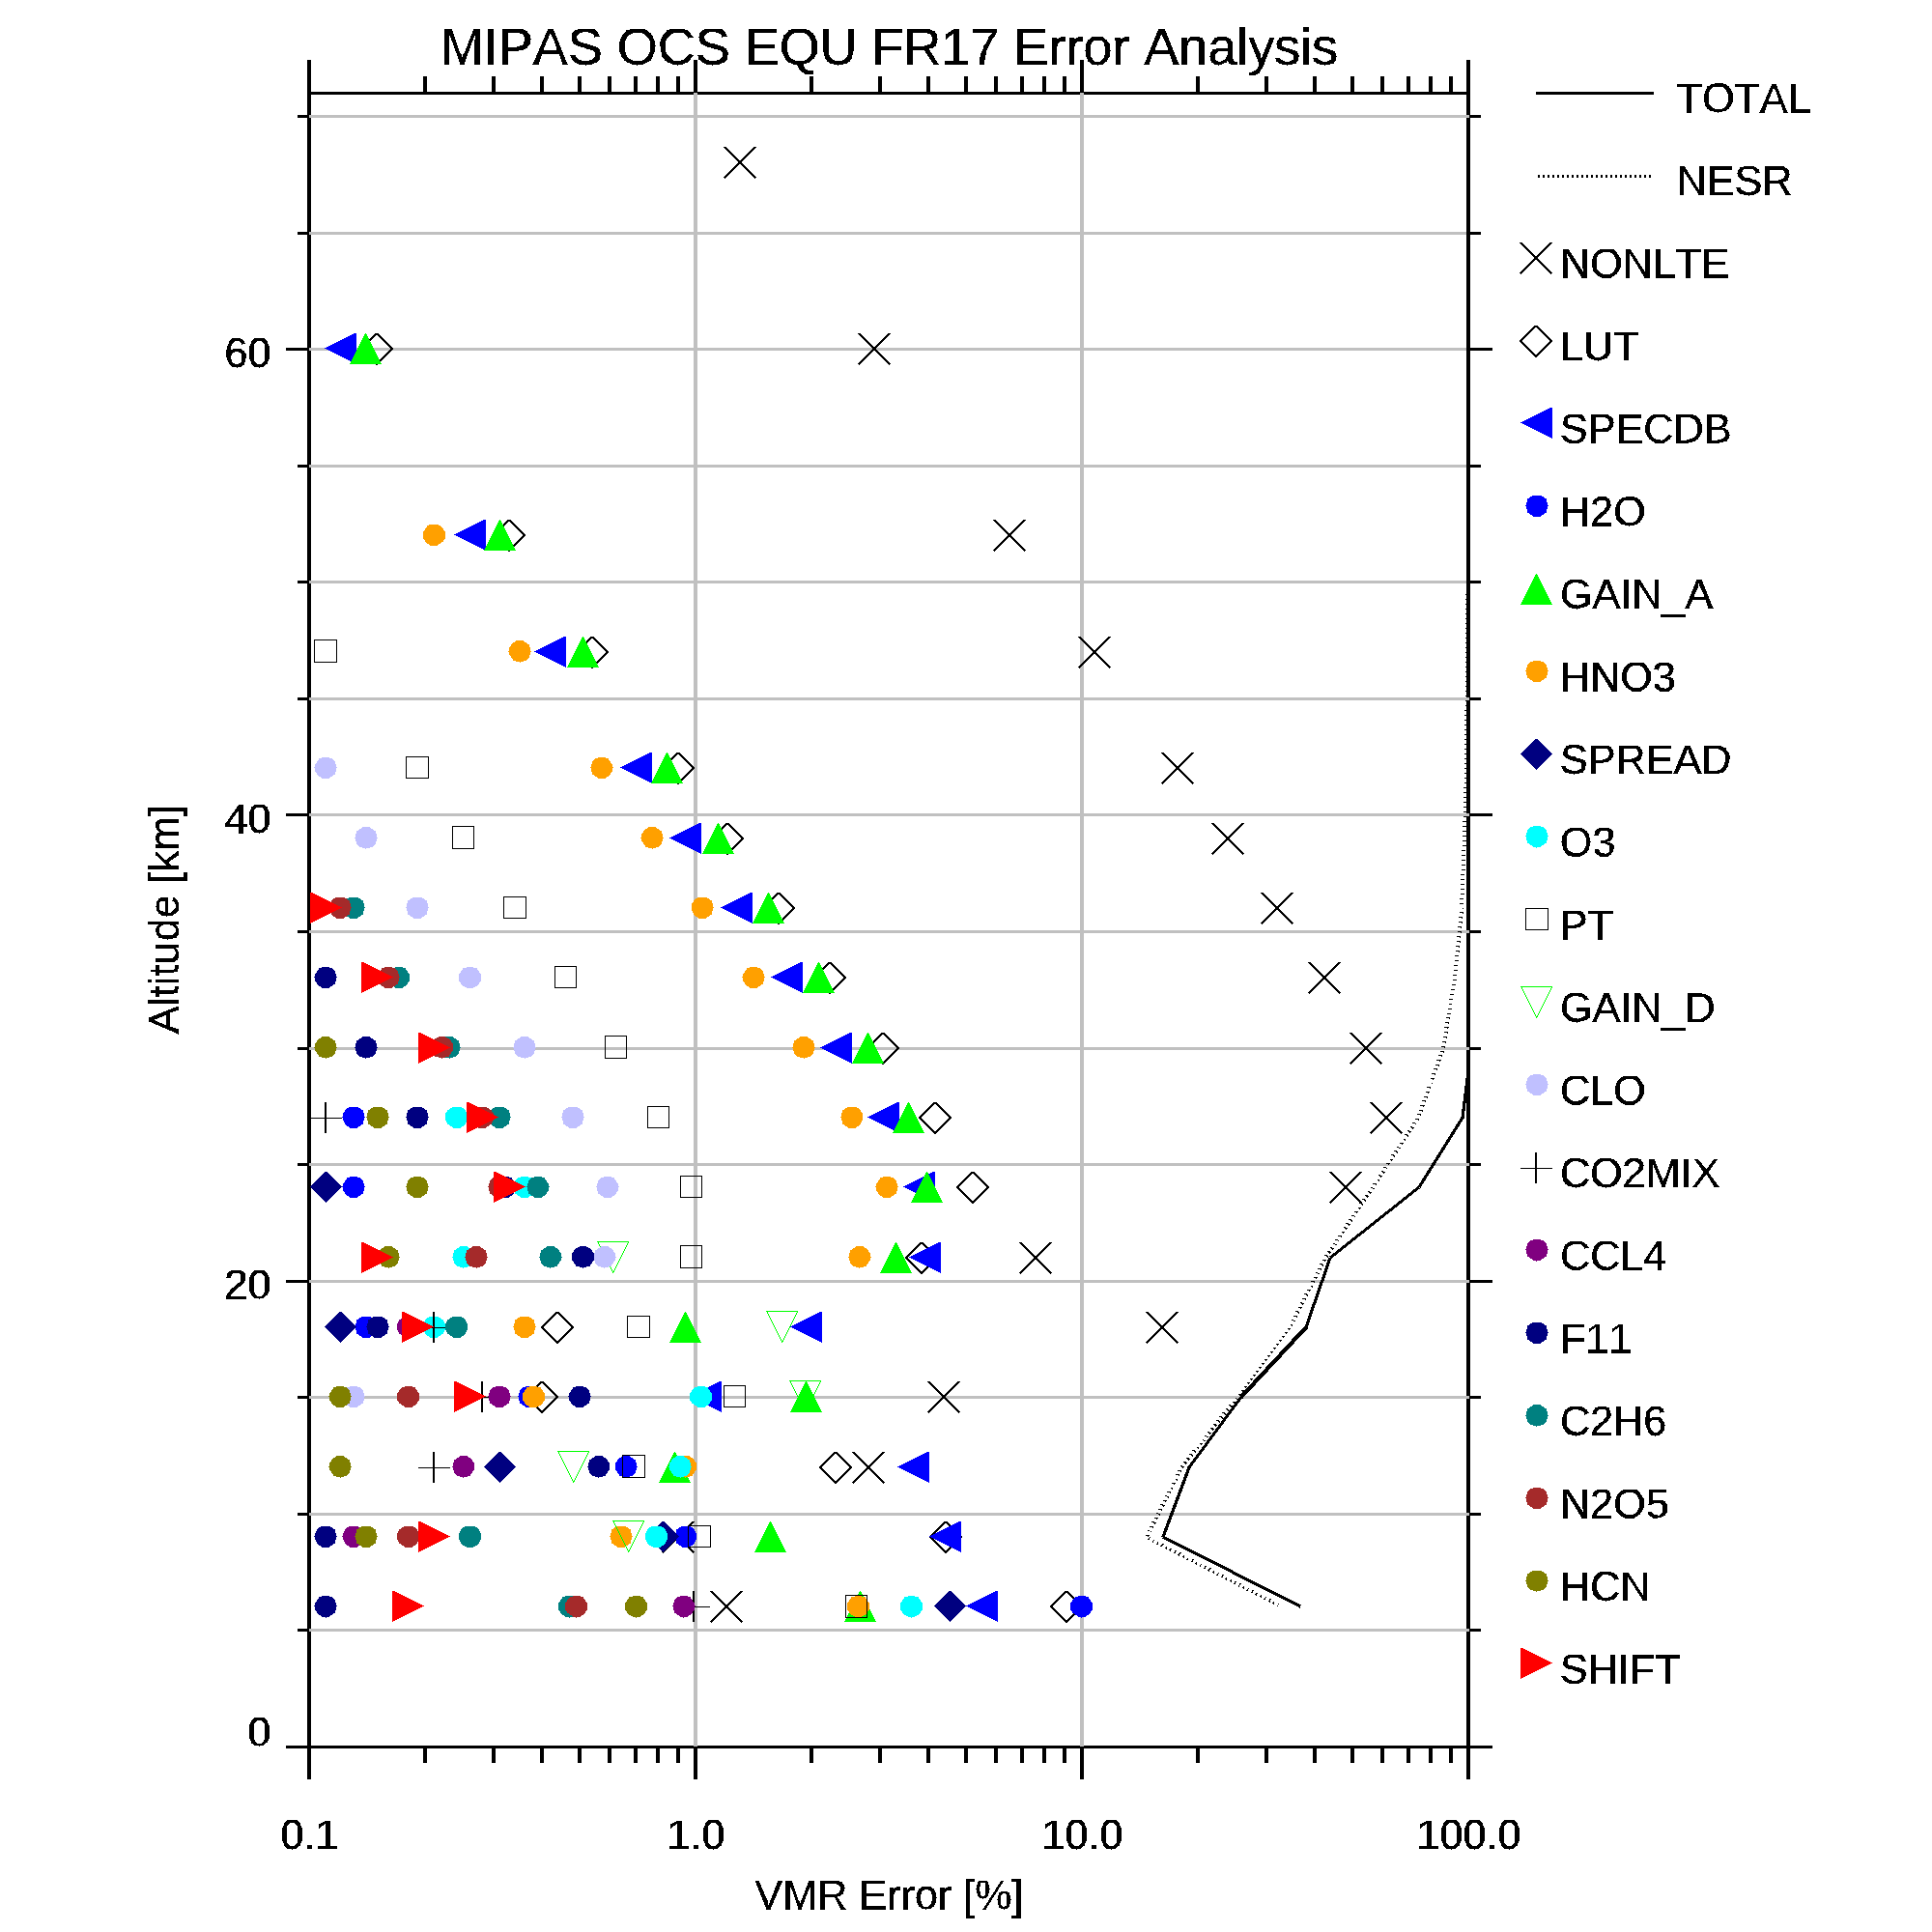
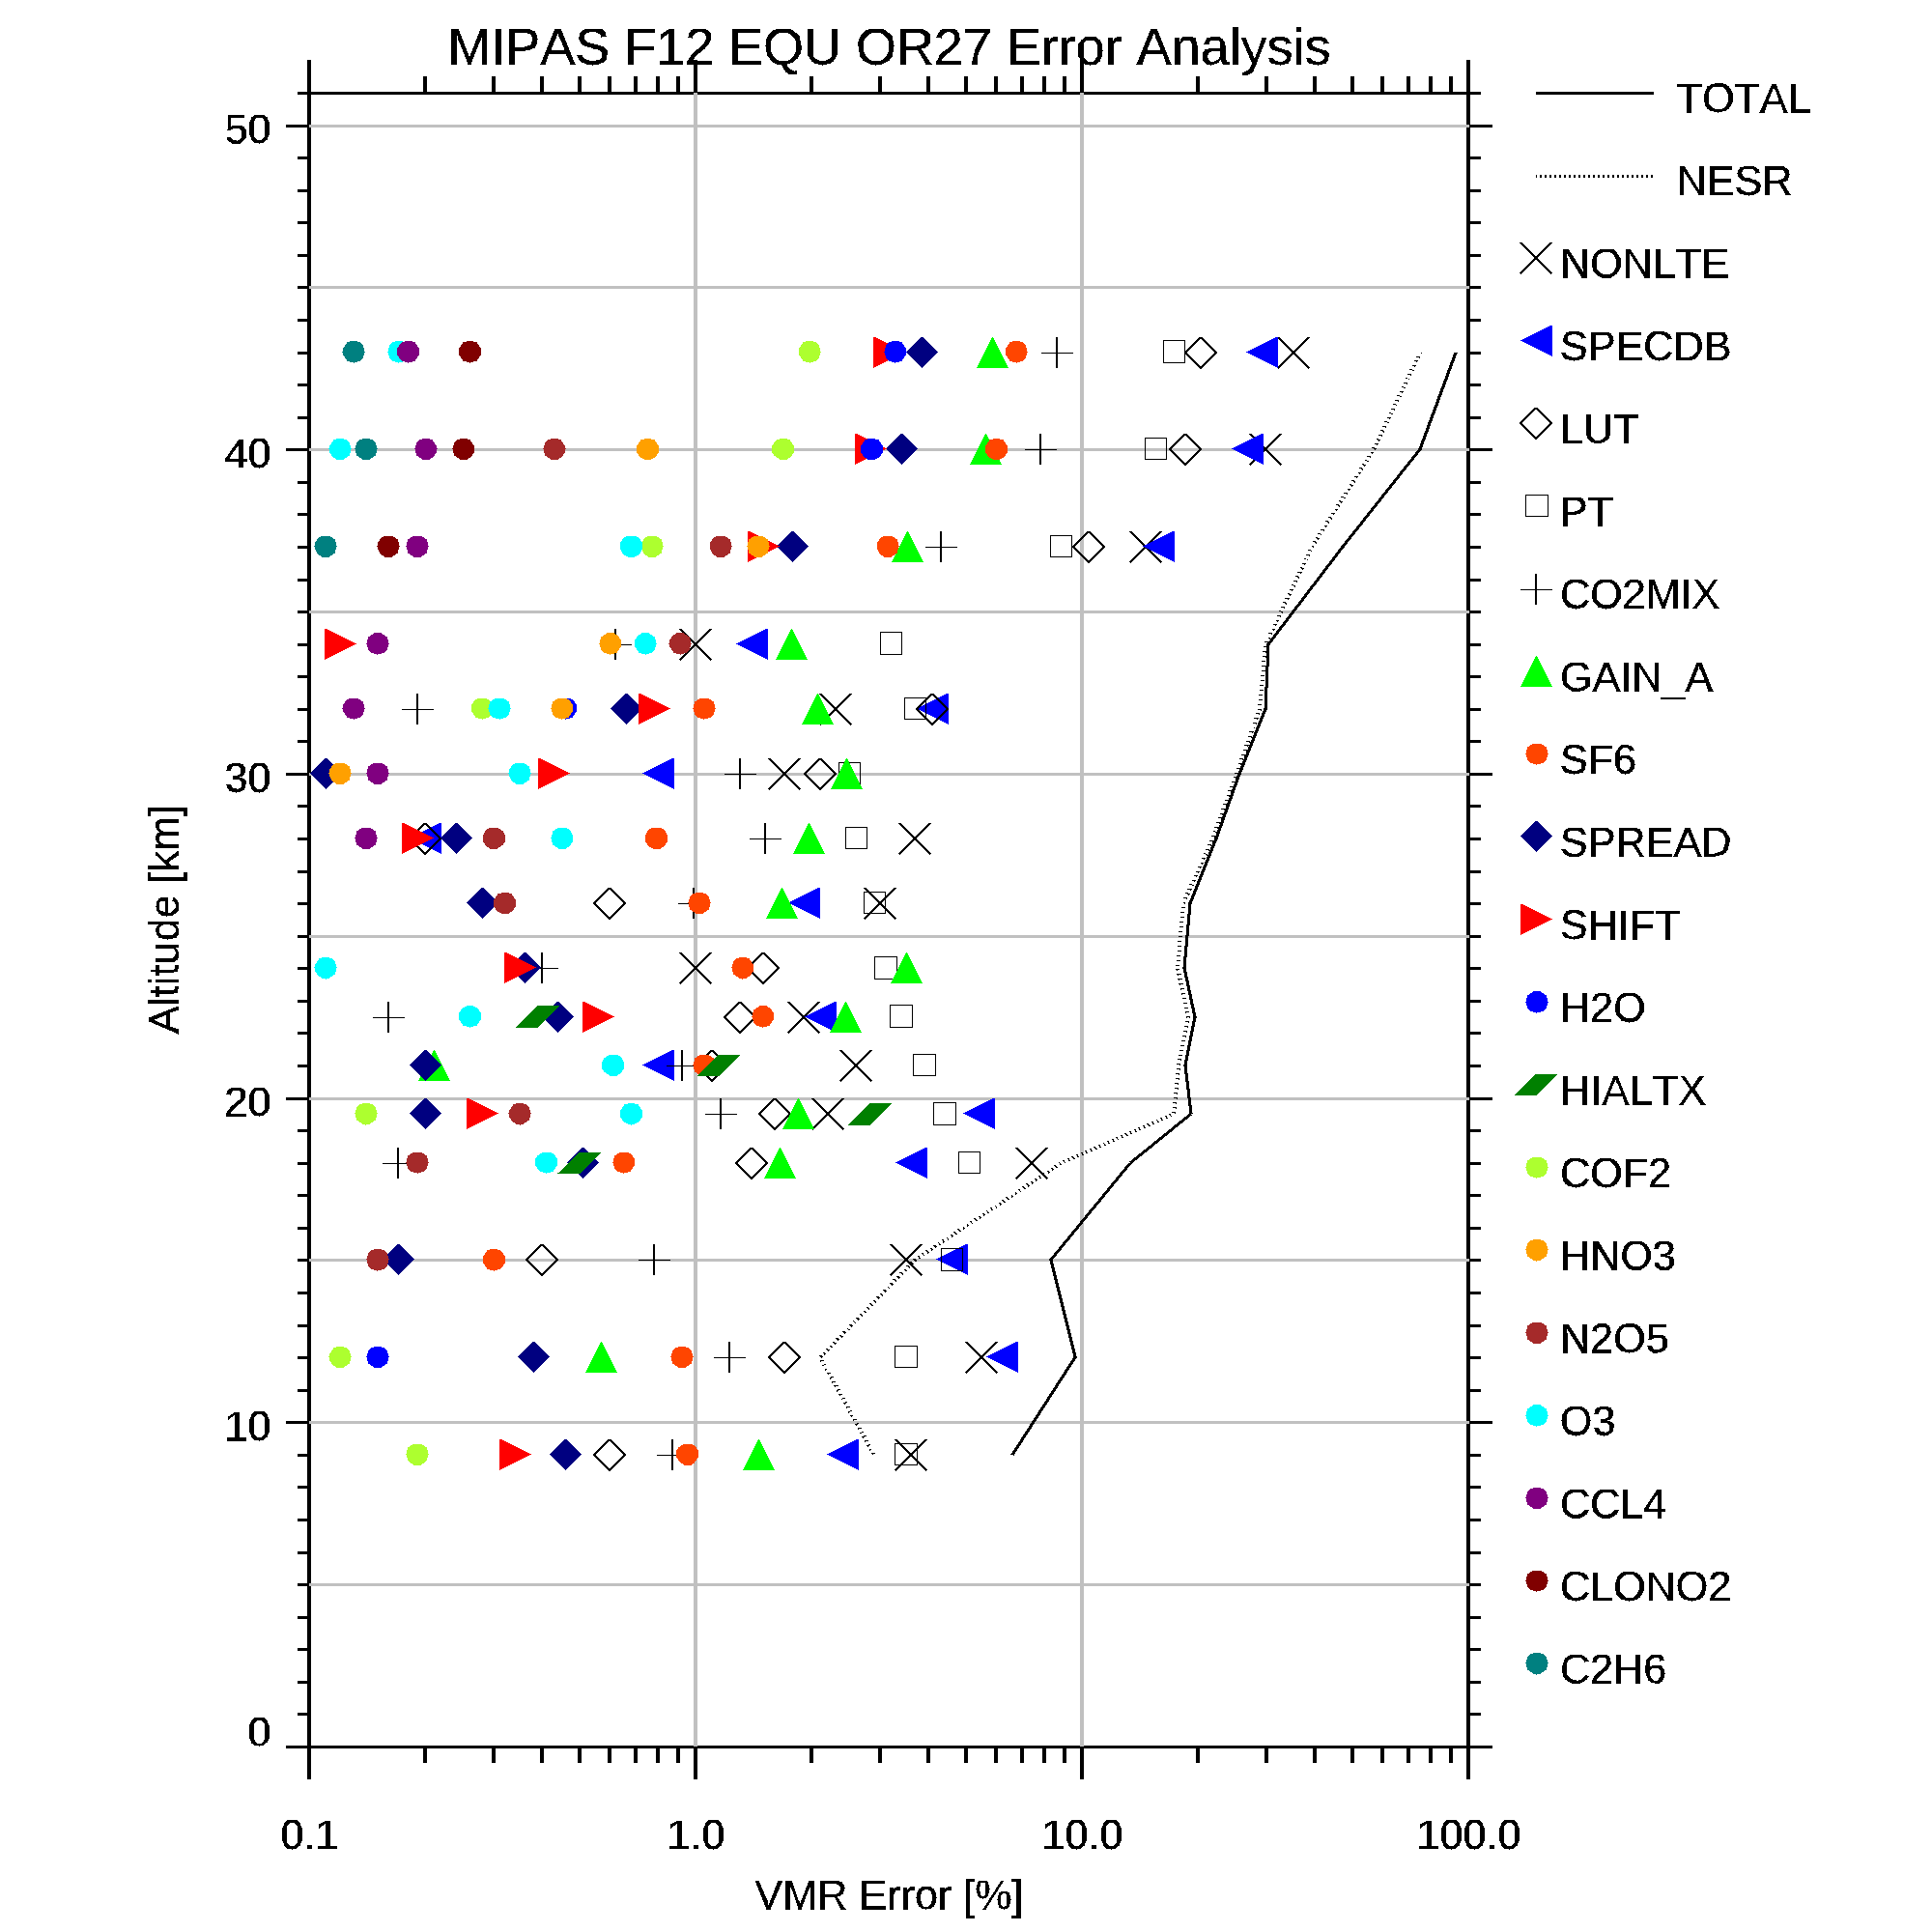
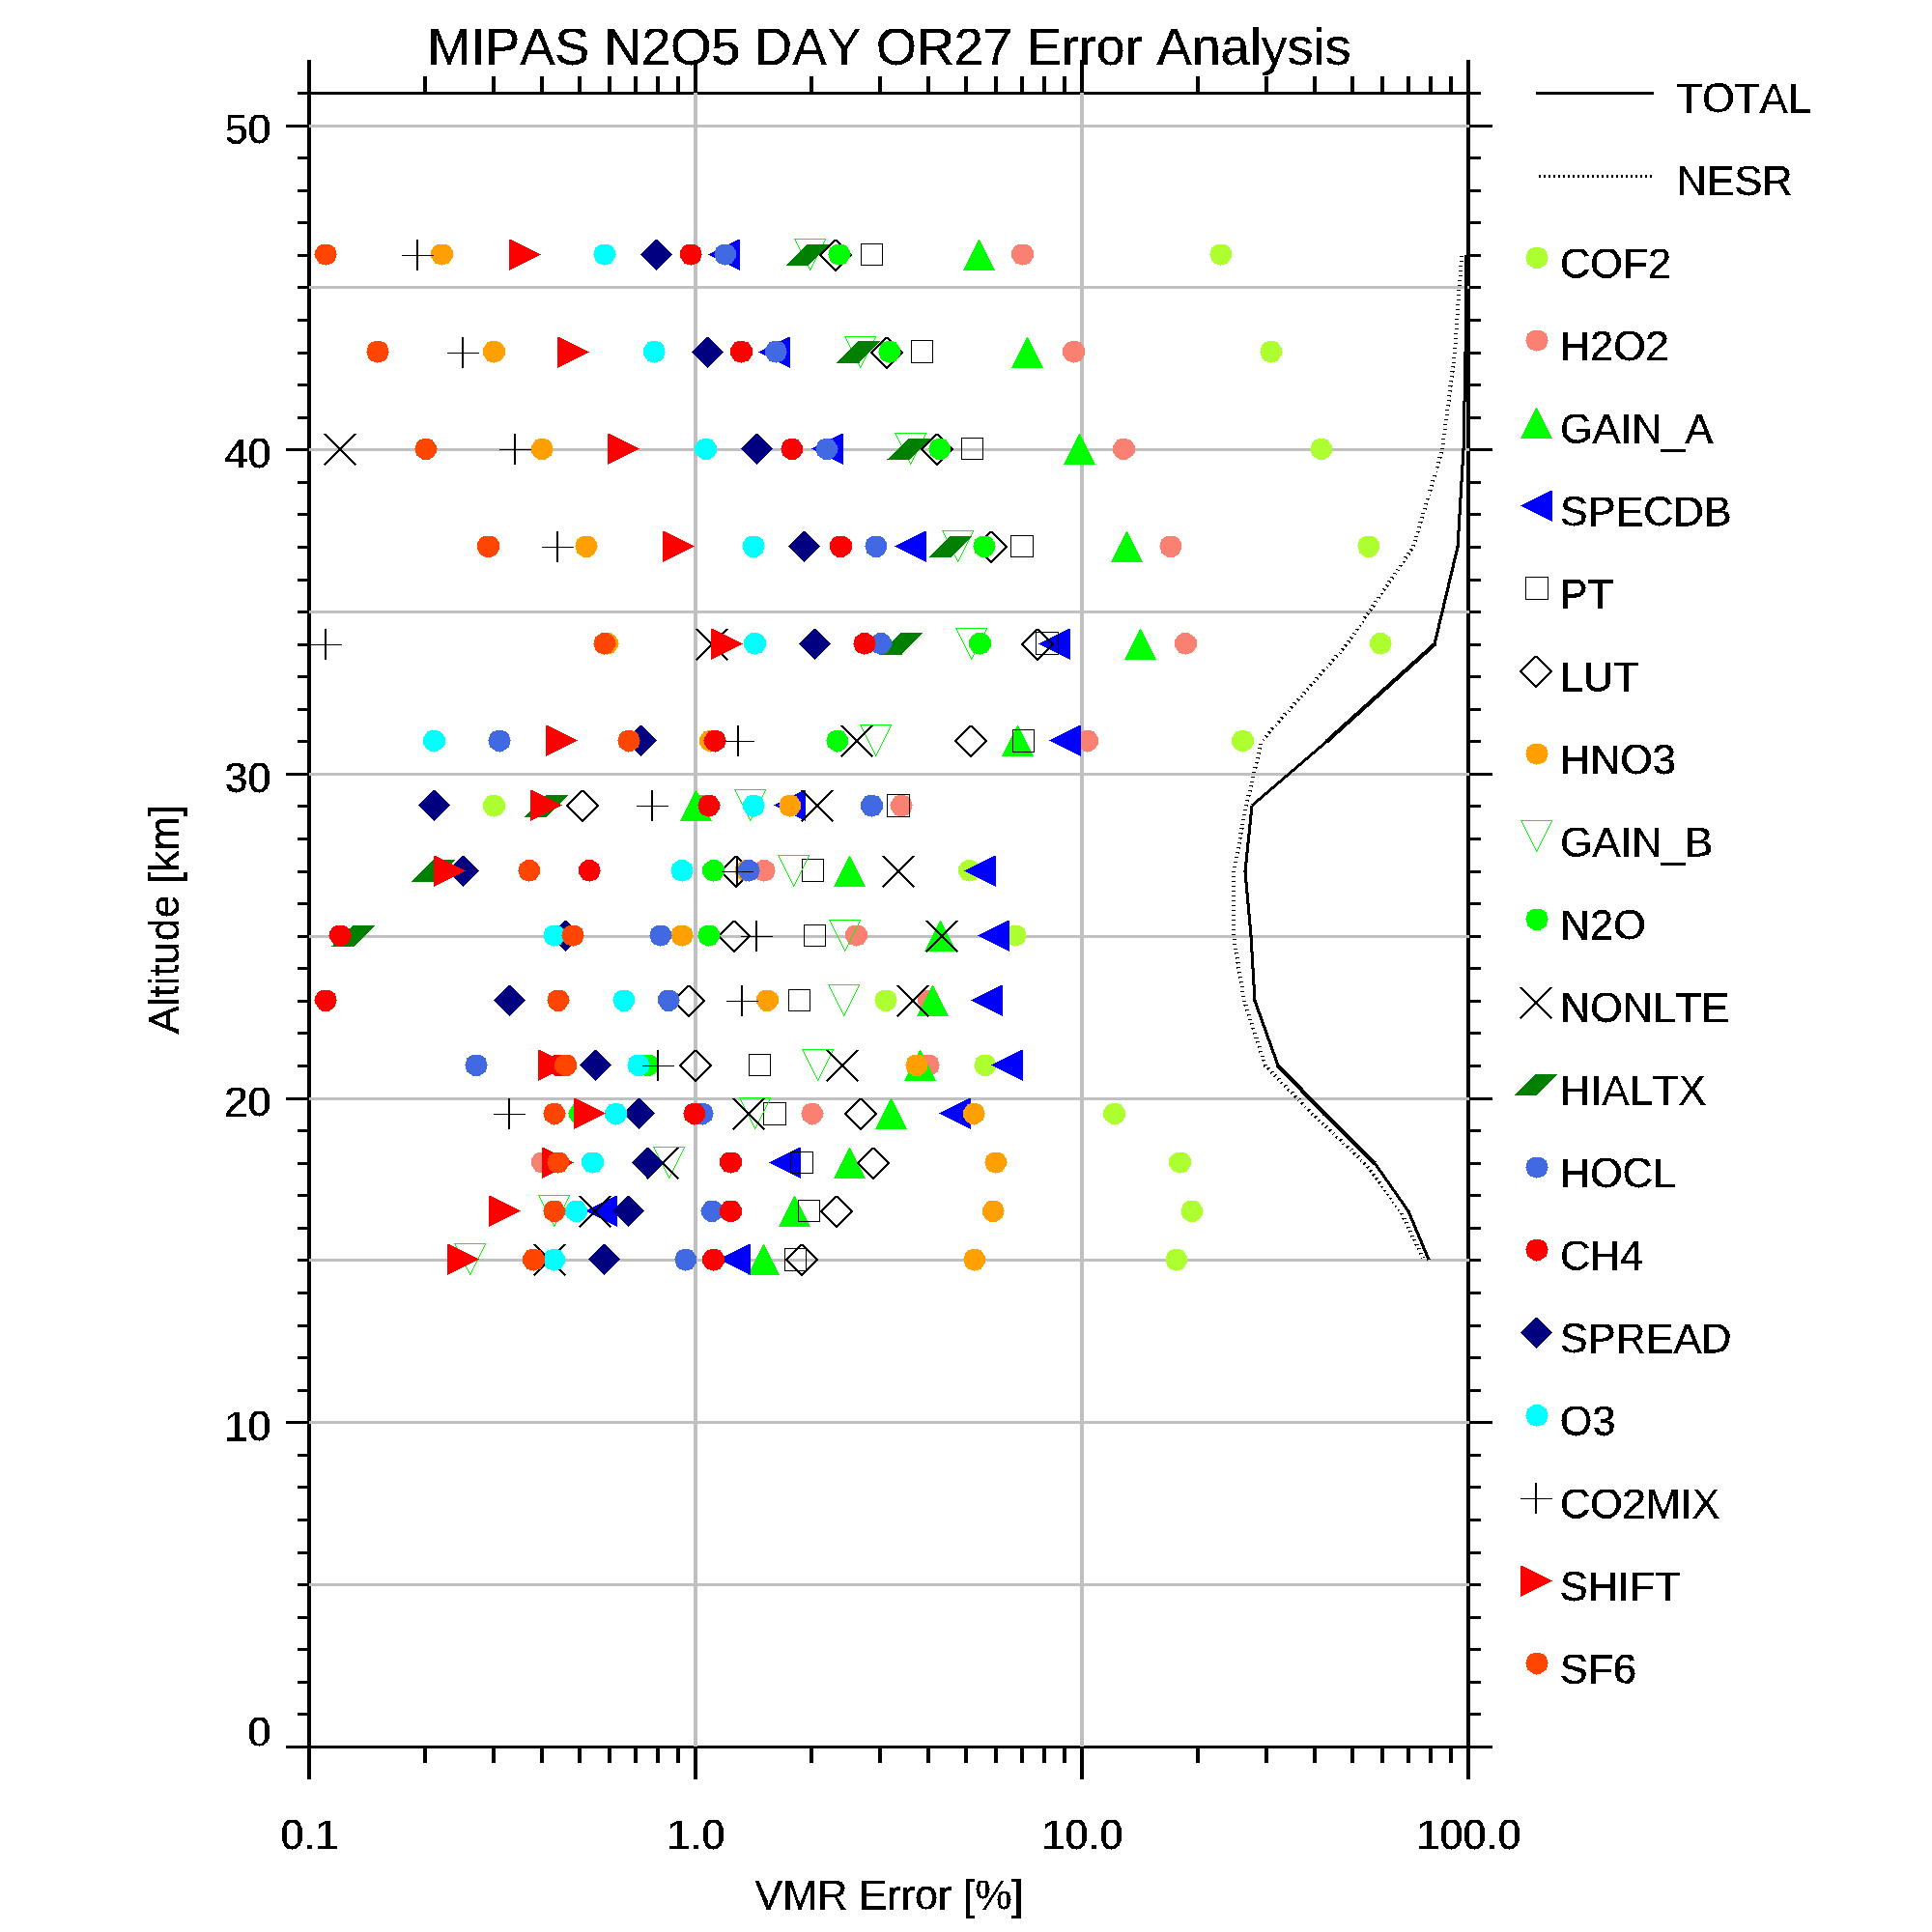
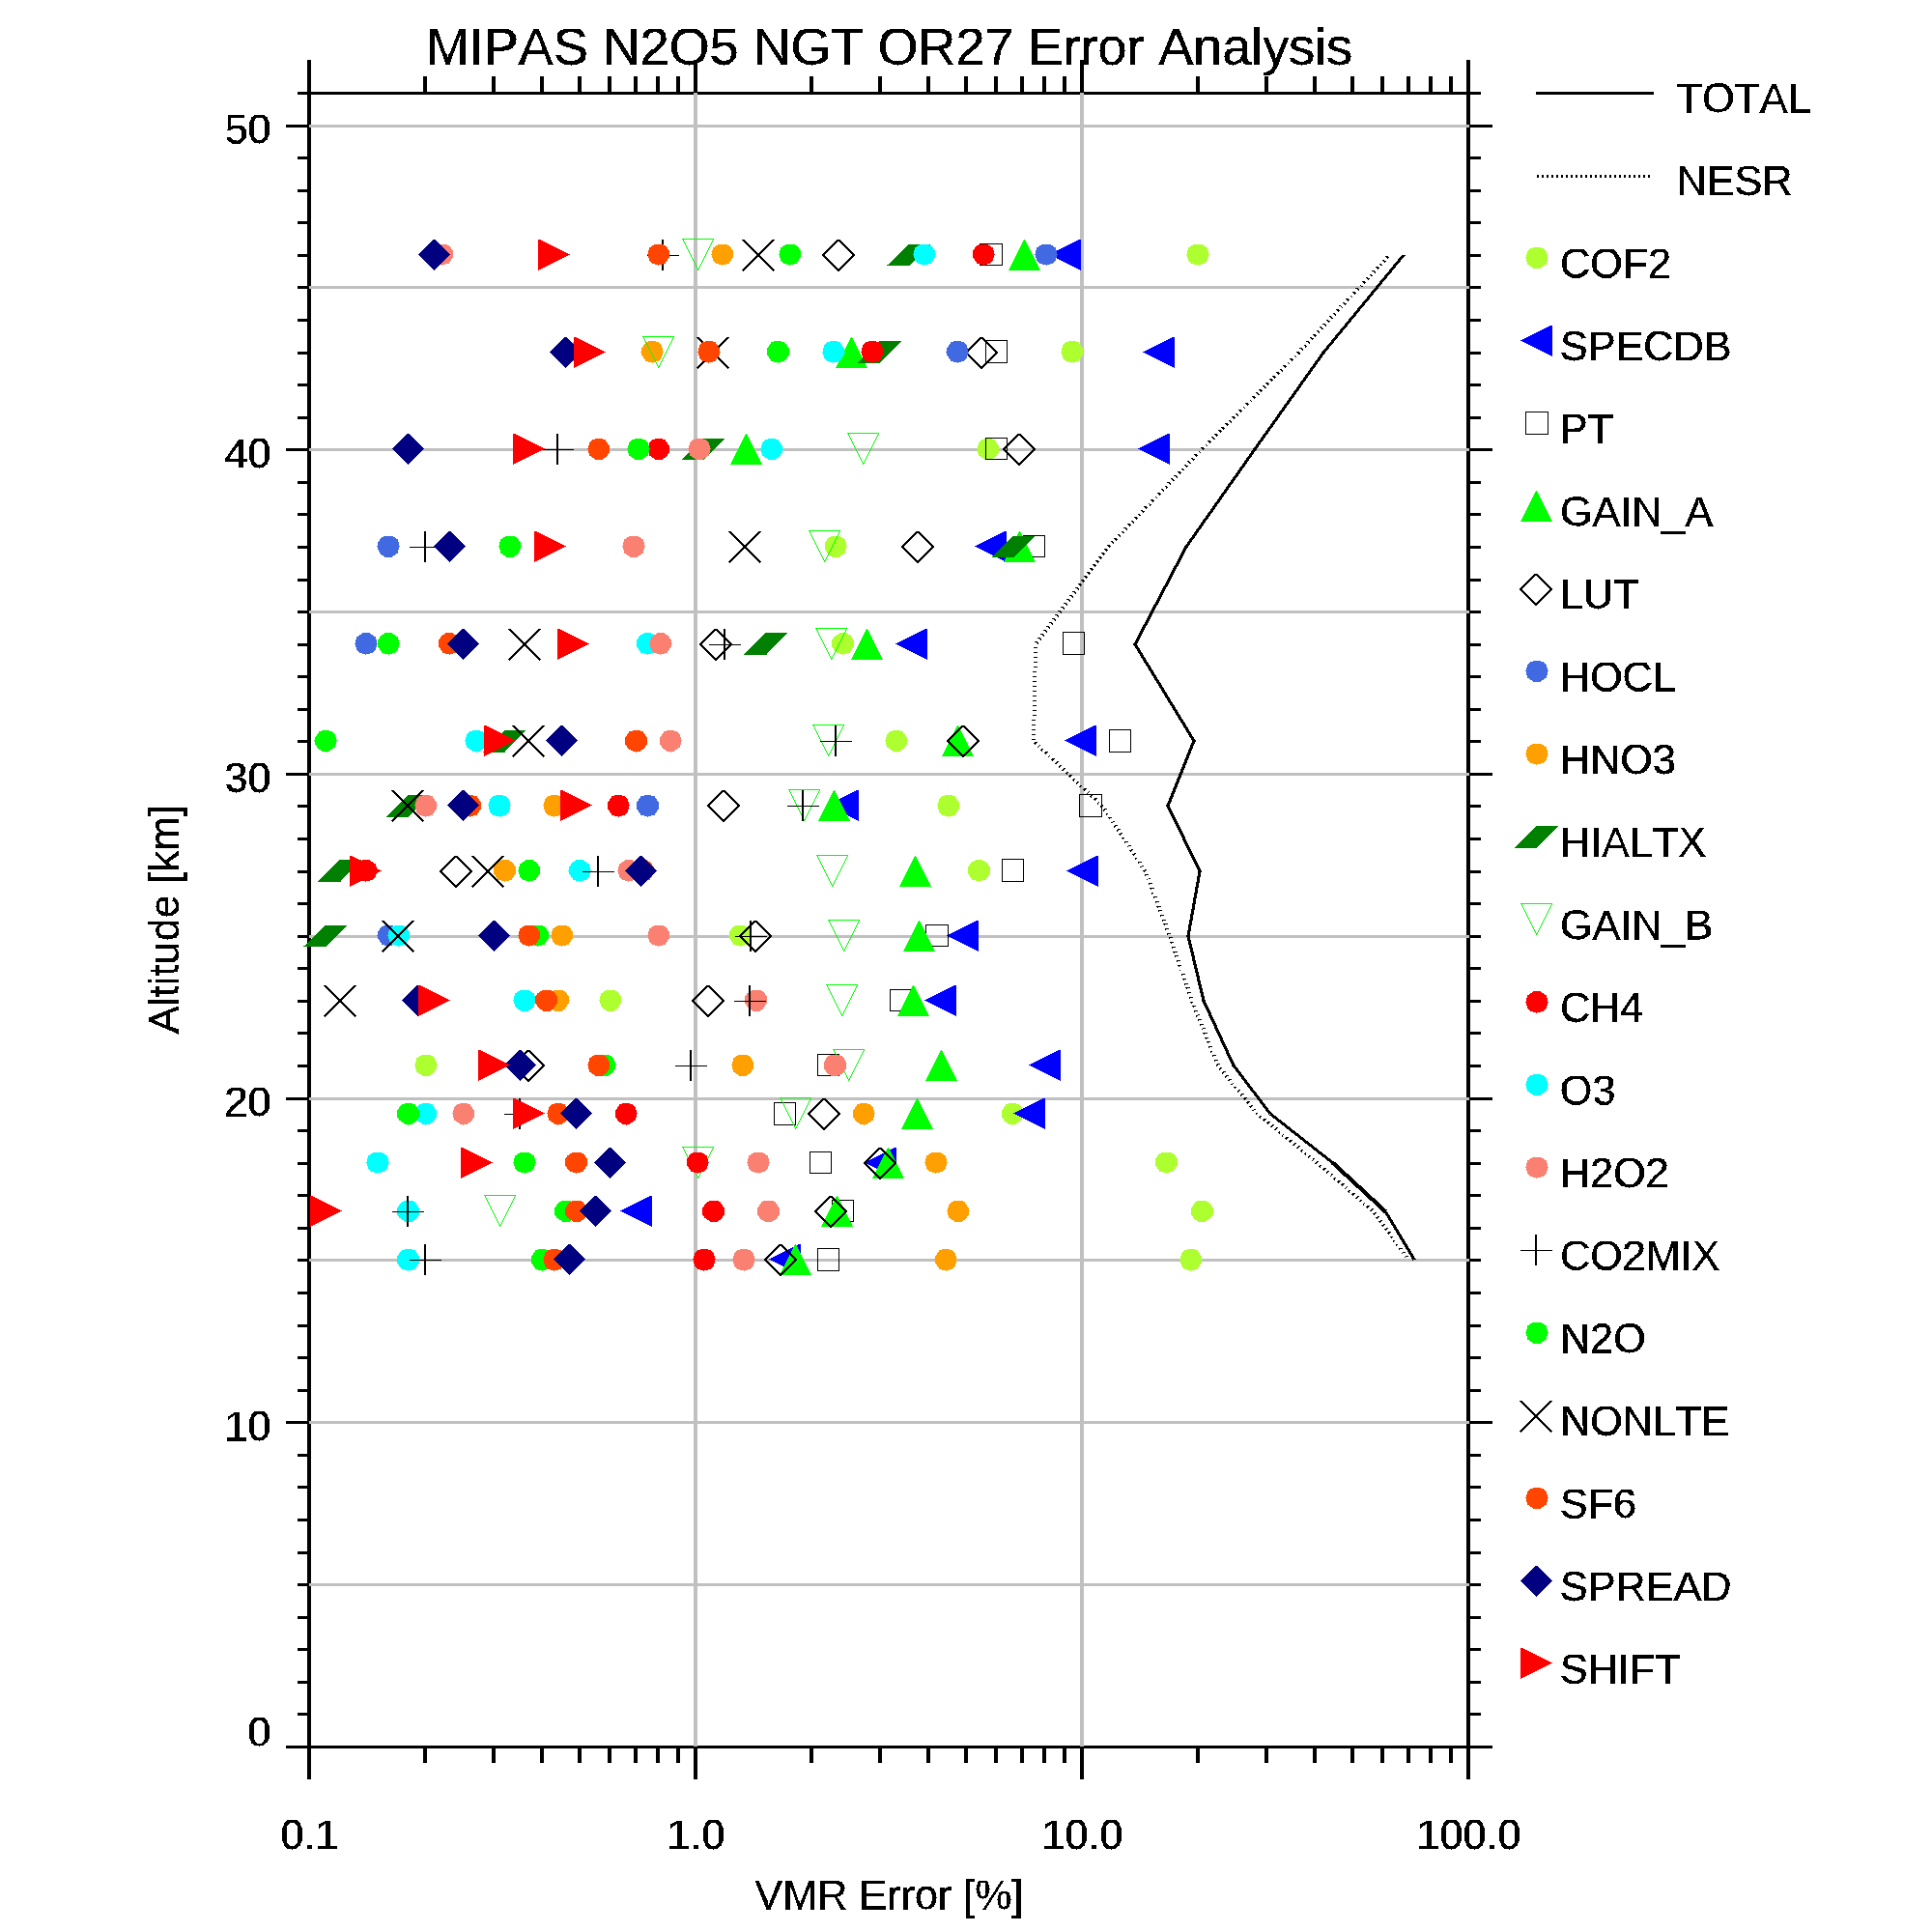
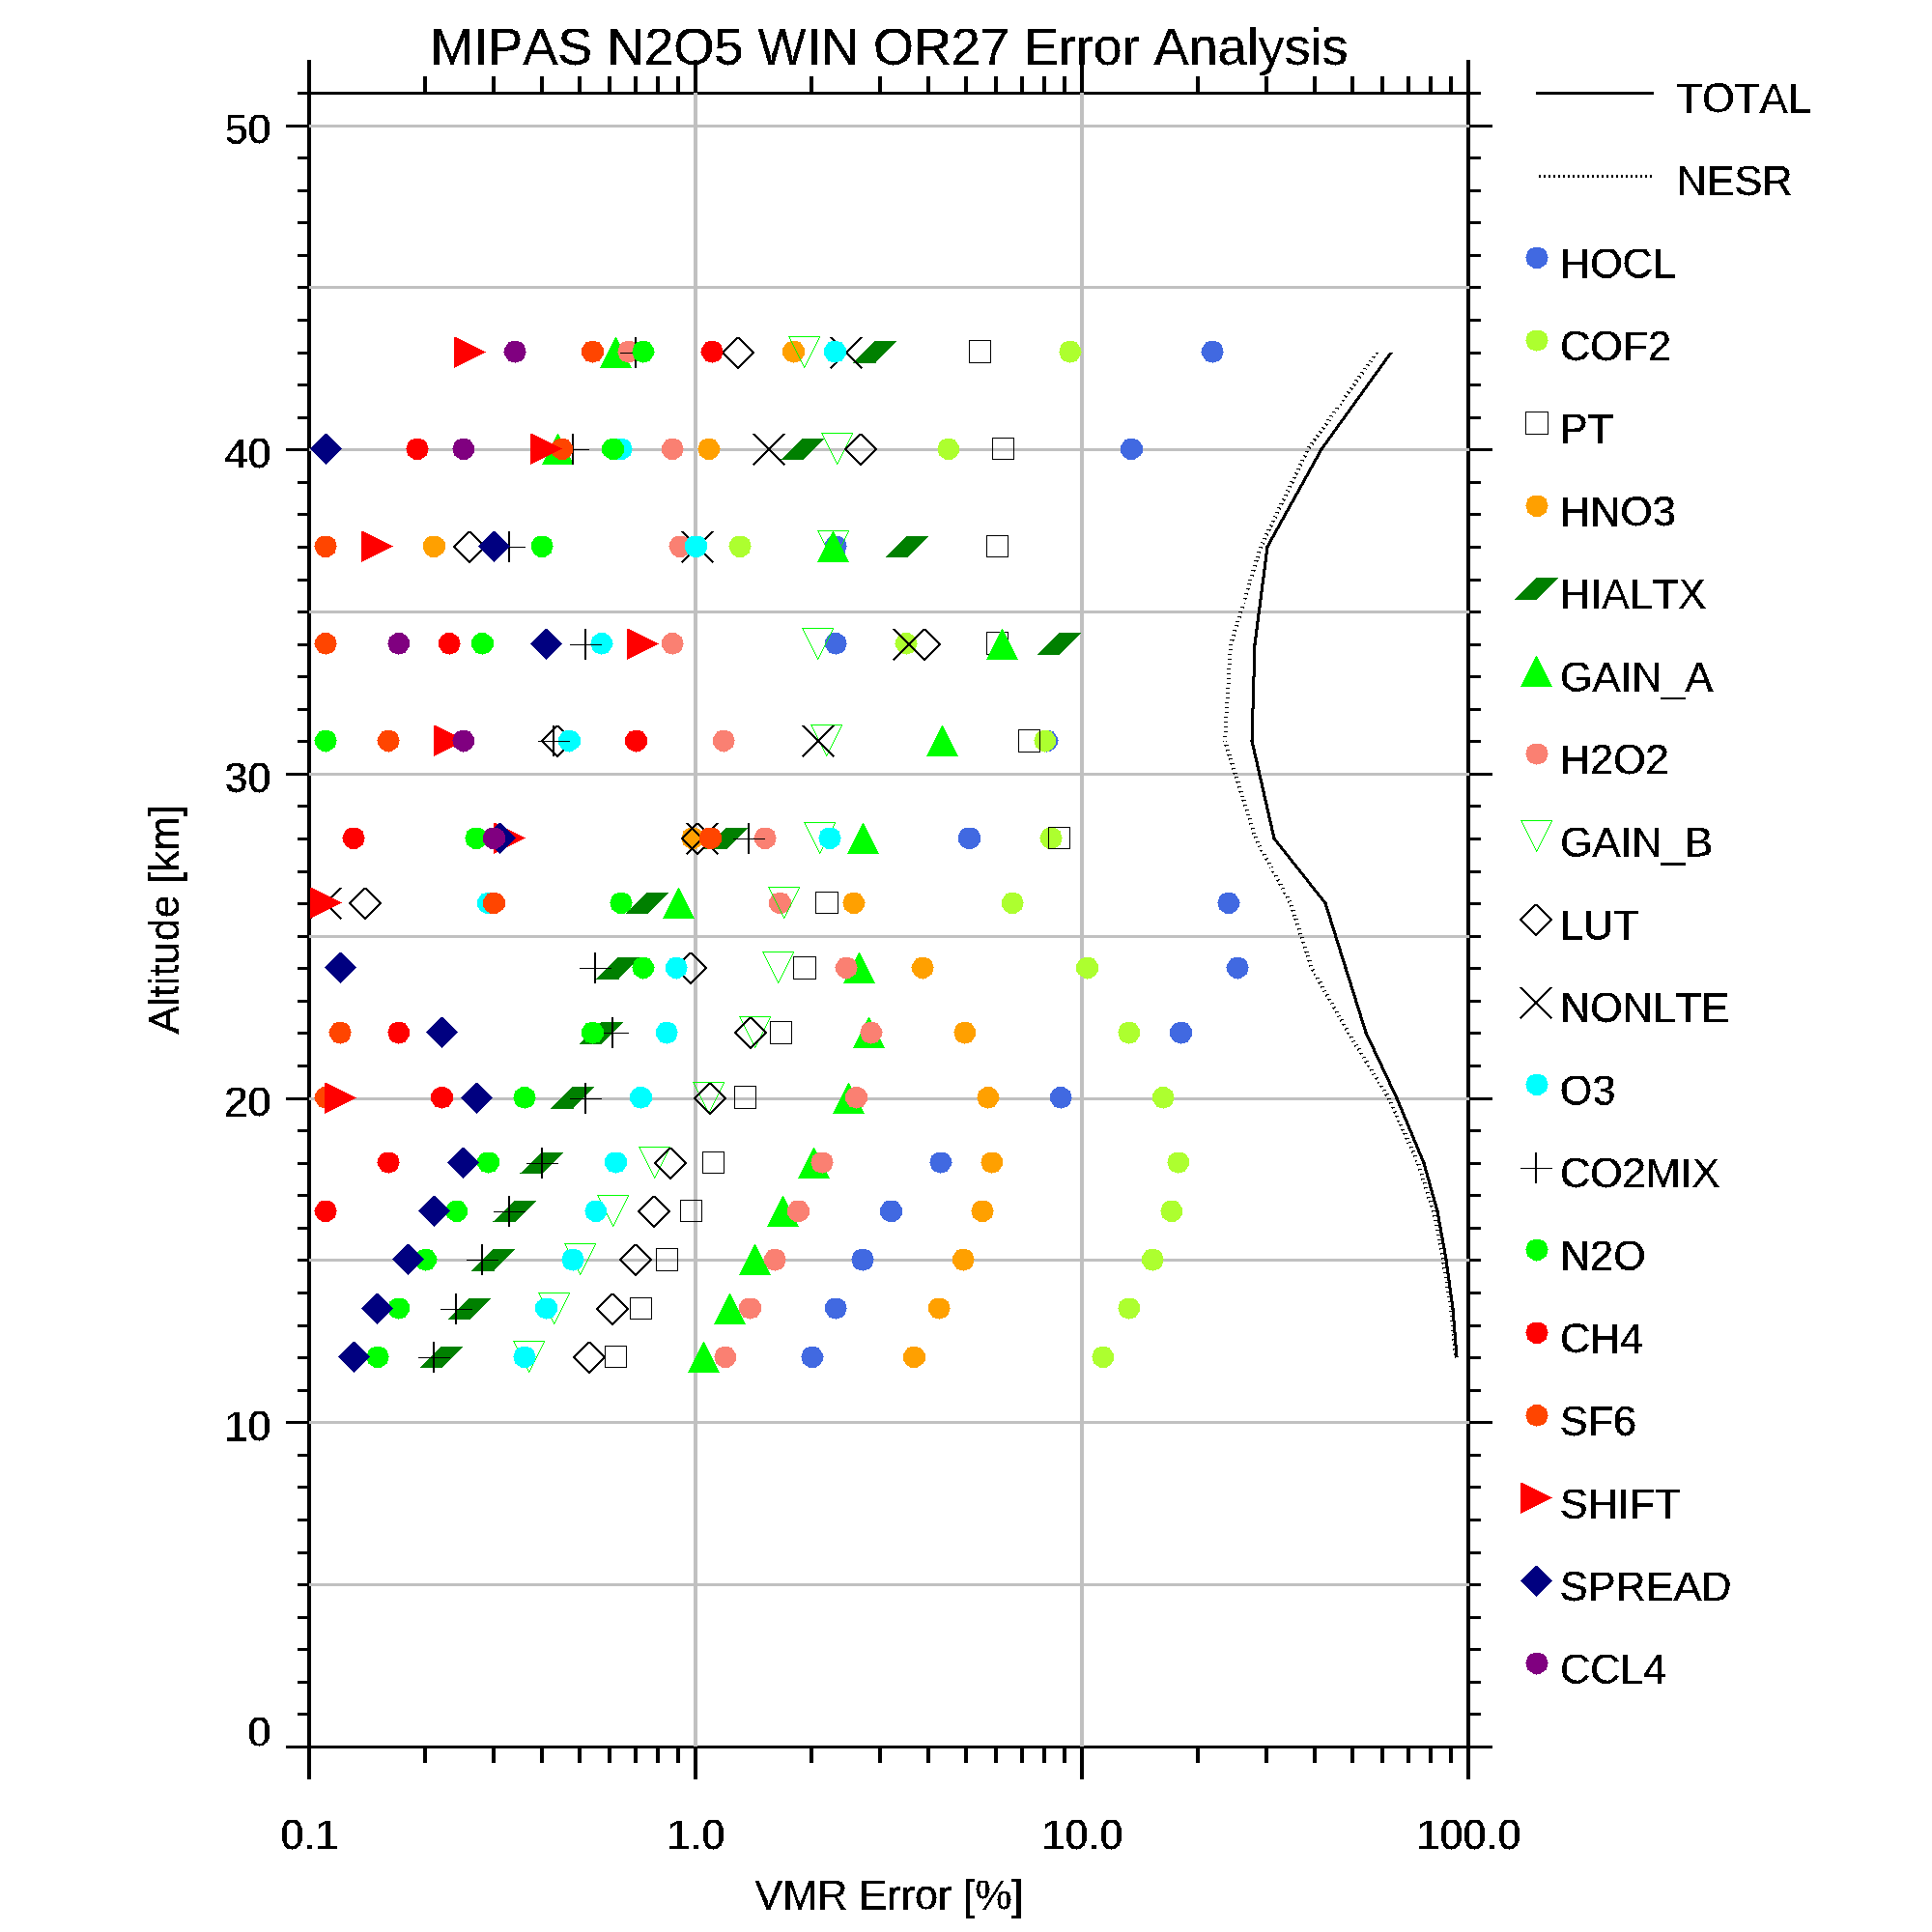
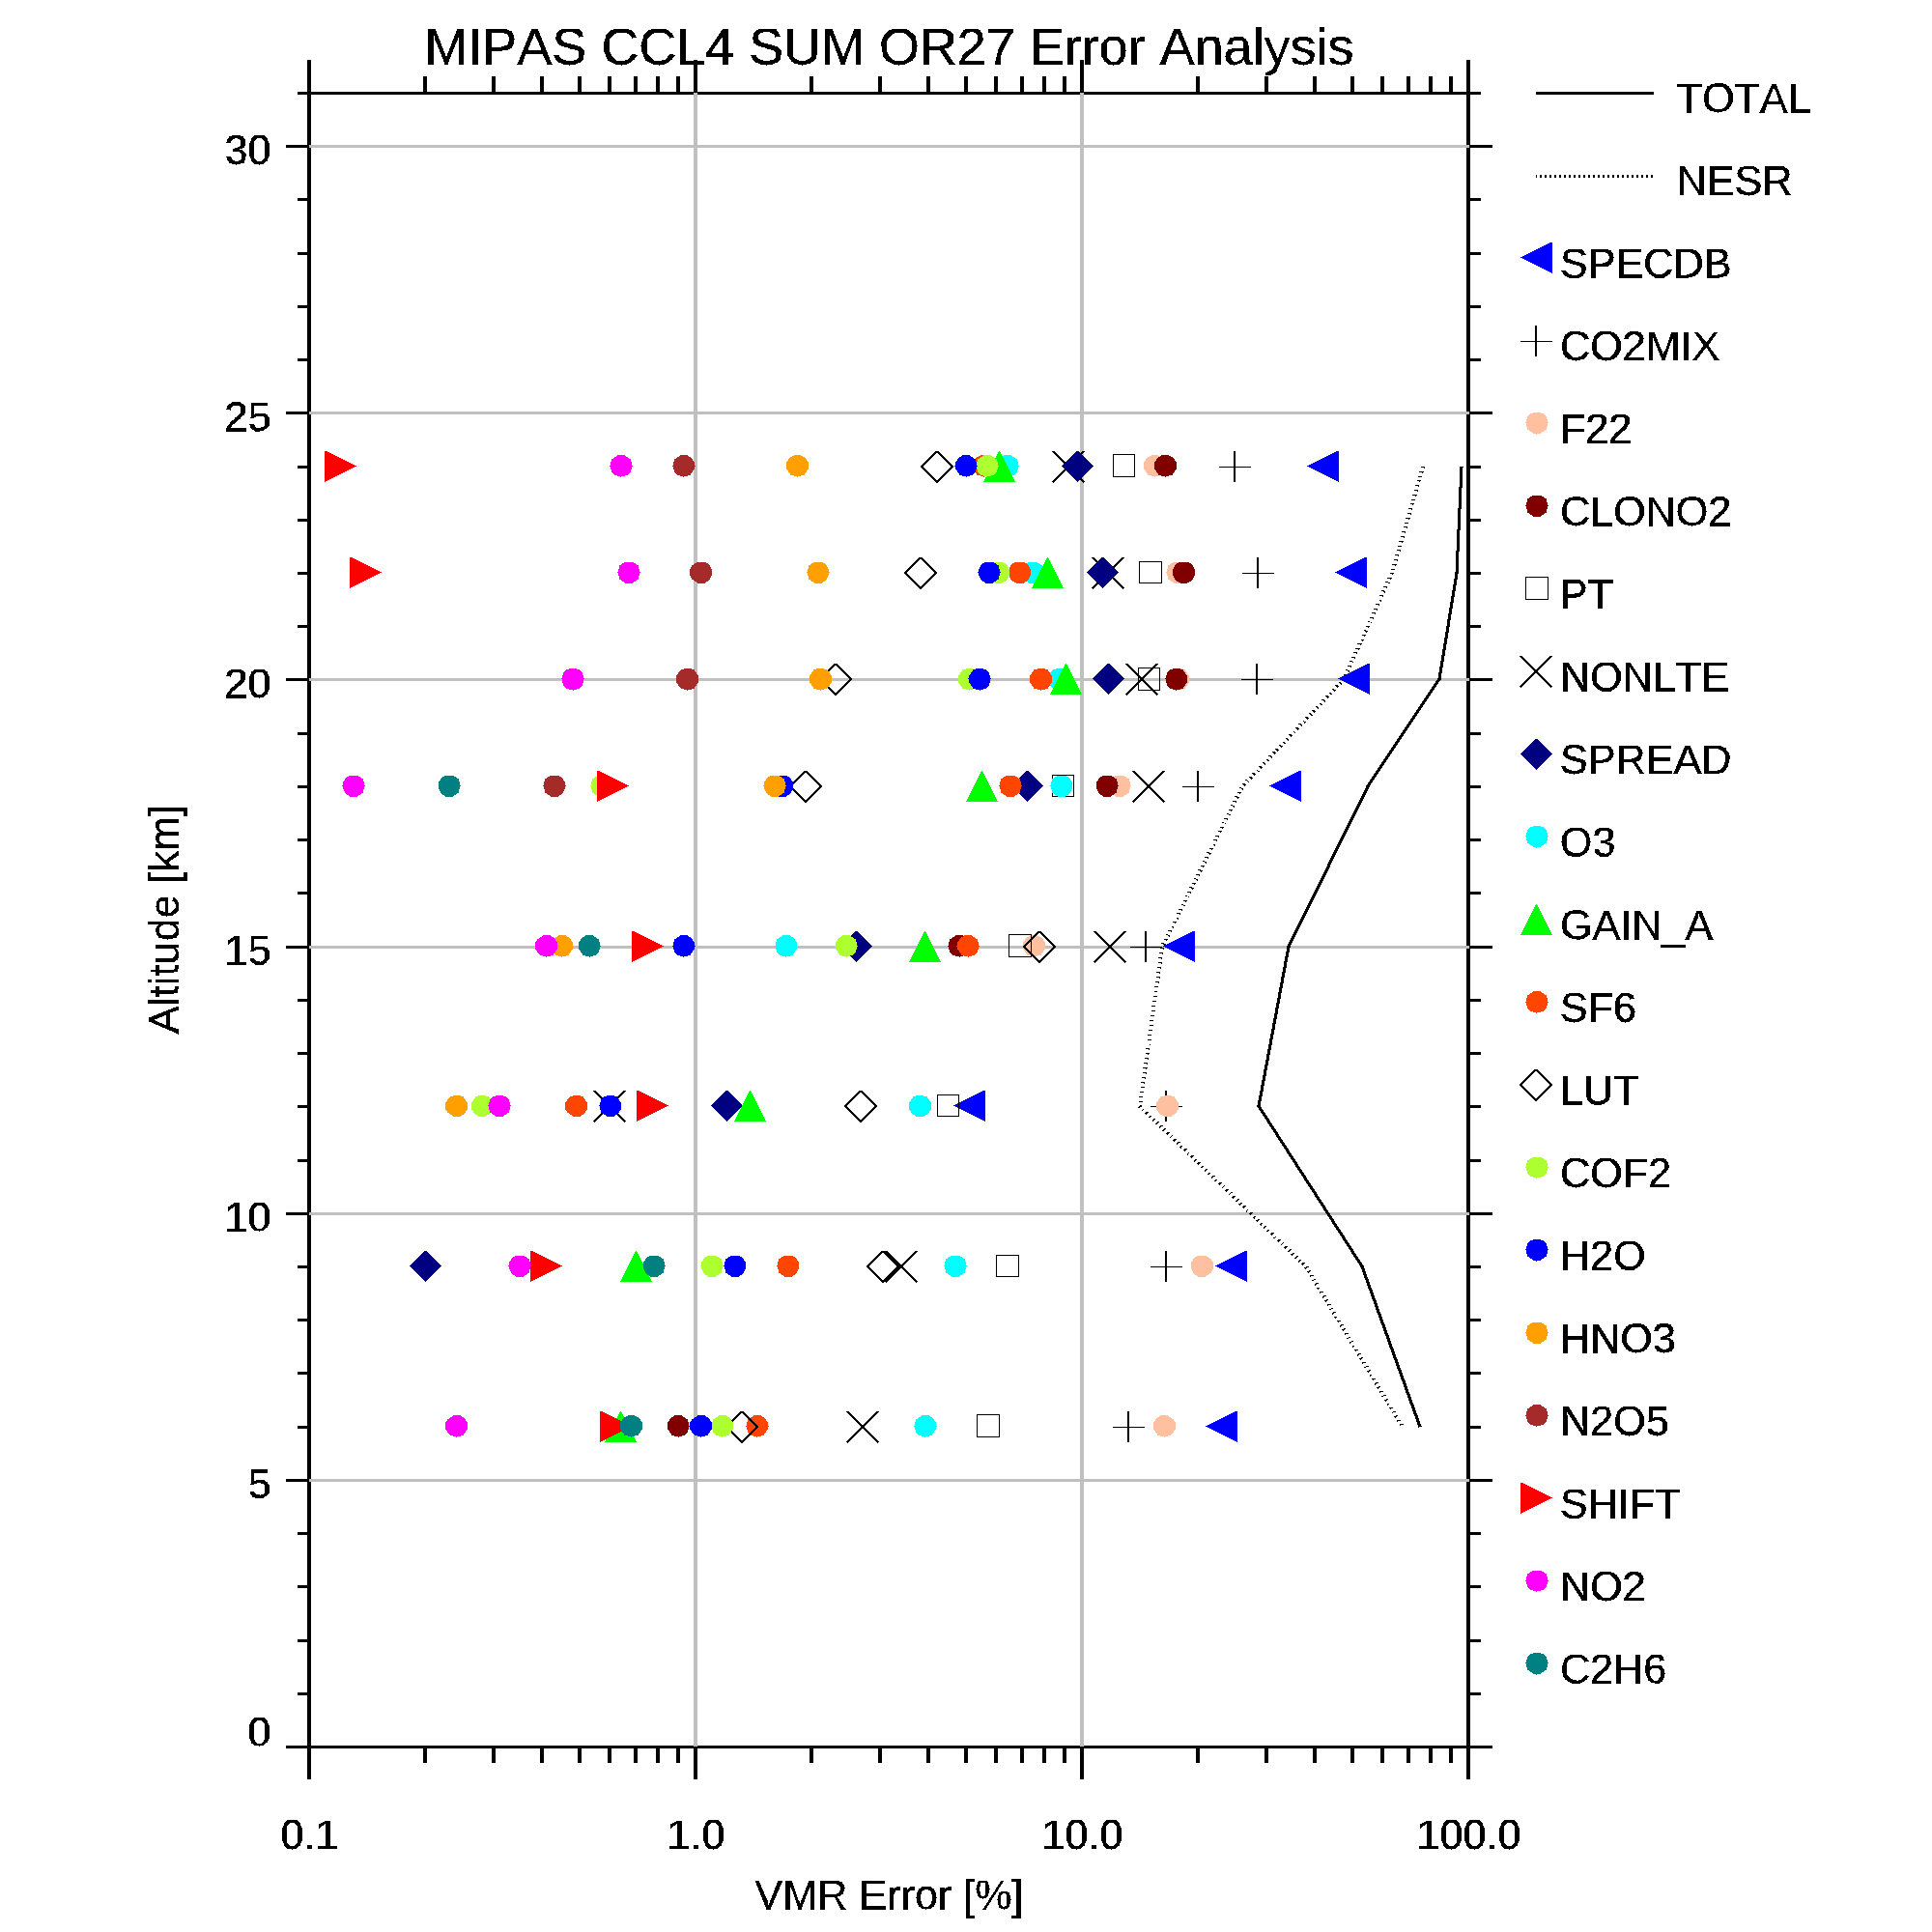
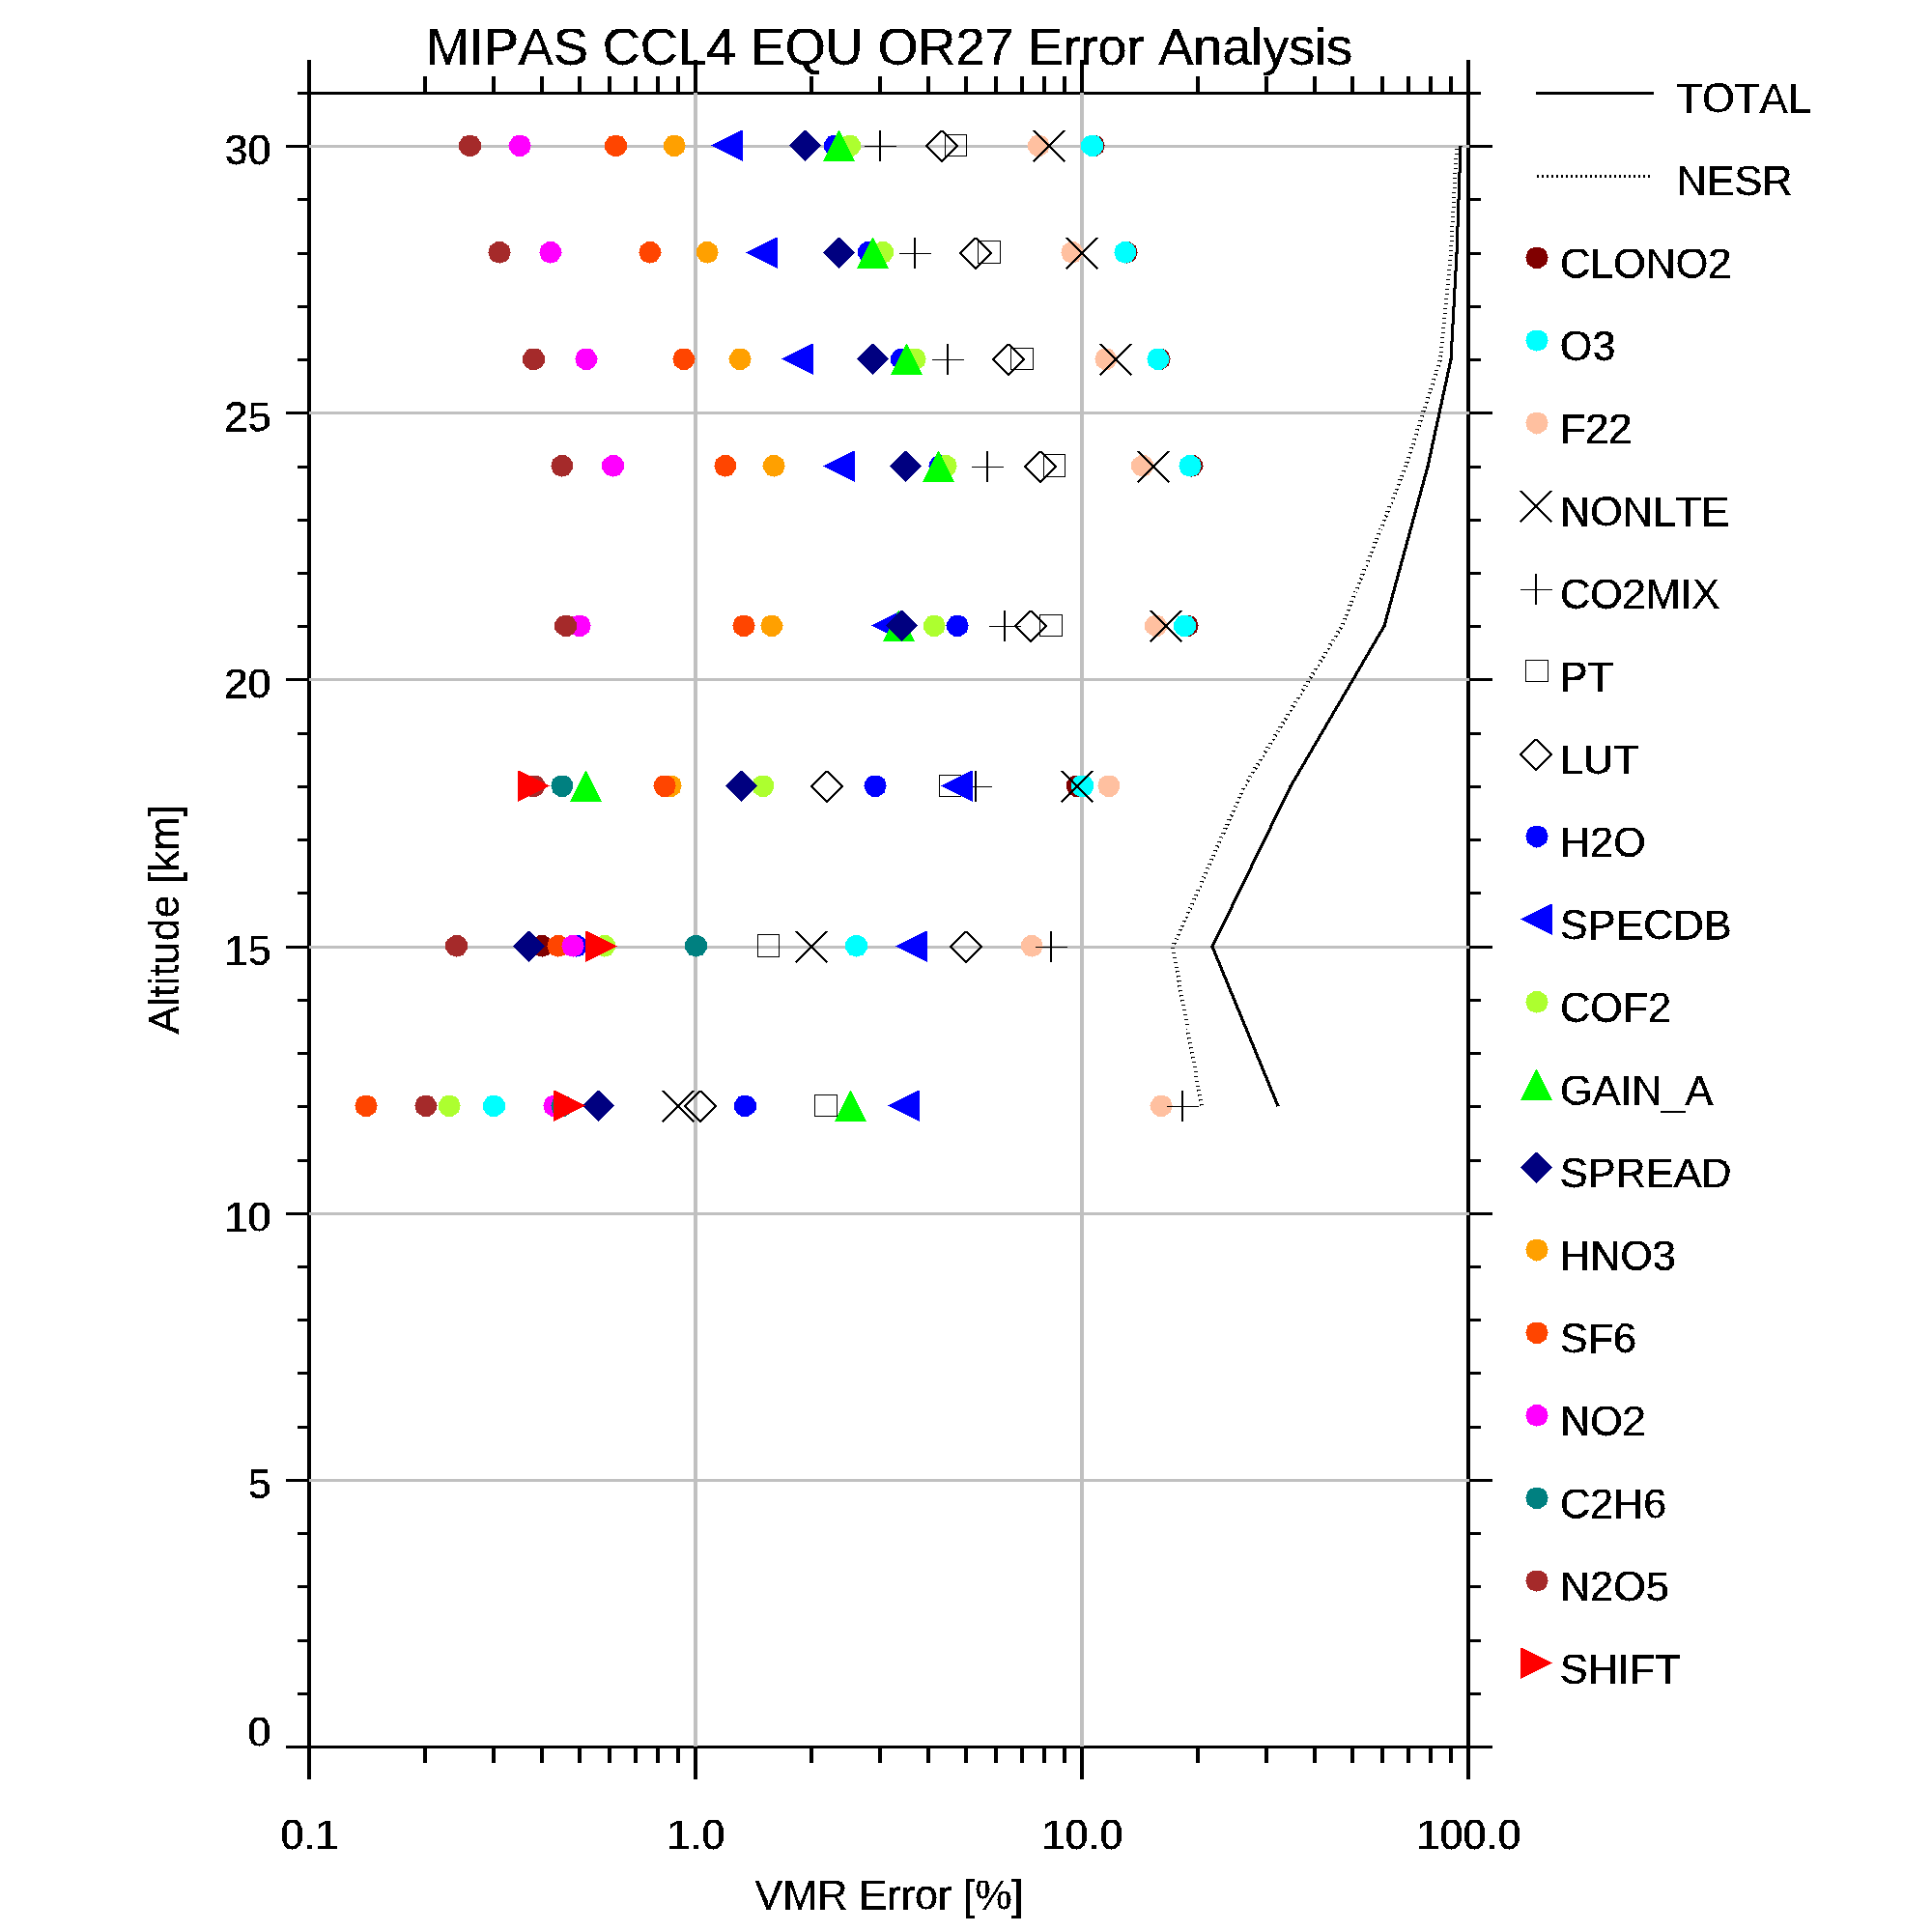
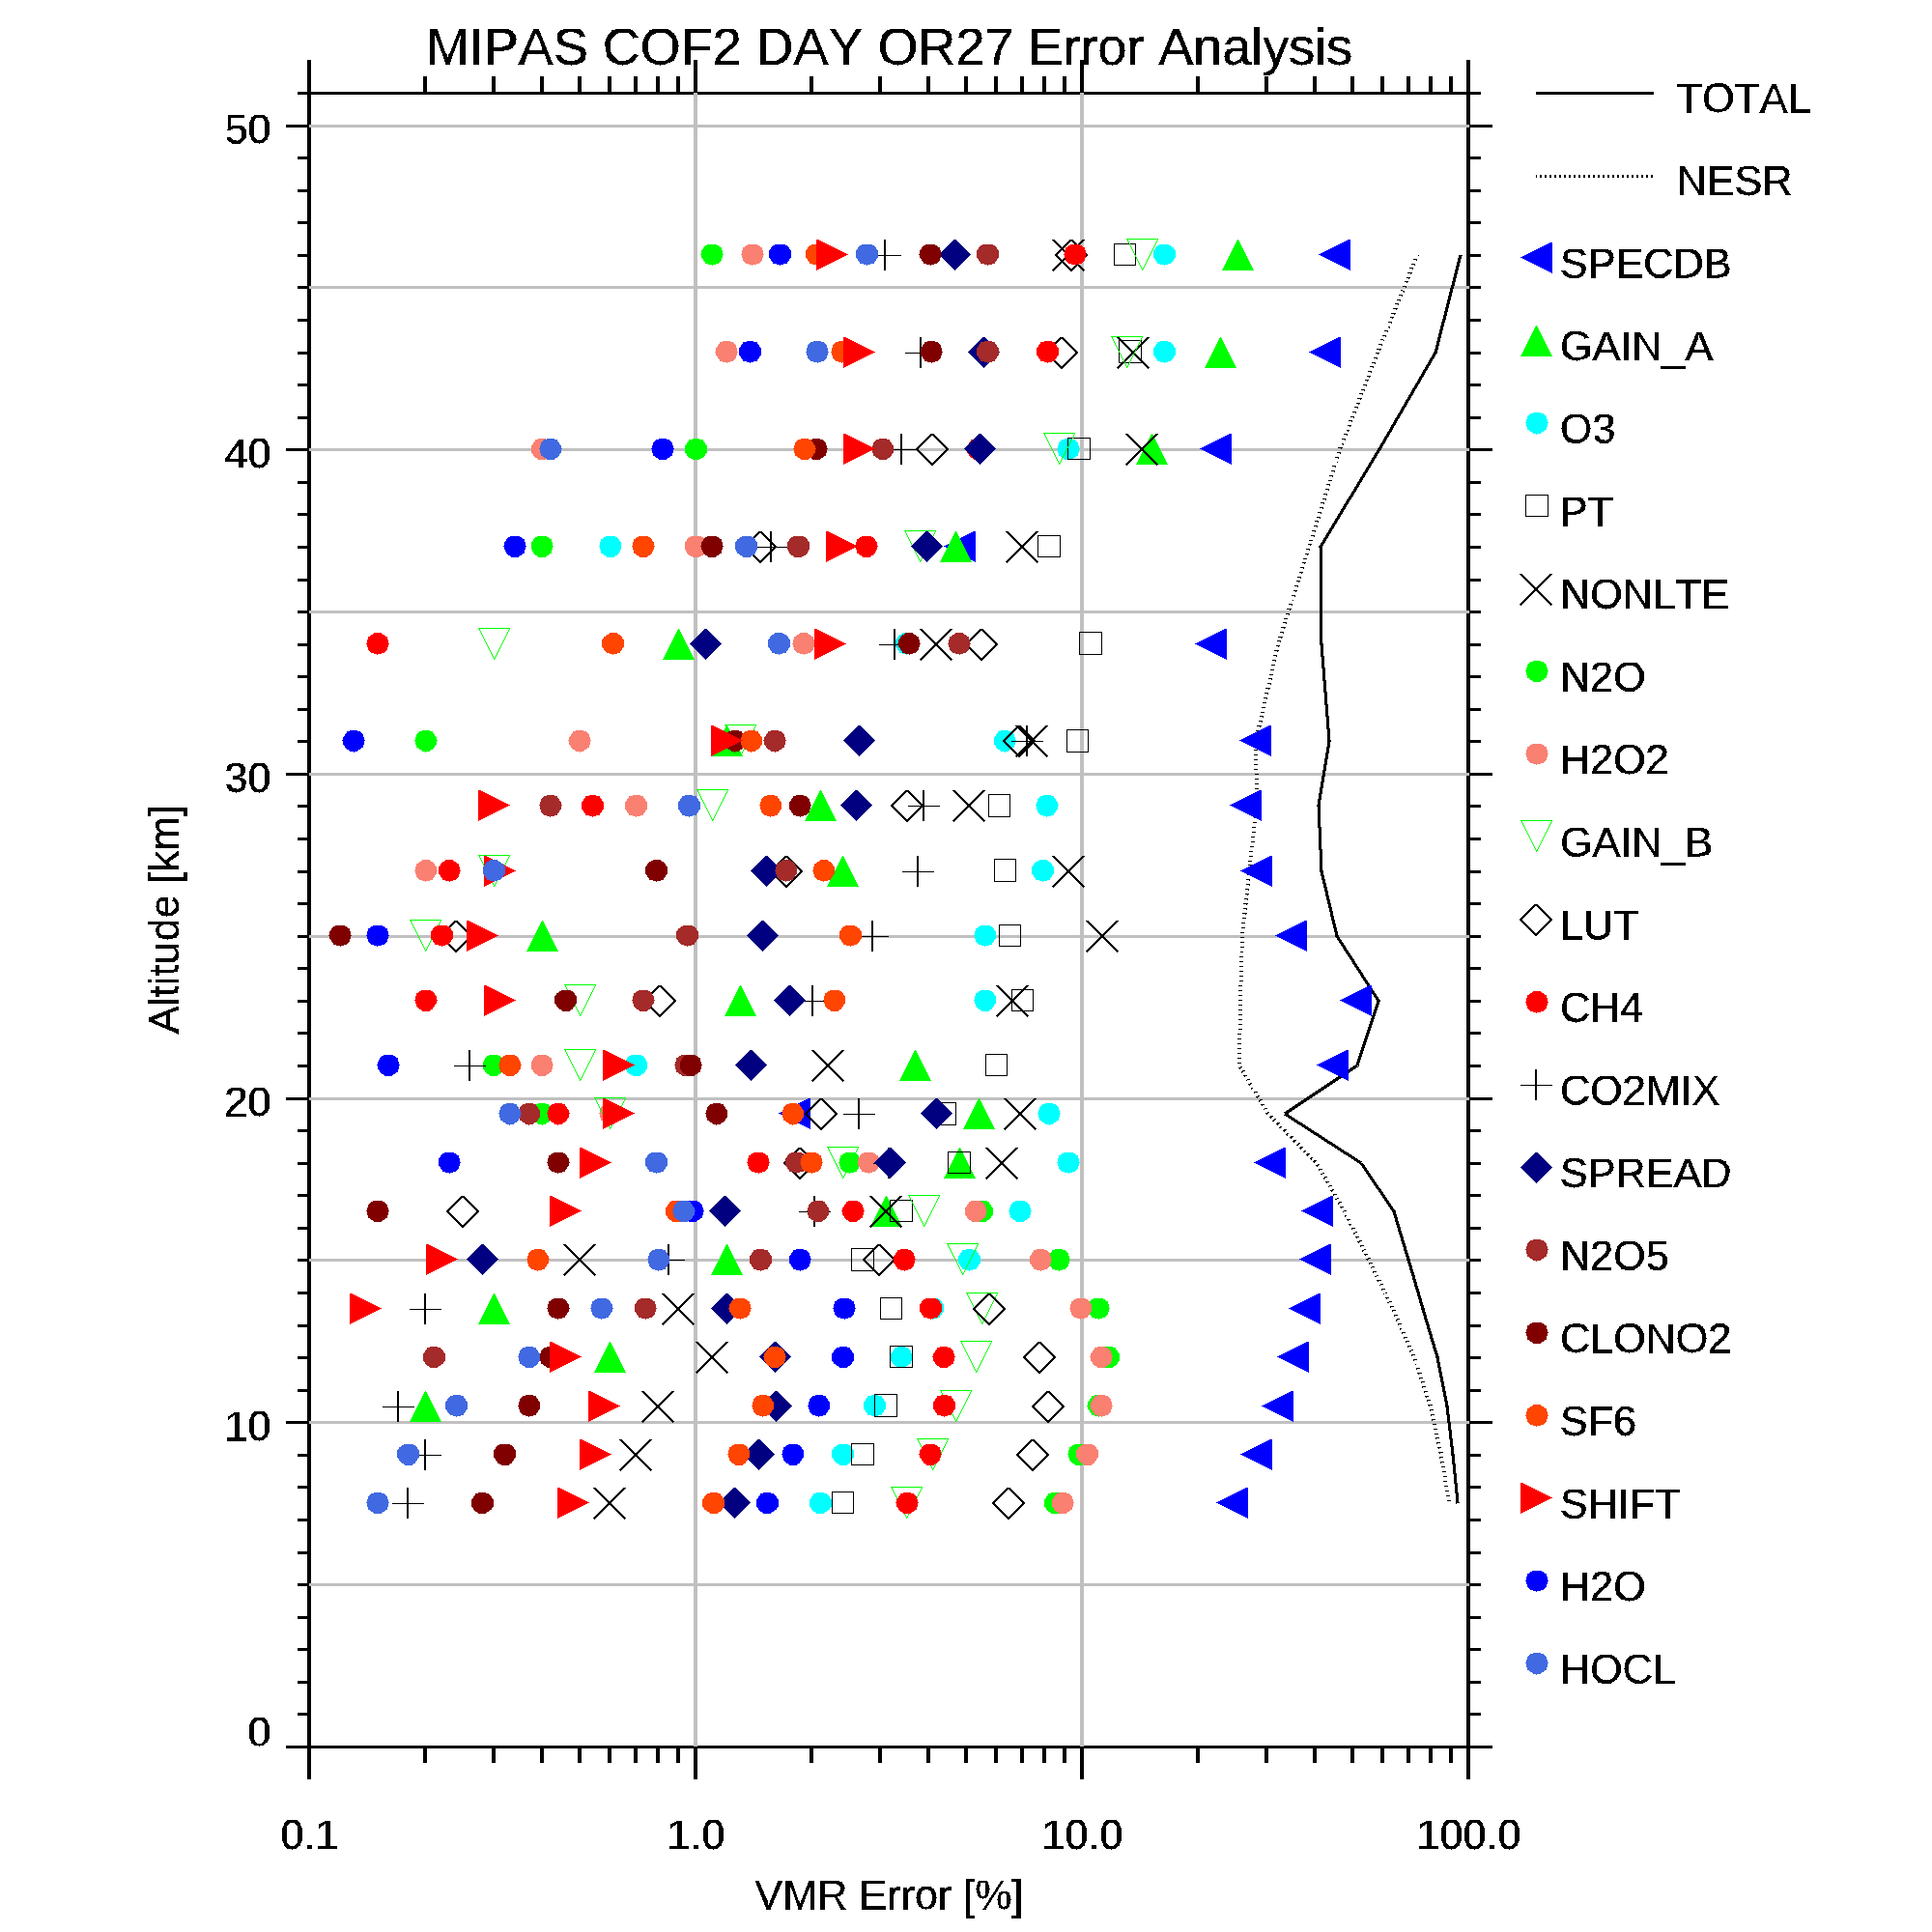
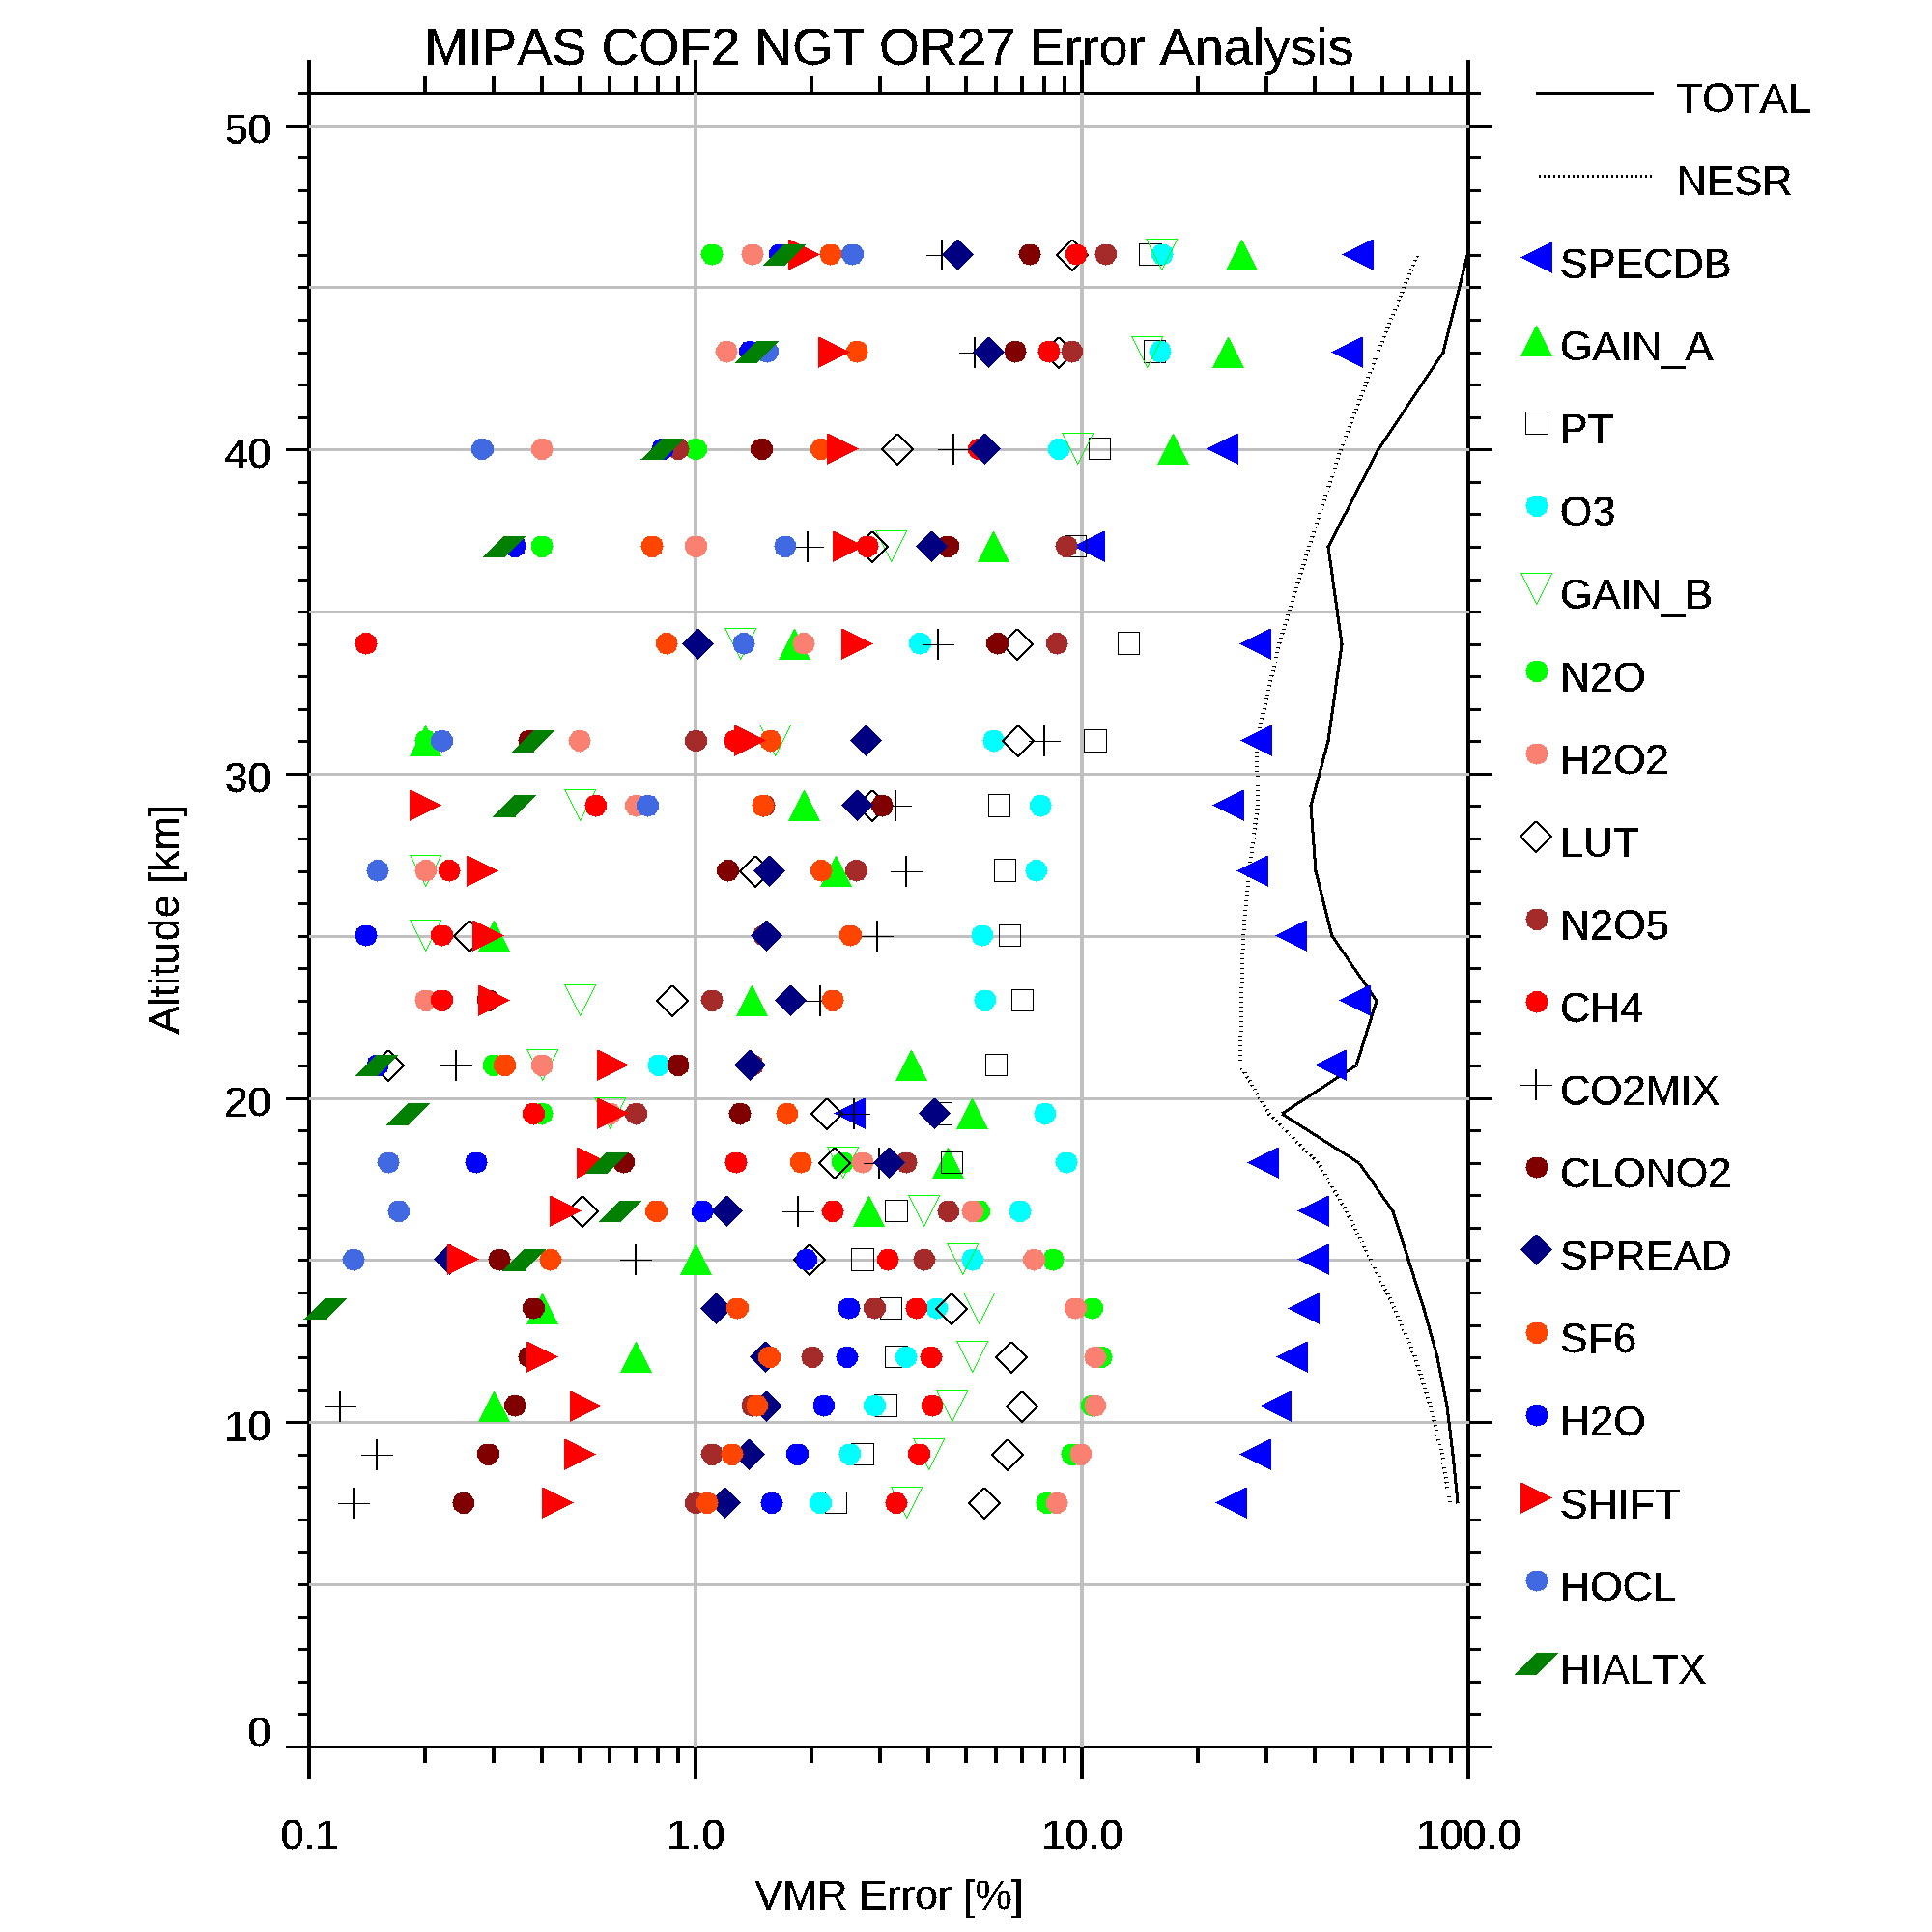
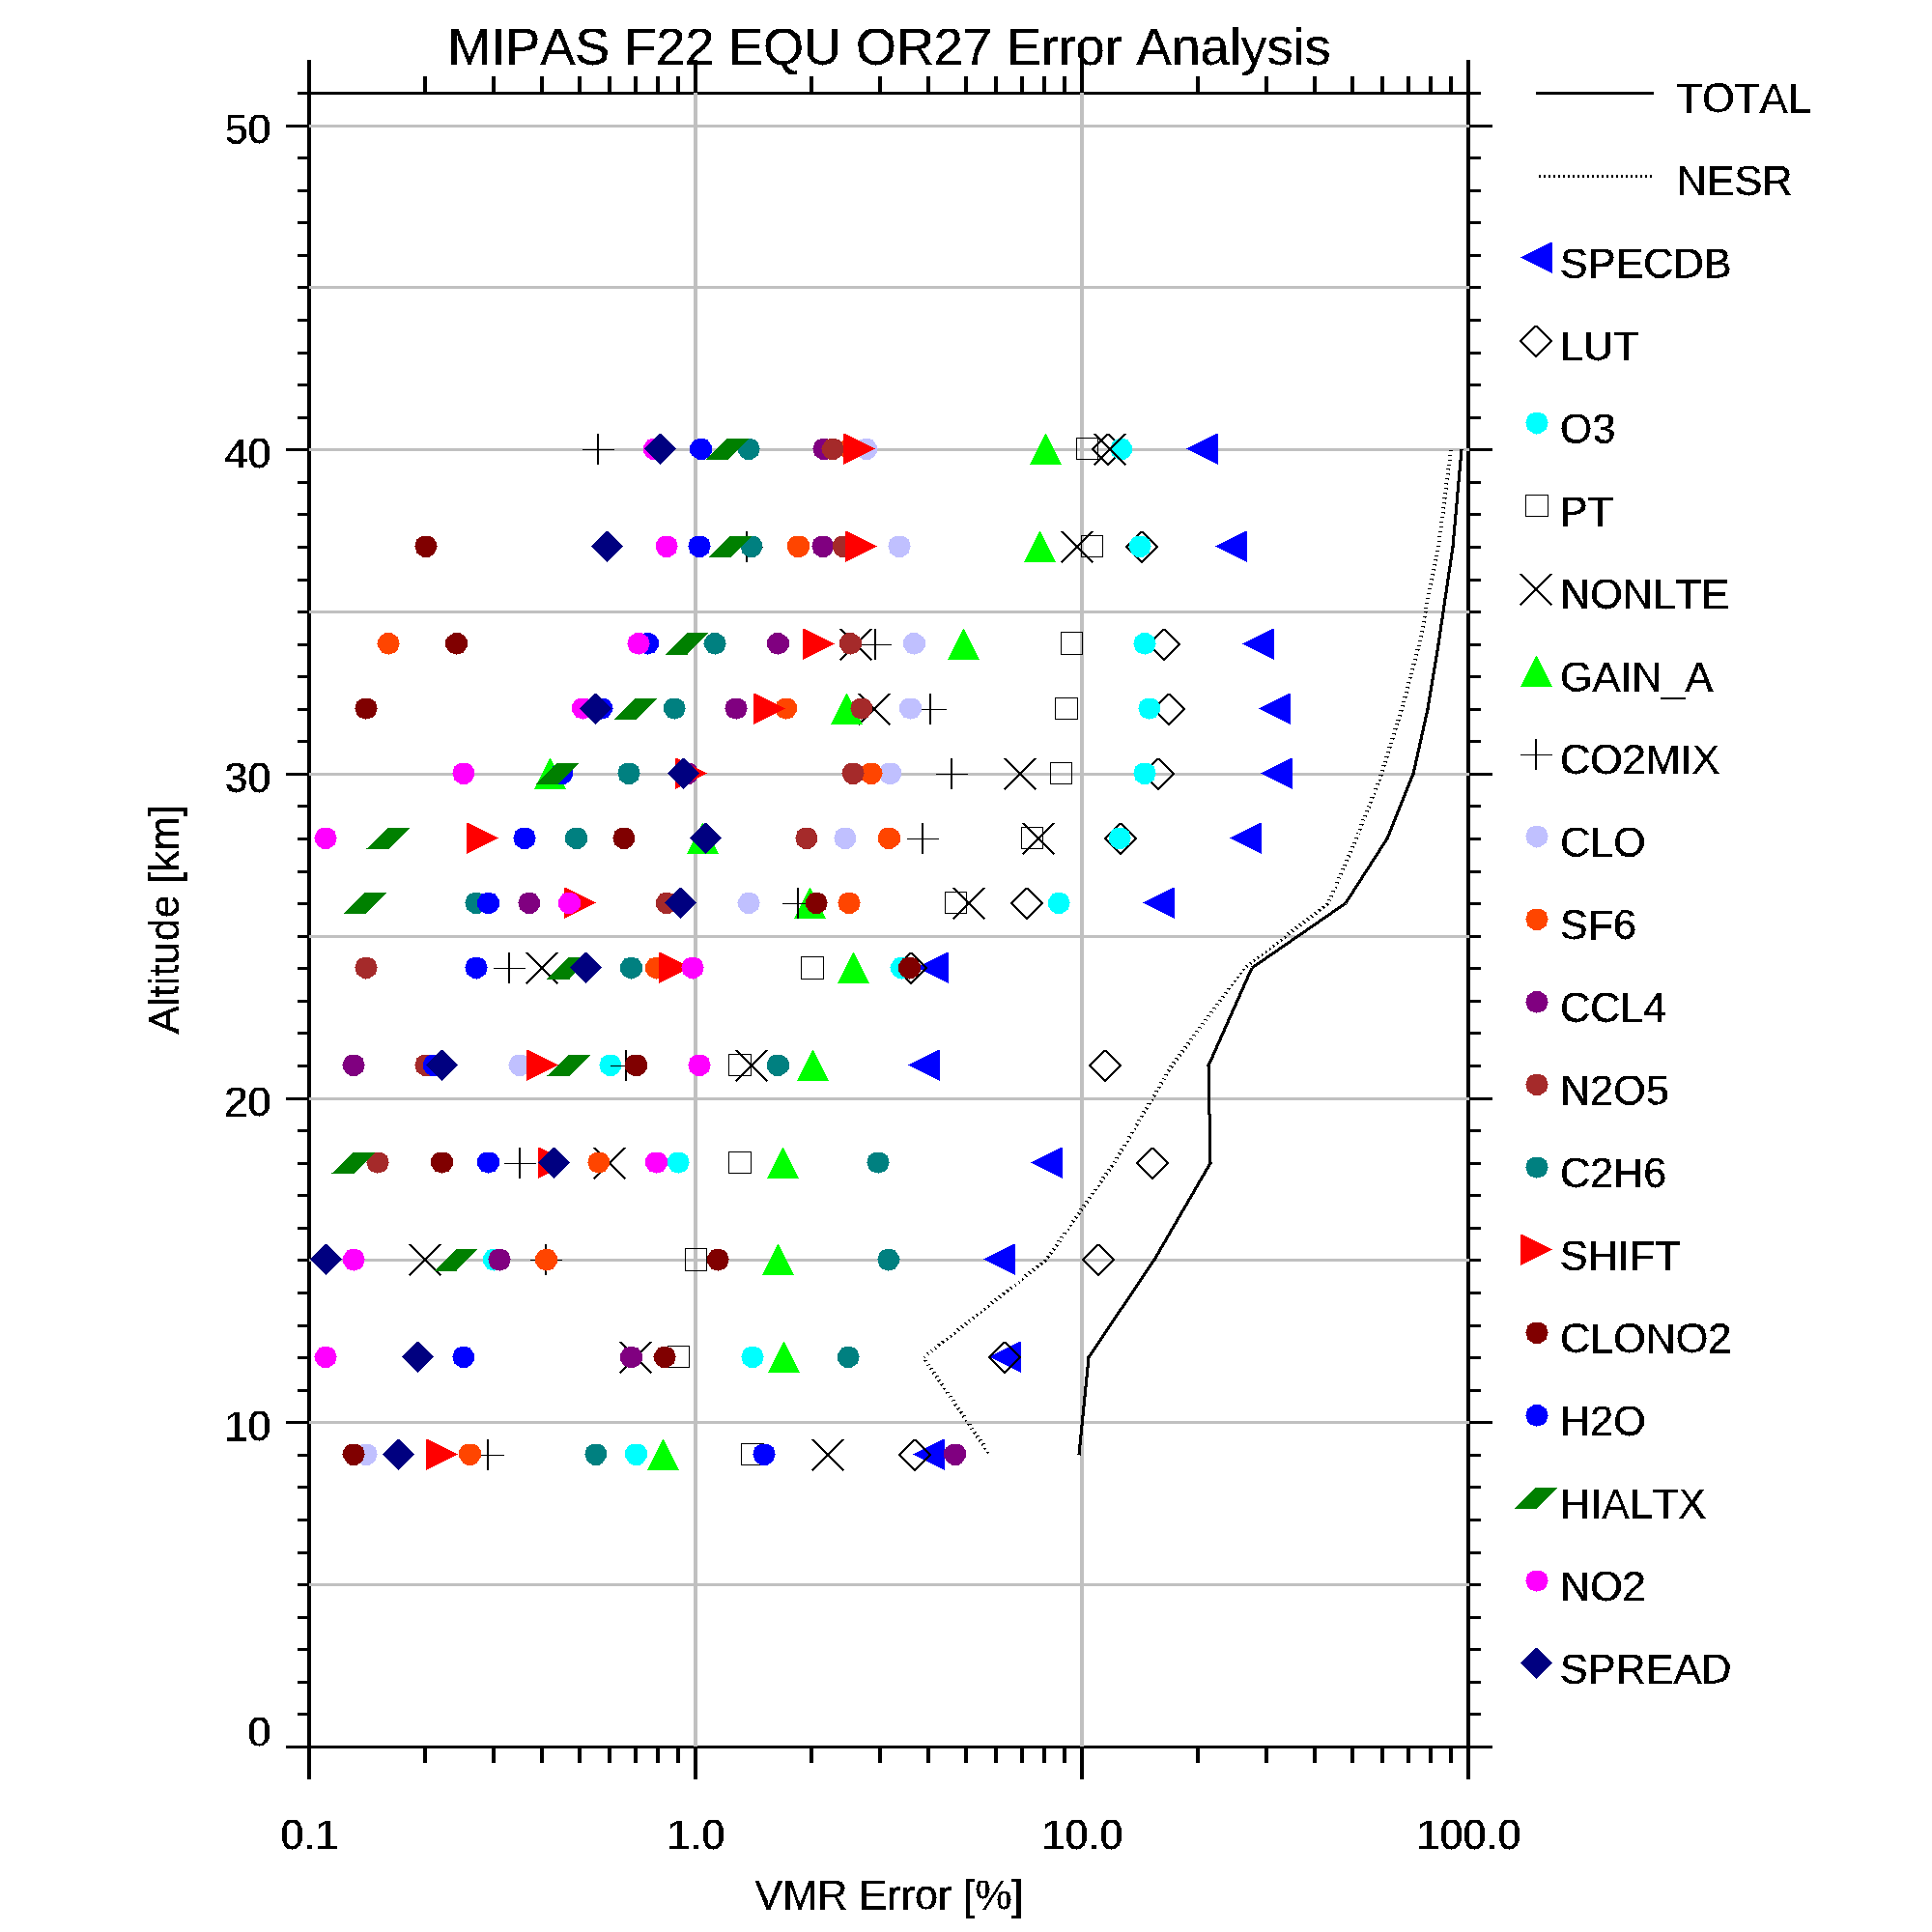
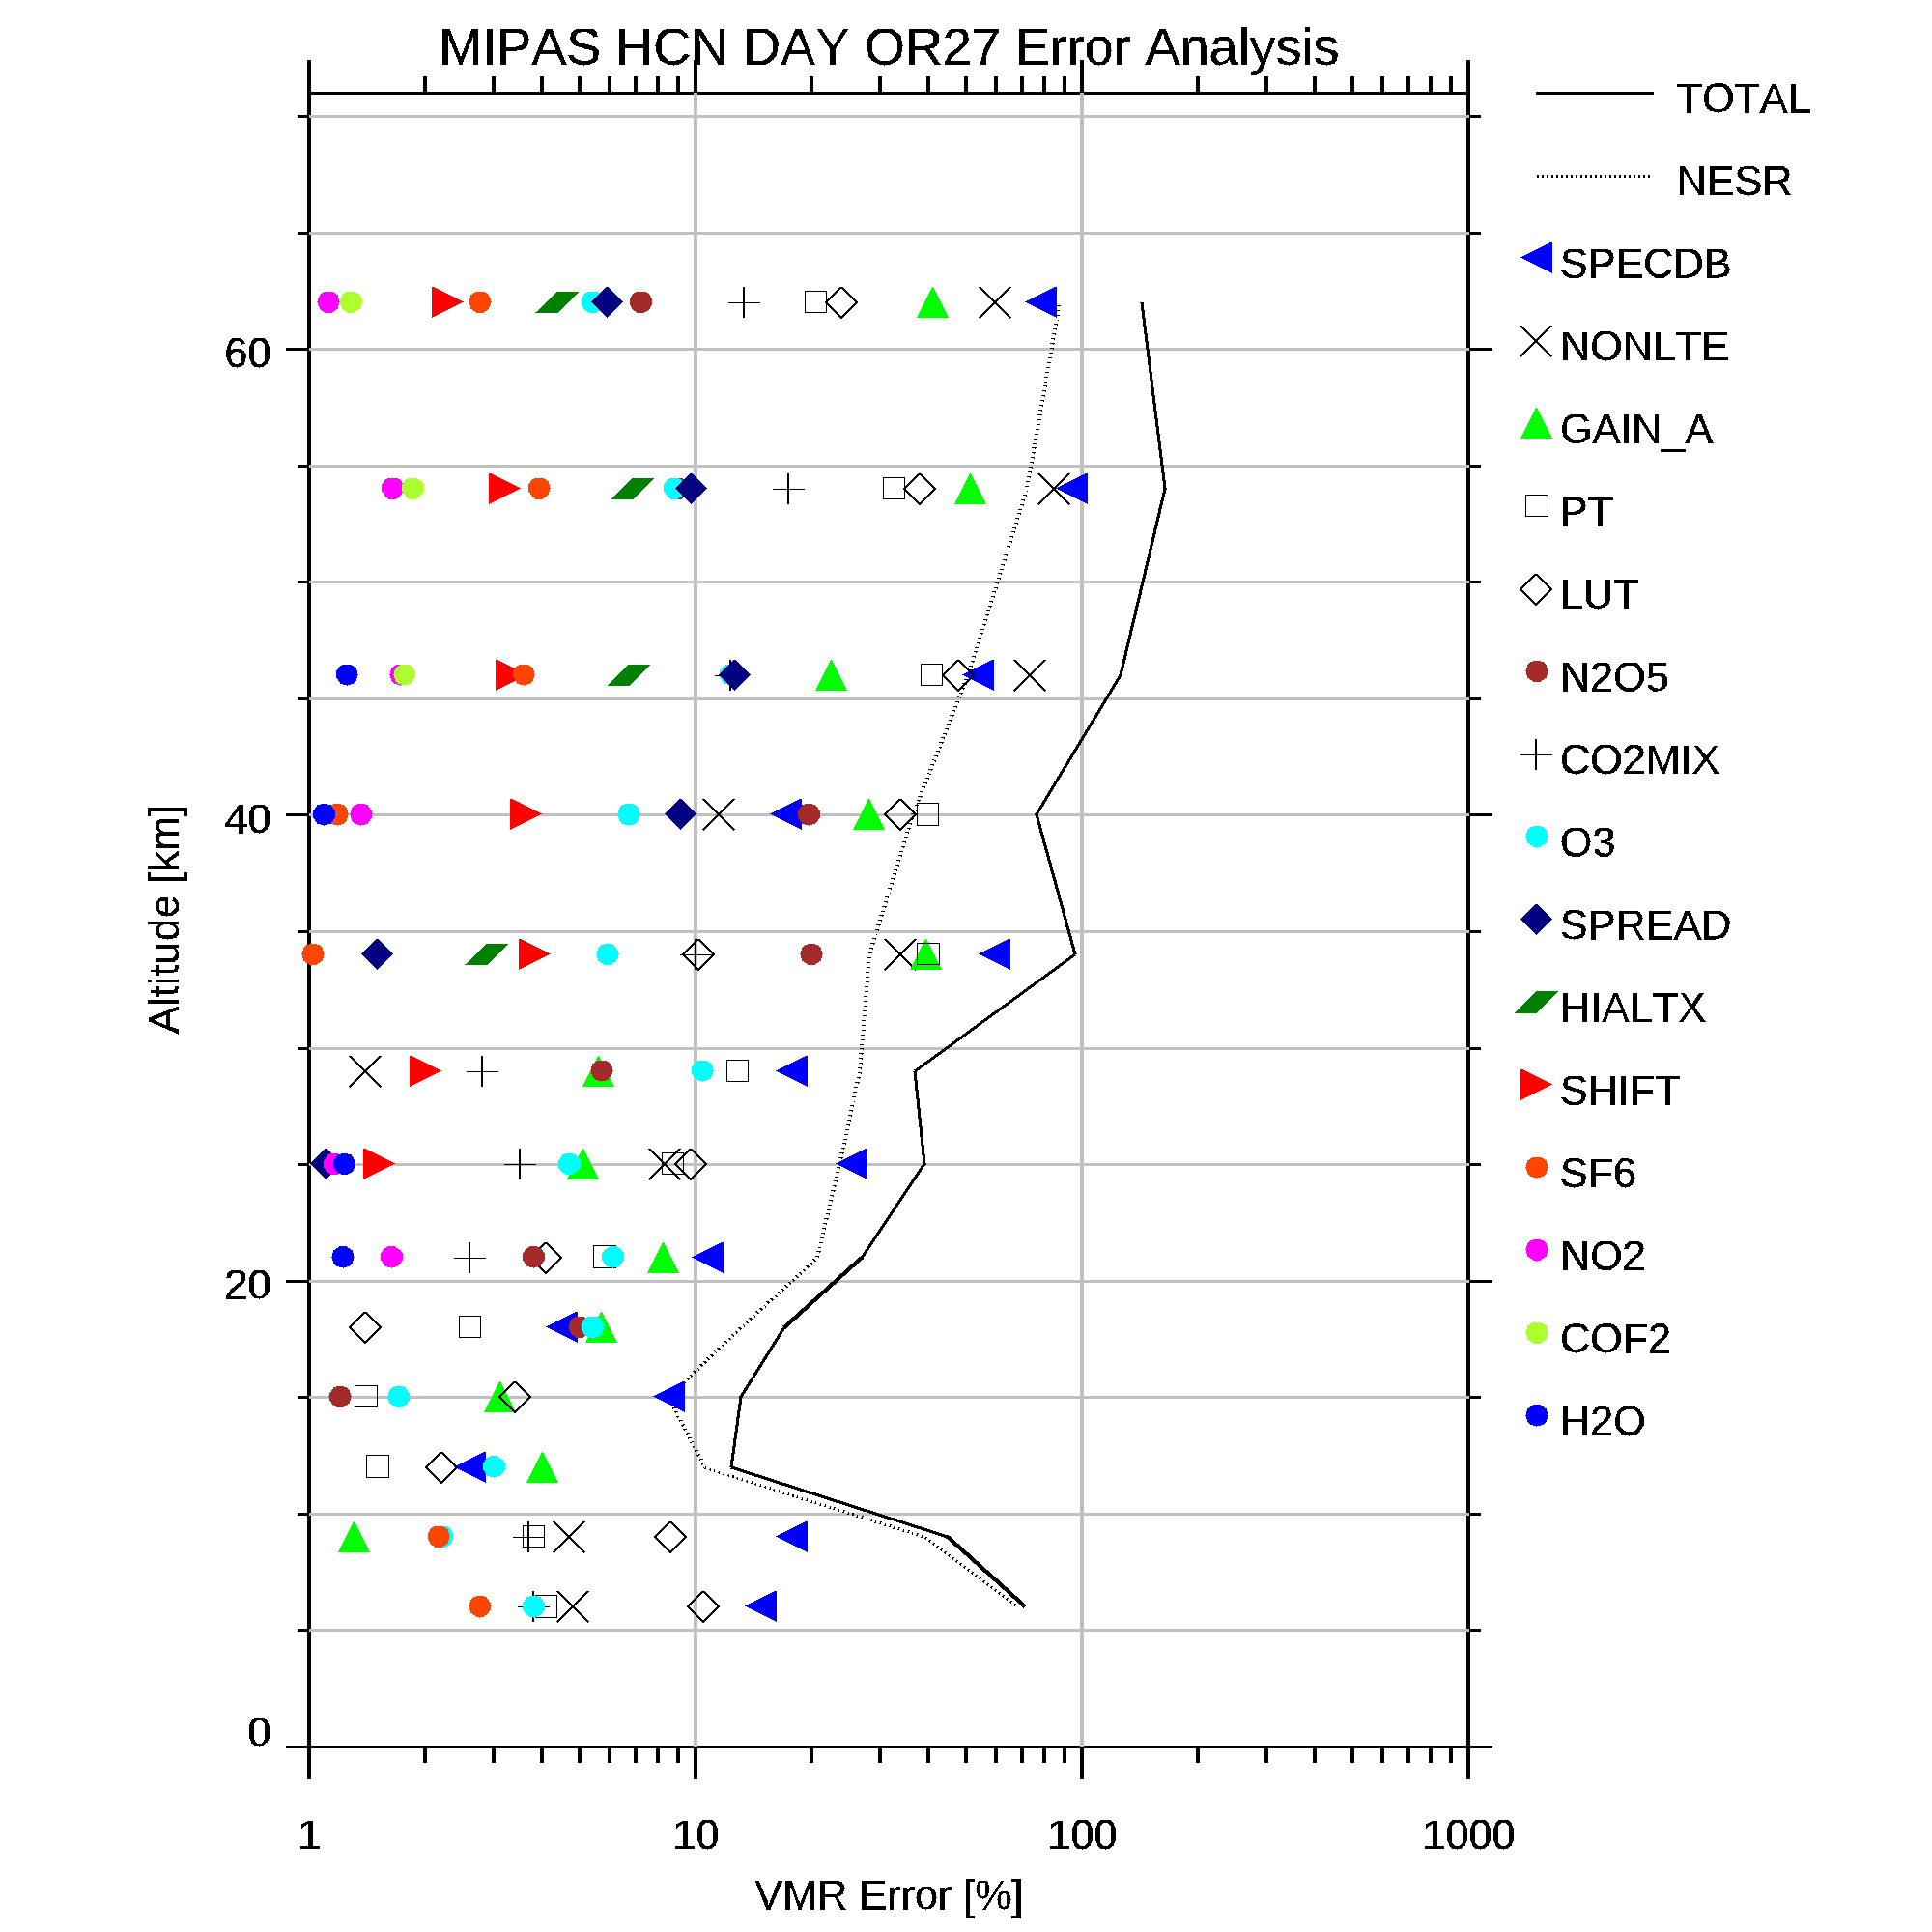
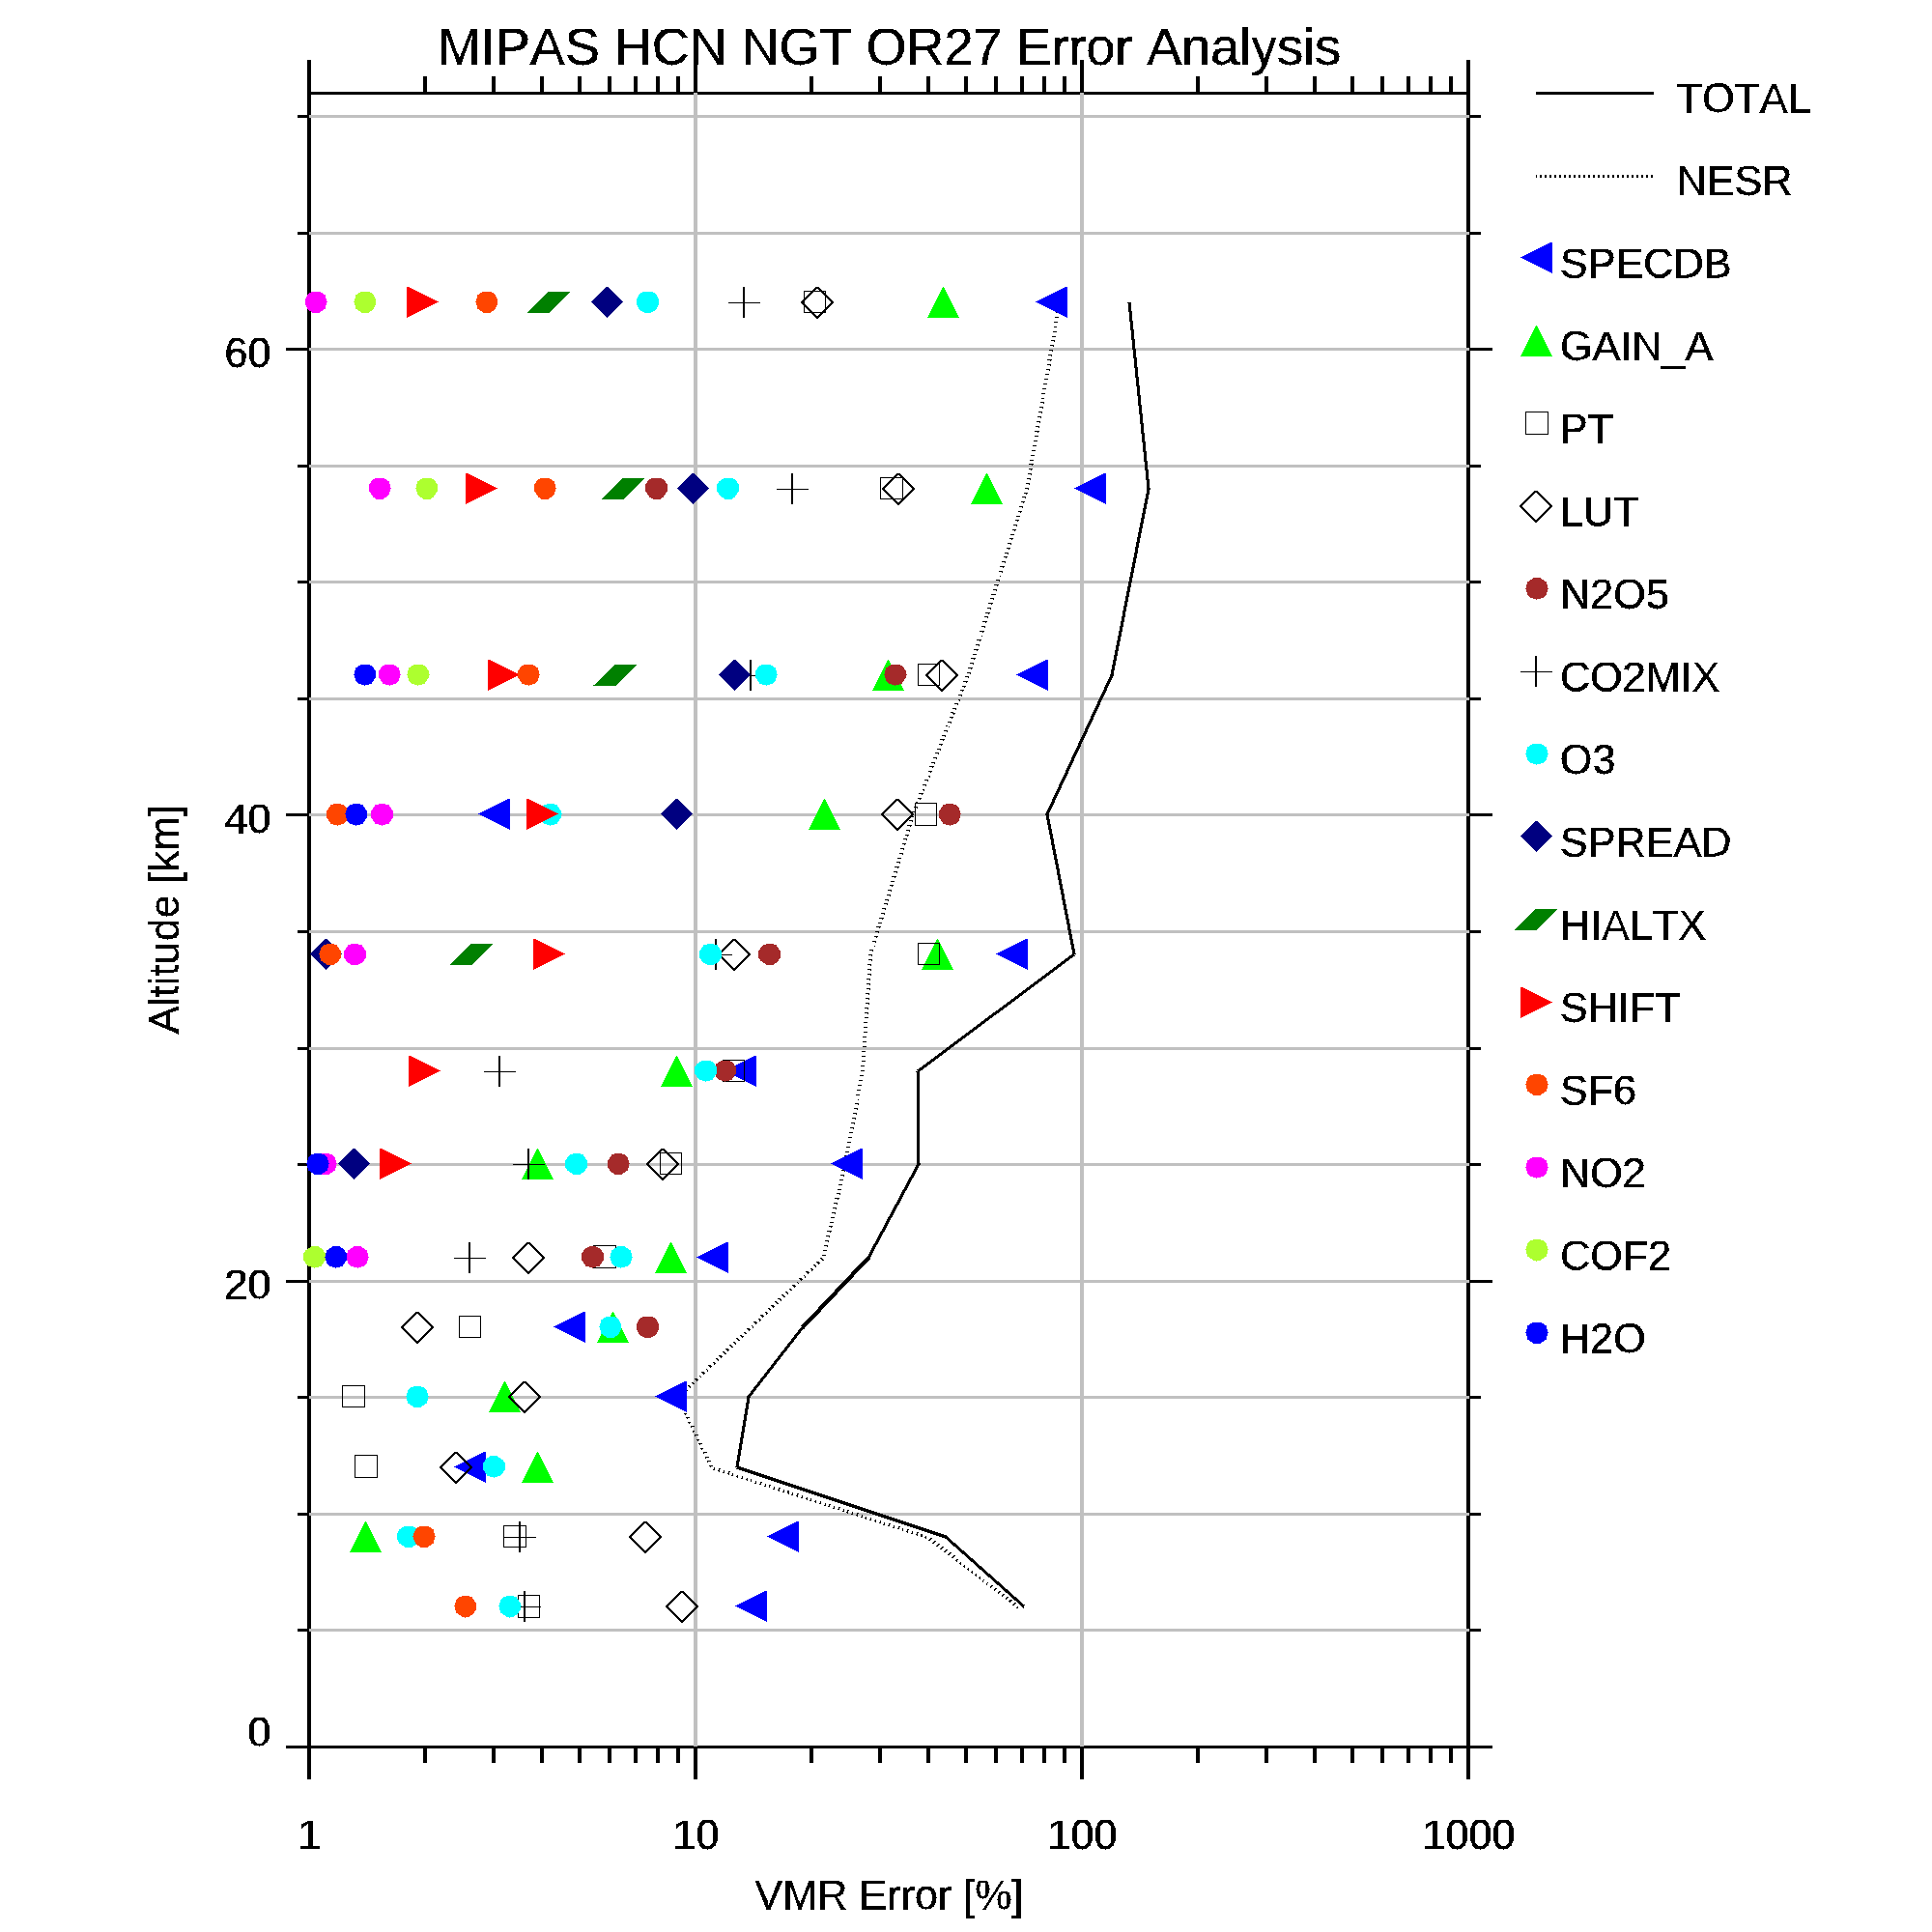
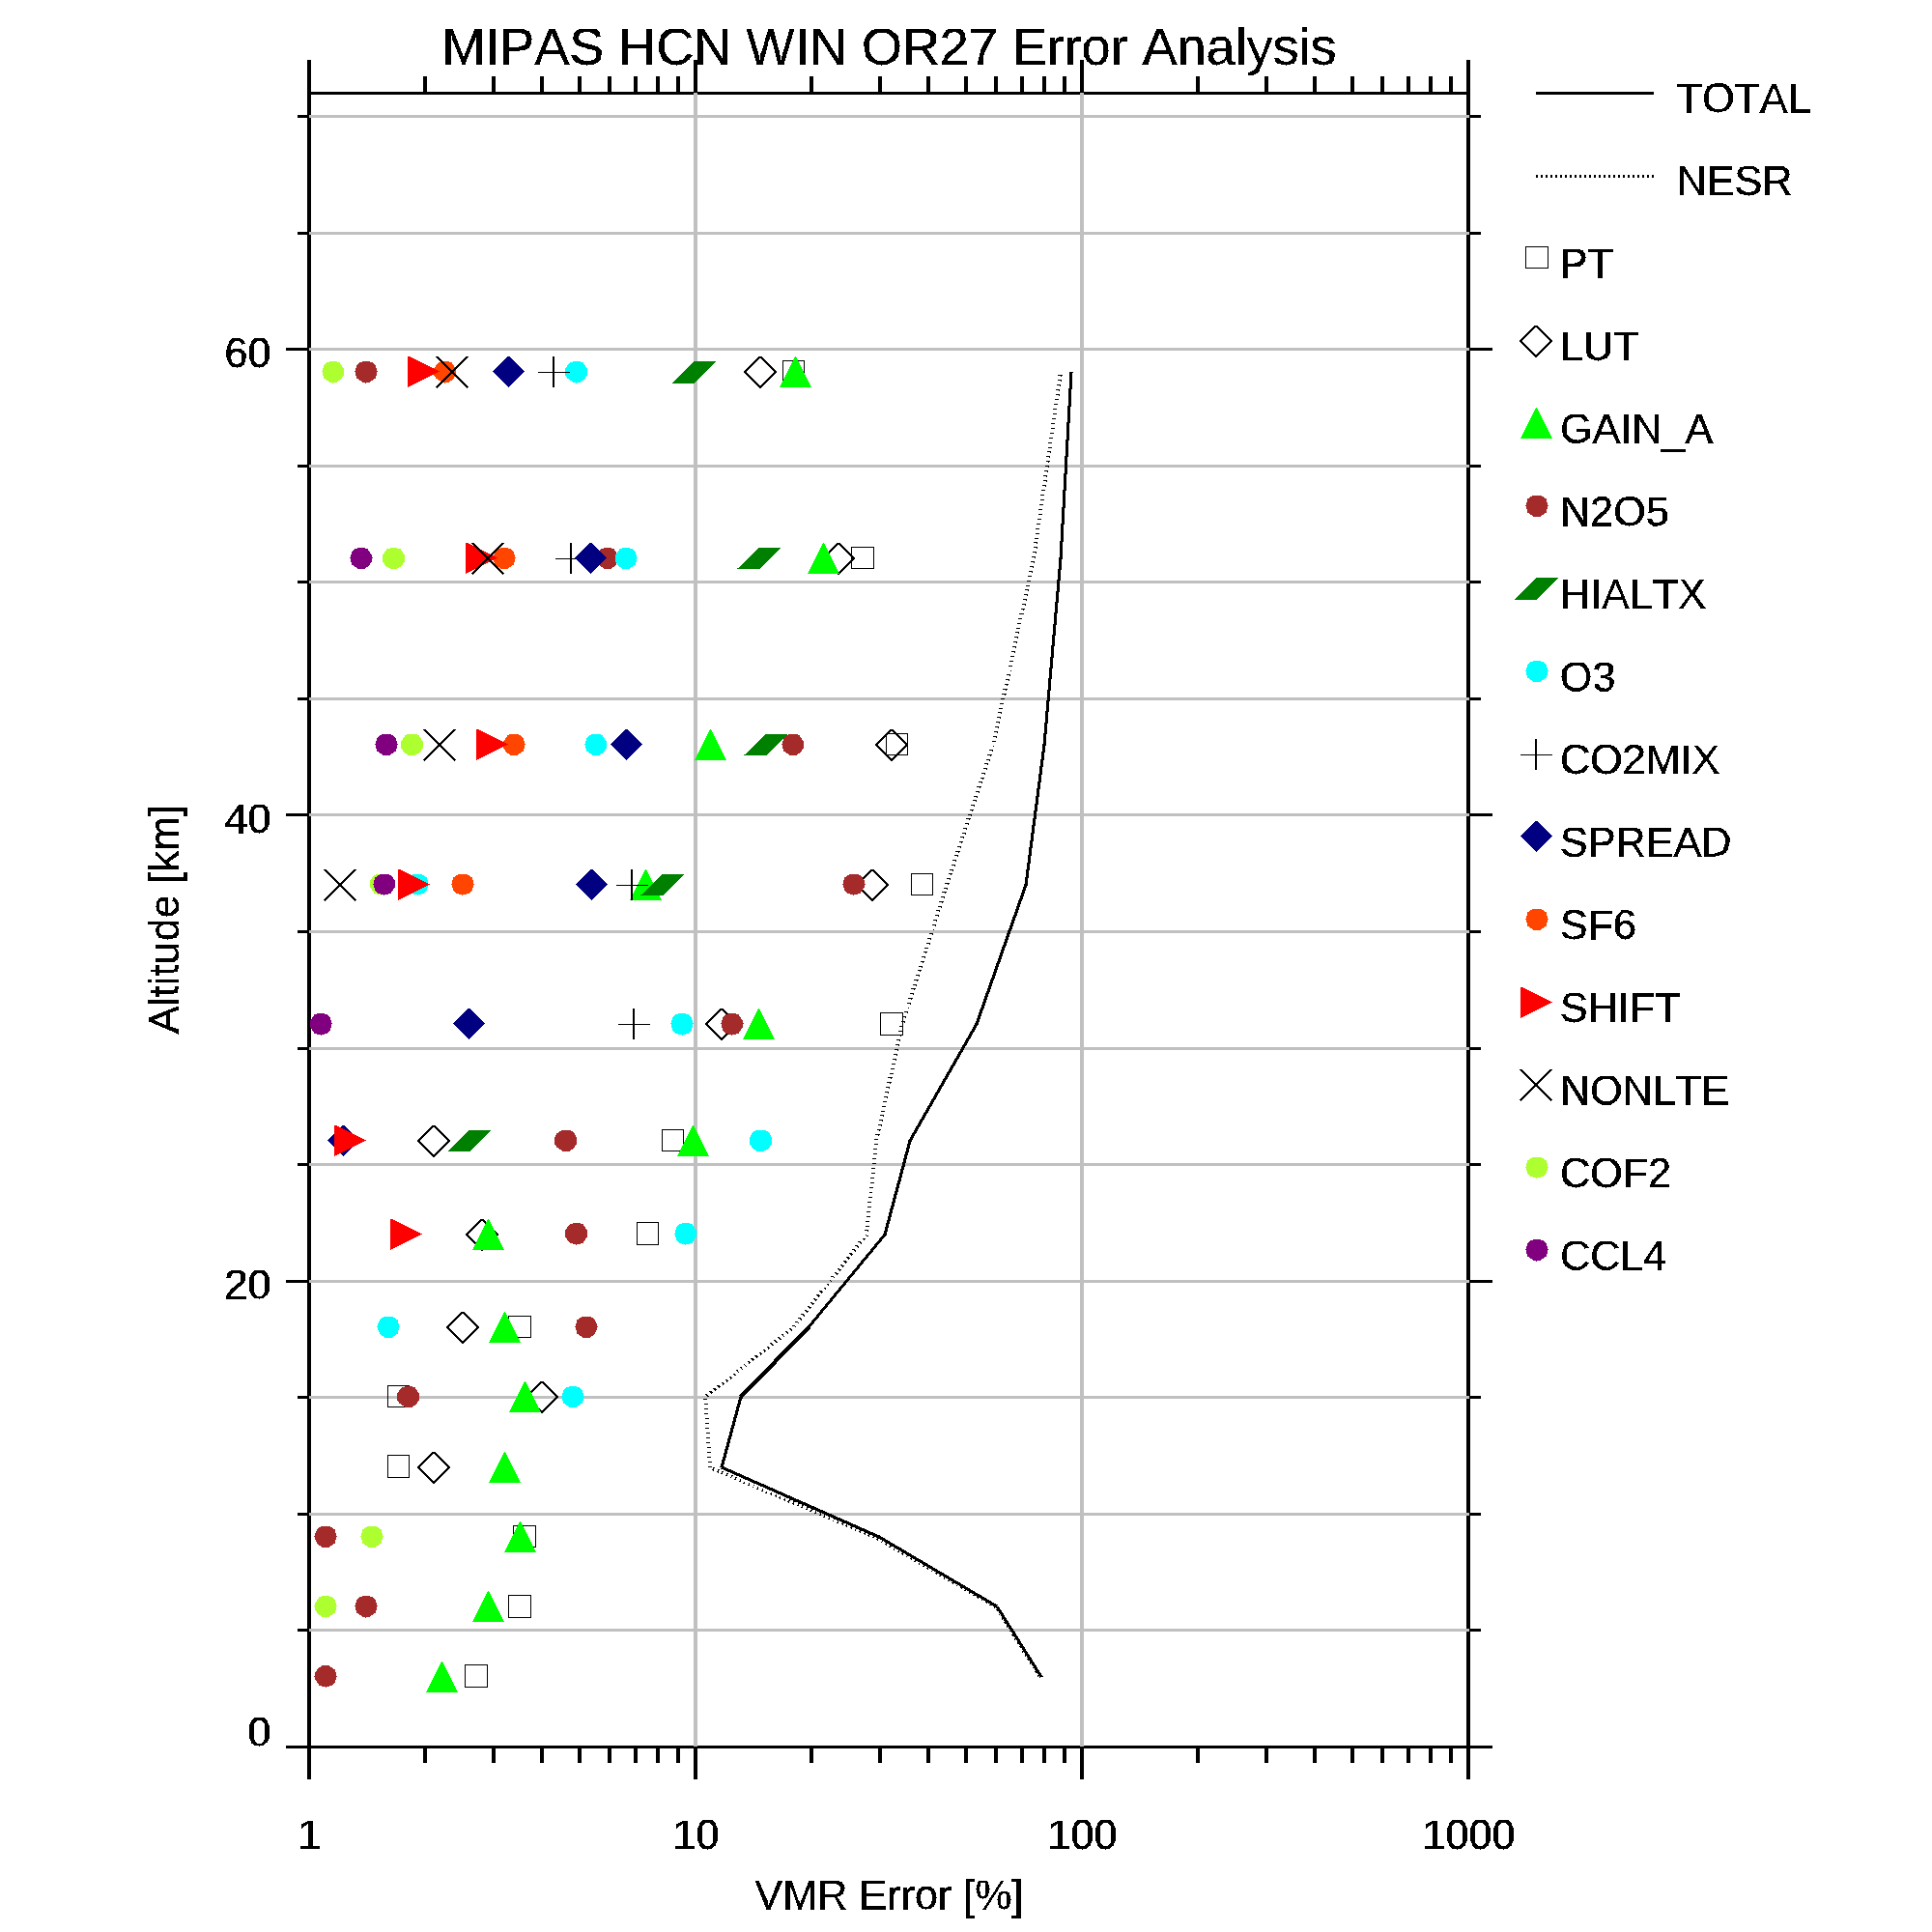
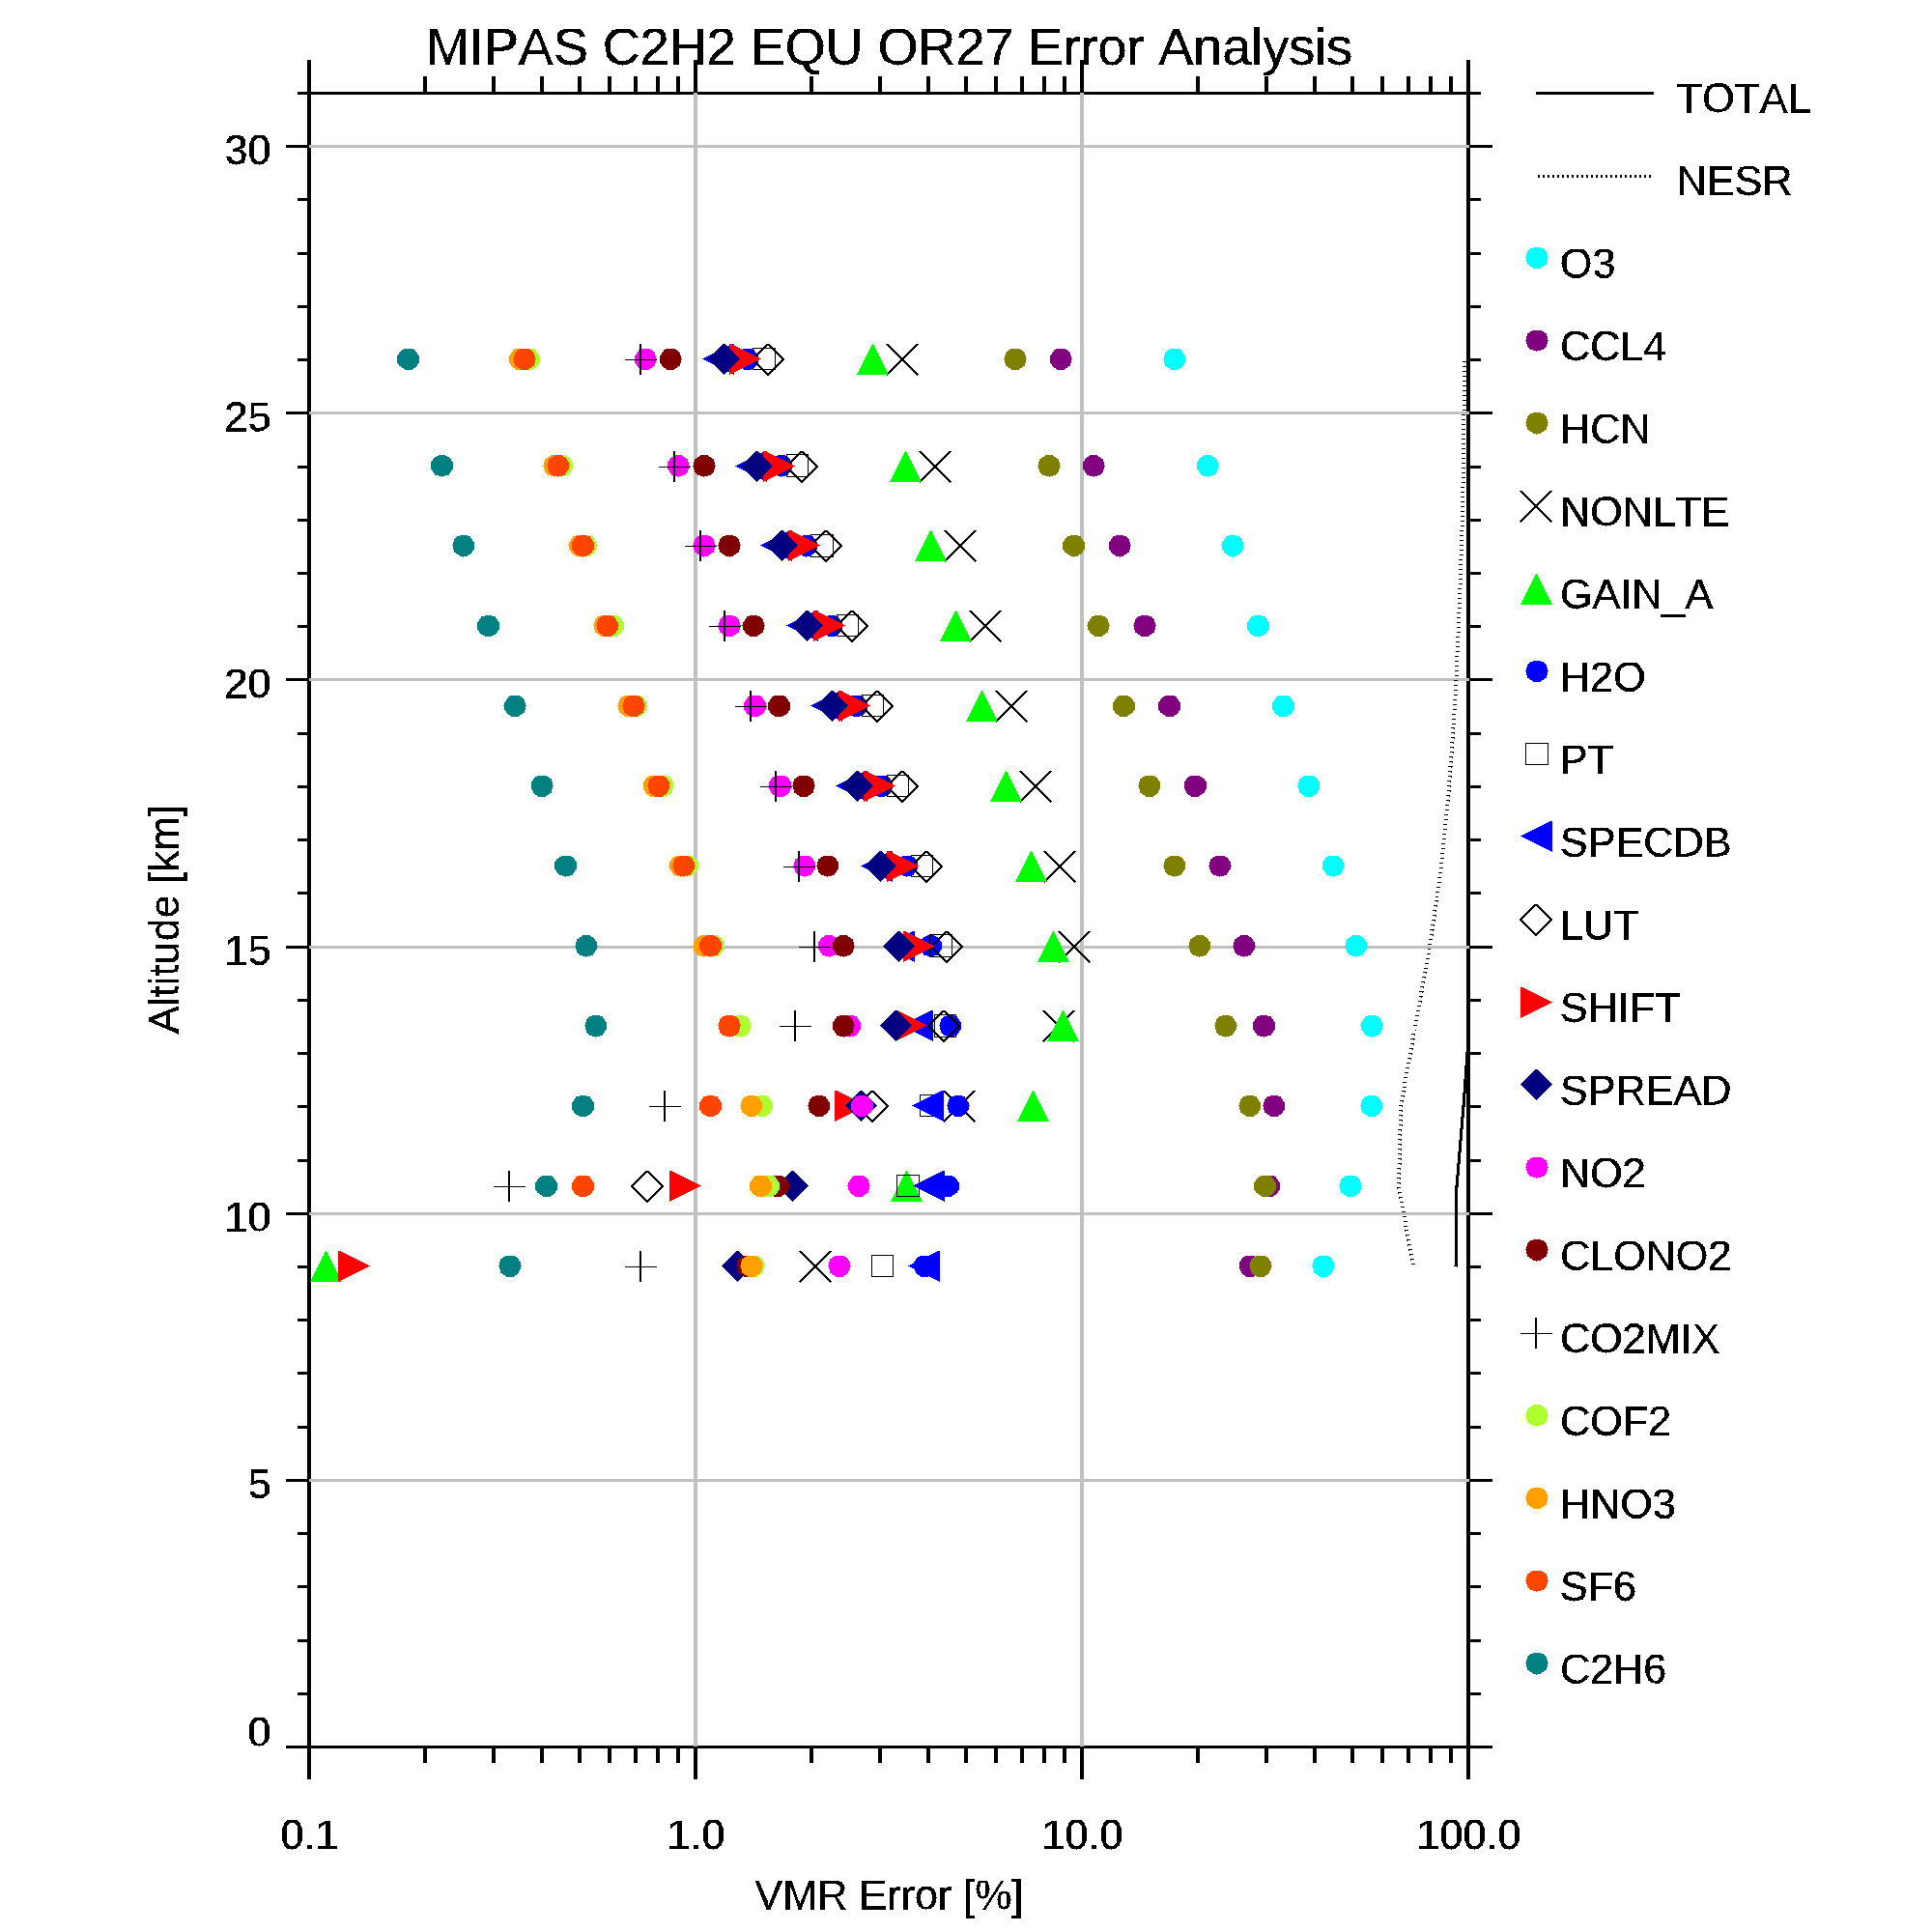
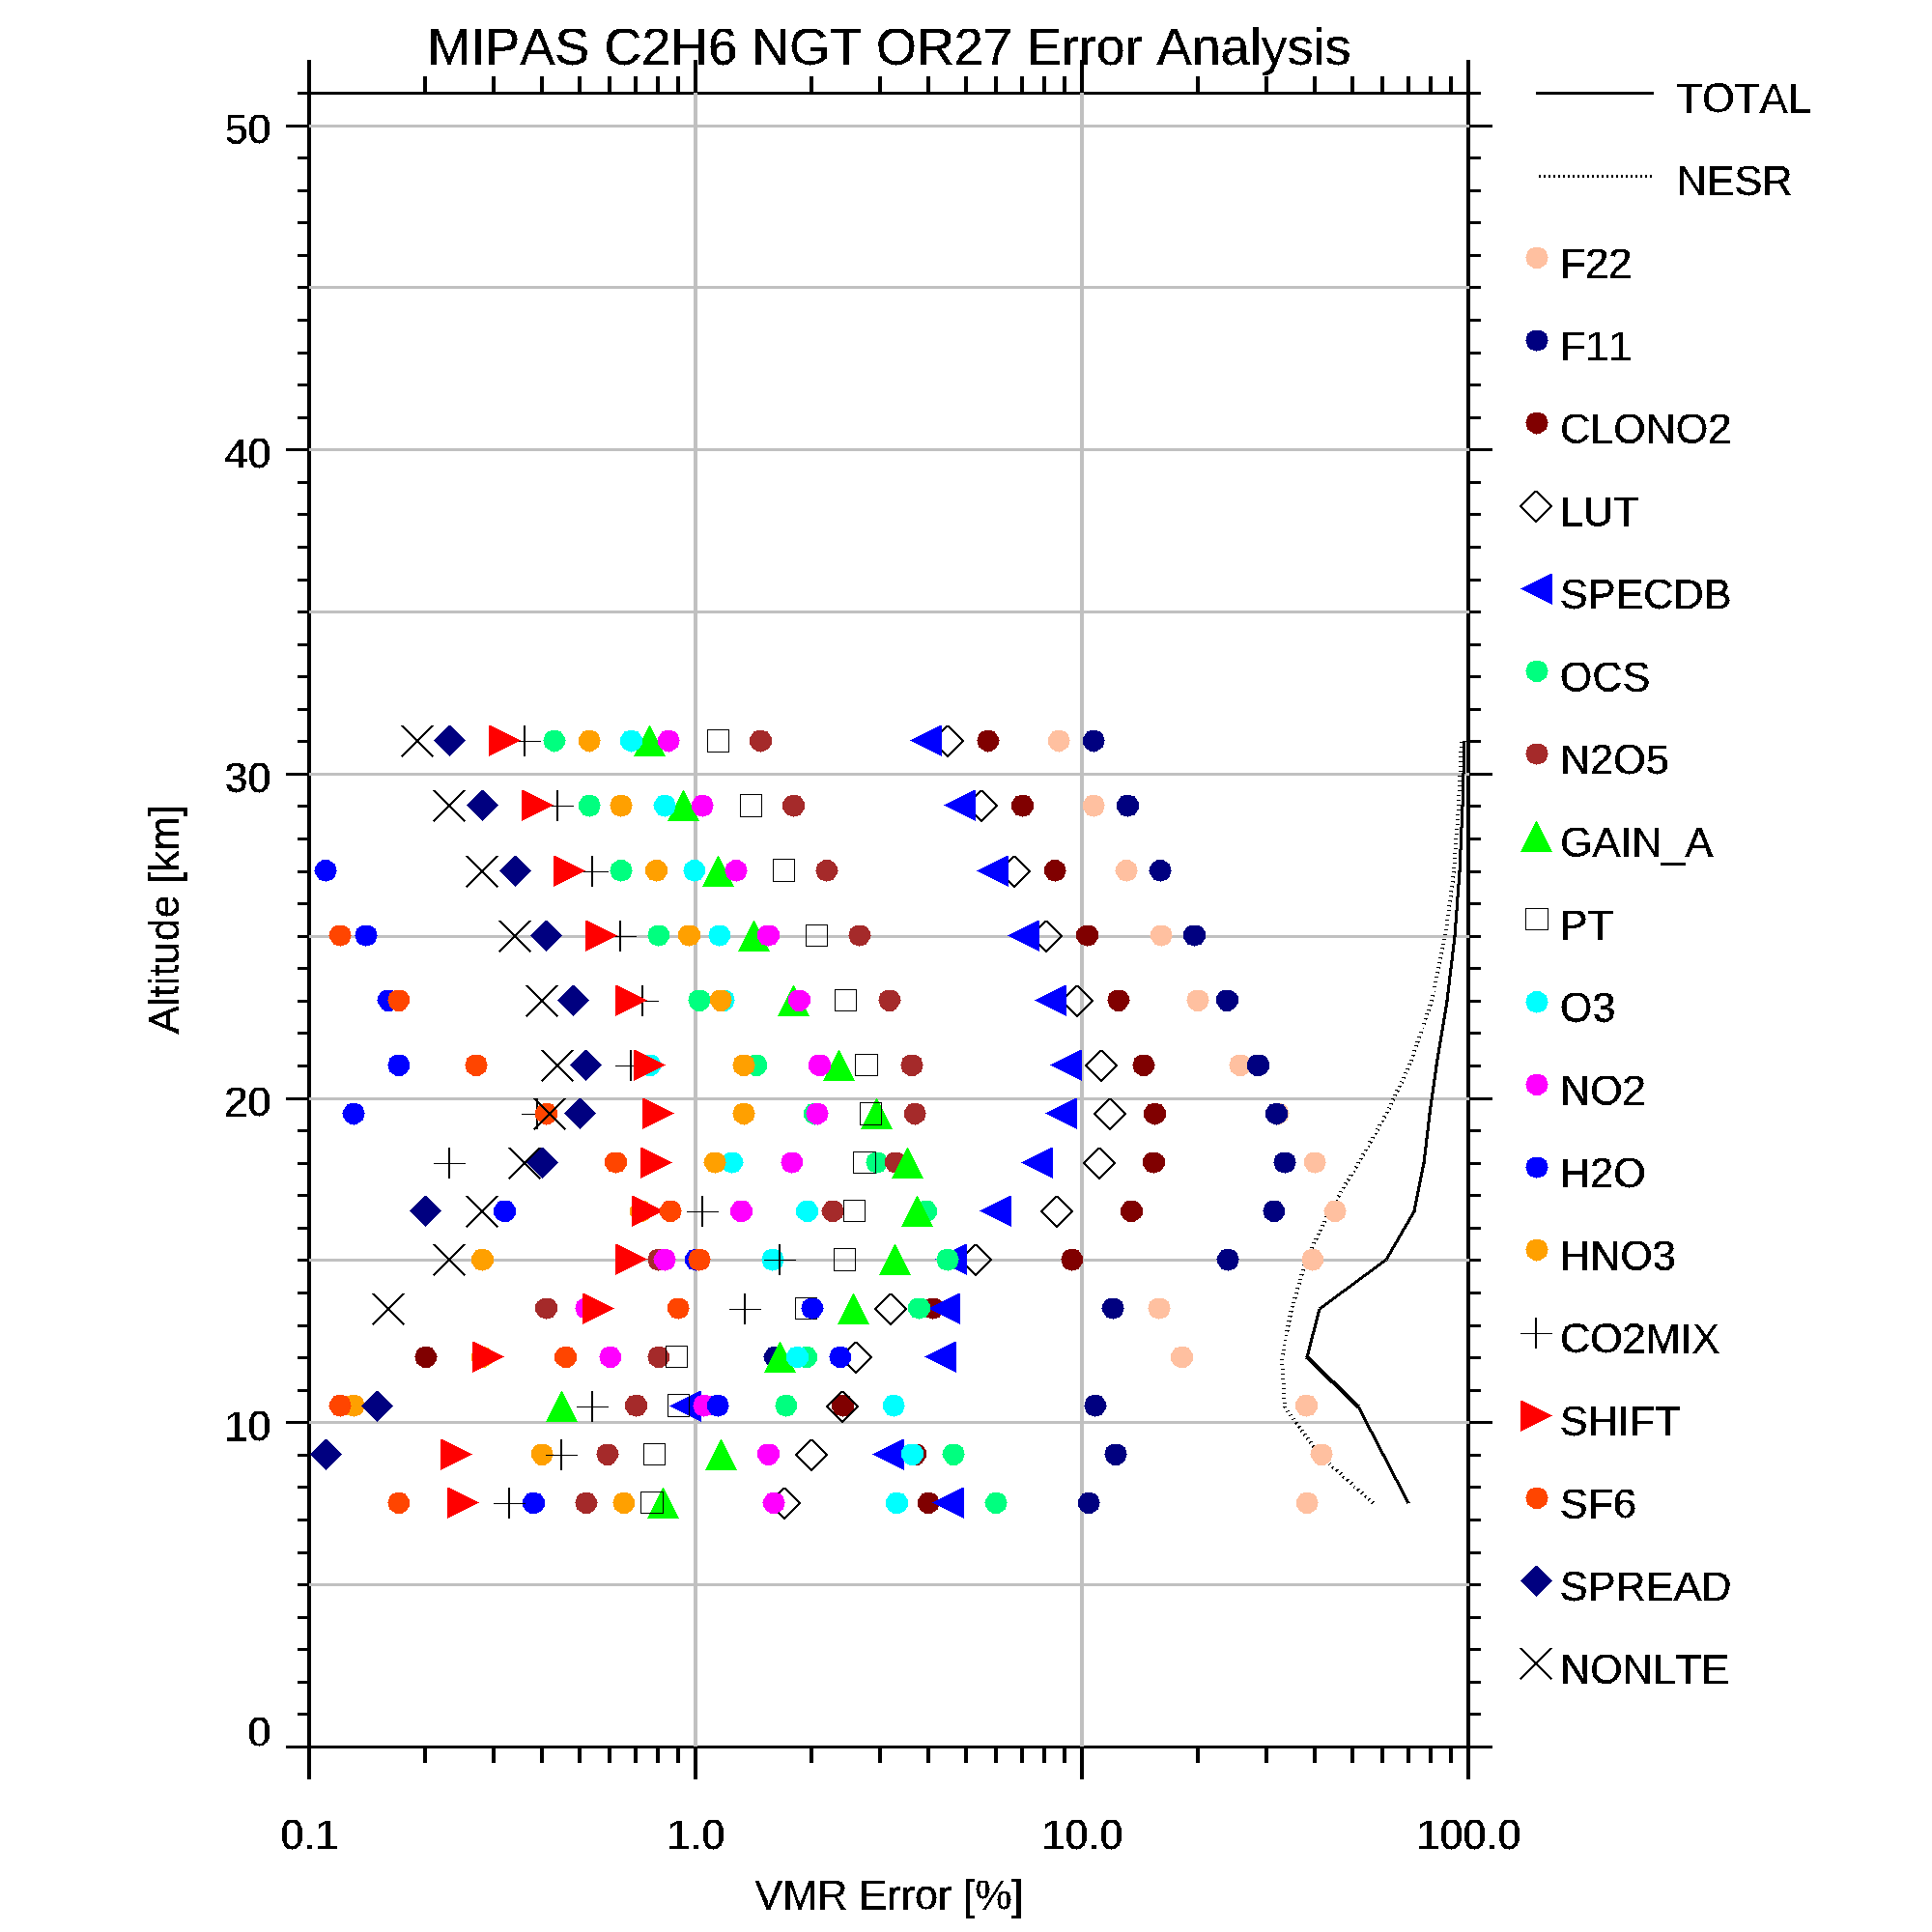
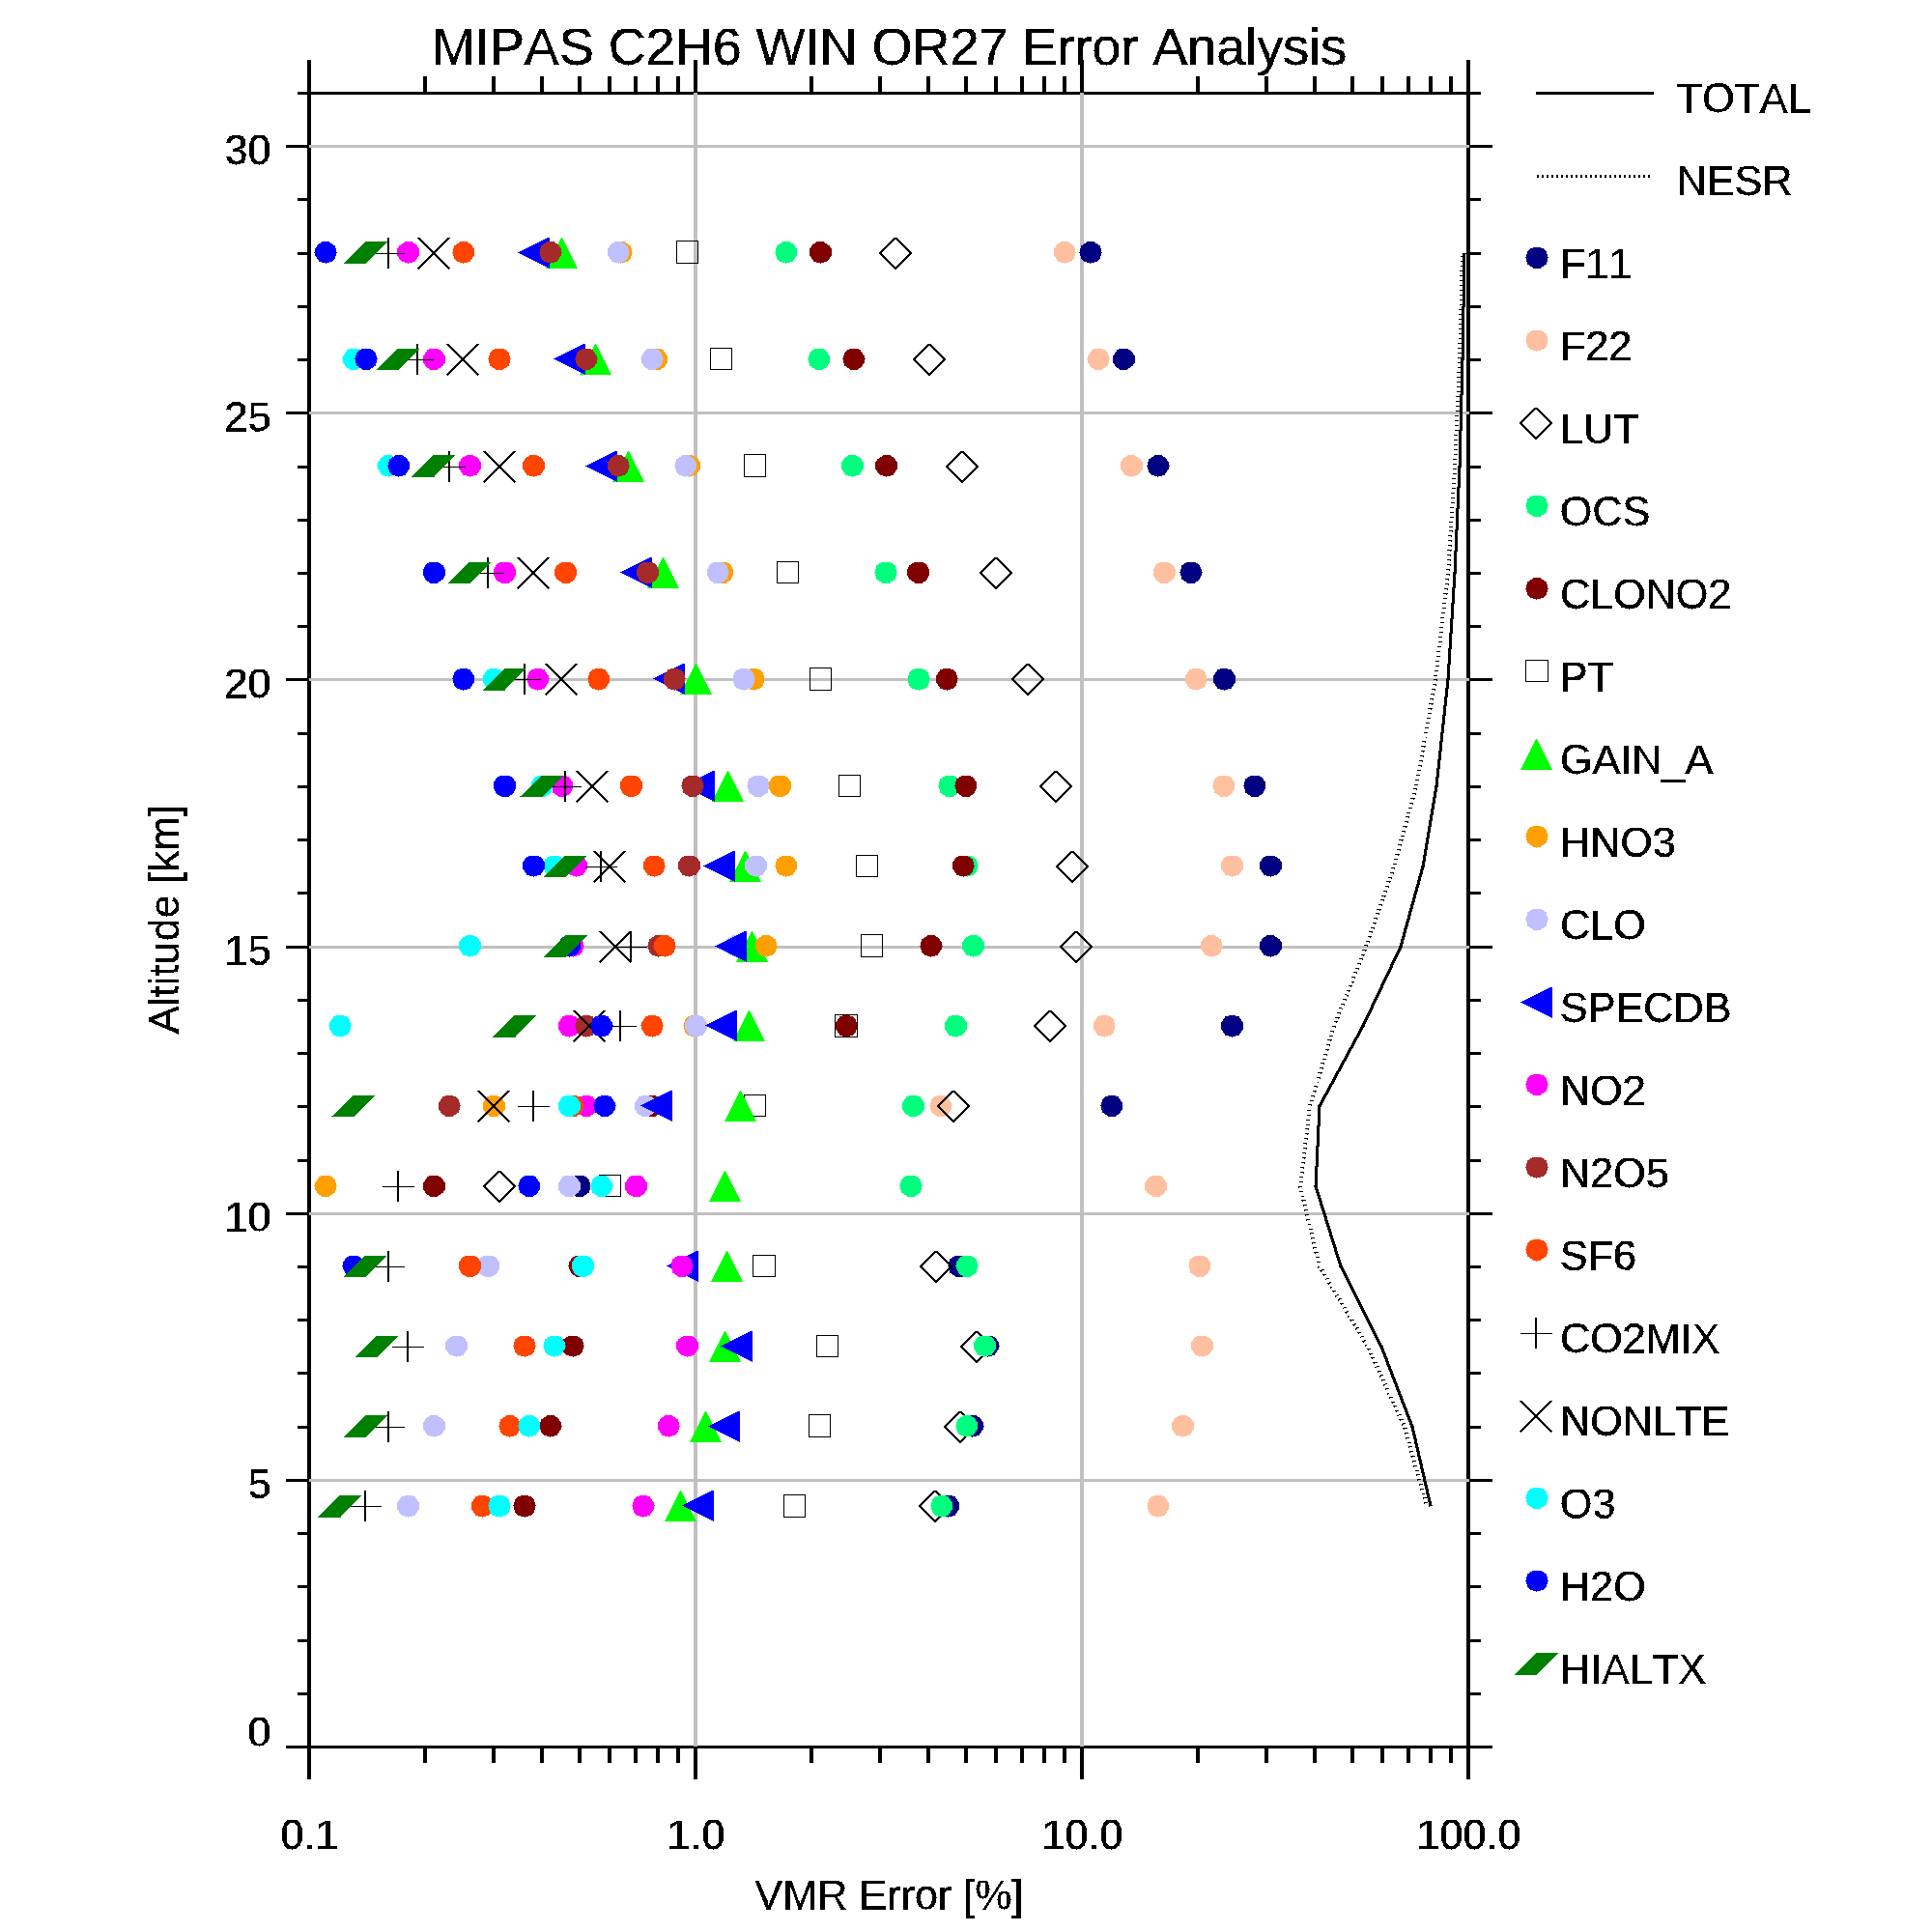
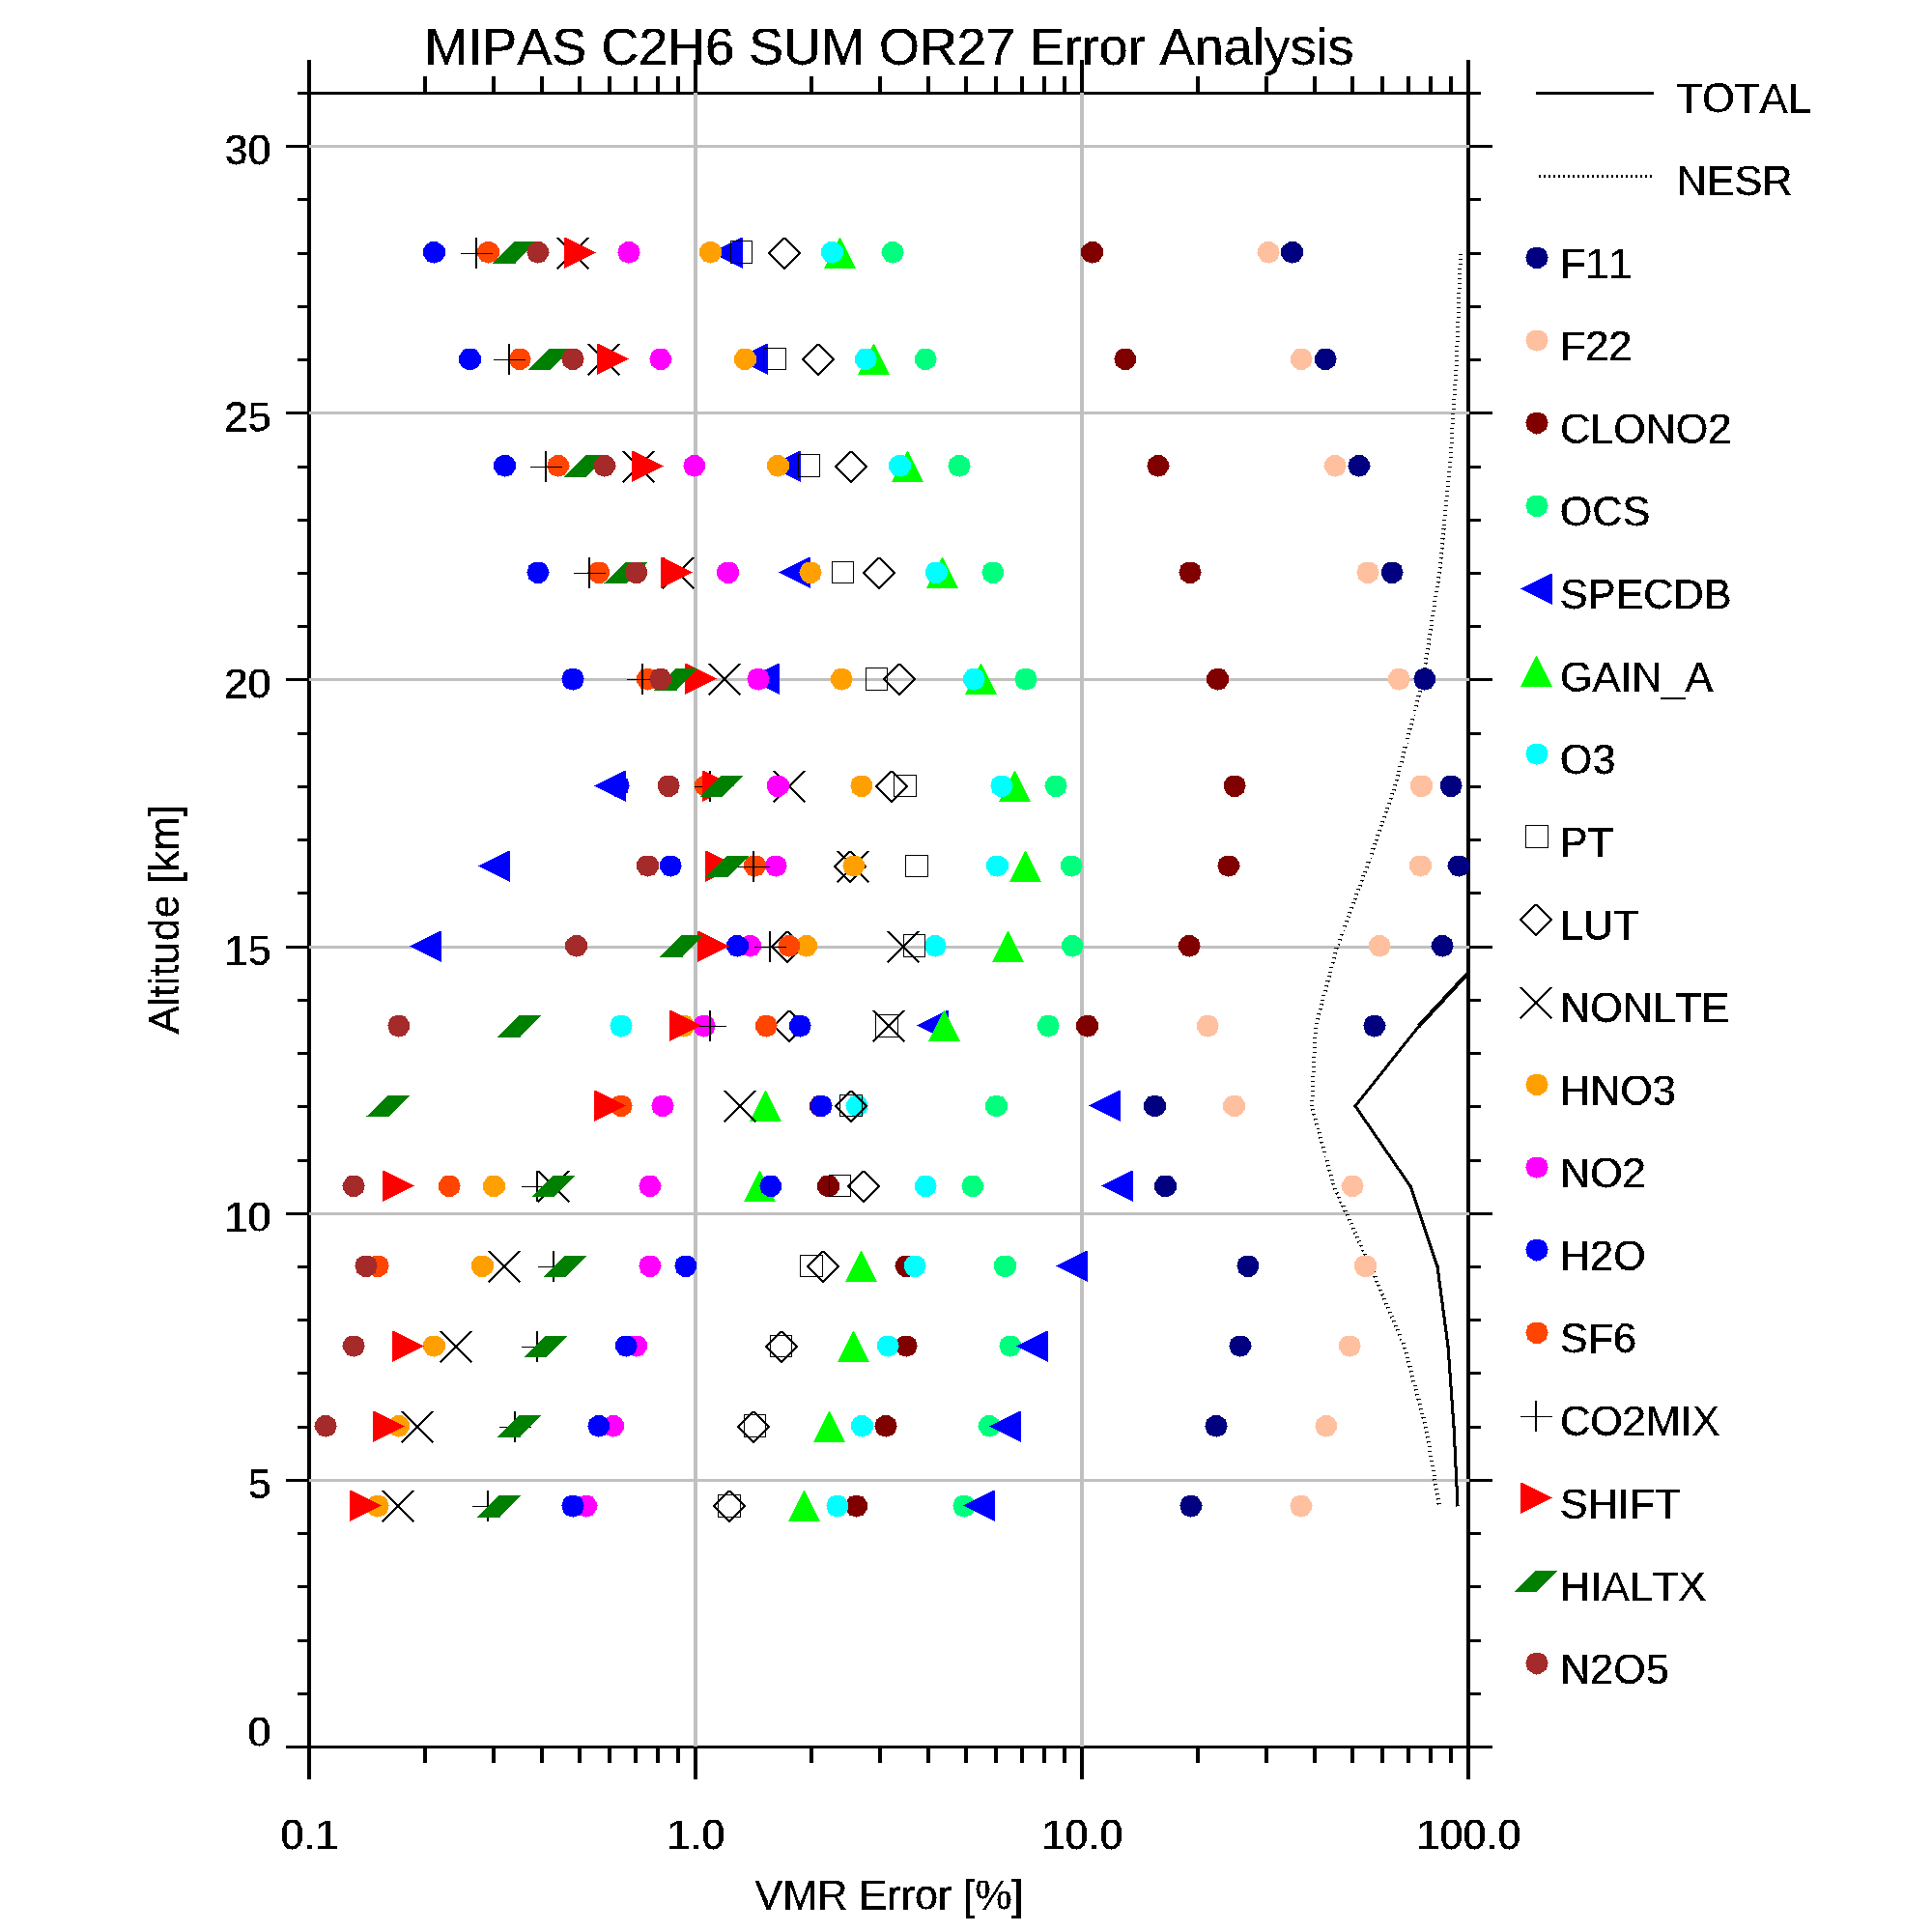
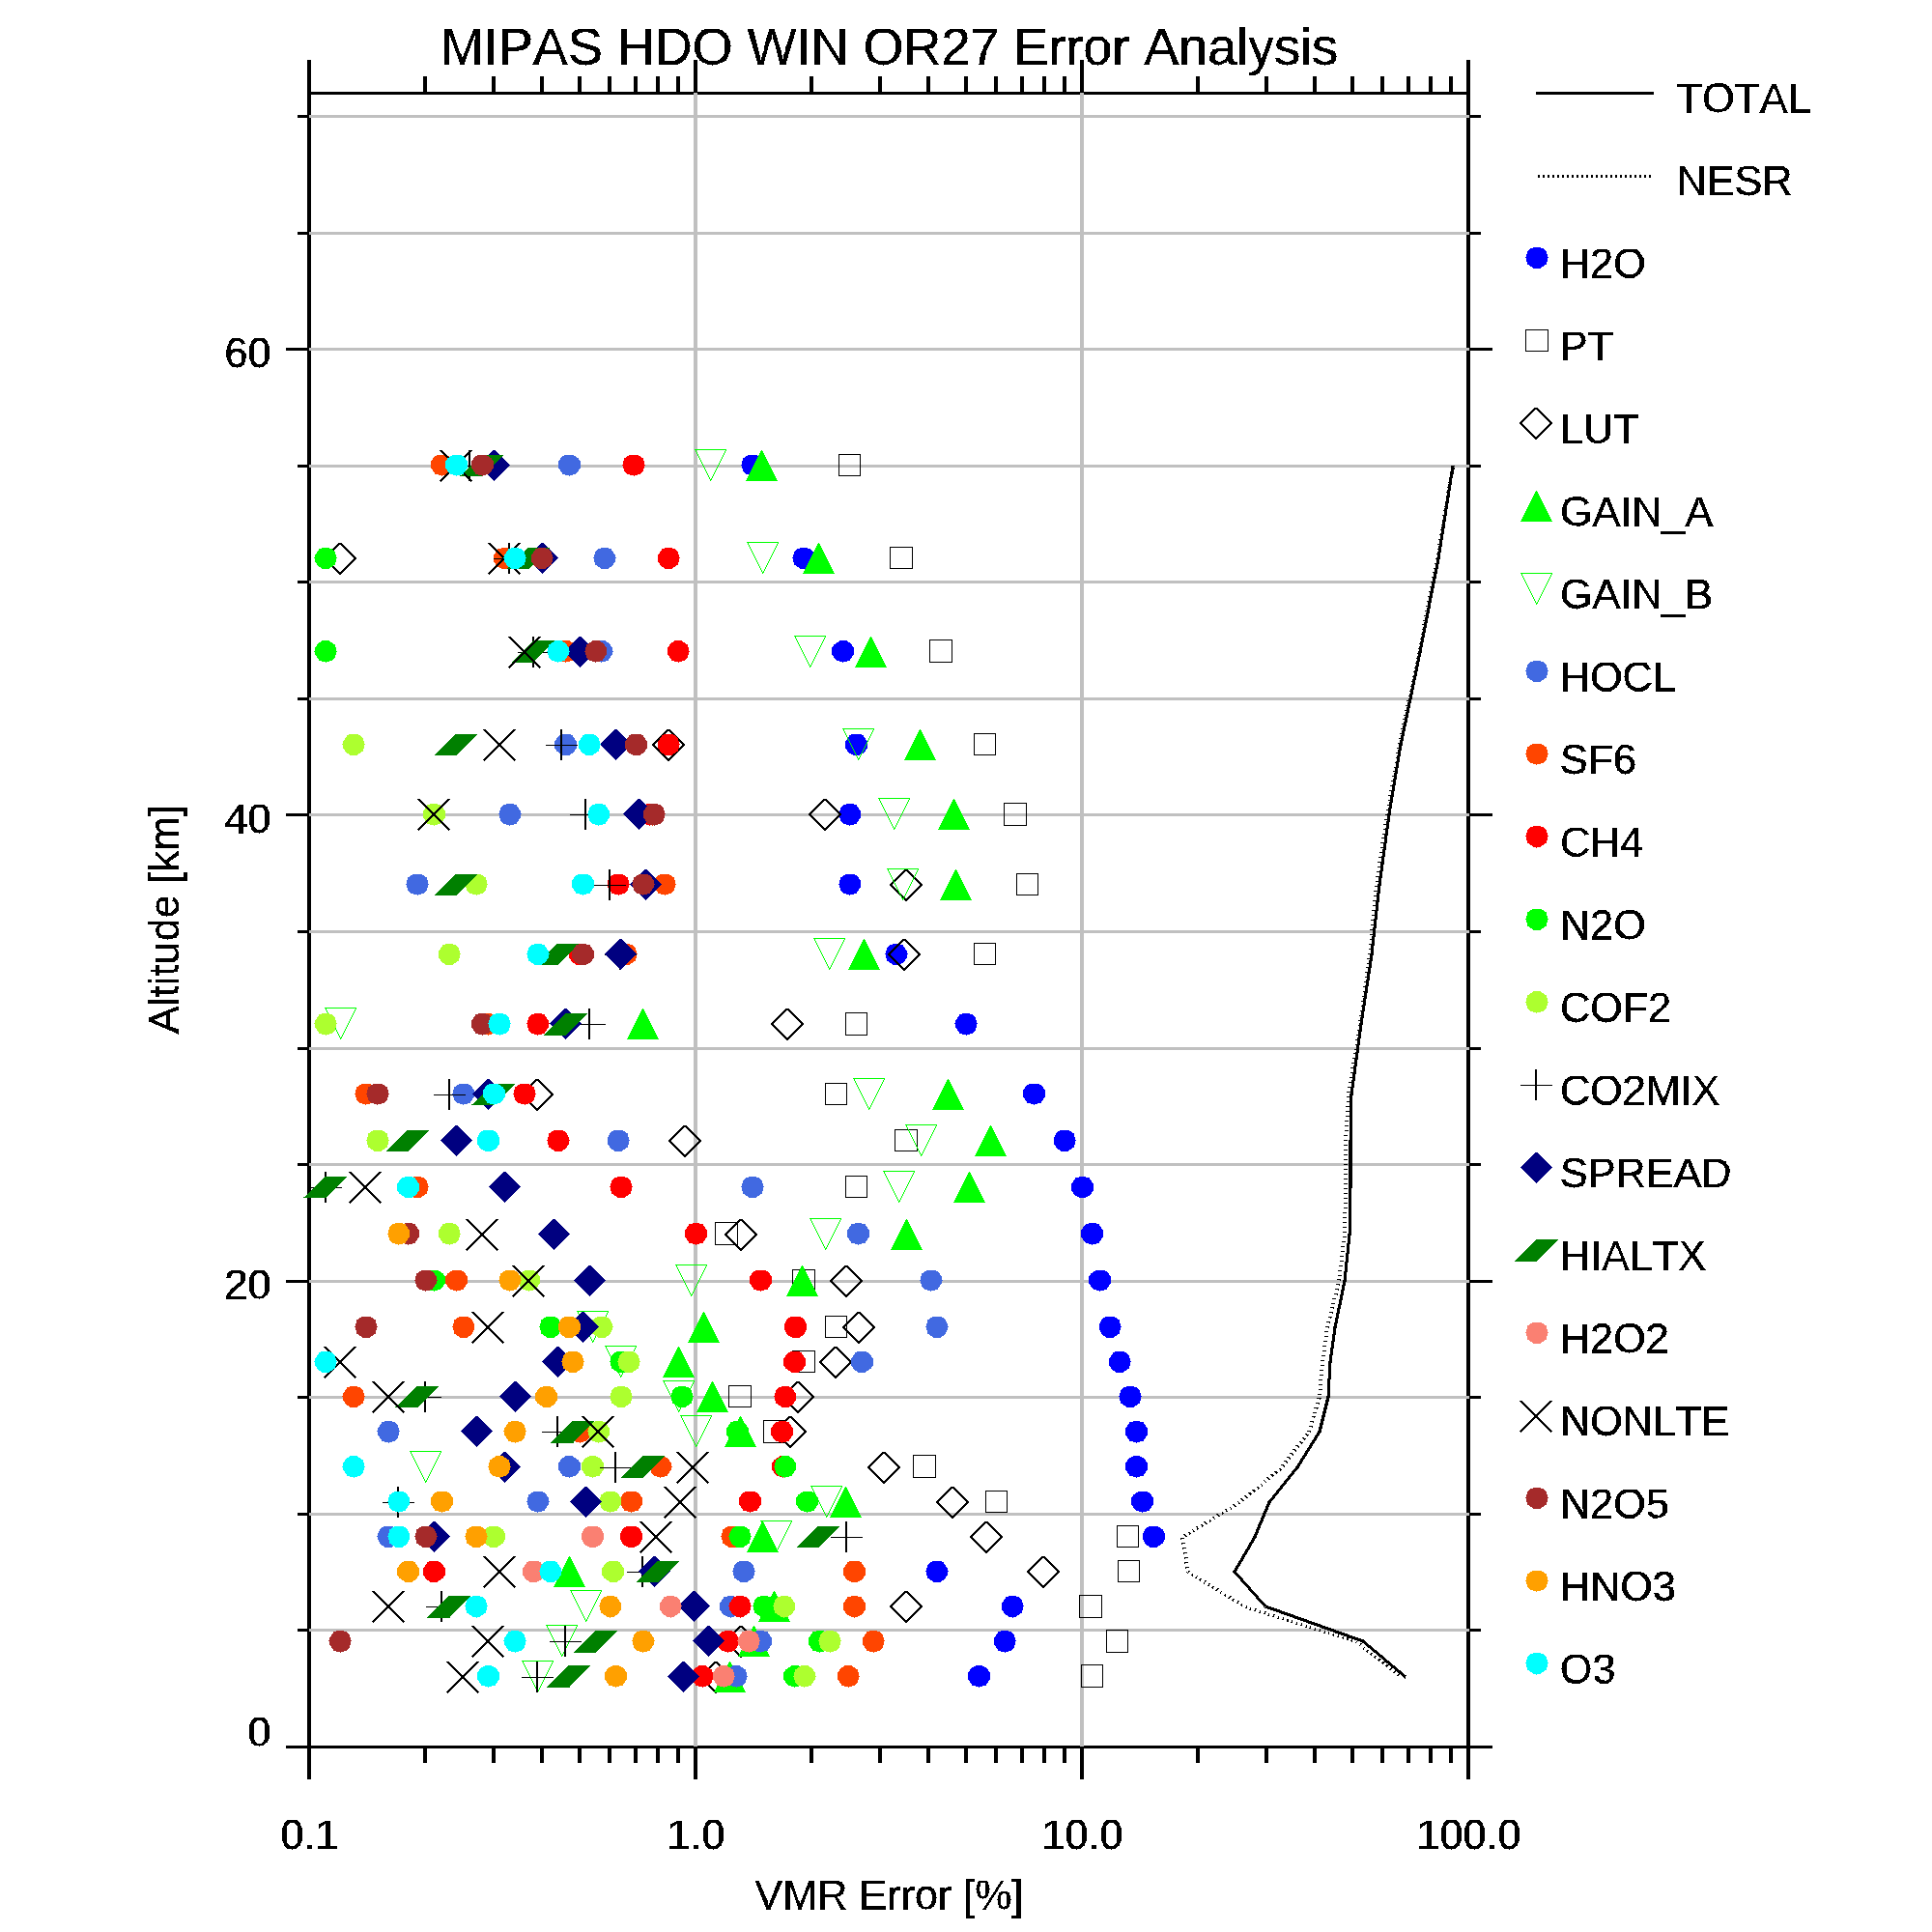
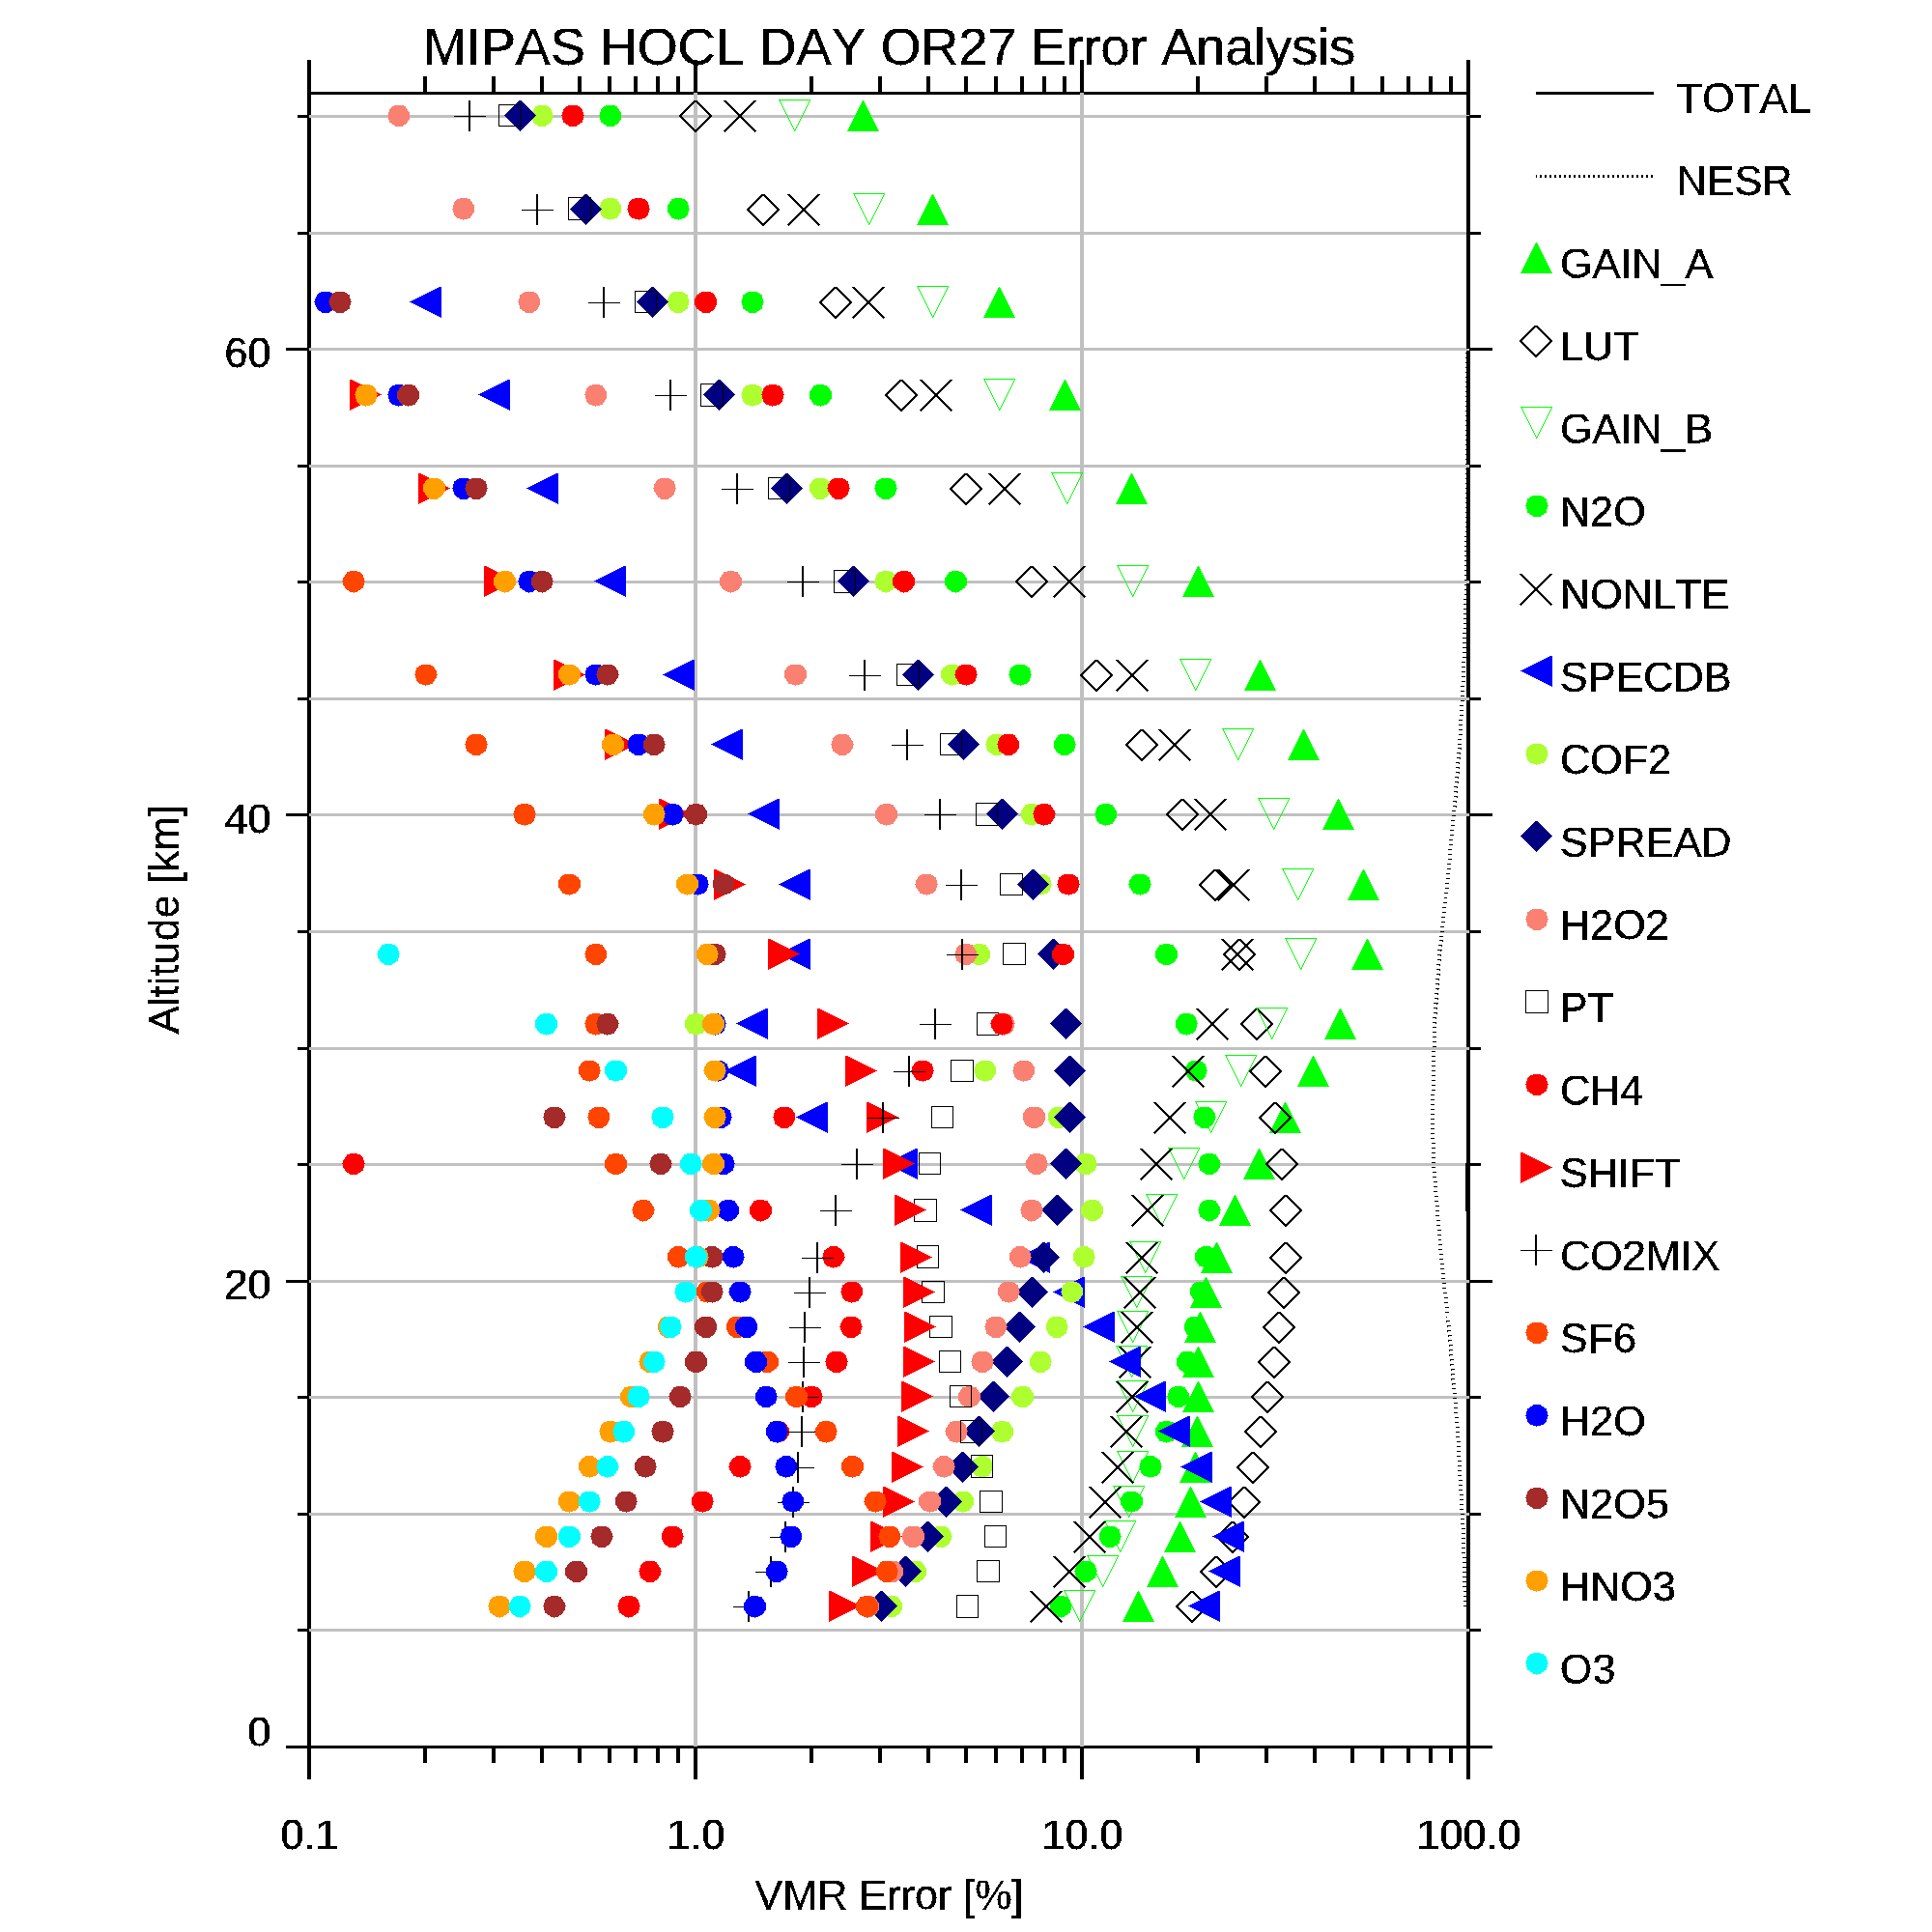
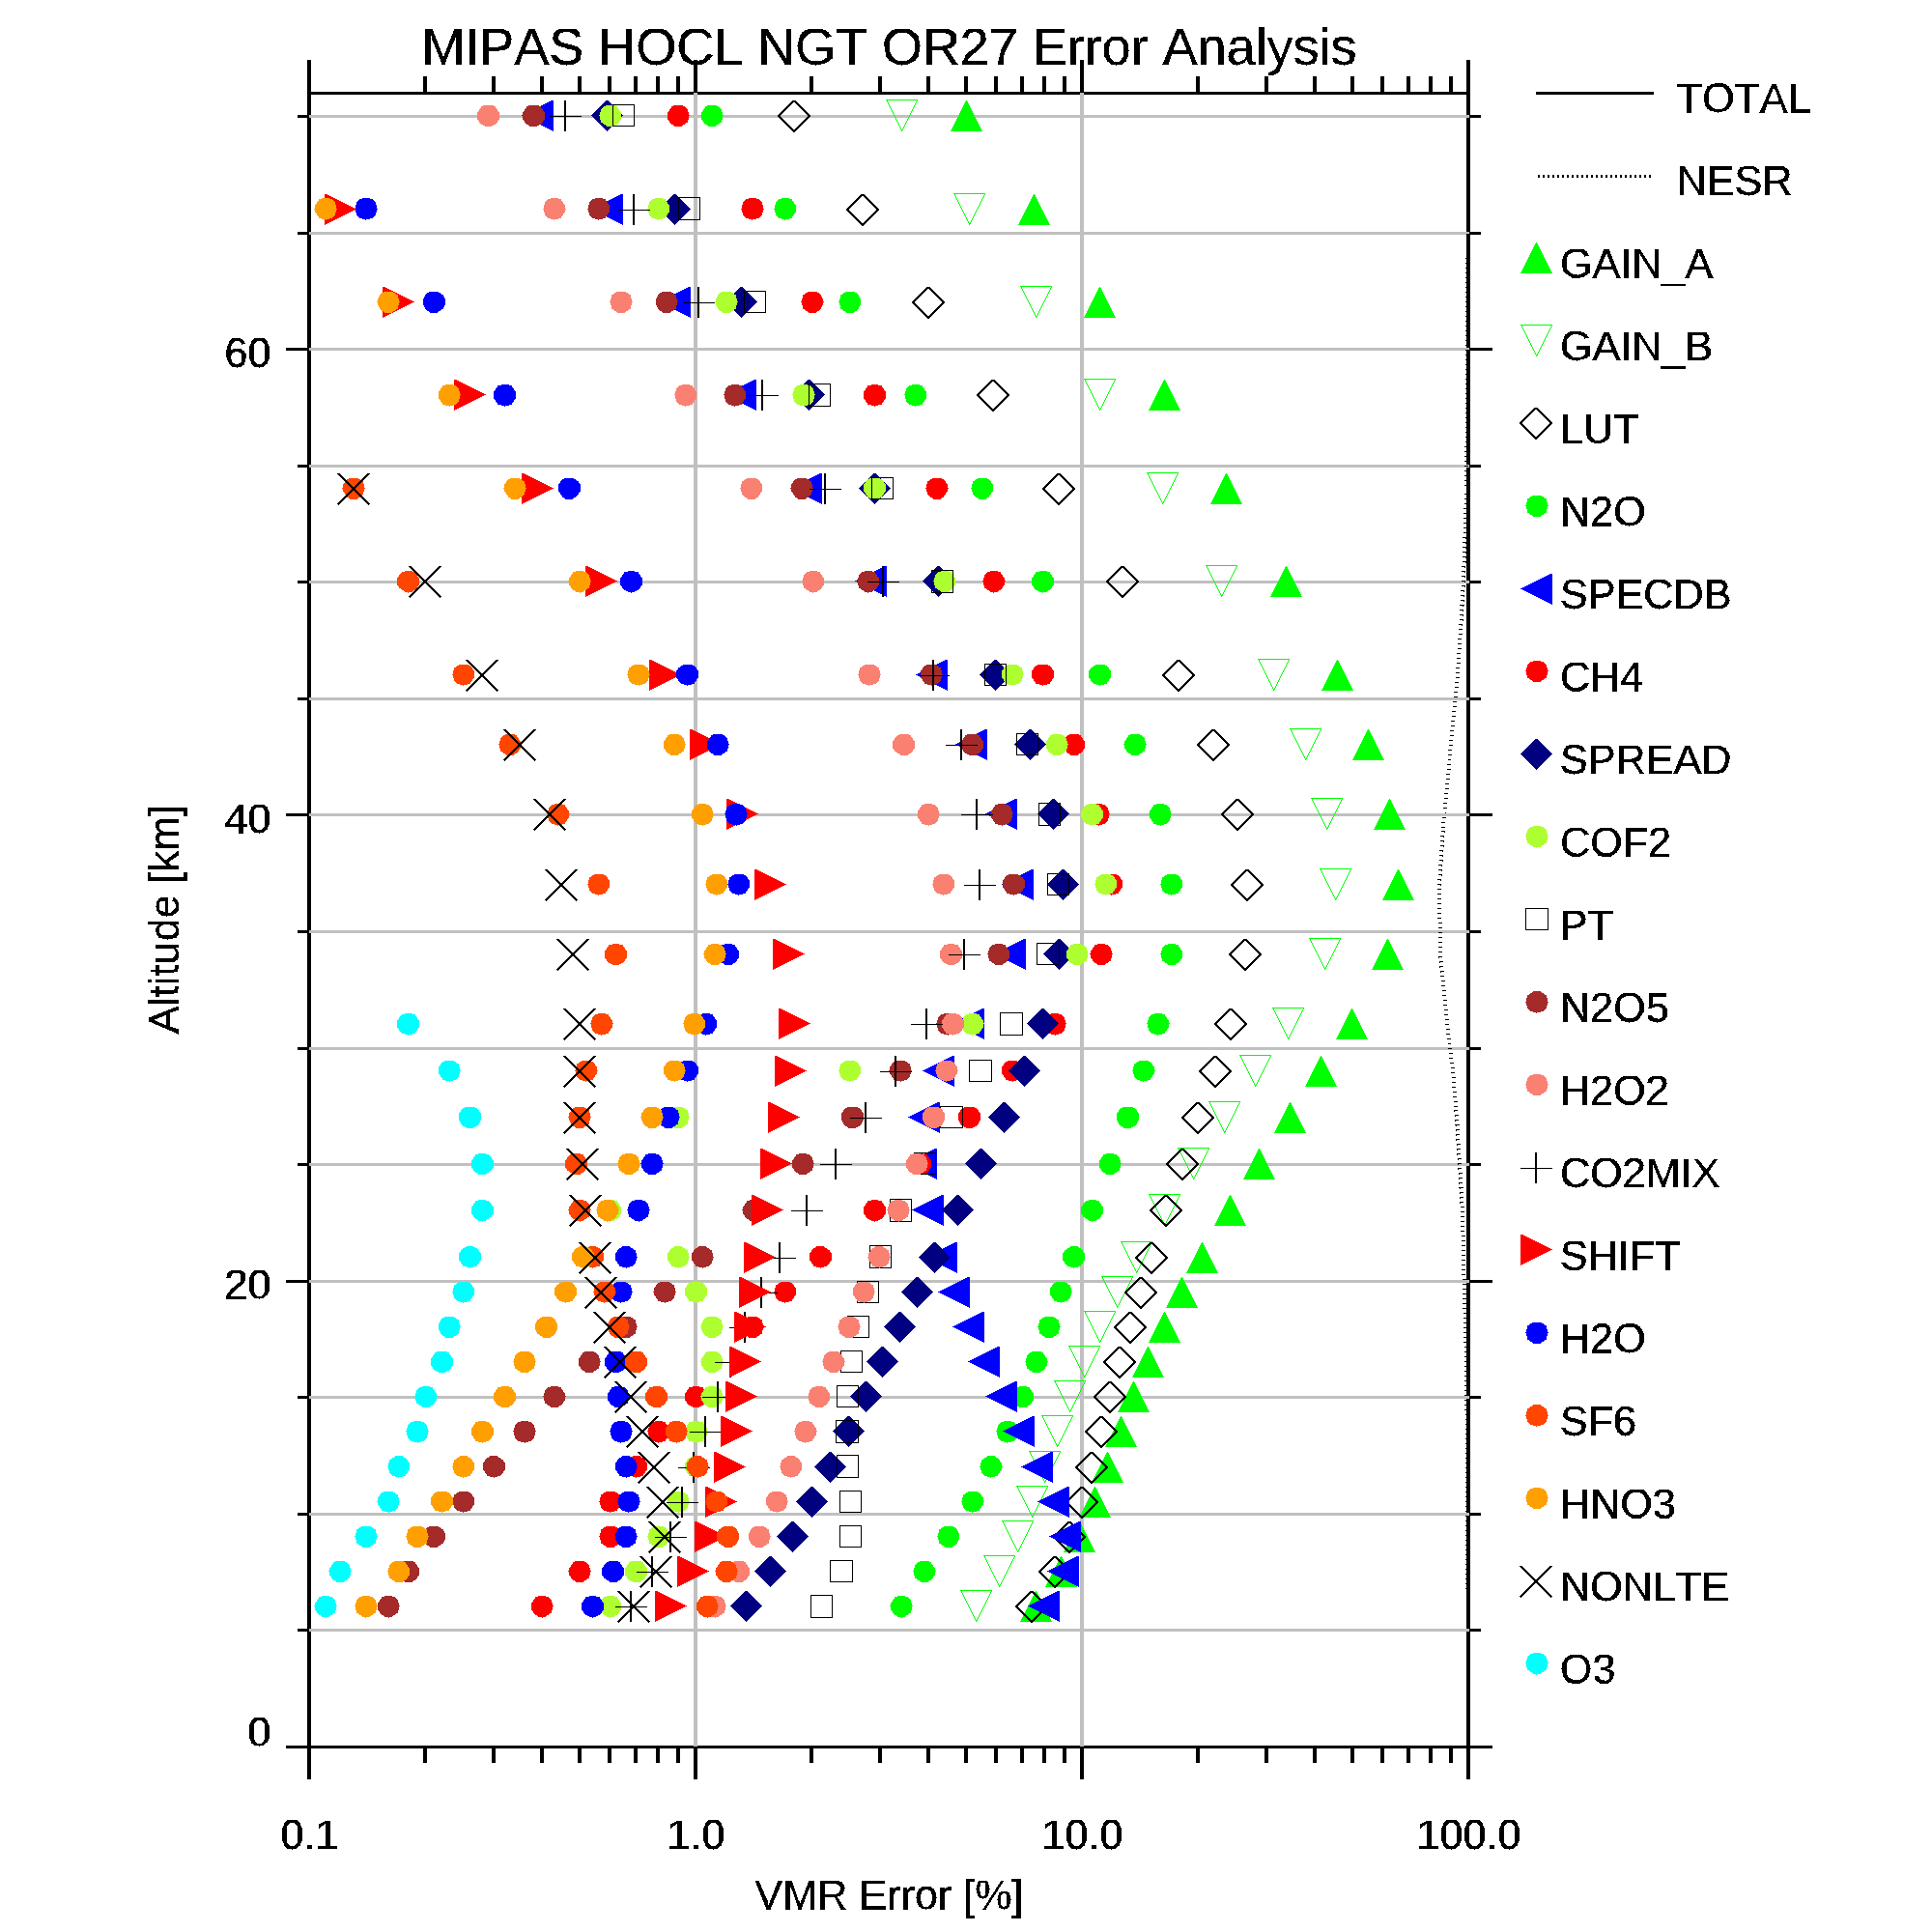
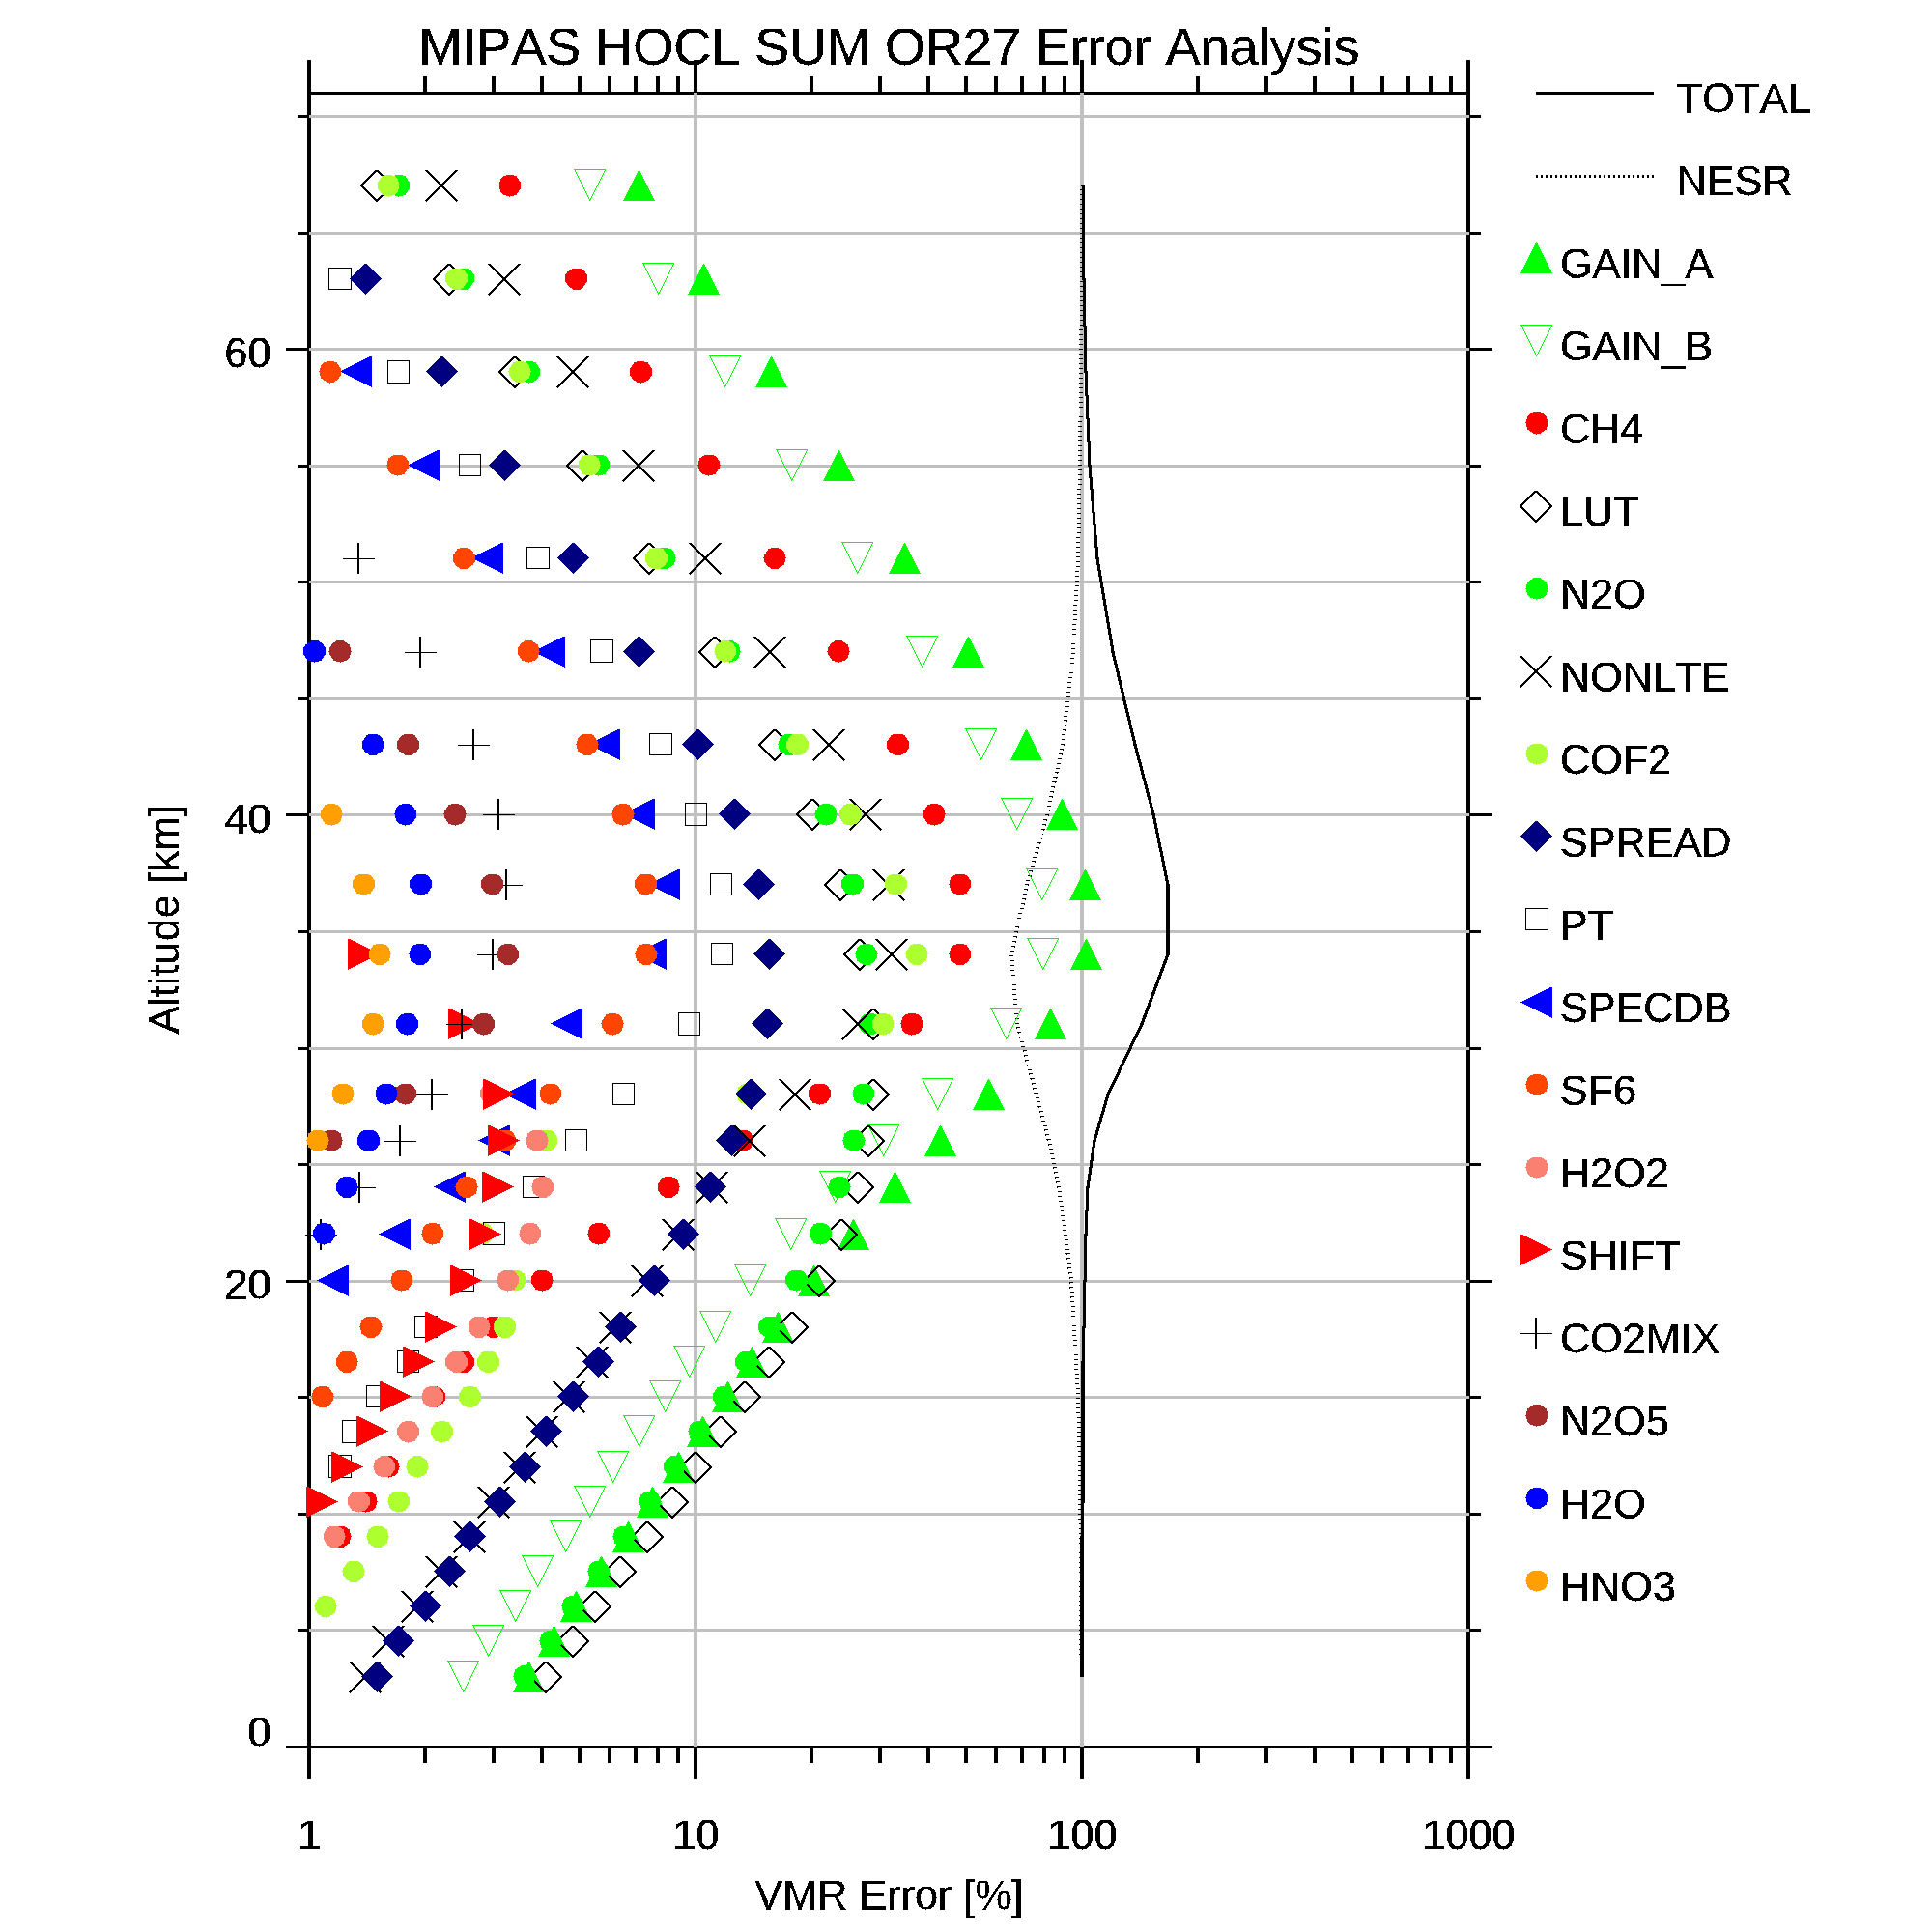
The following table shows the linear error analyses for MIPAS L2 products. These errors have been evaluated for 5 different atmospheric conditions.
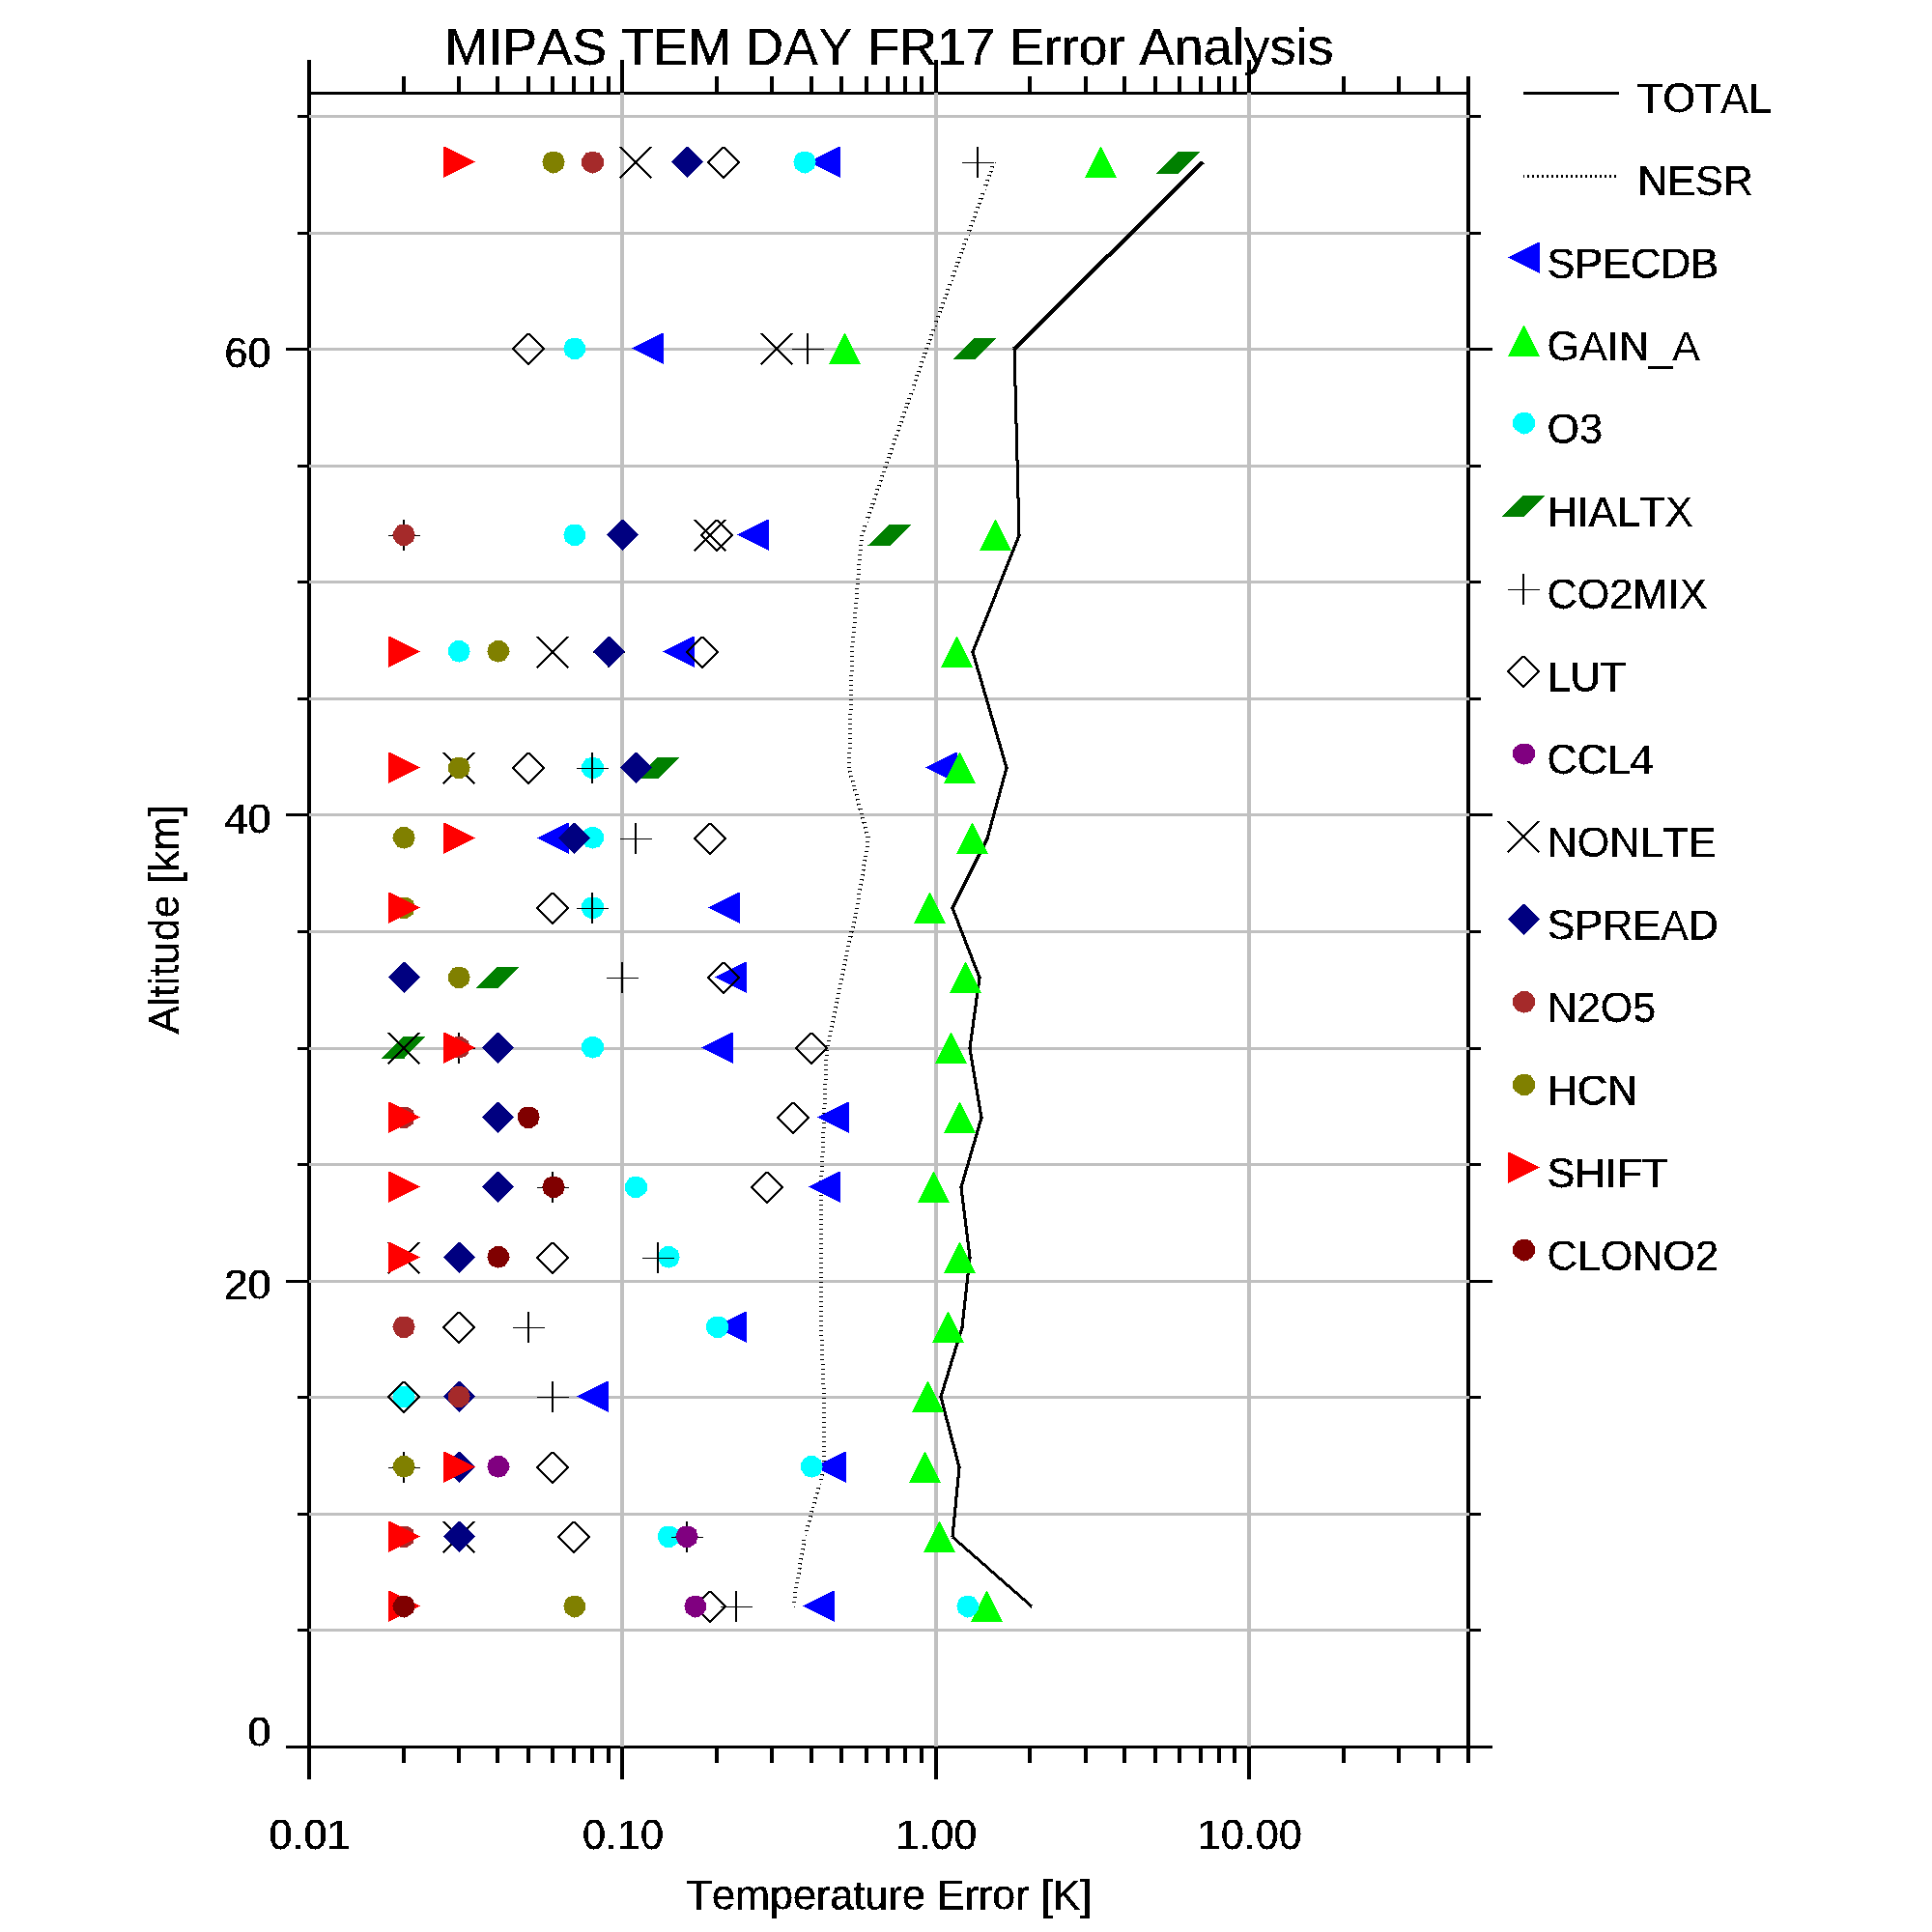
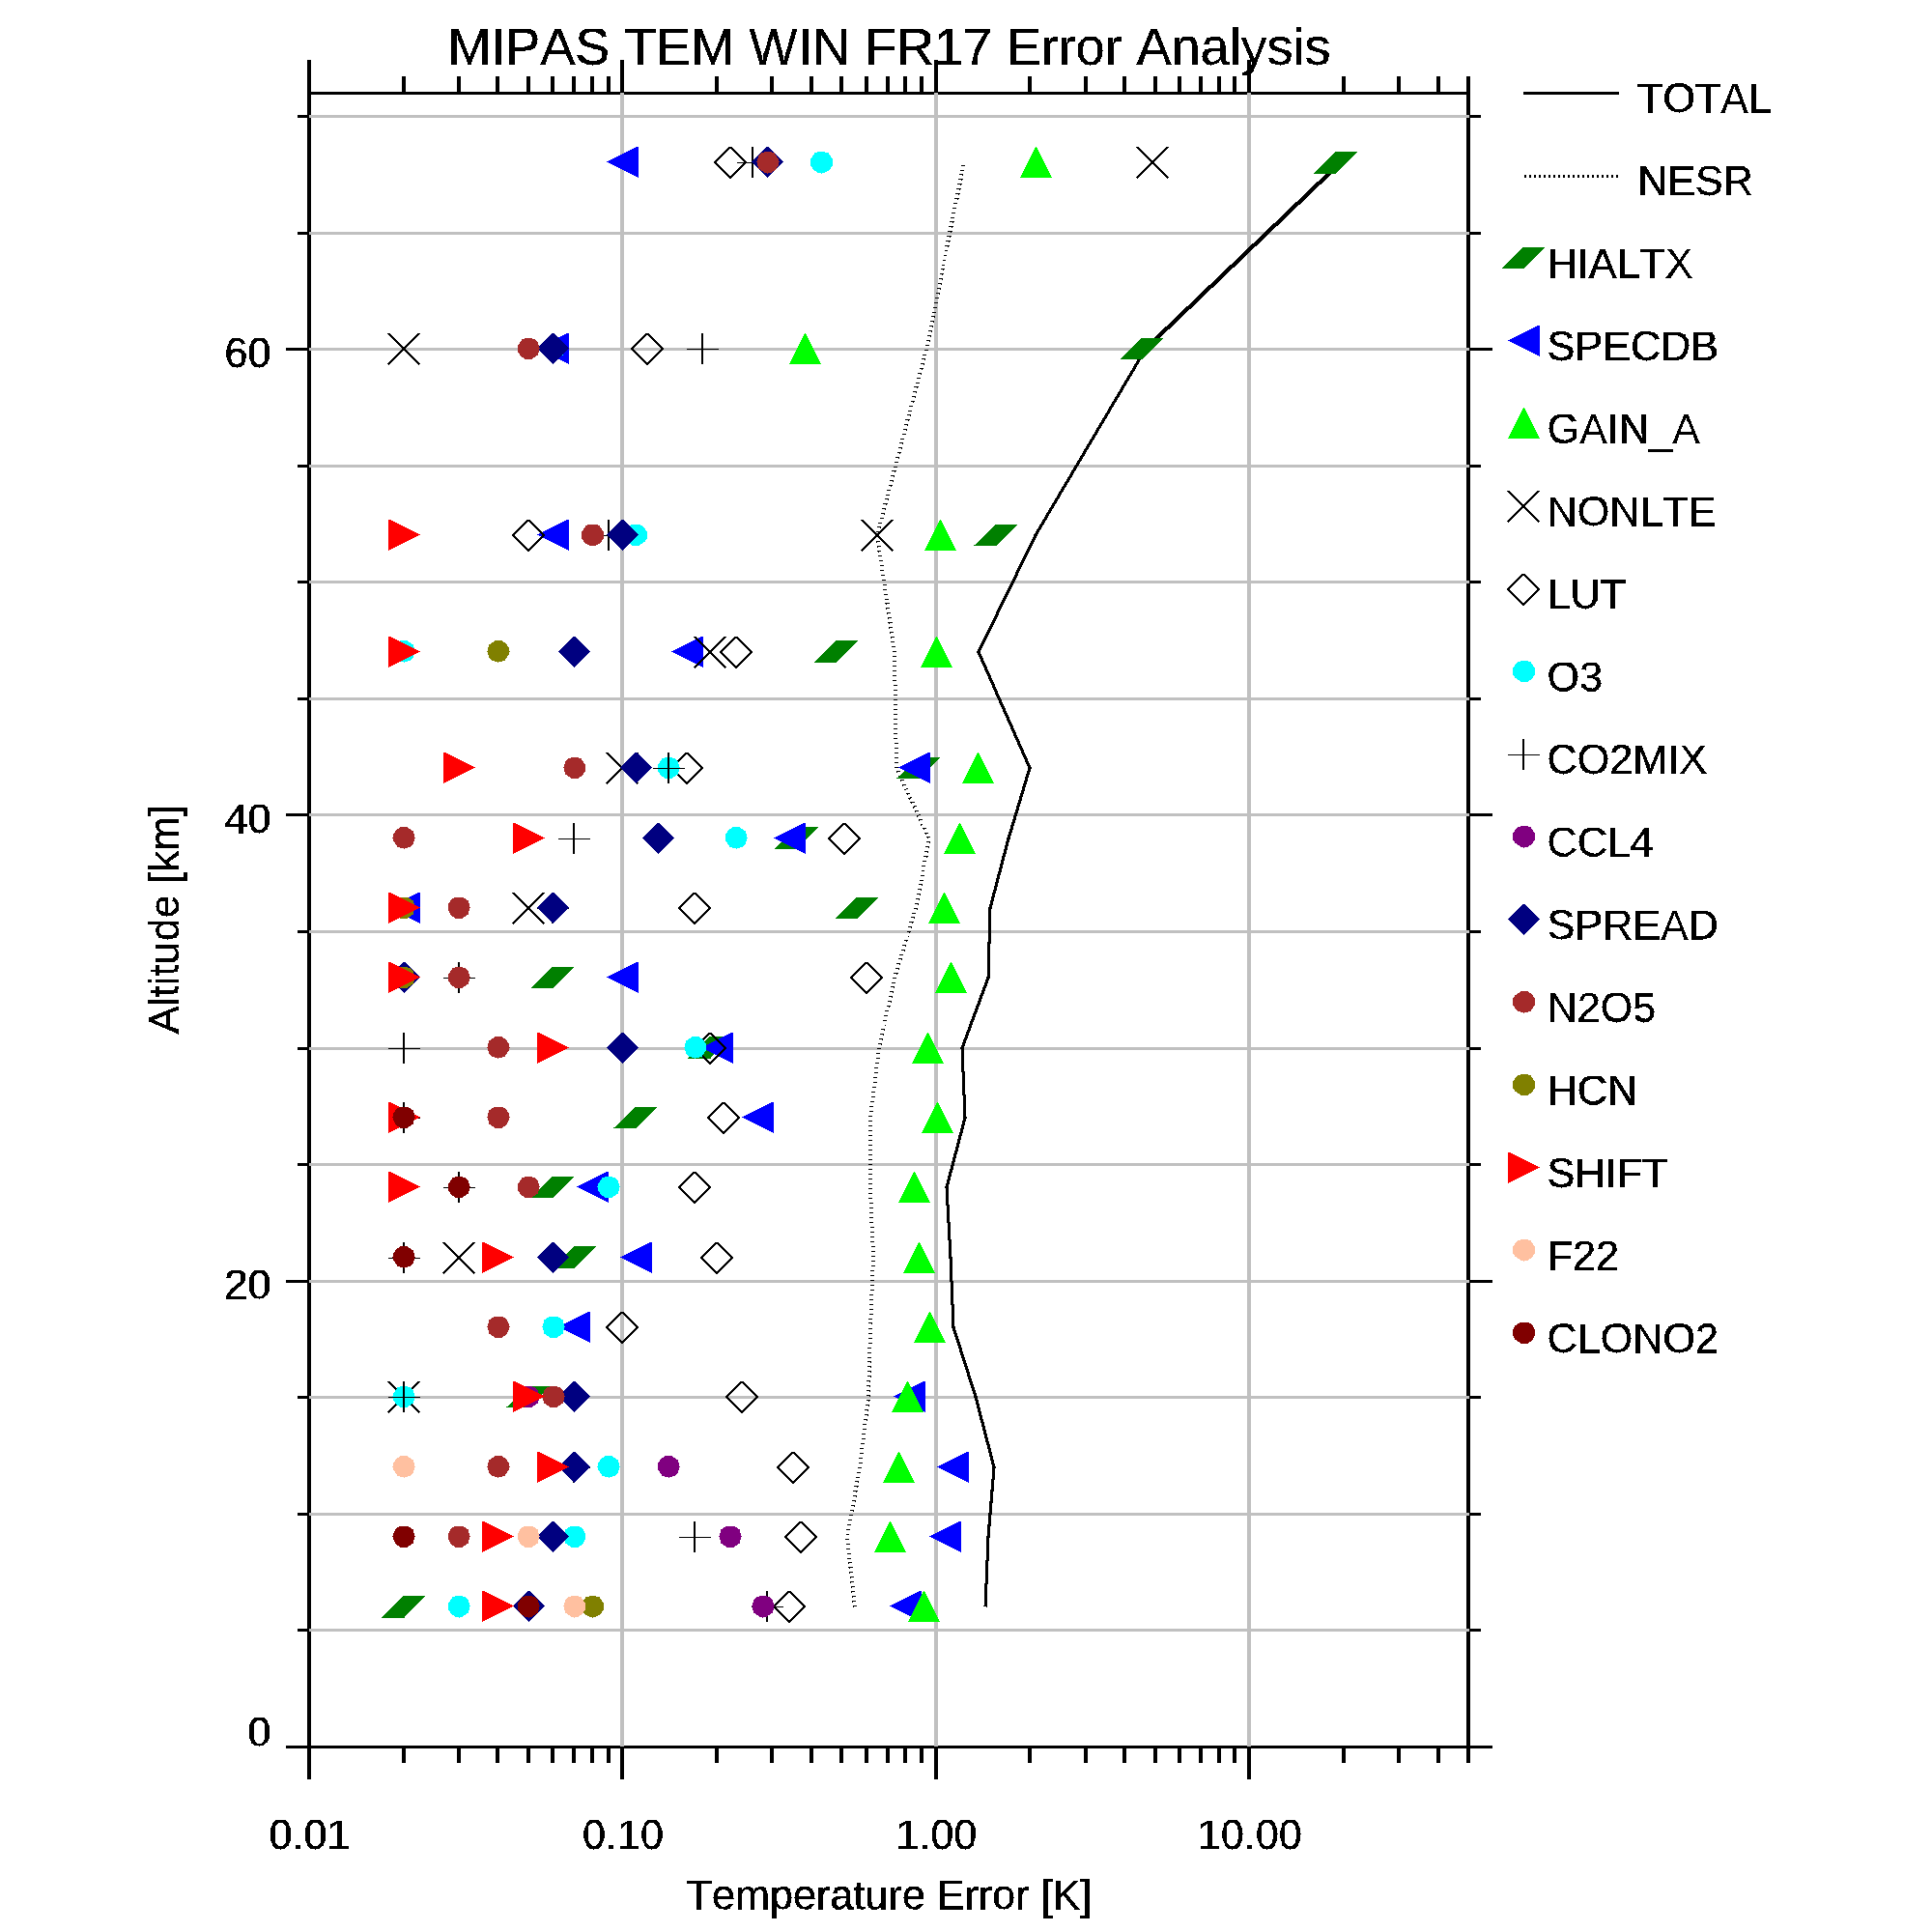
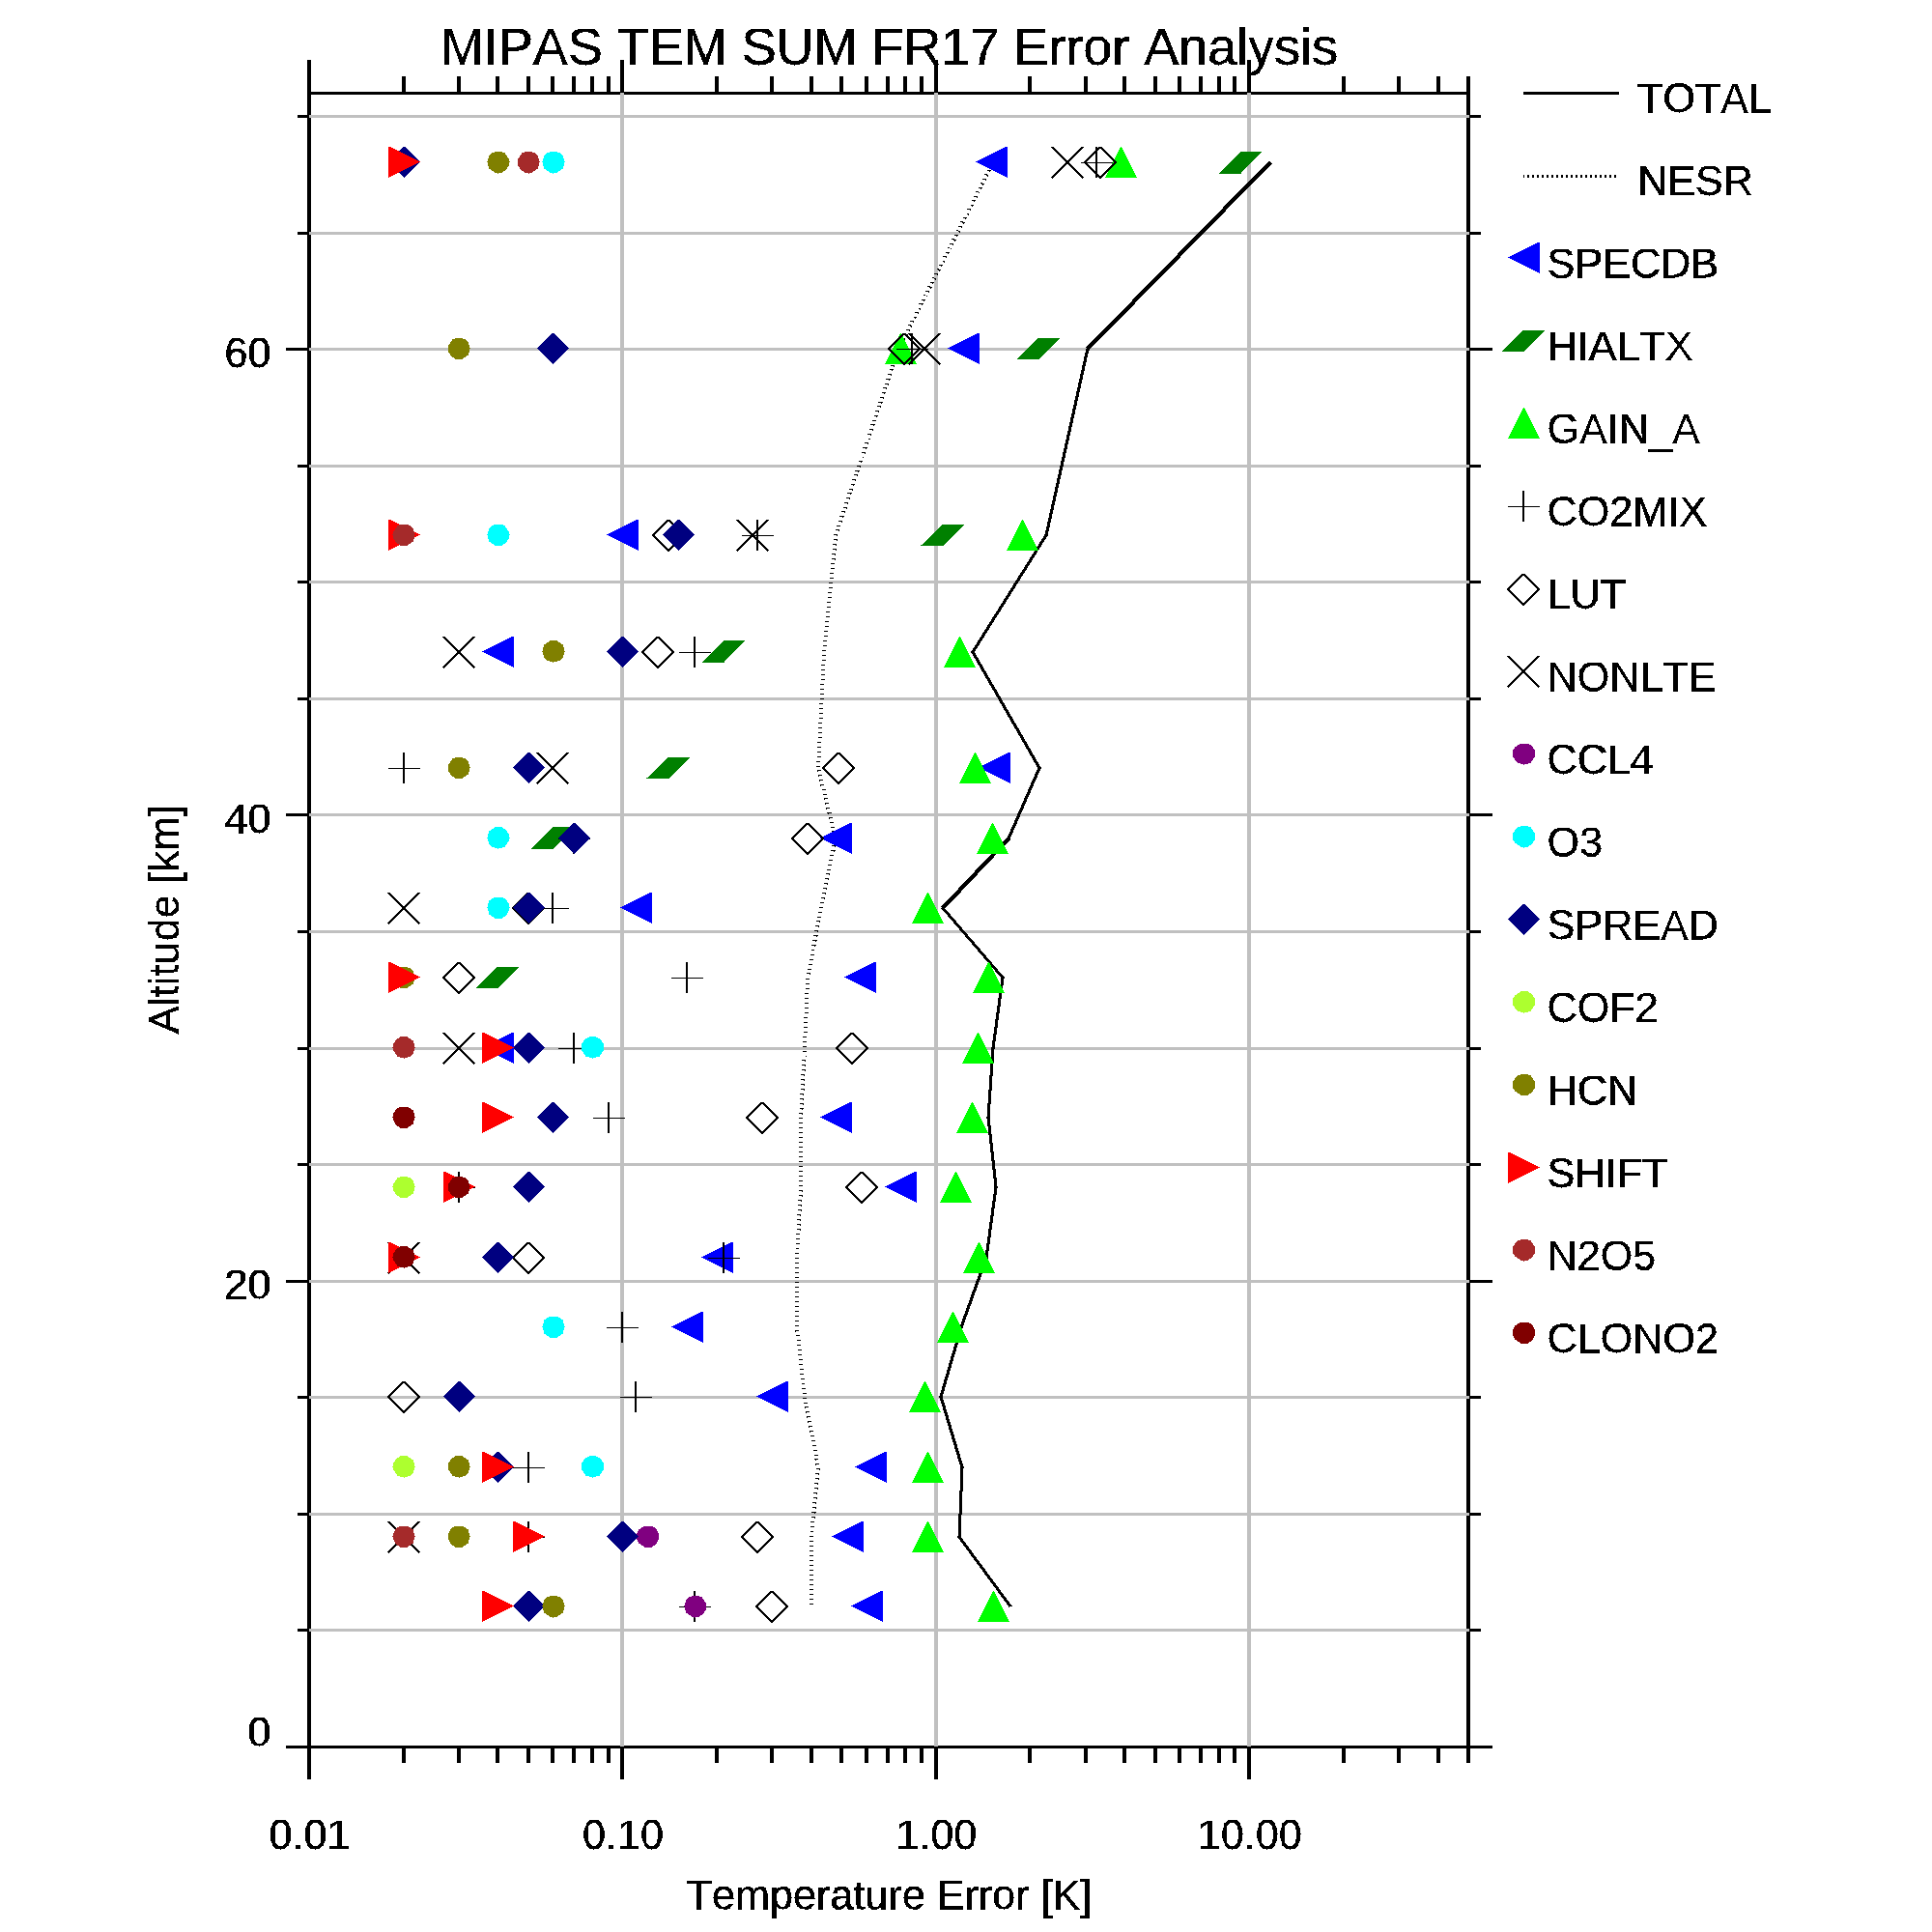
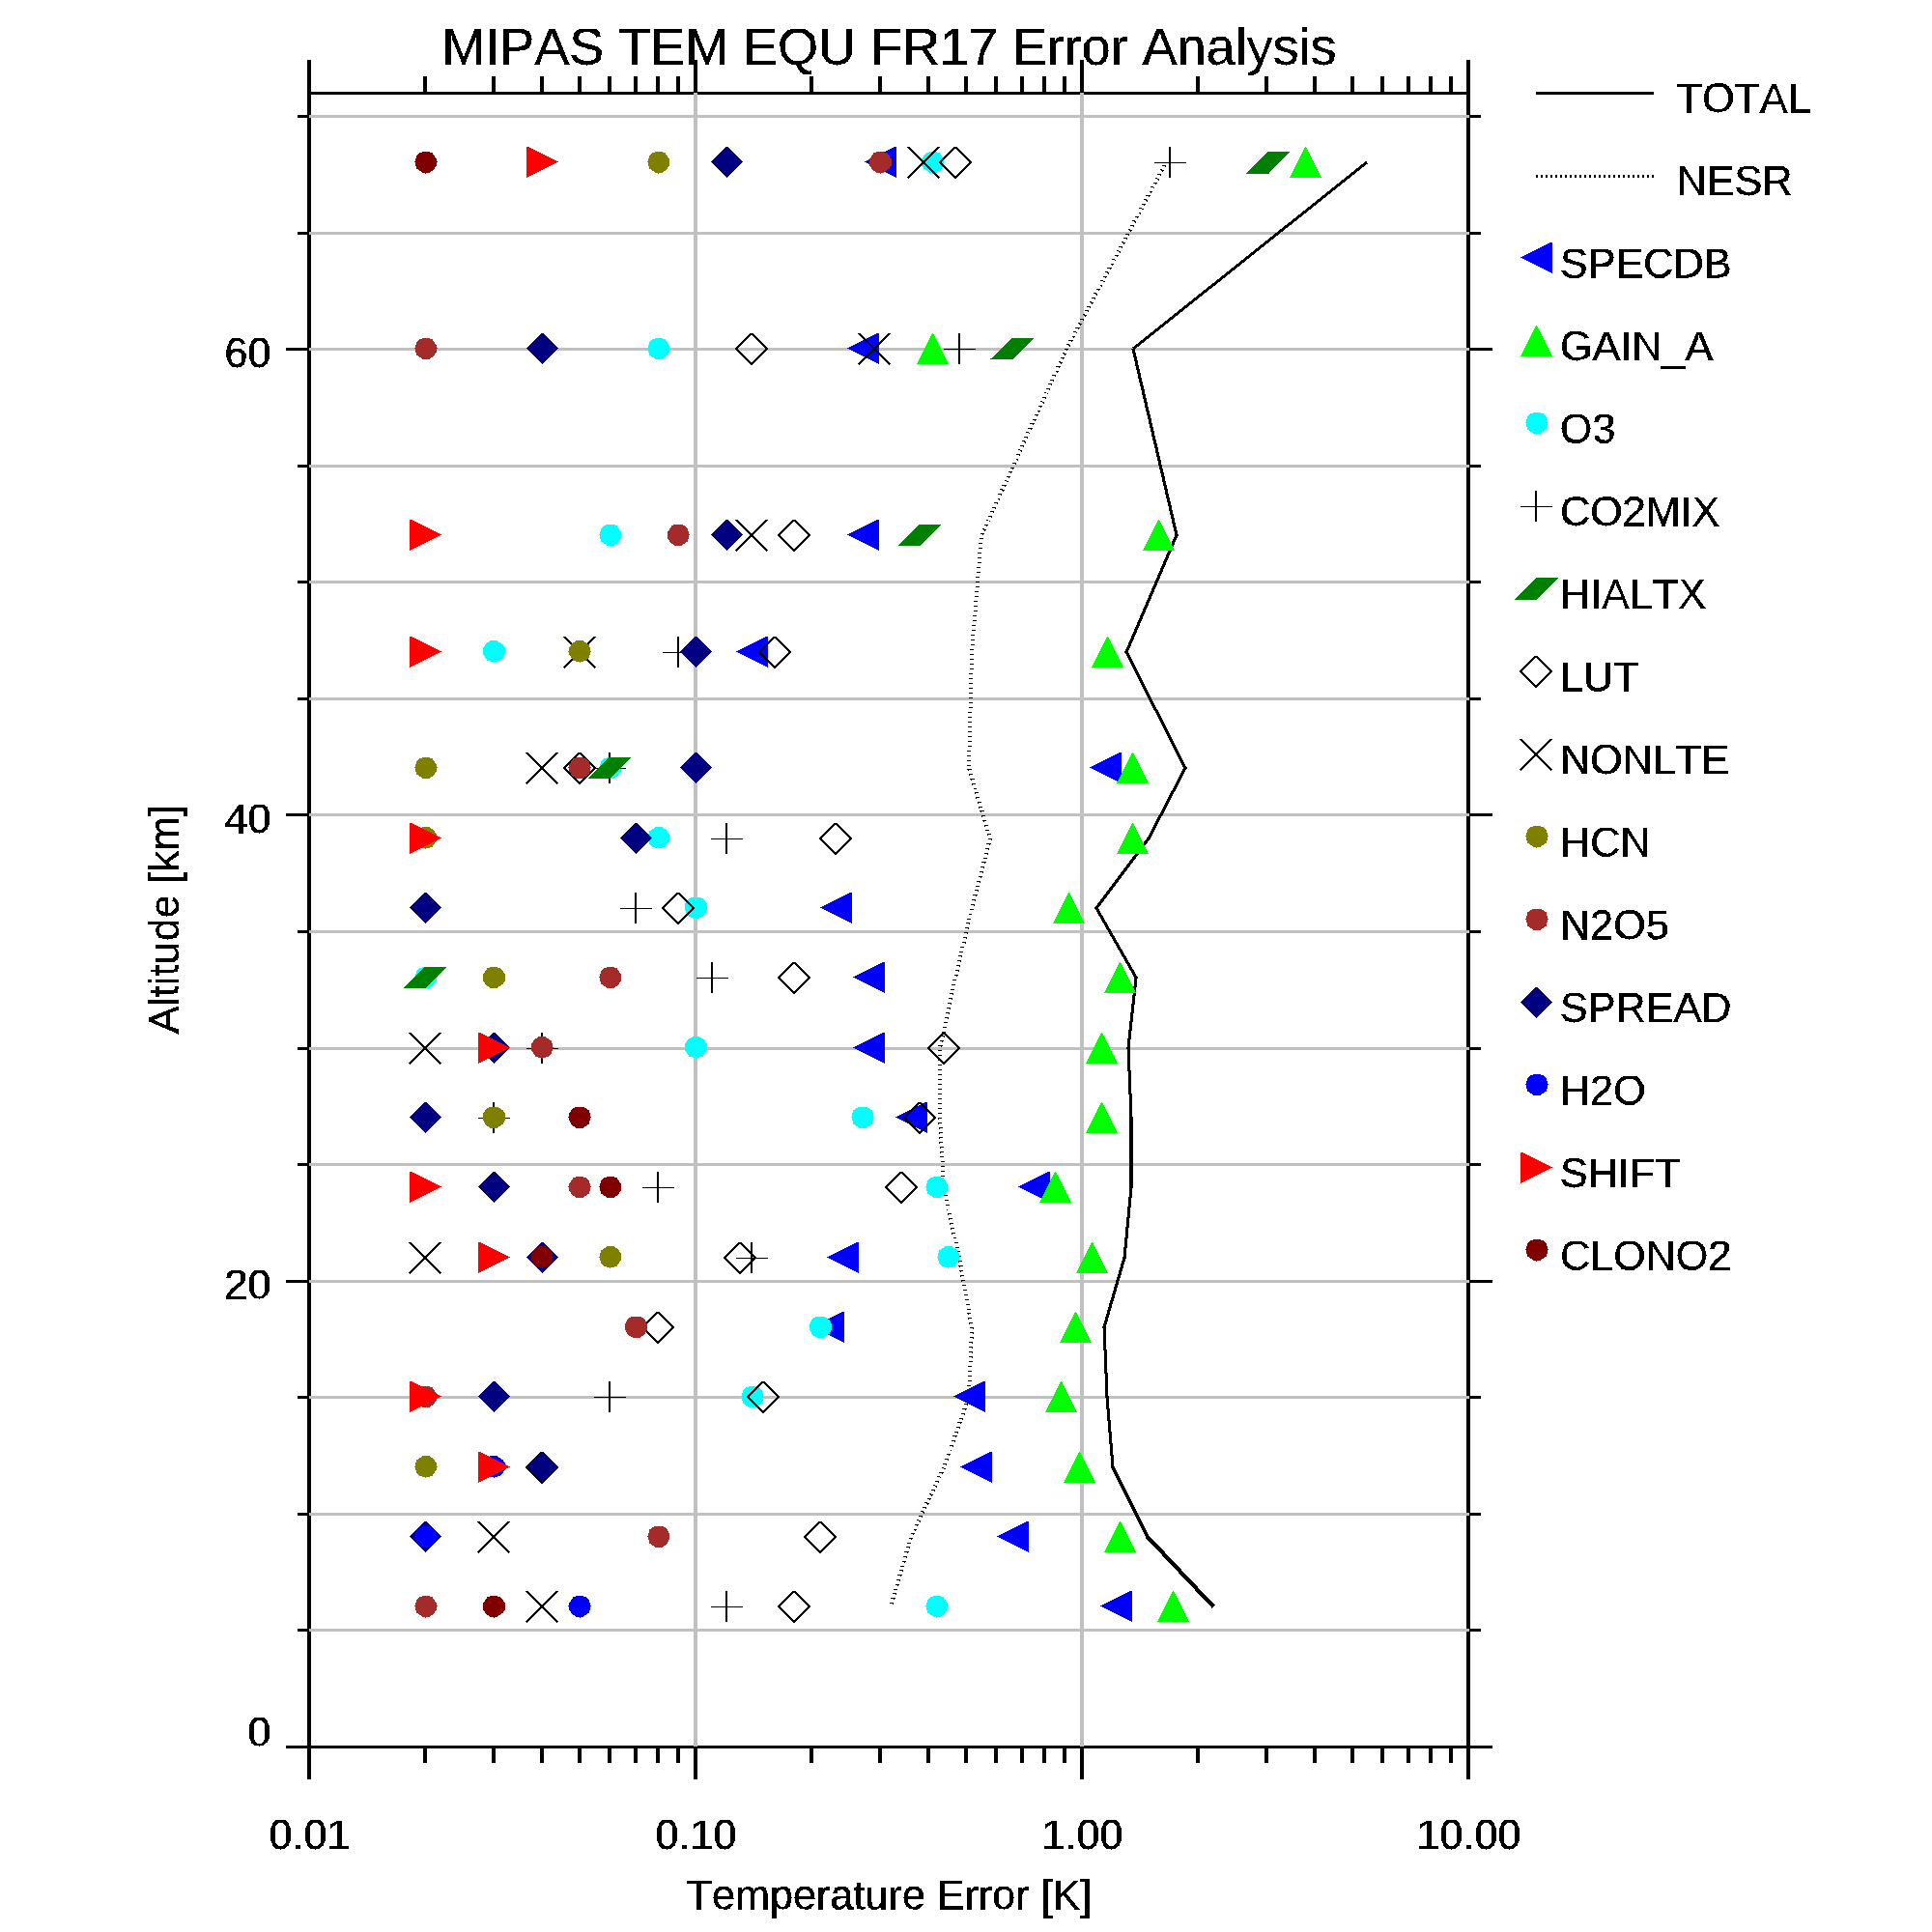
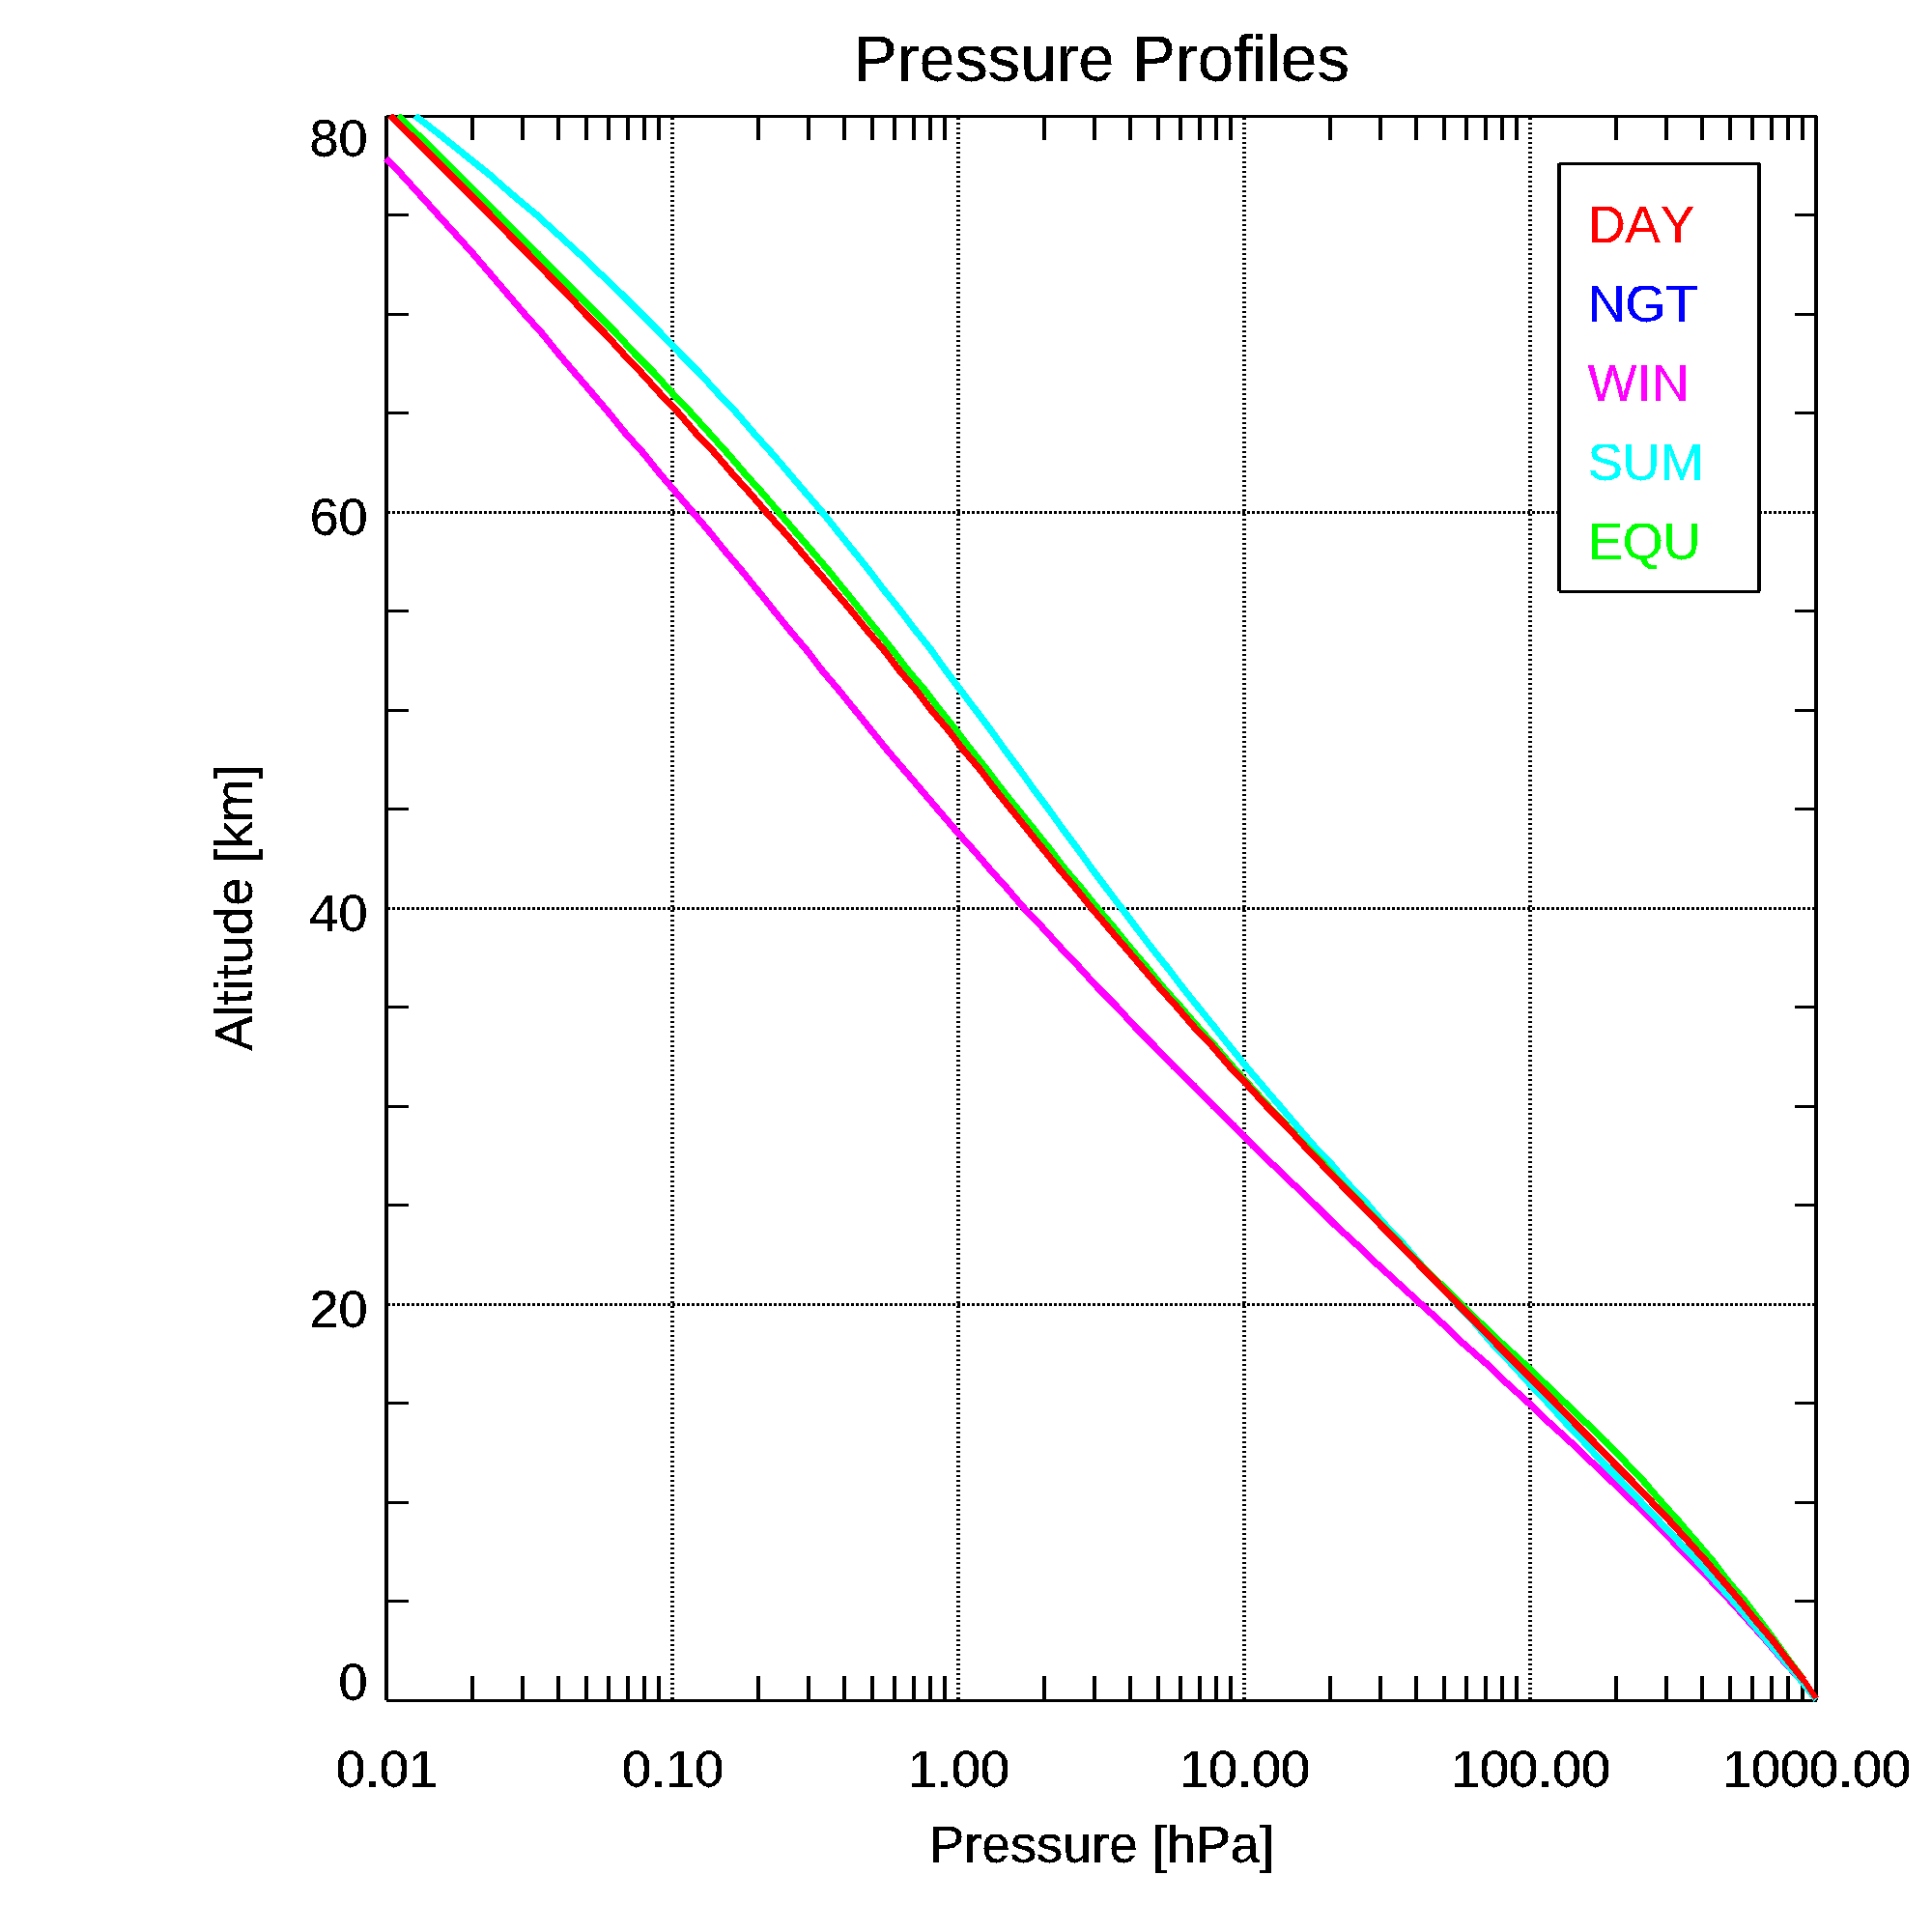
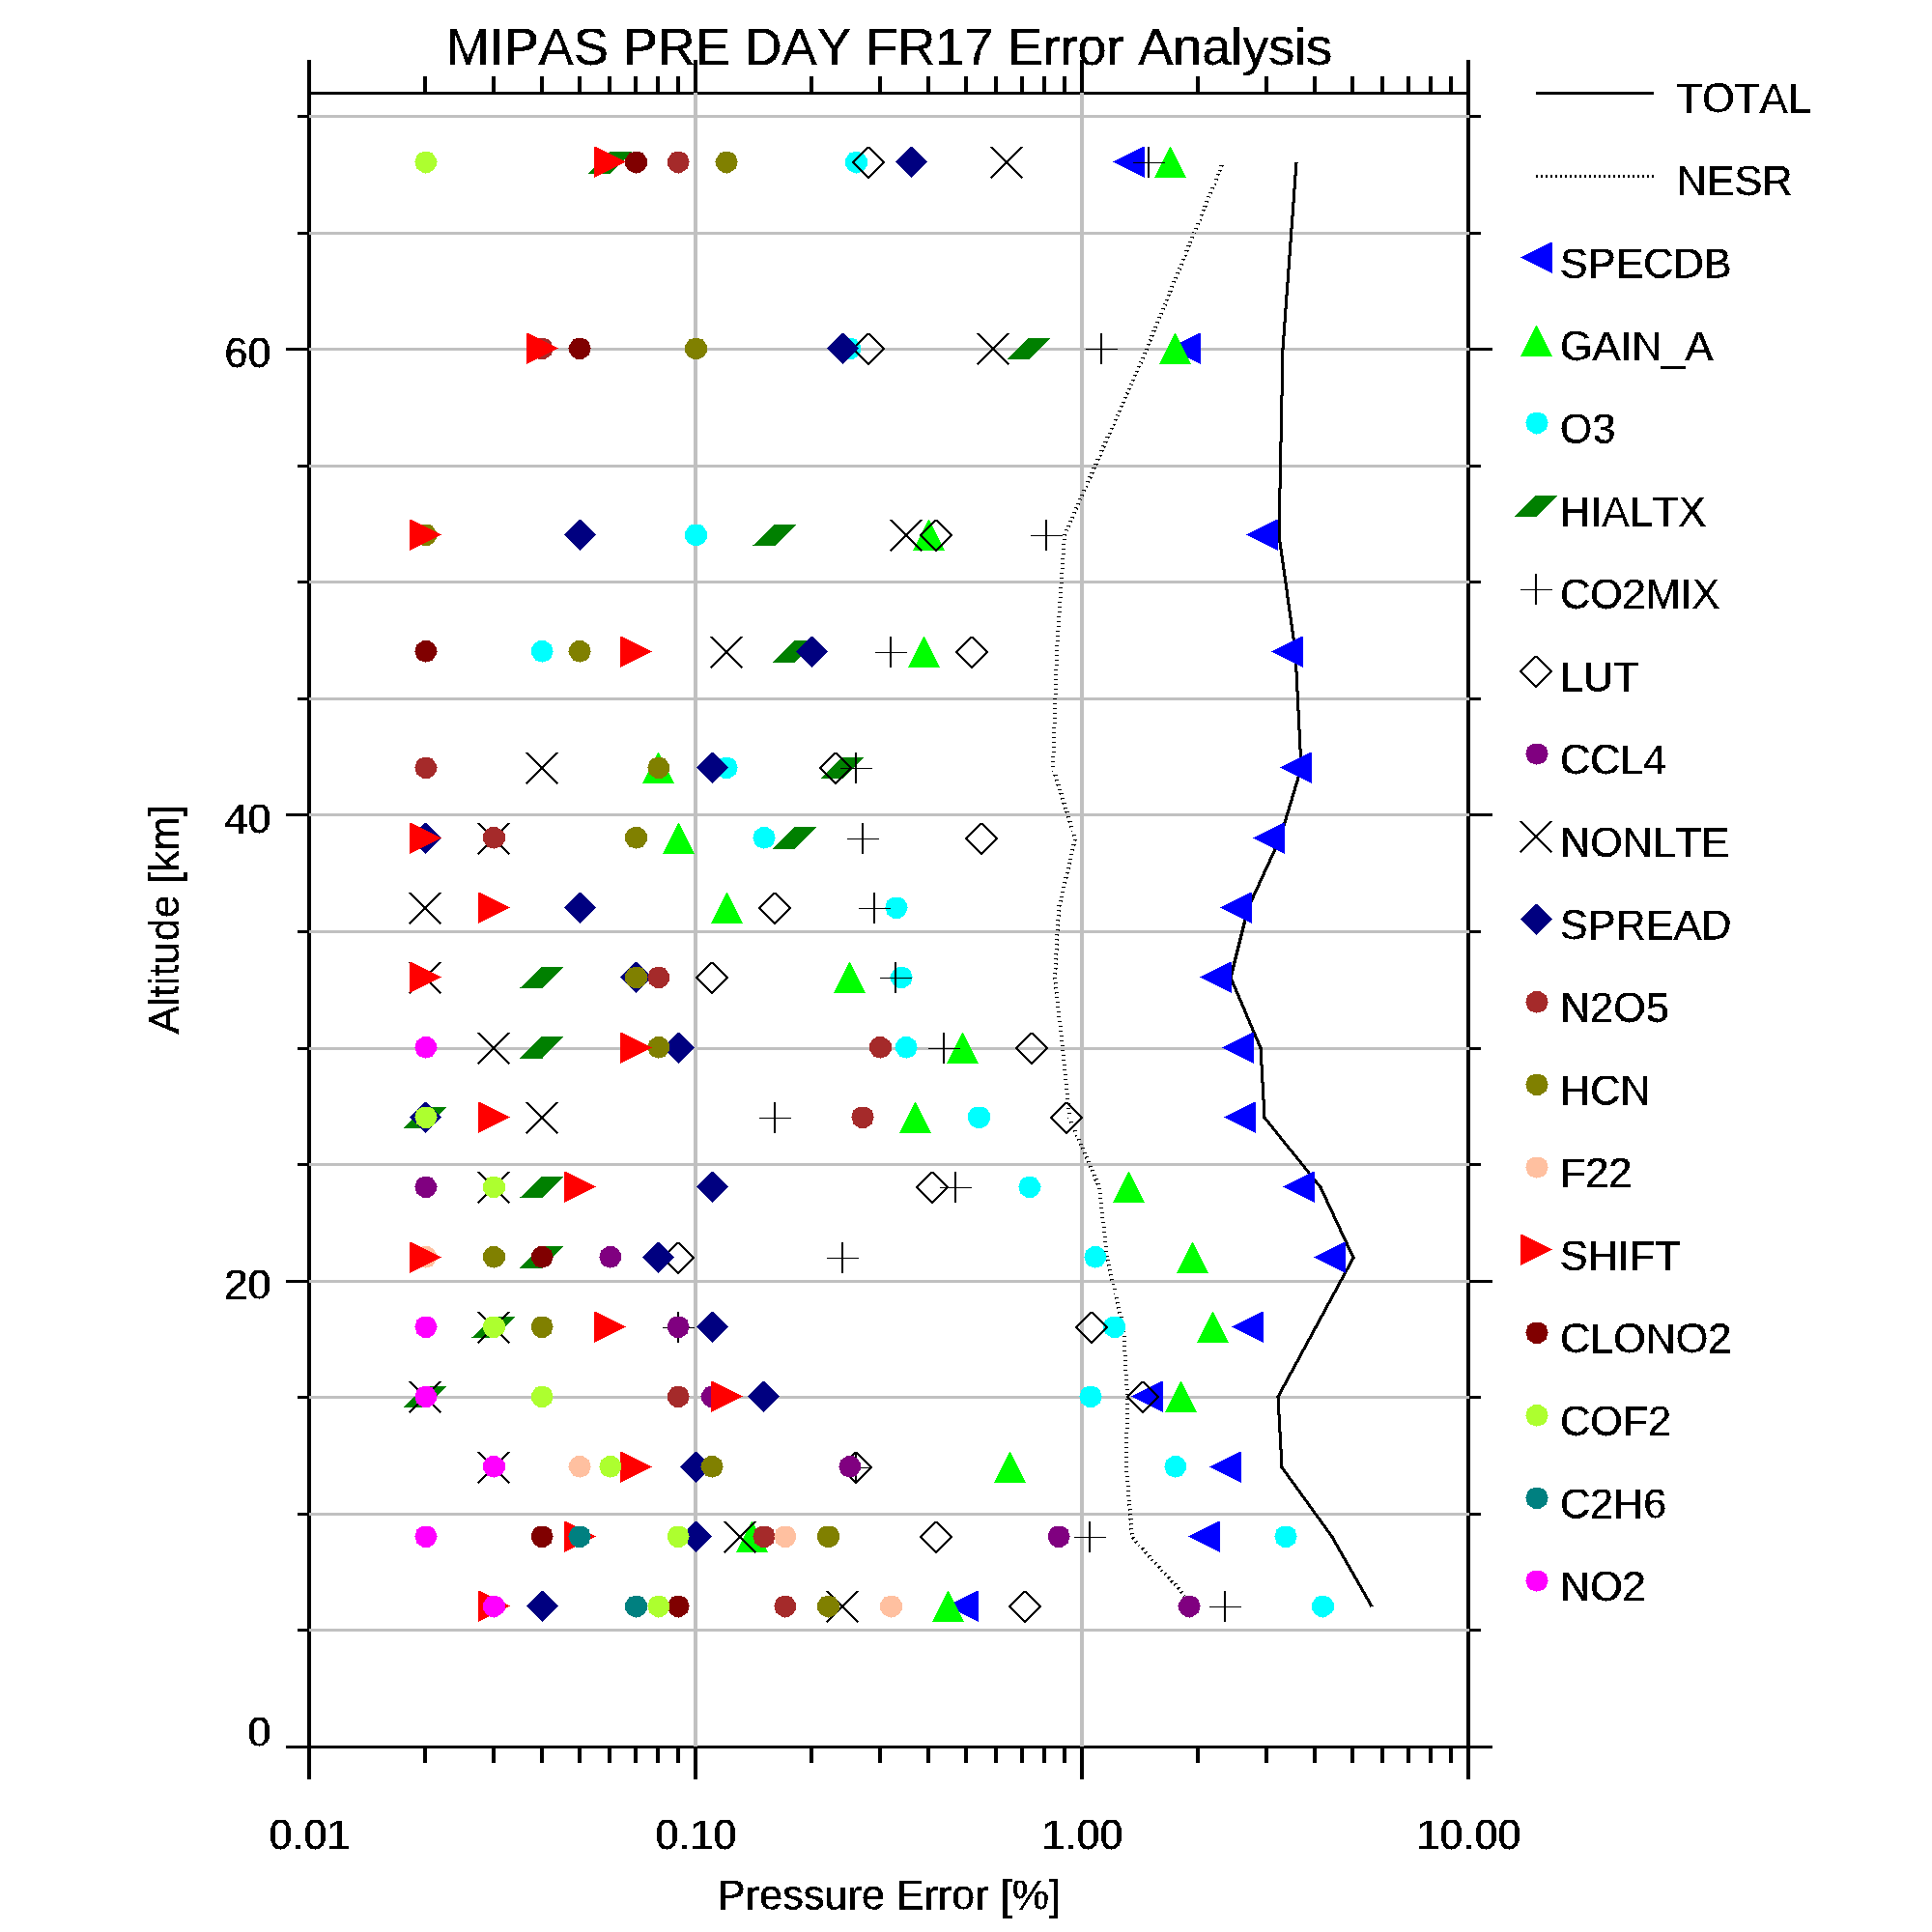
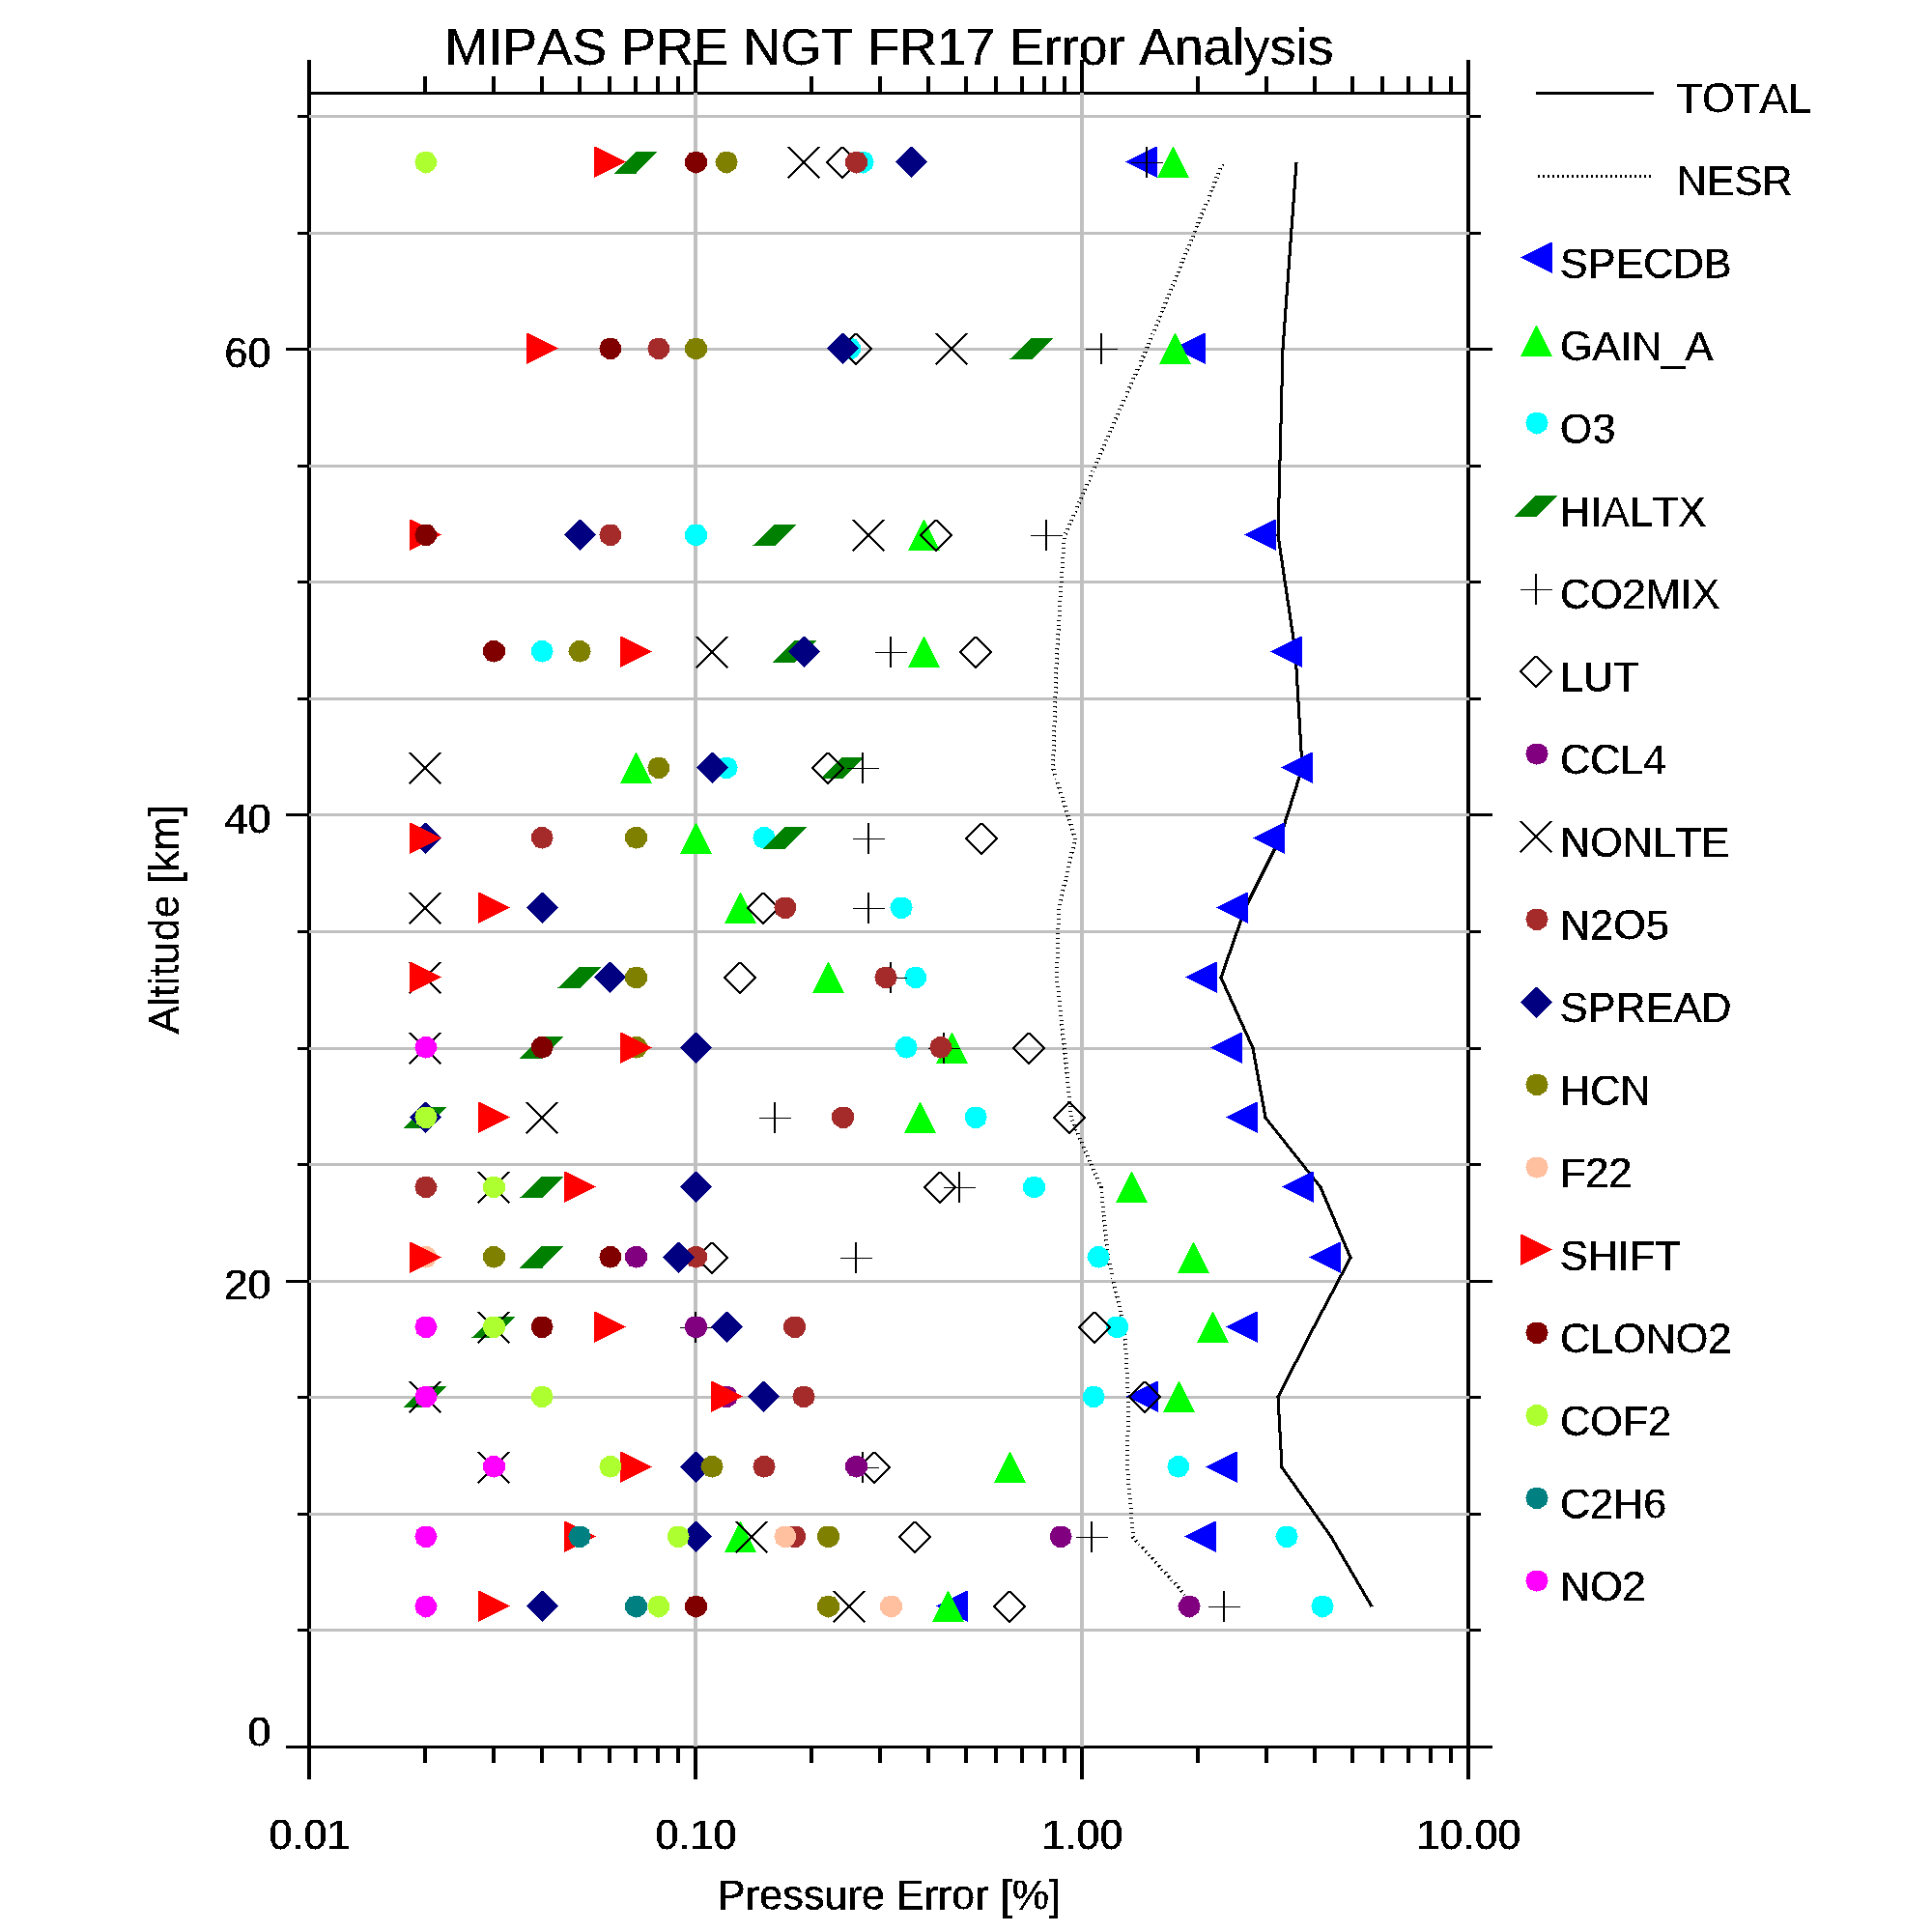
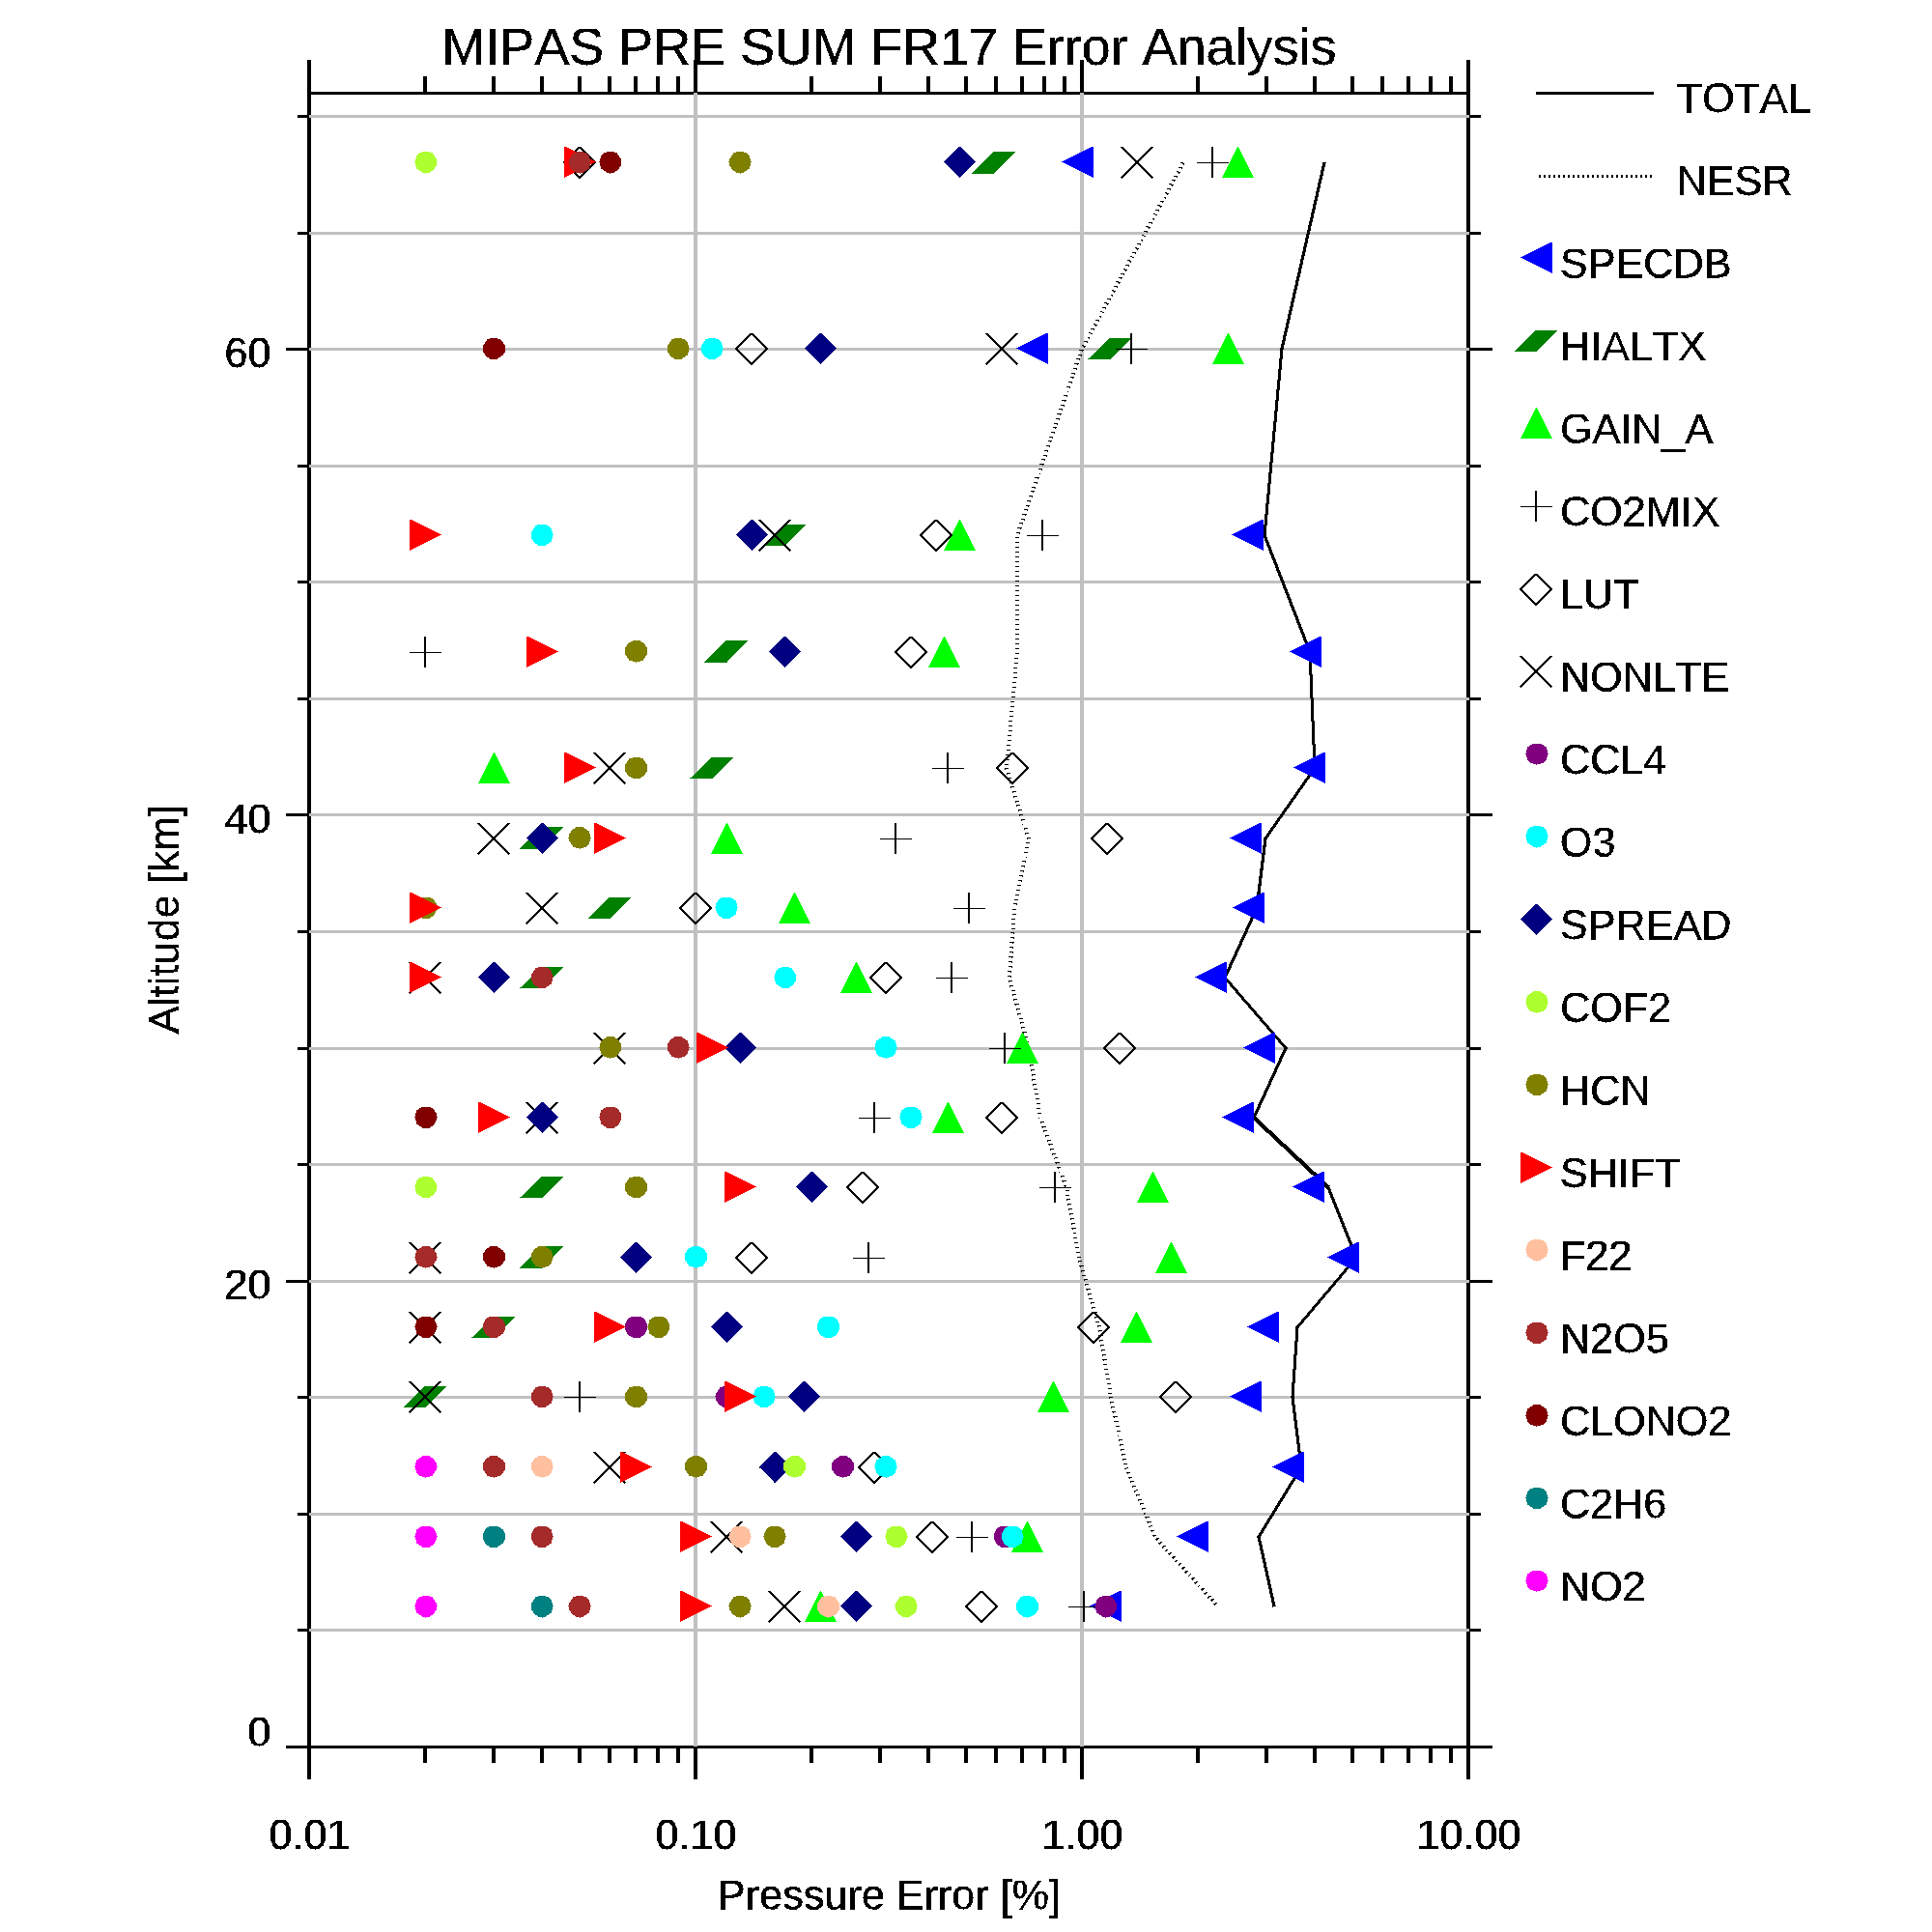
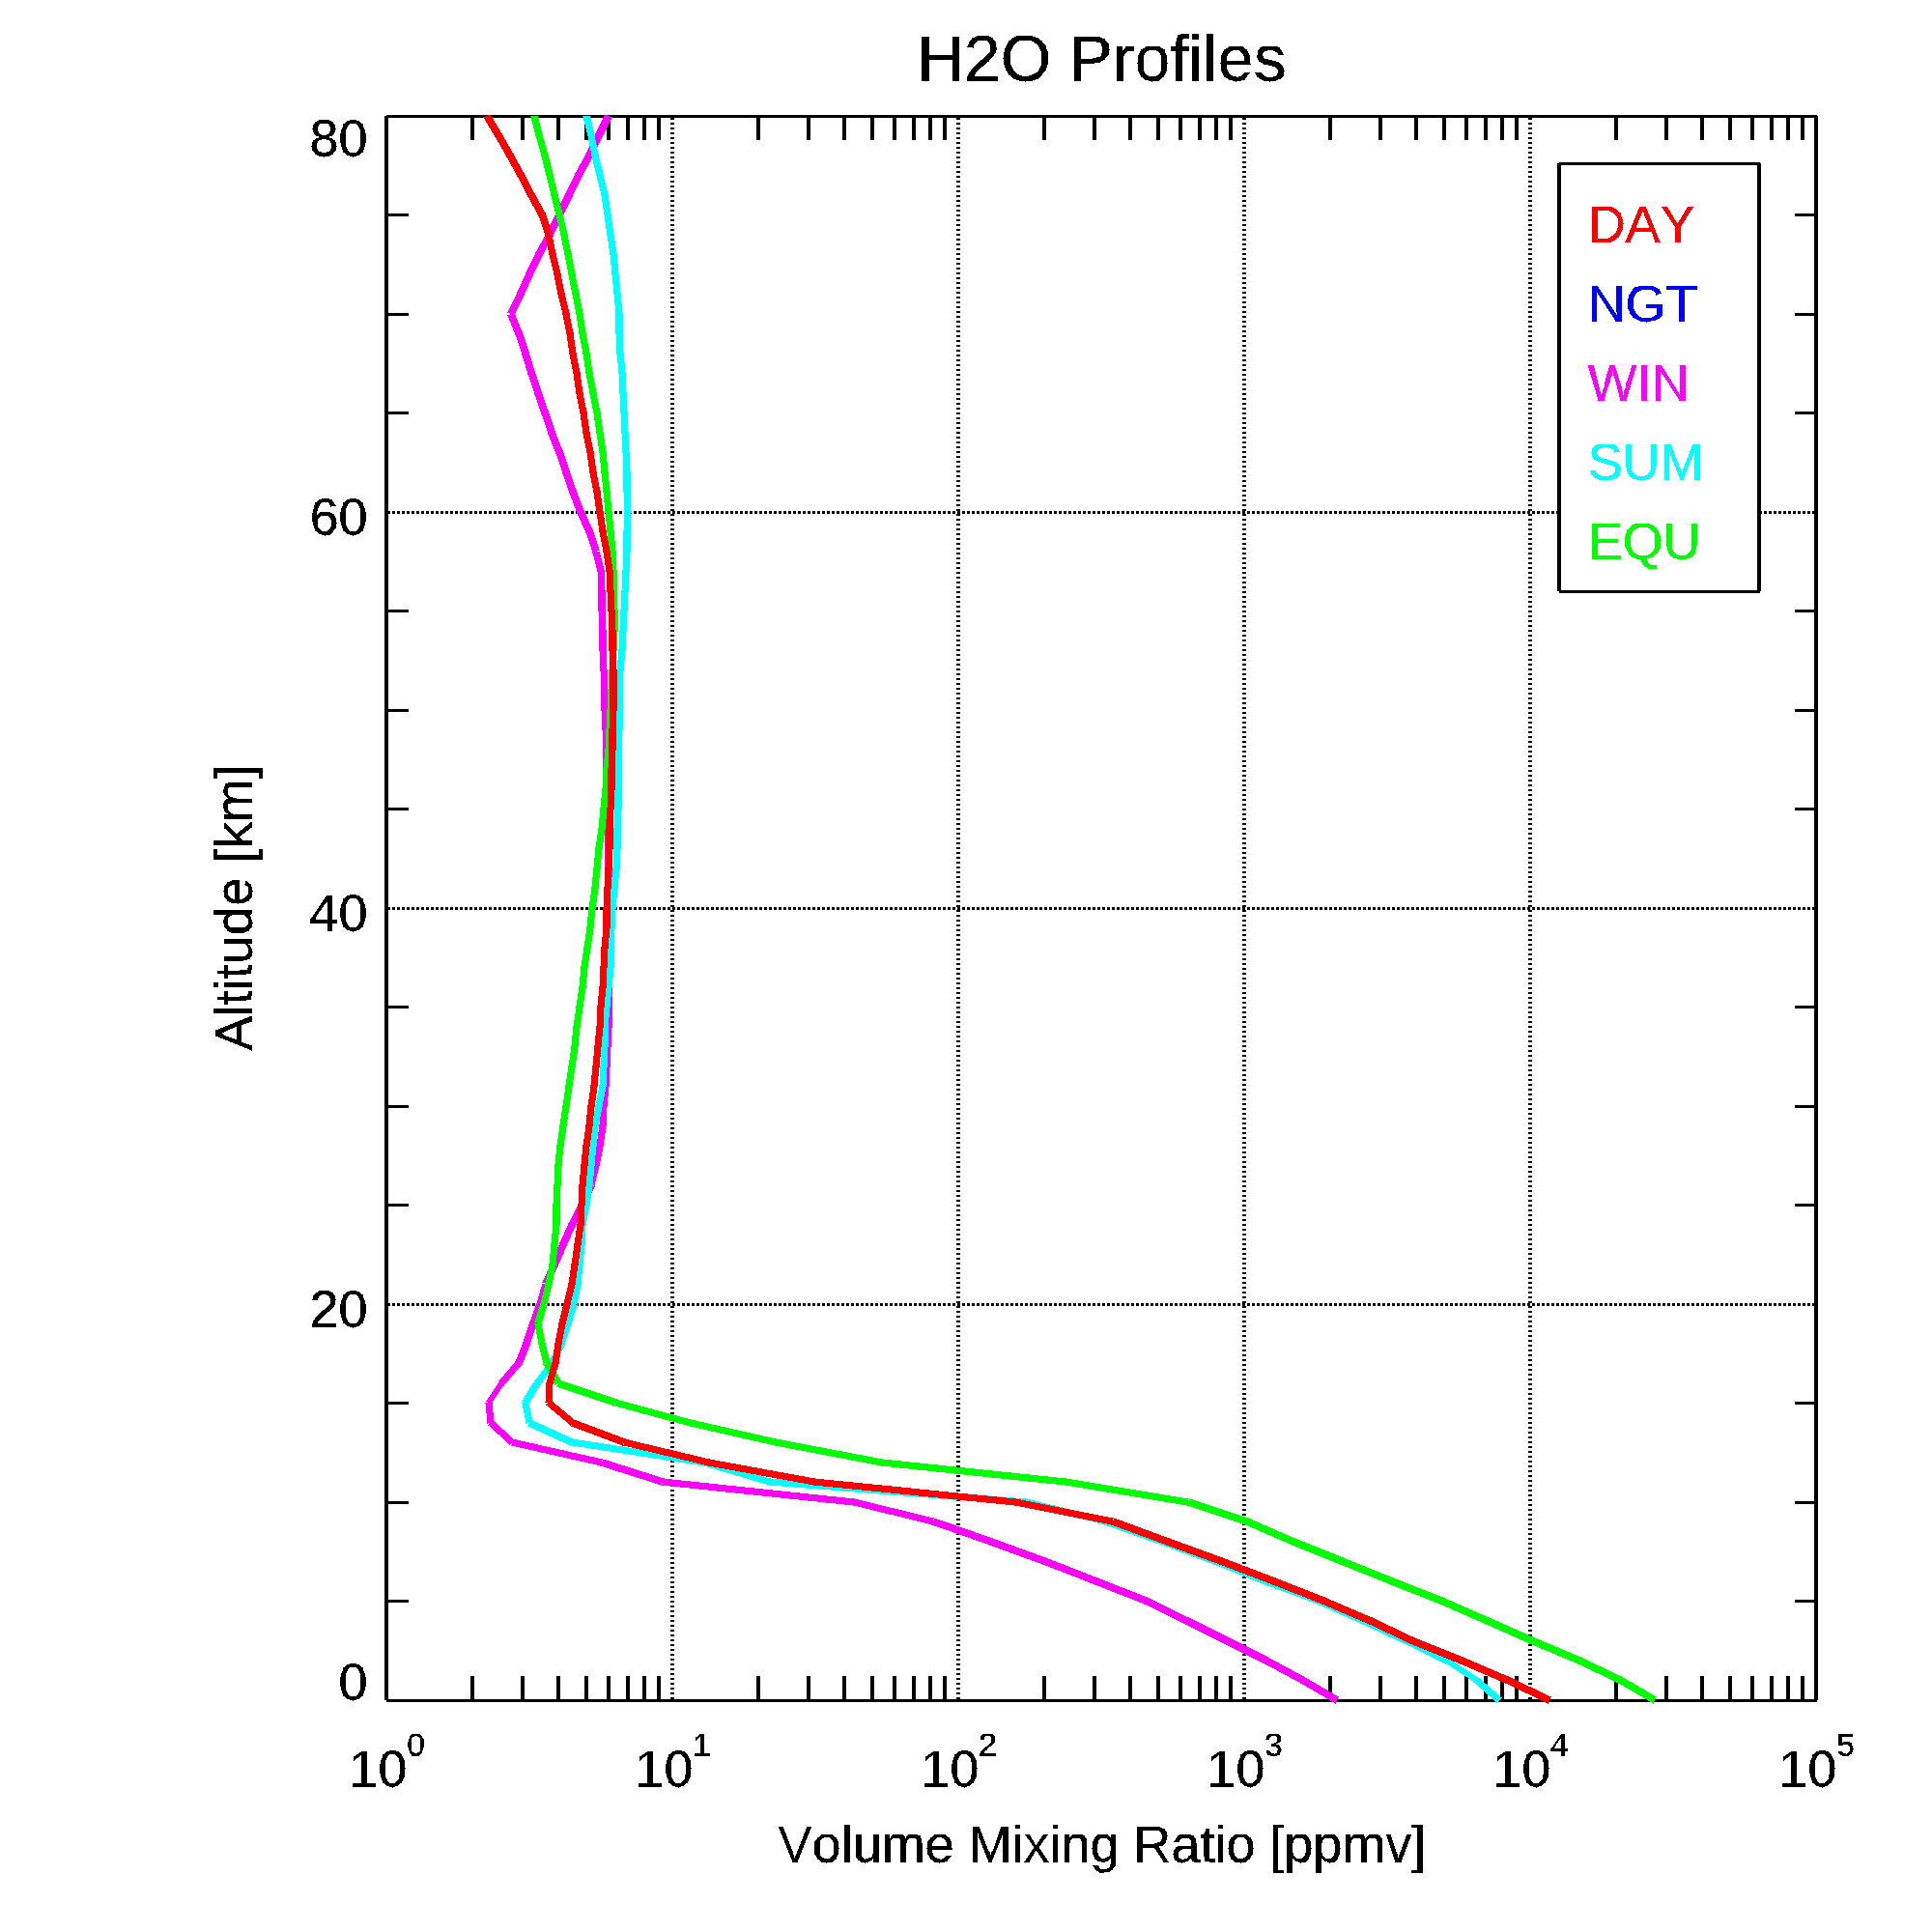
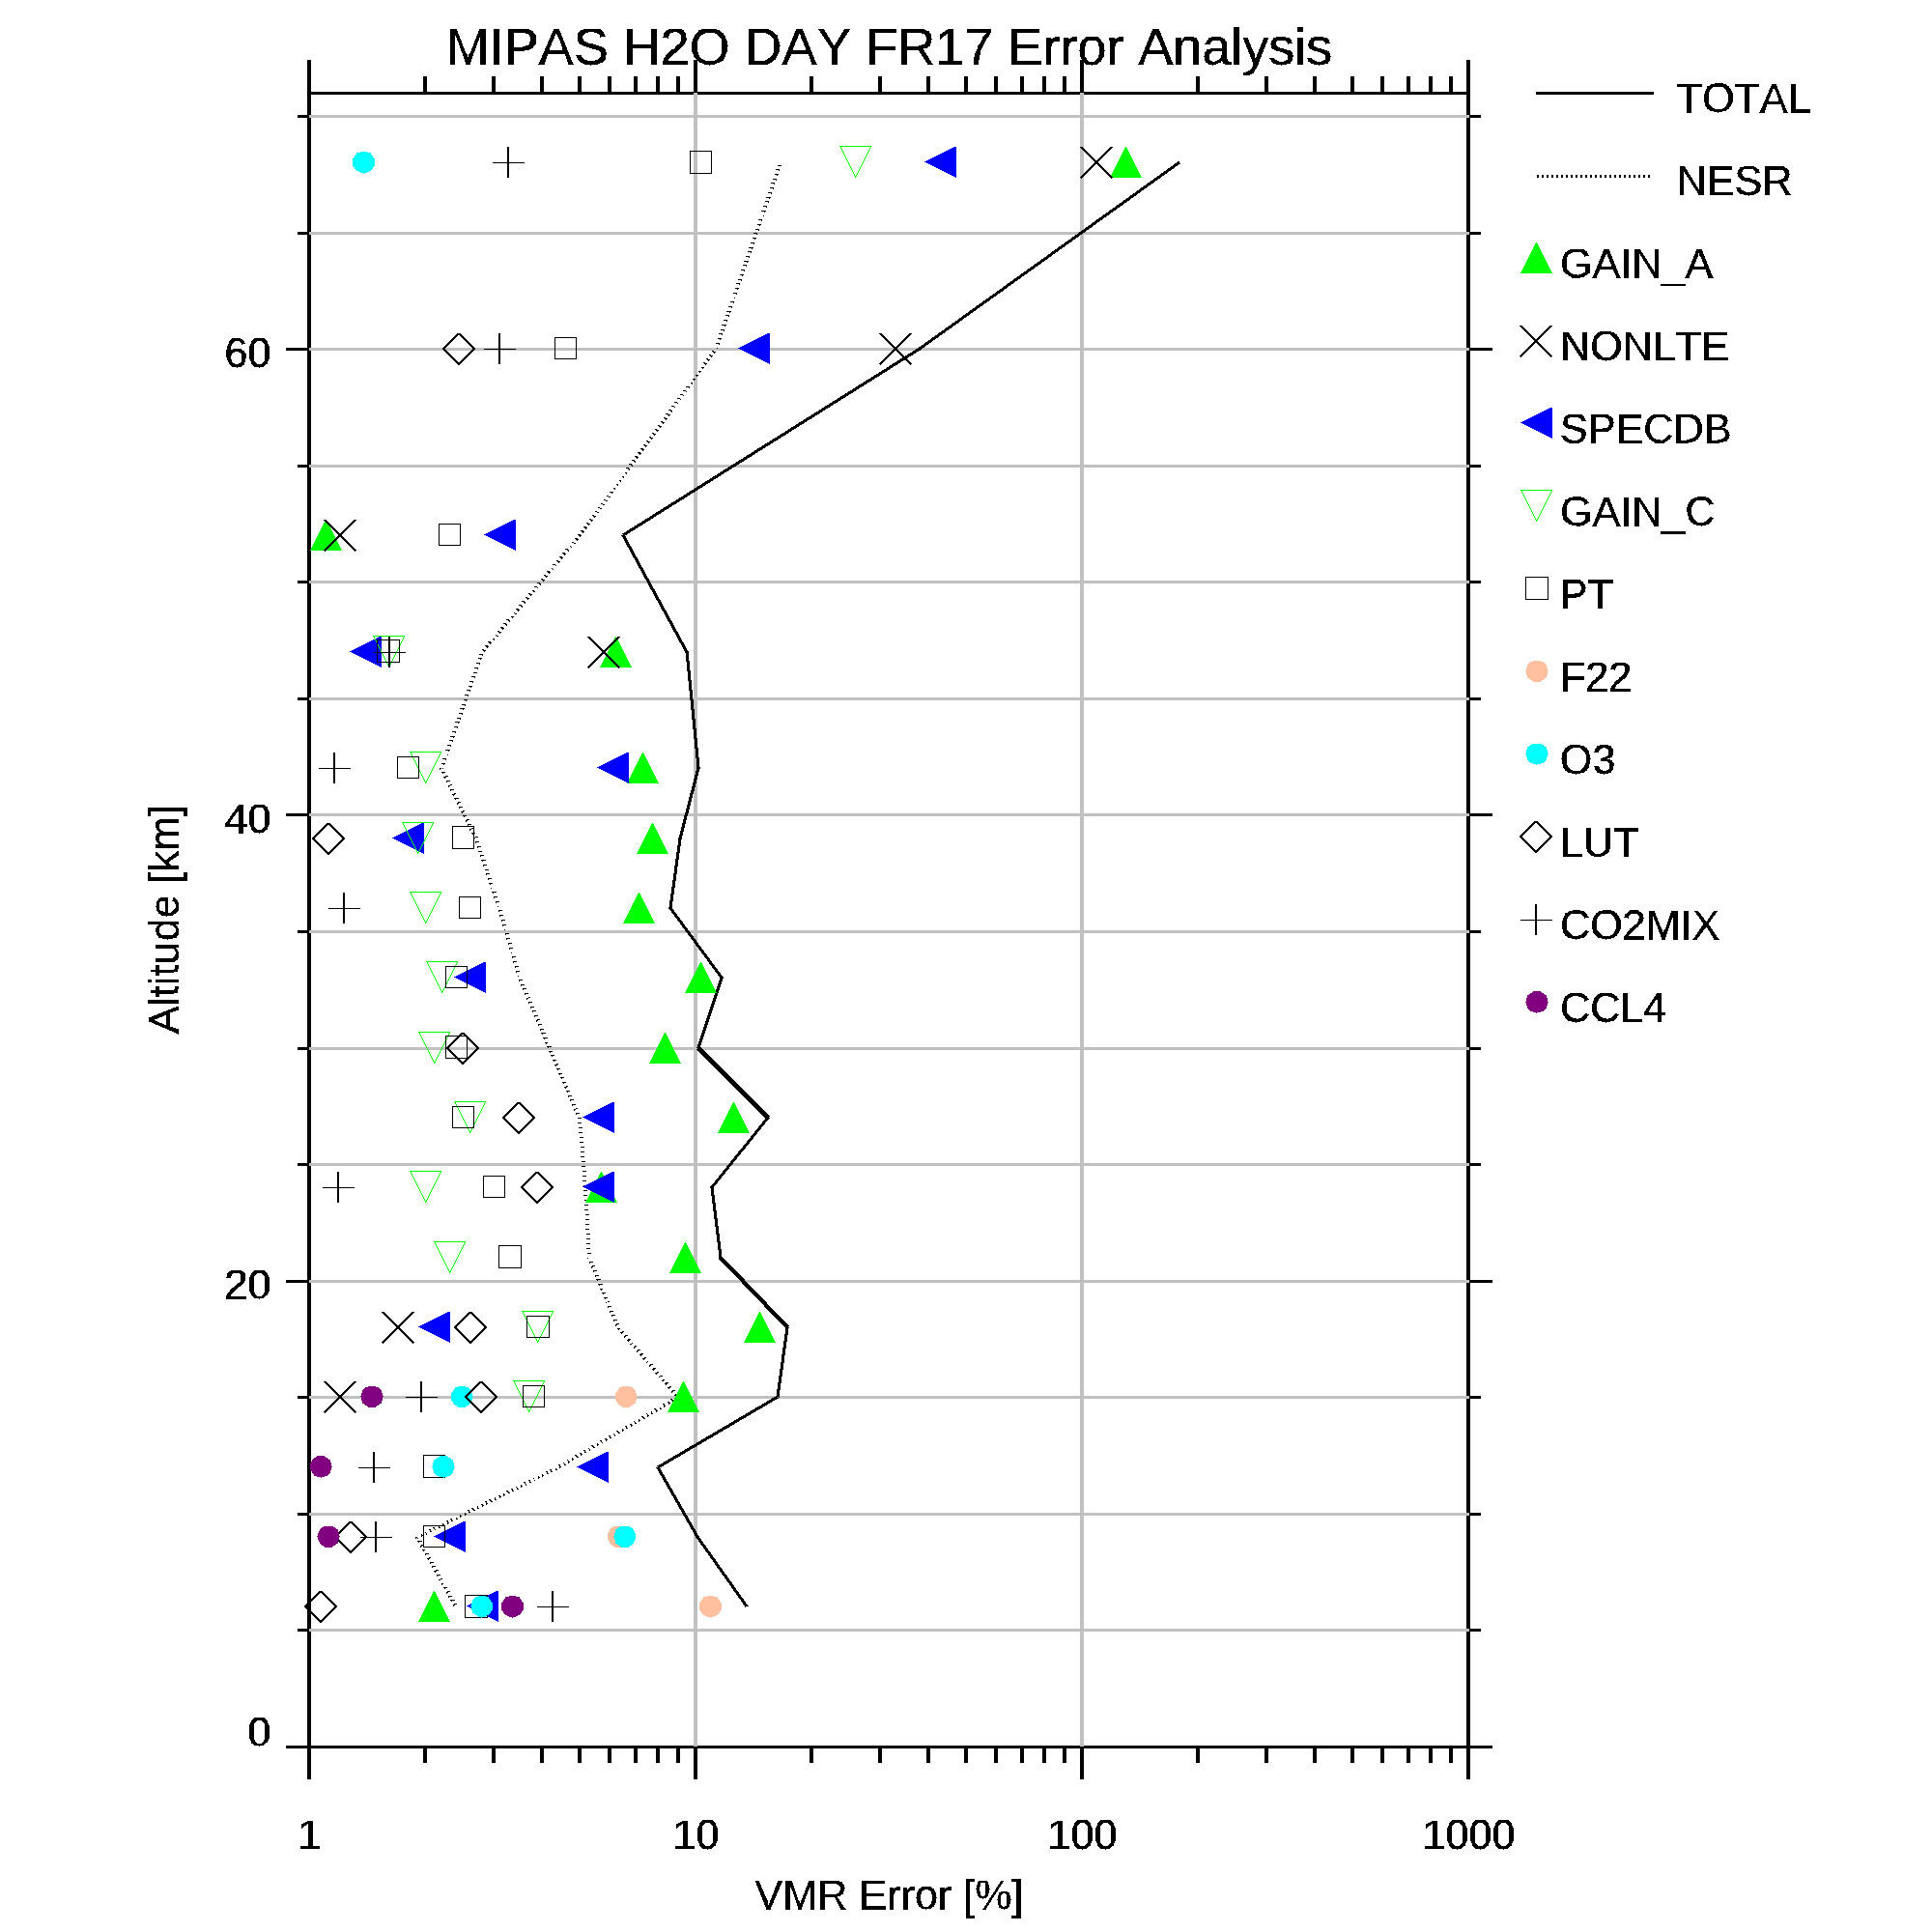
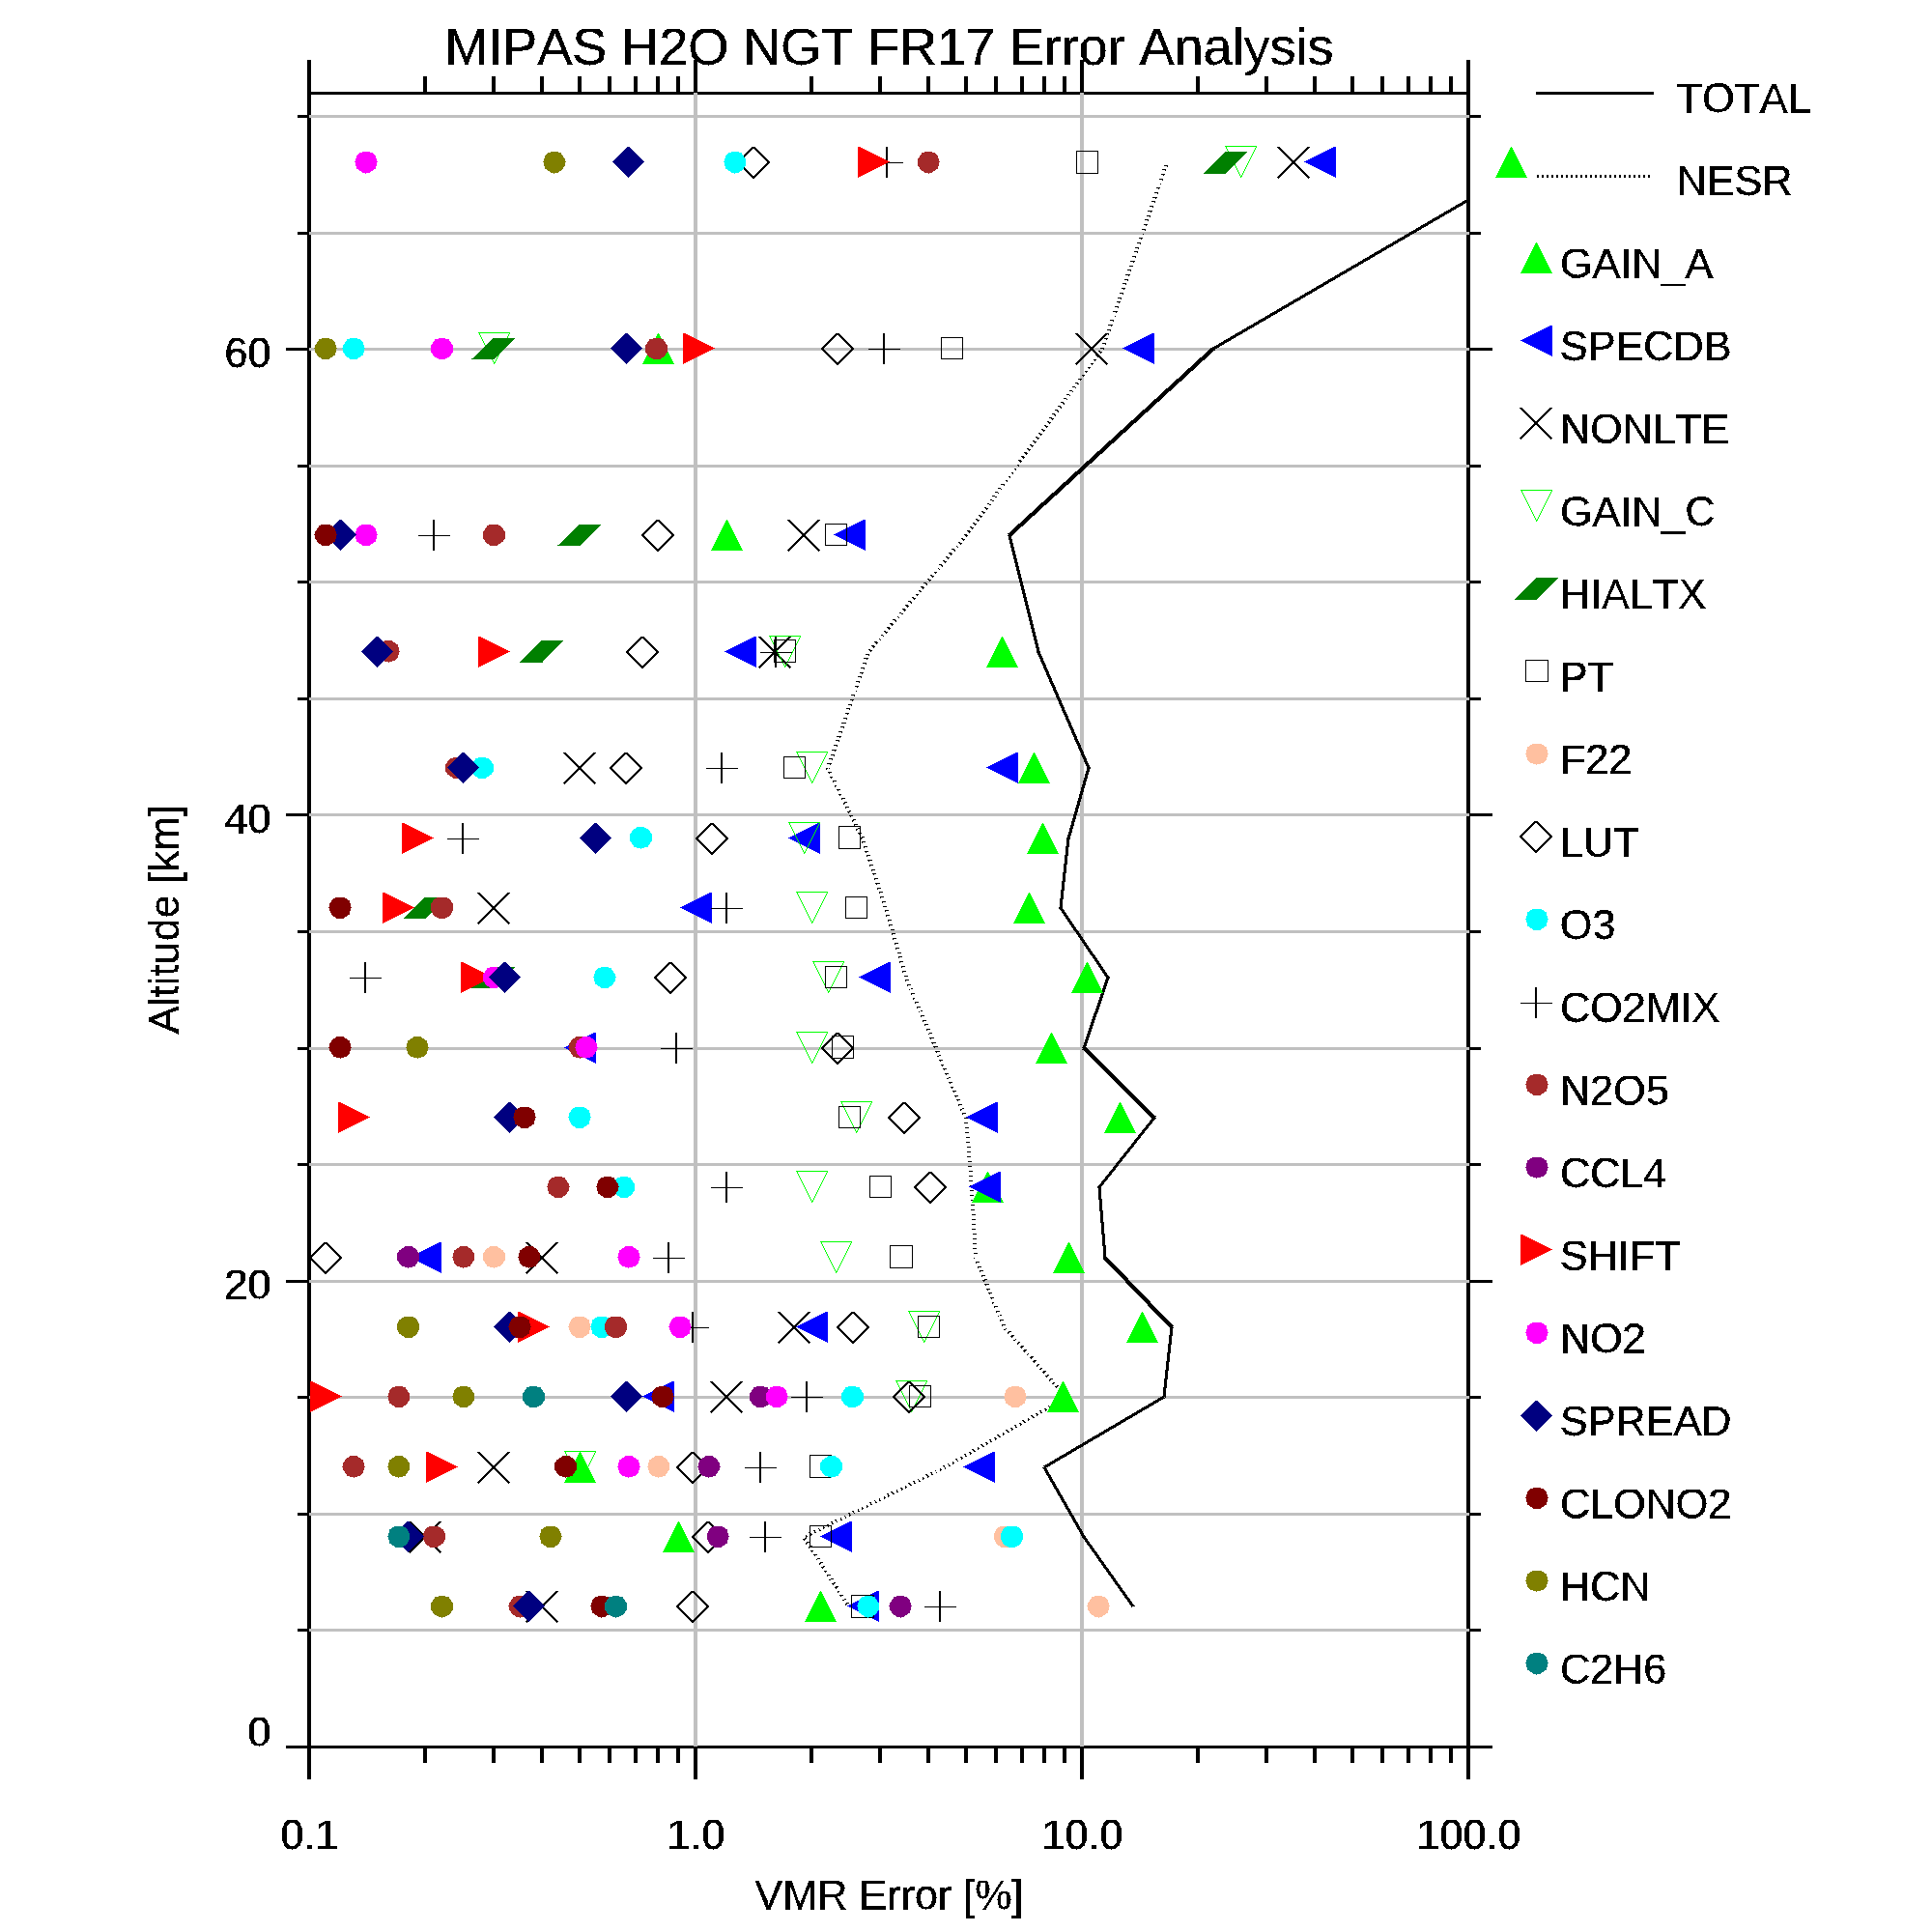
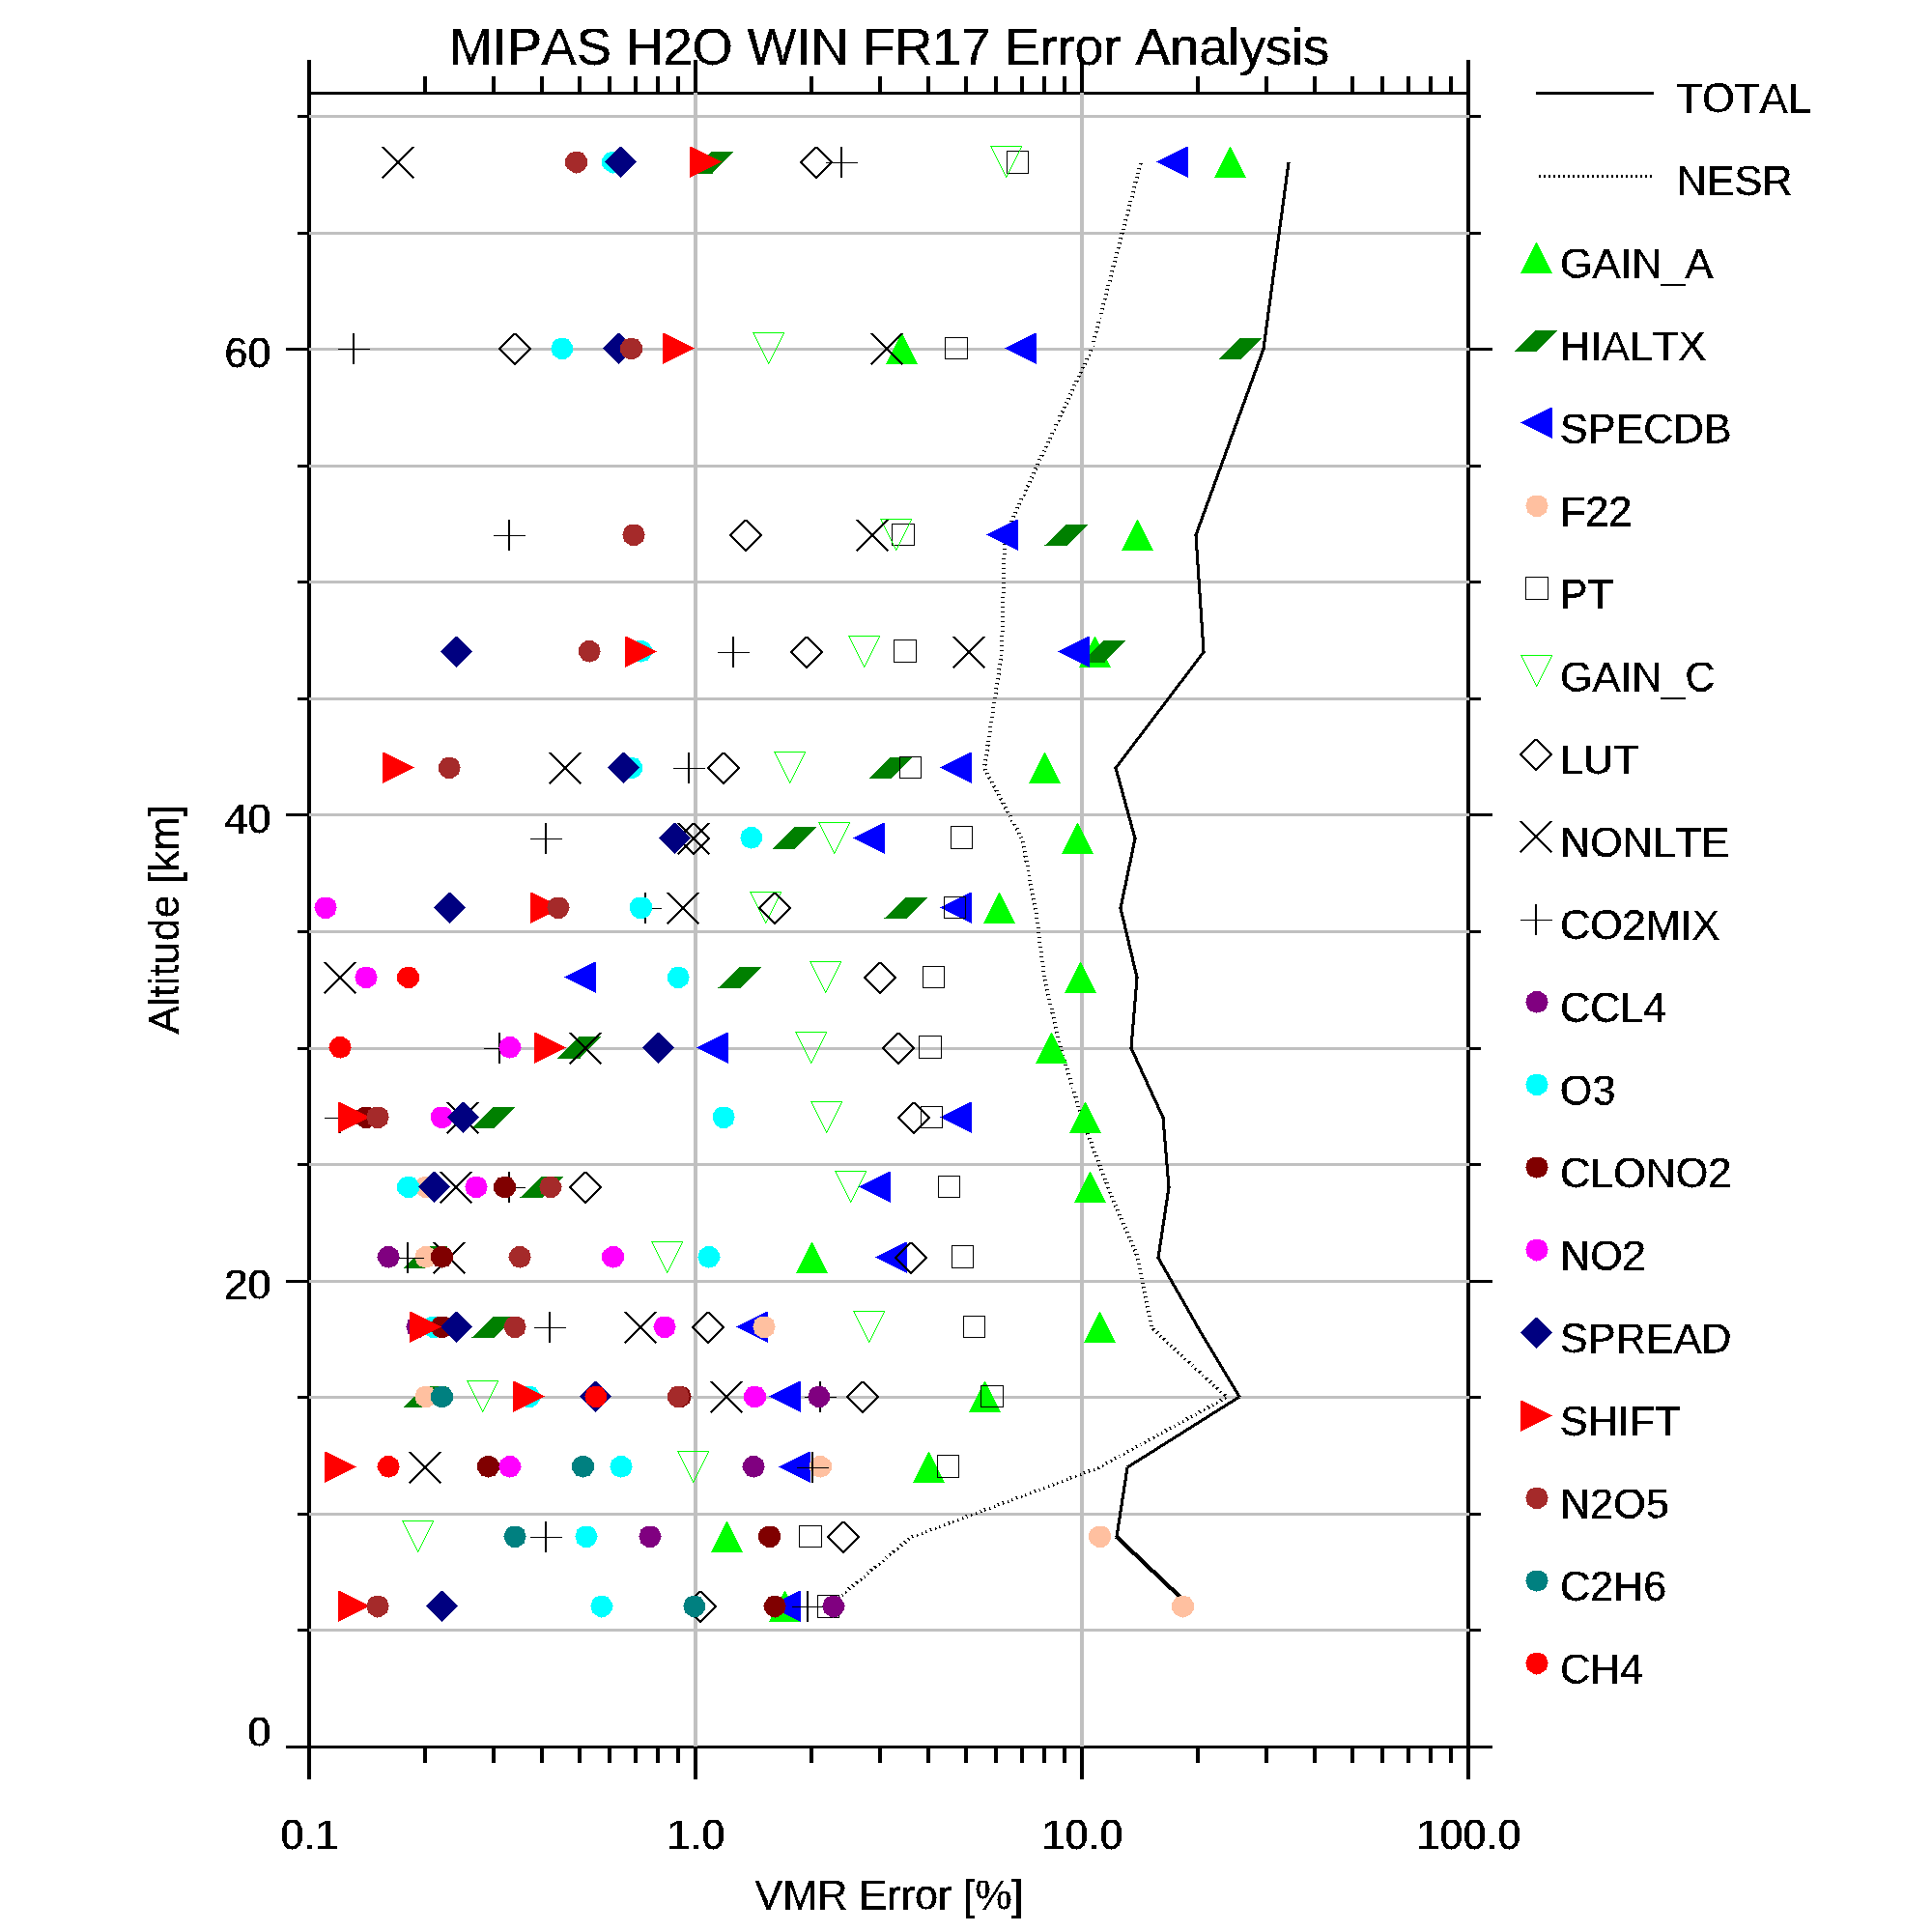
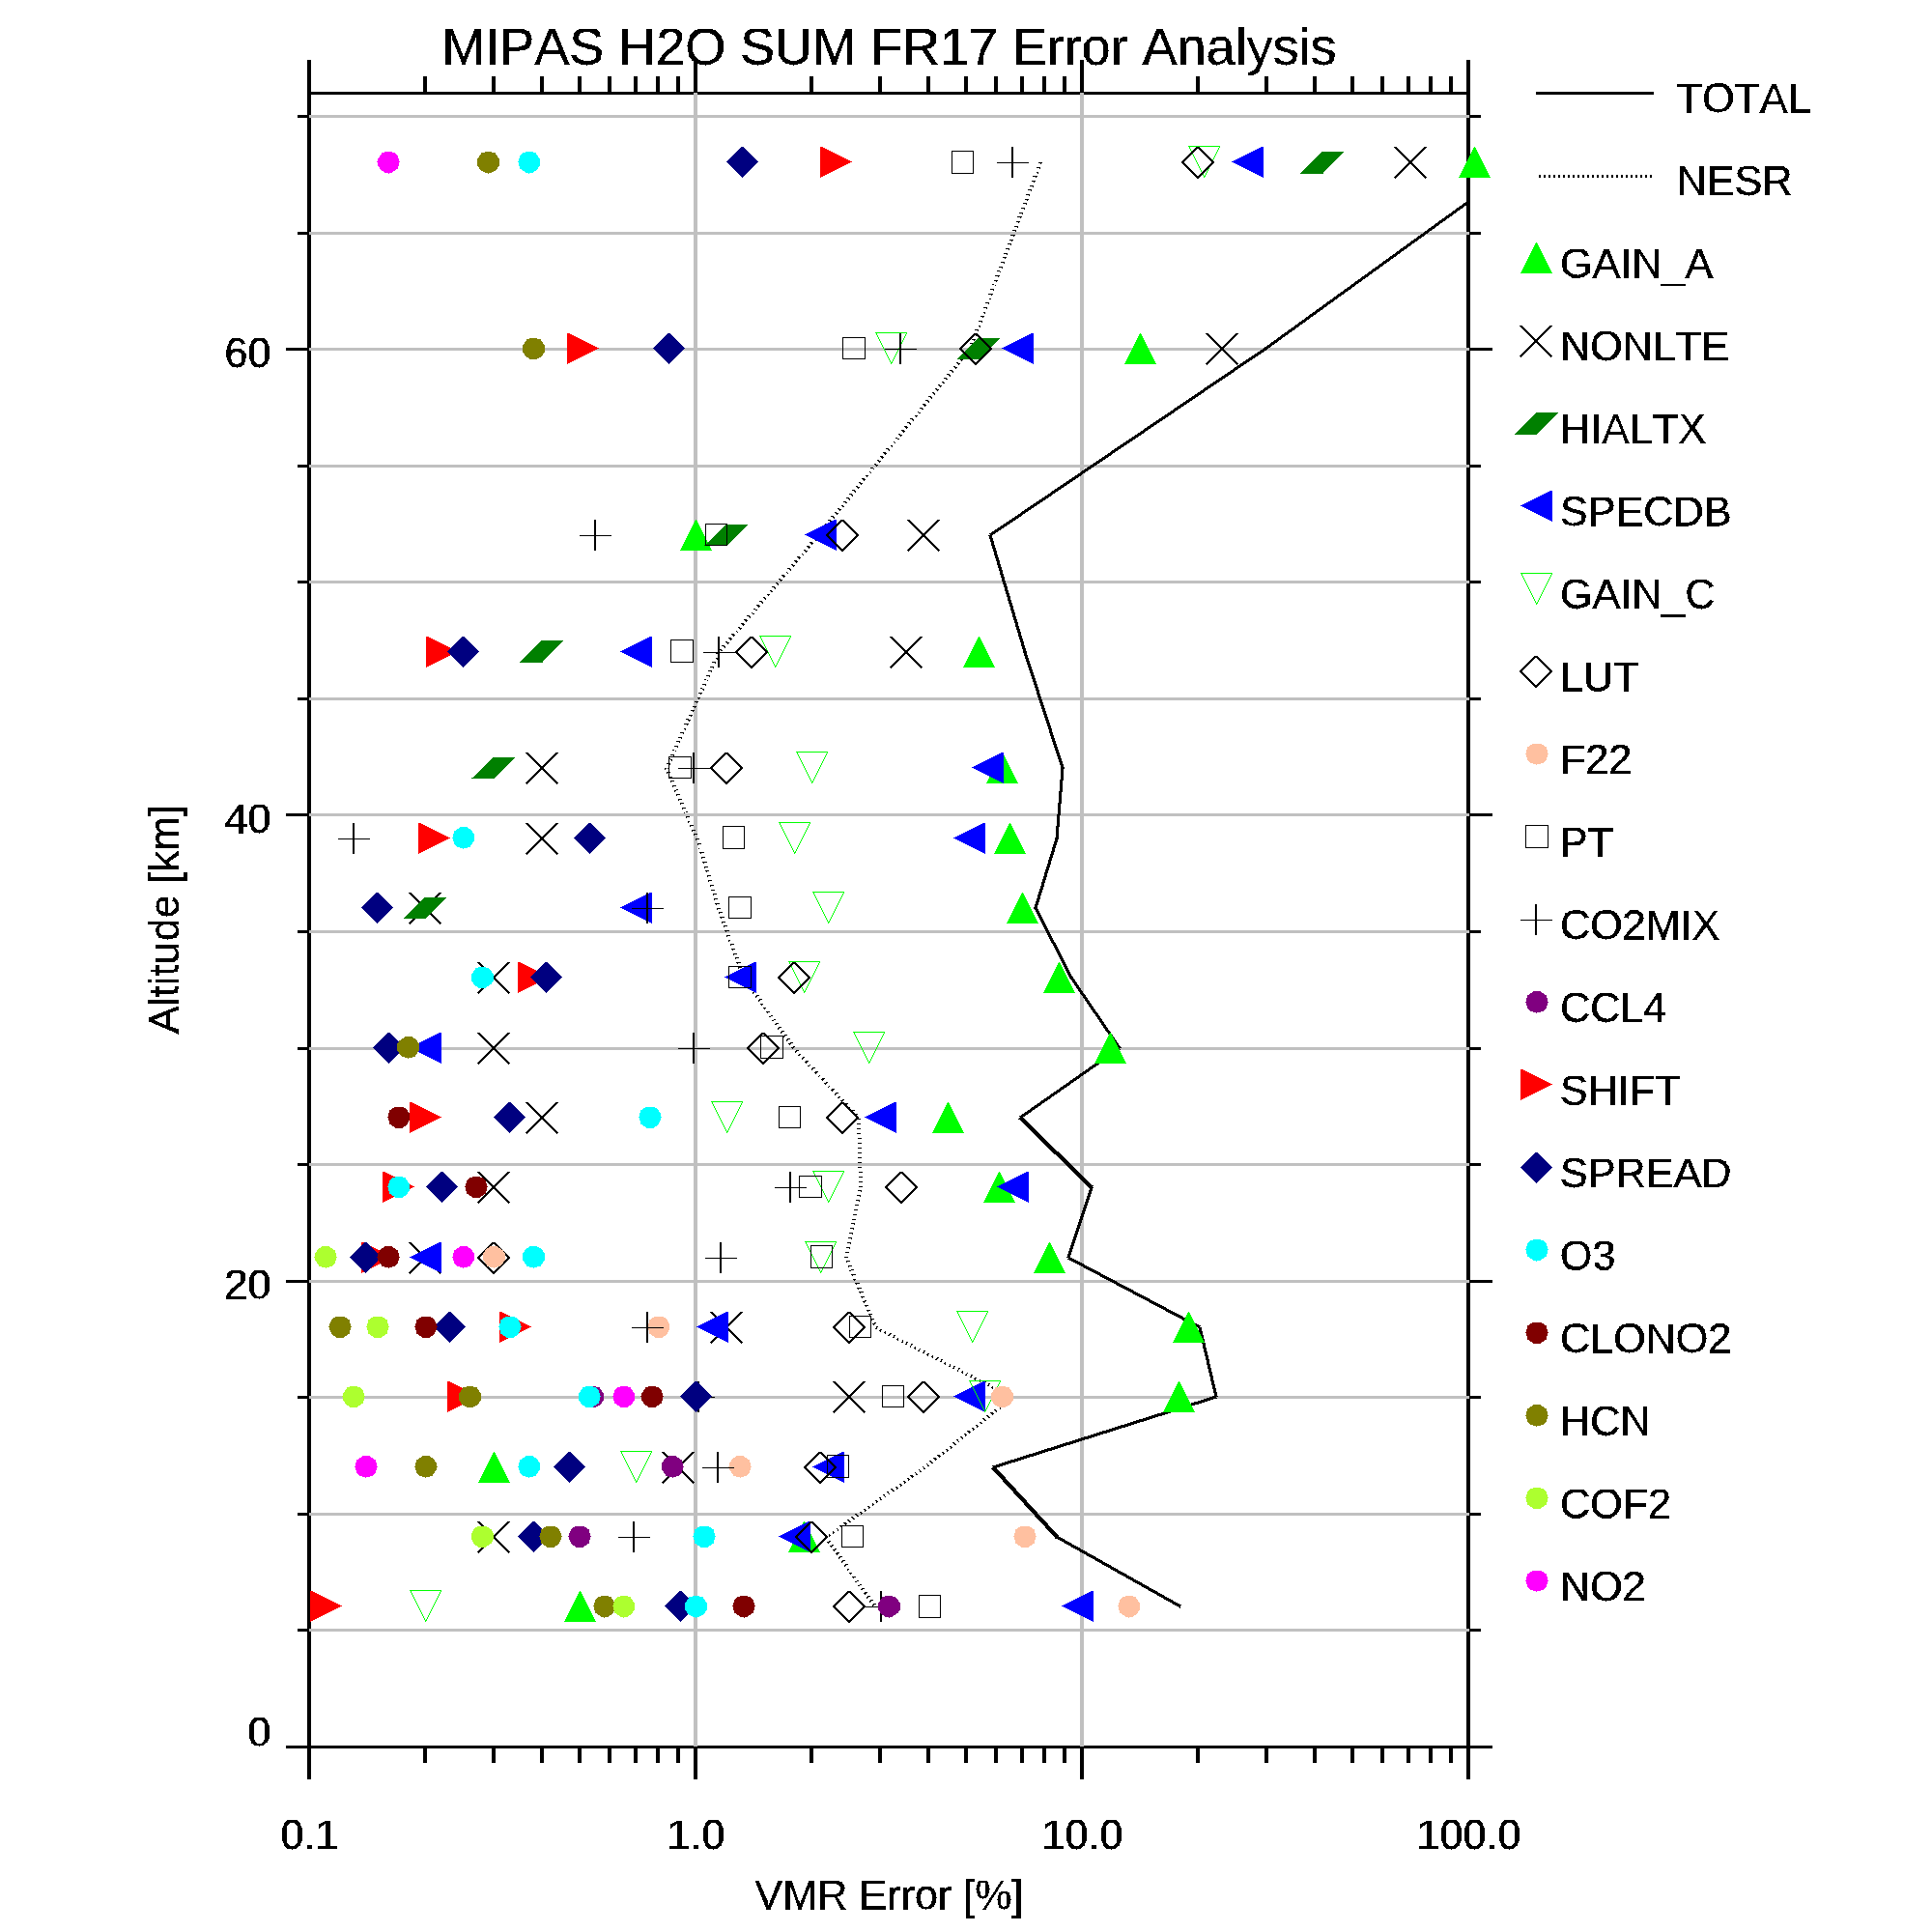
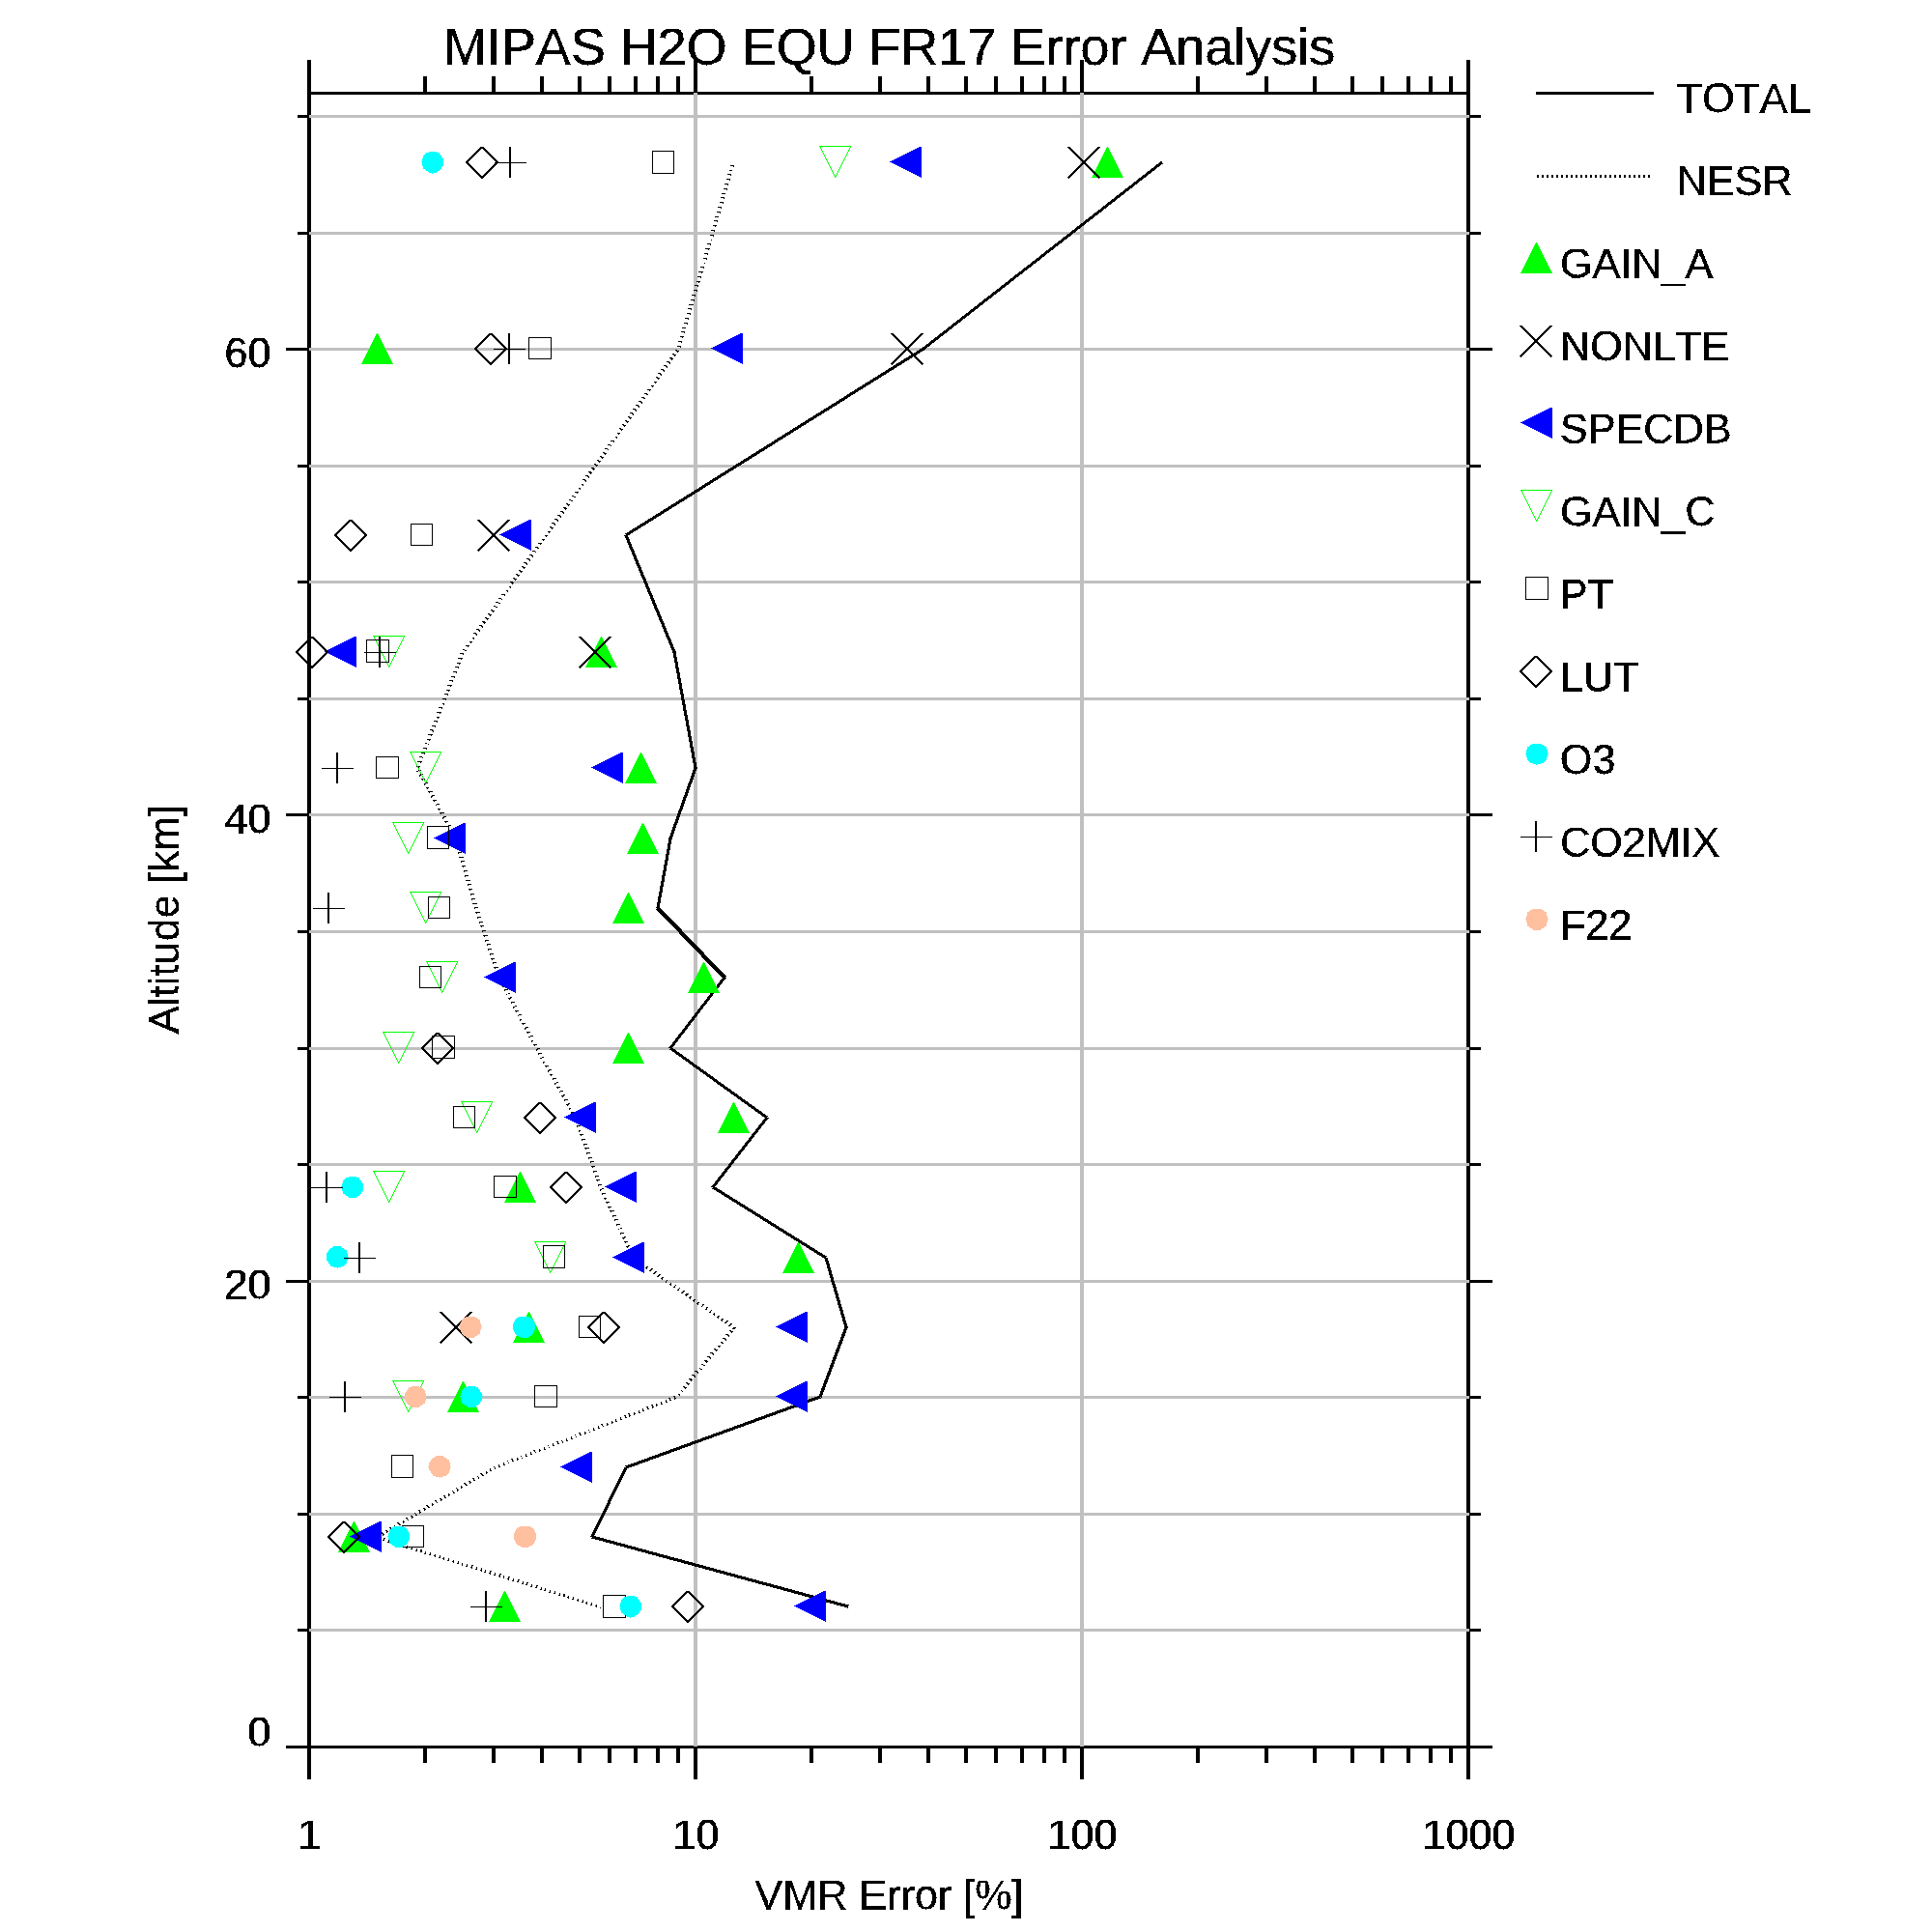
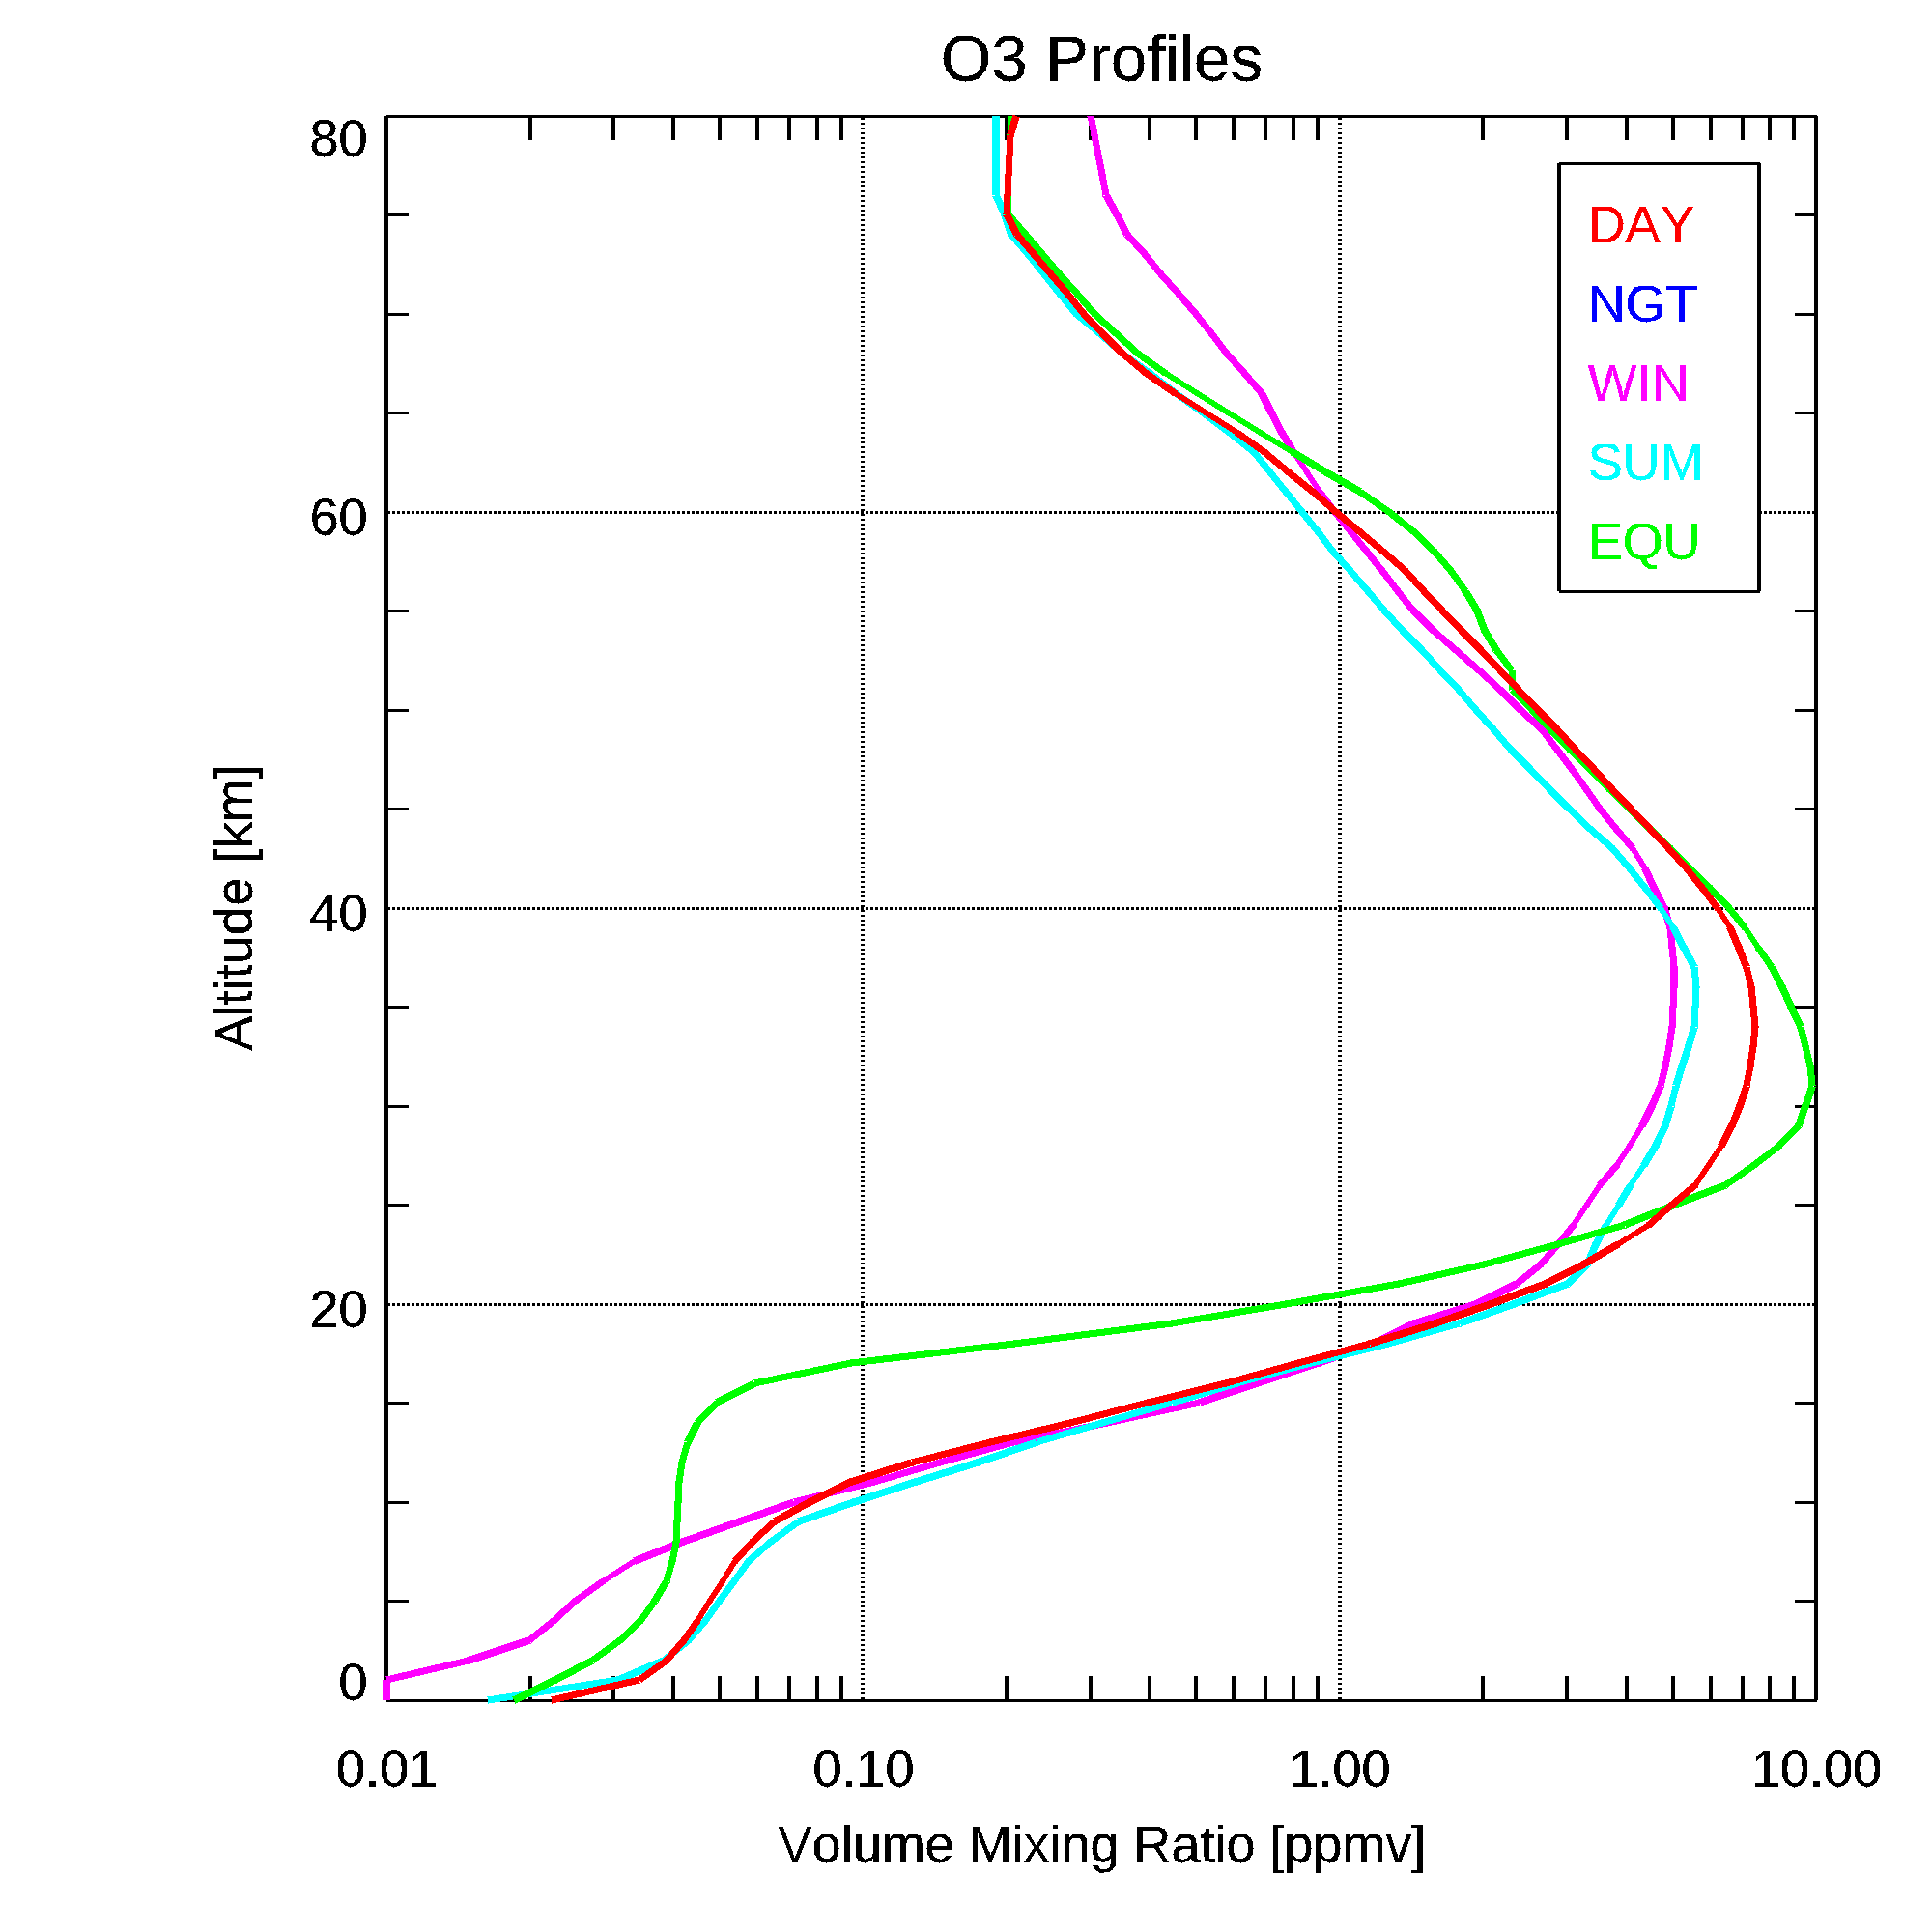
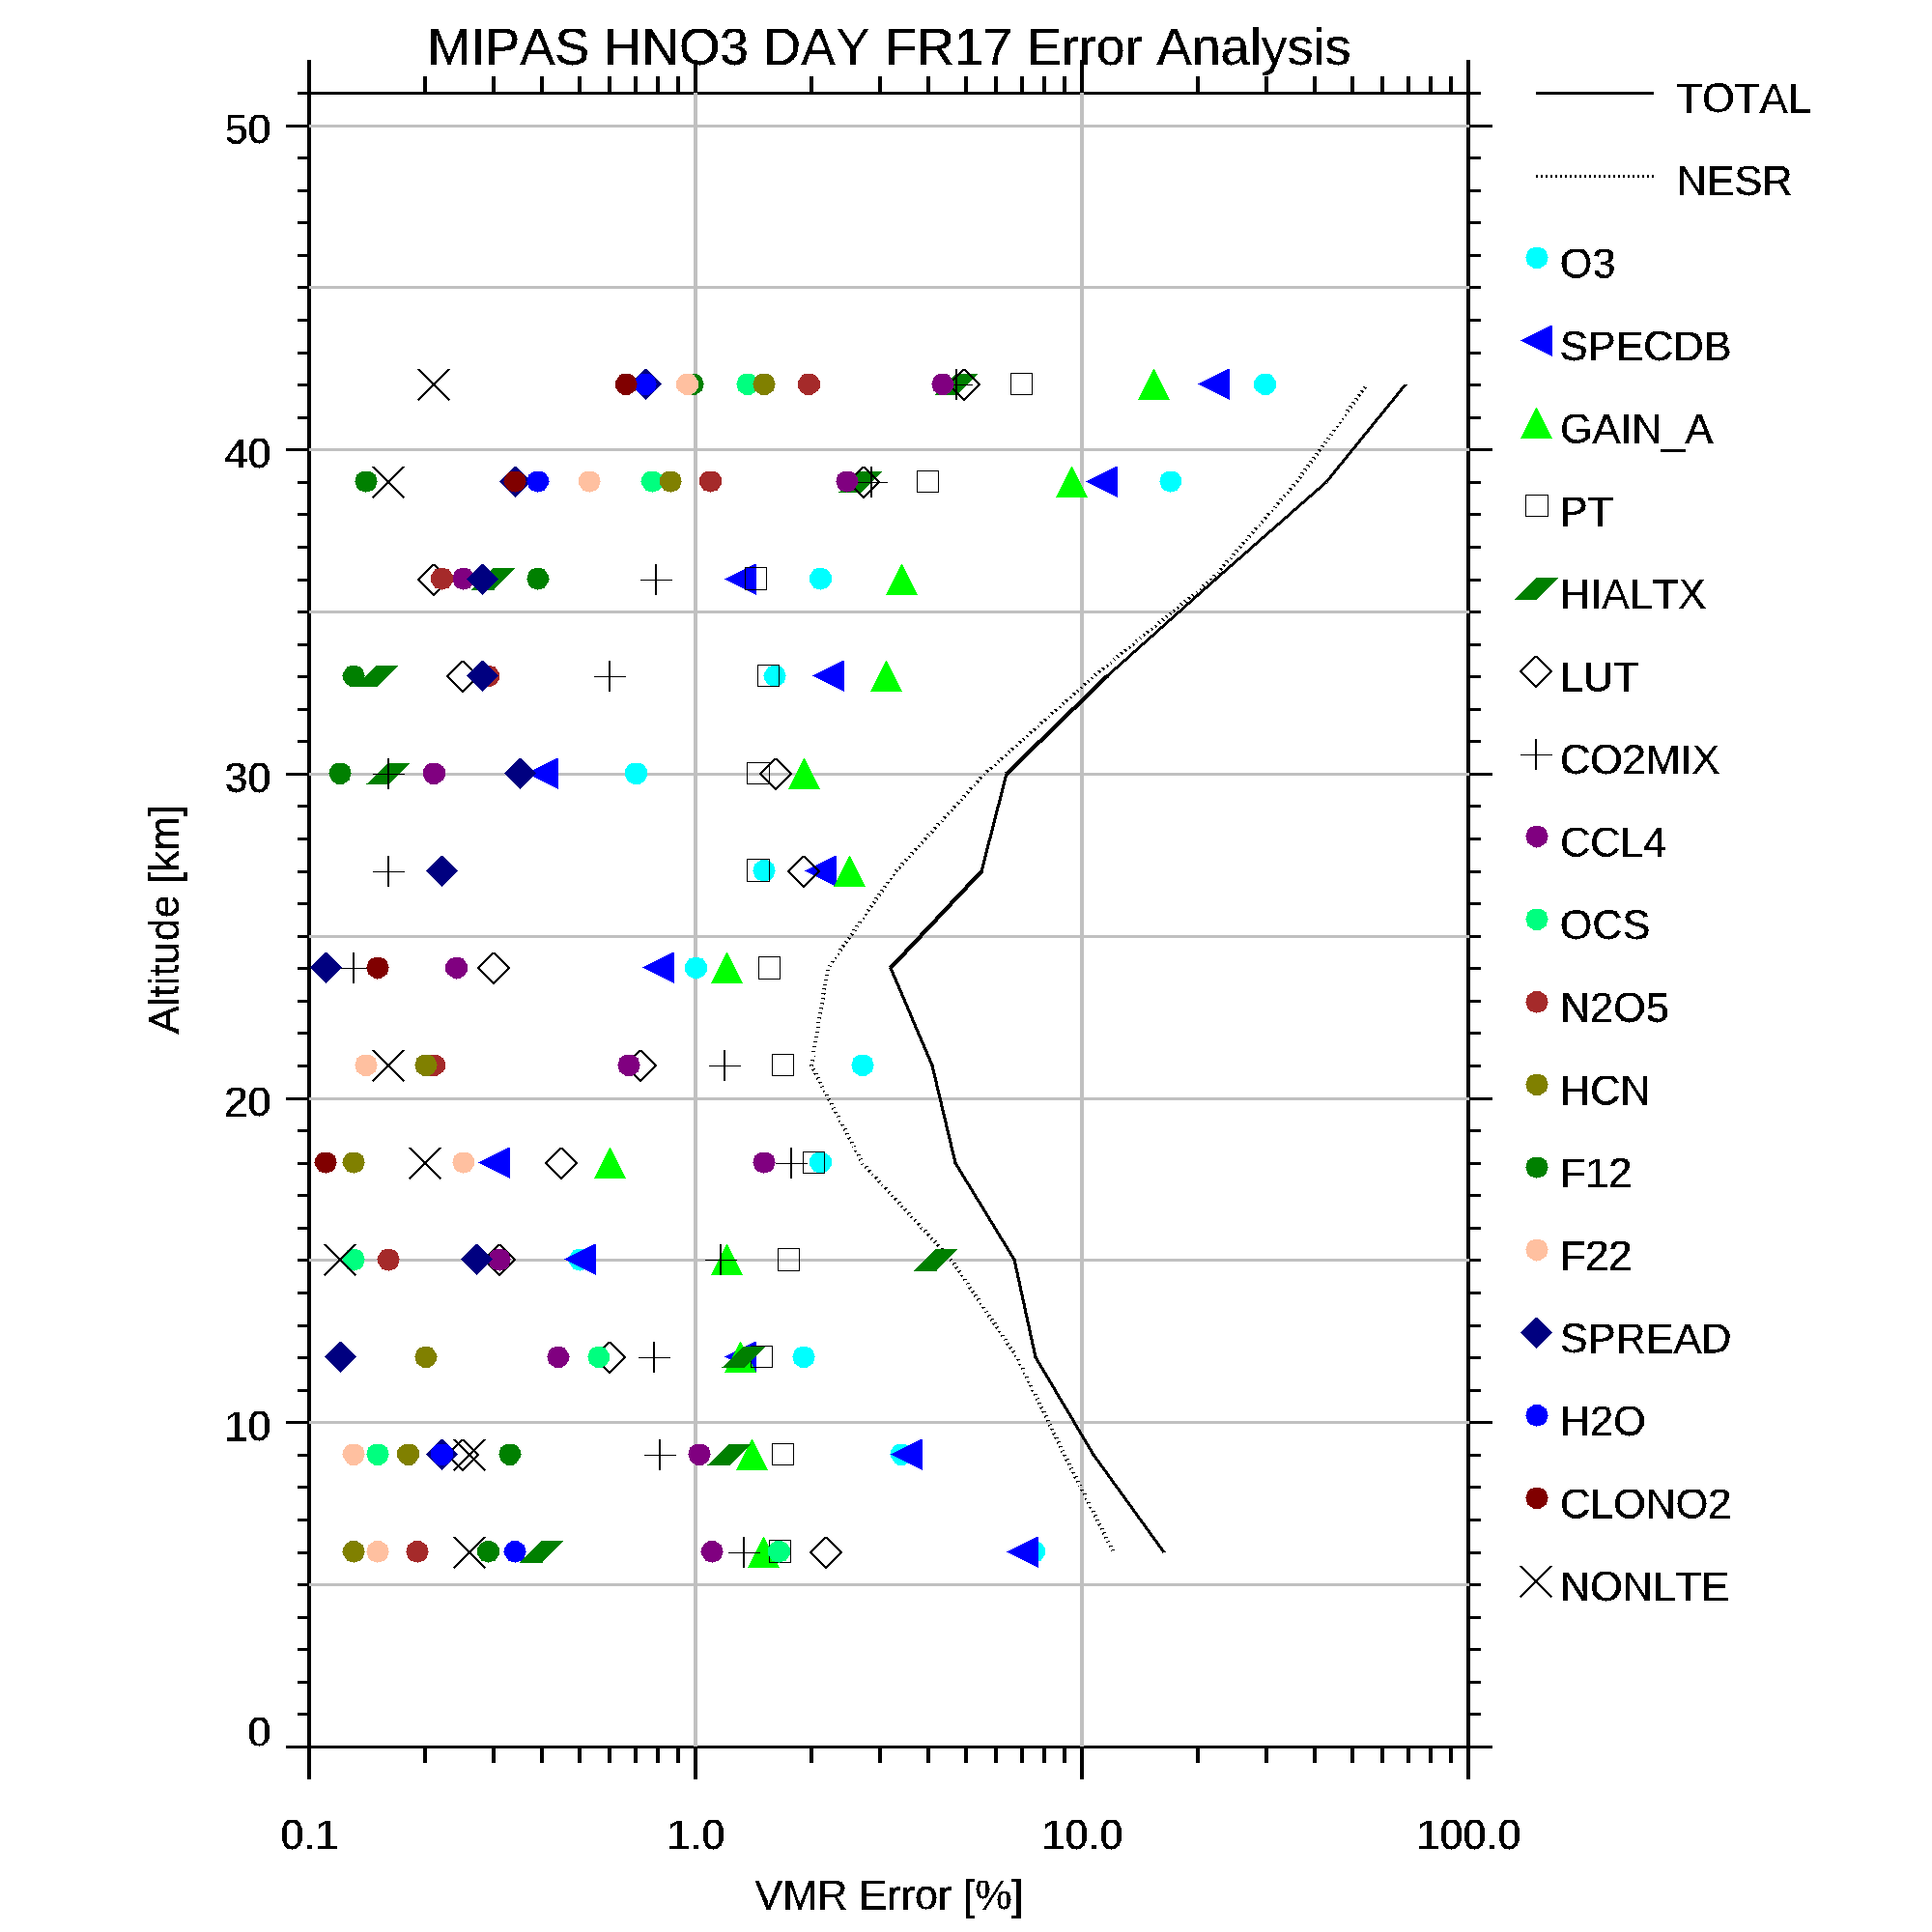
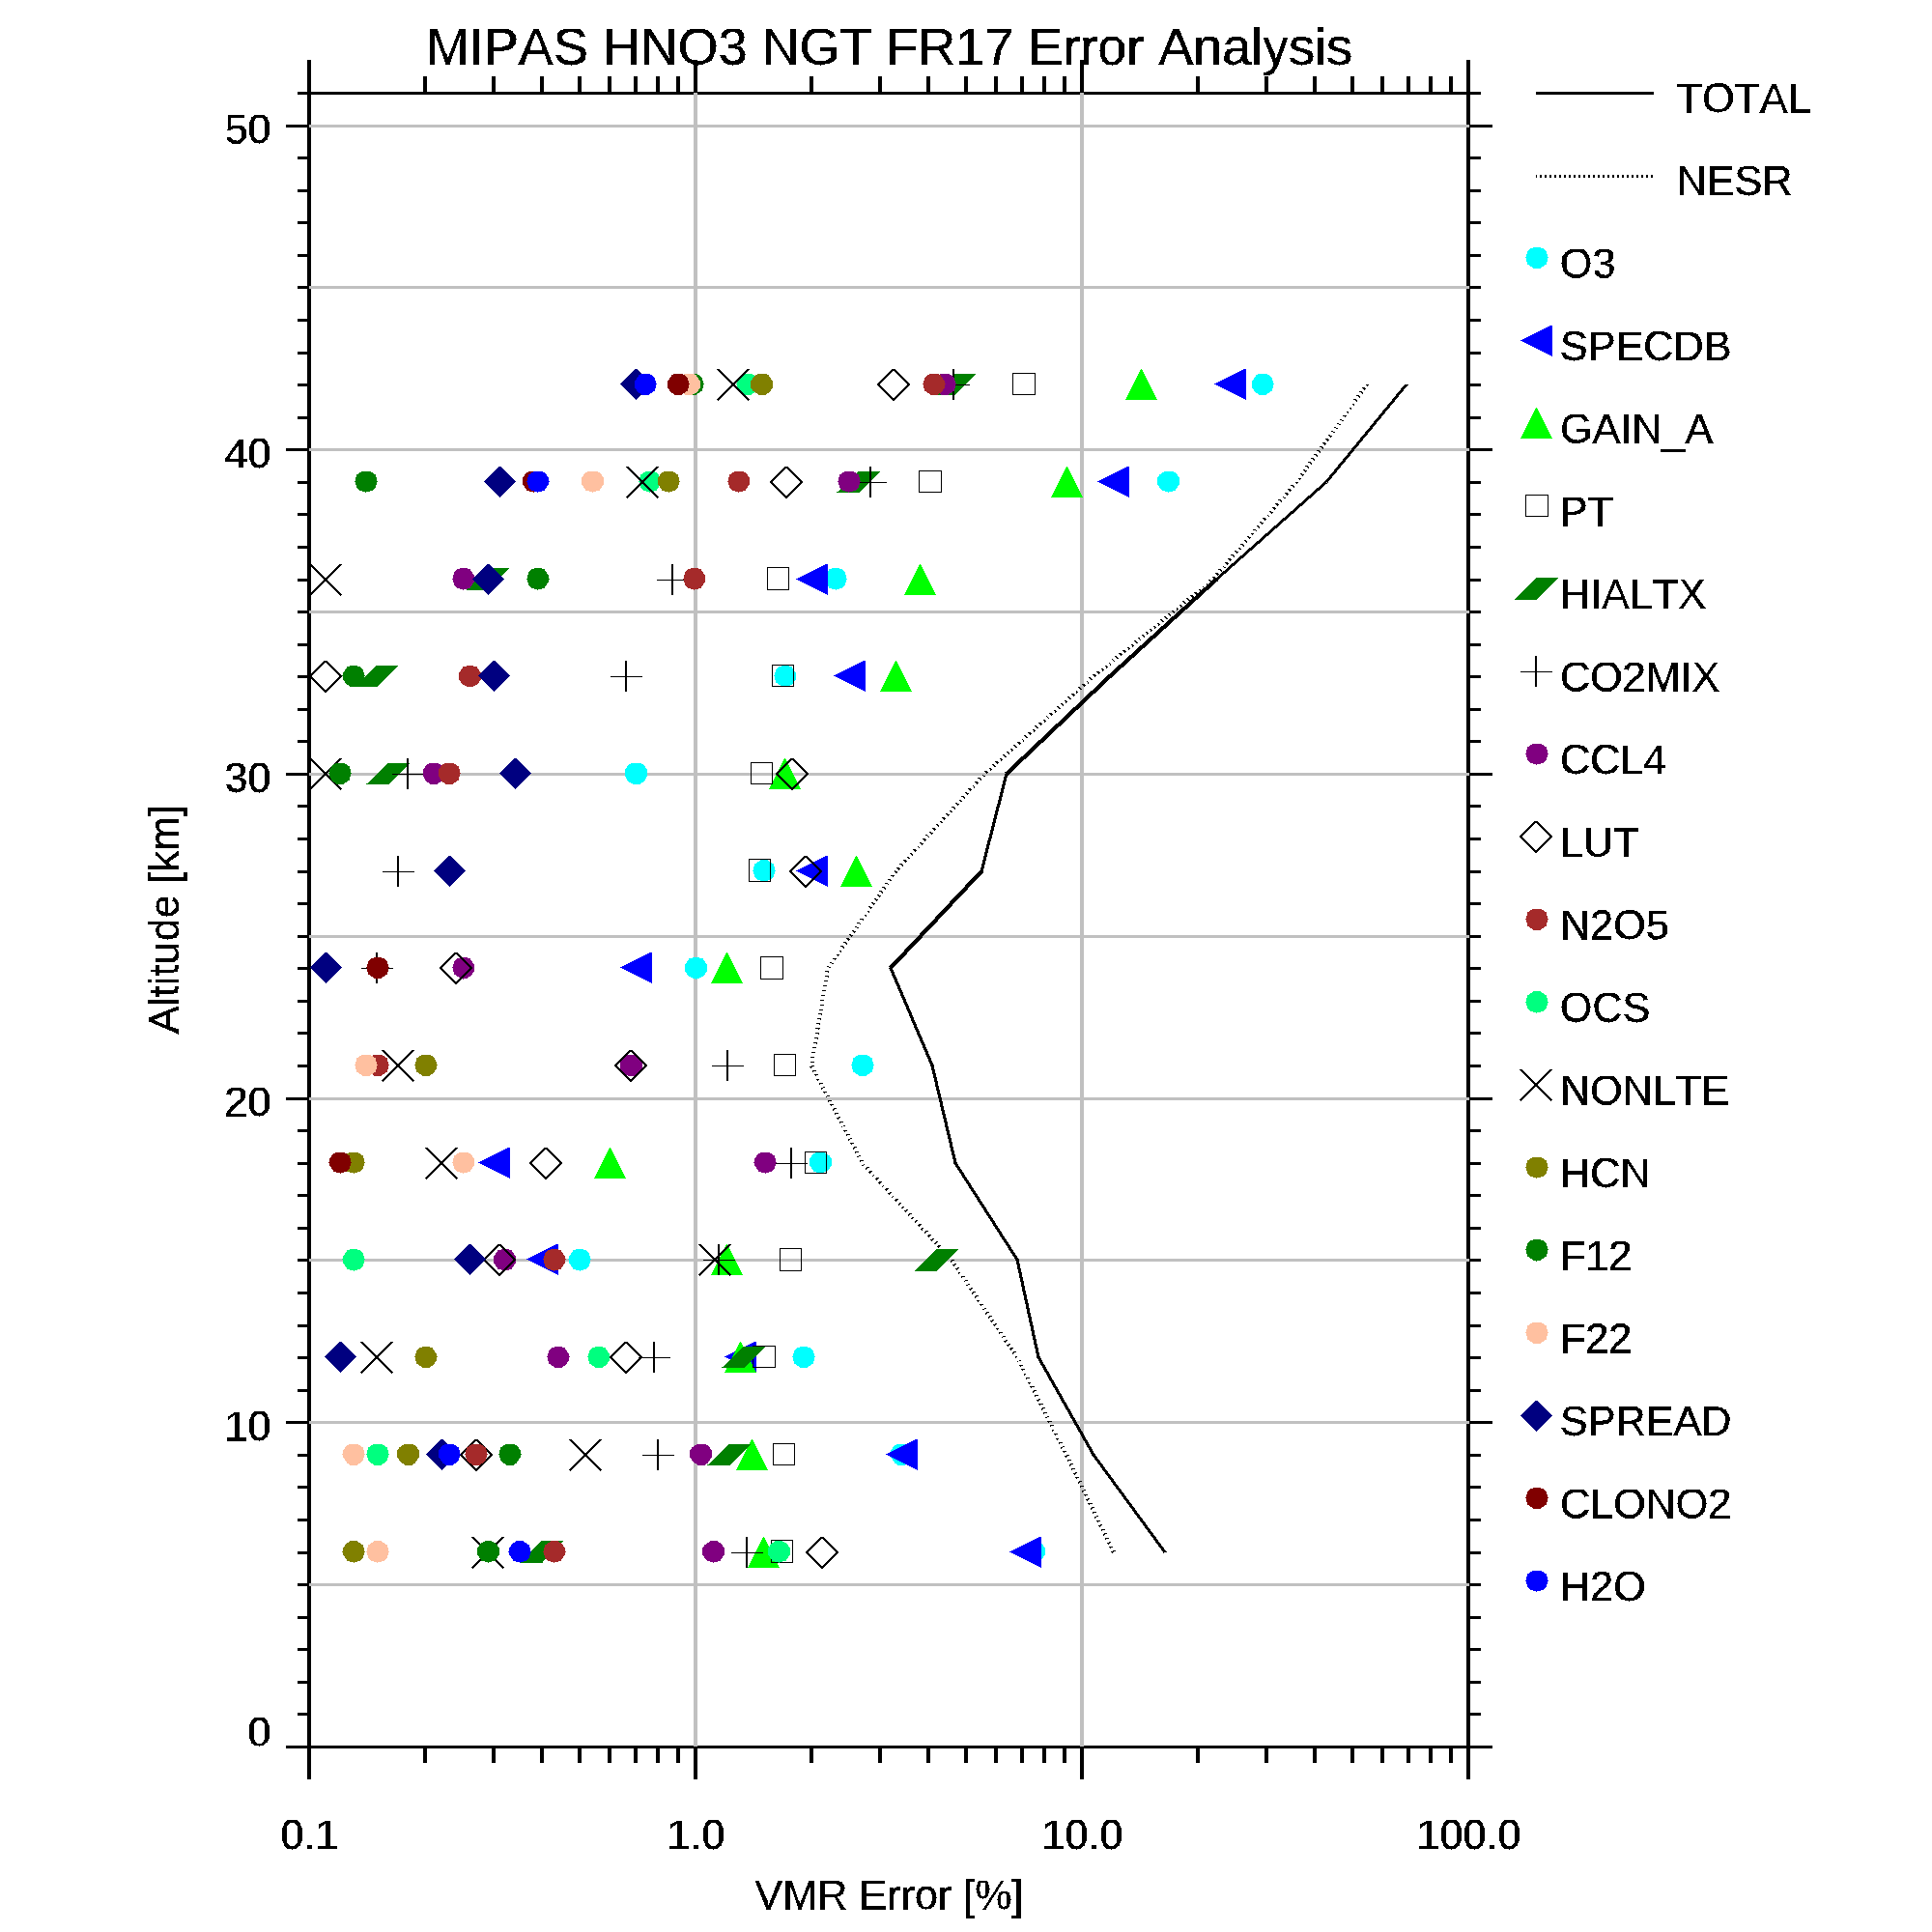
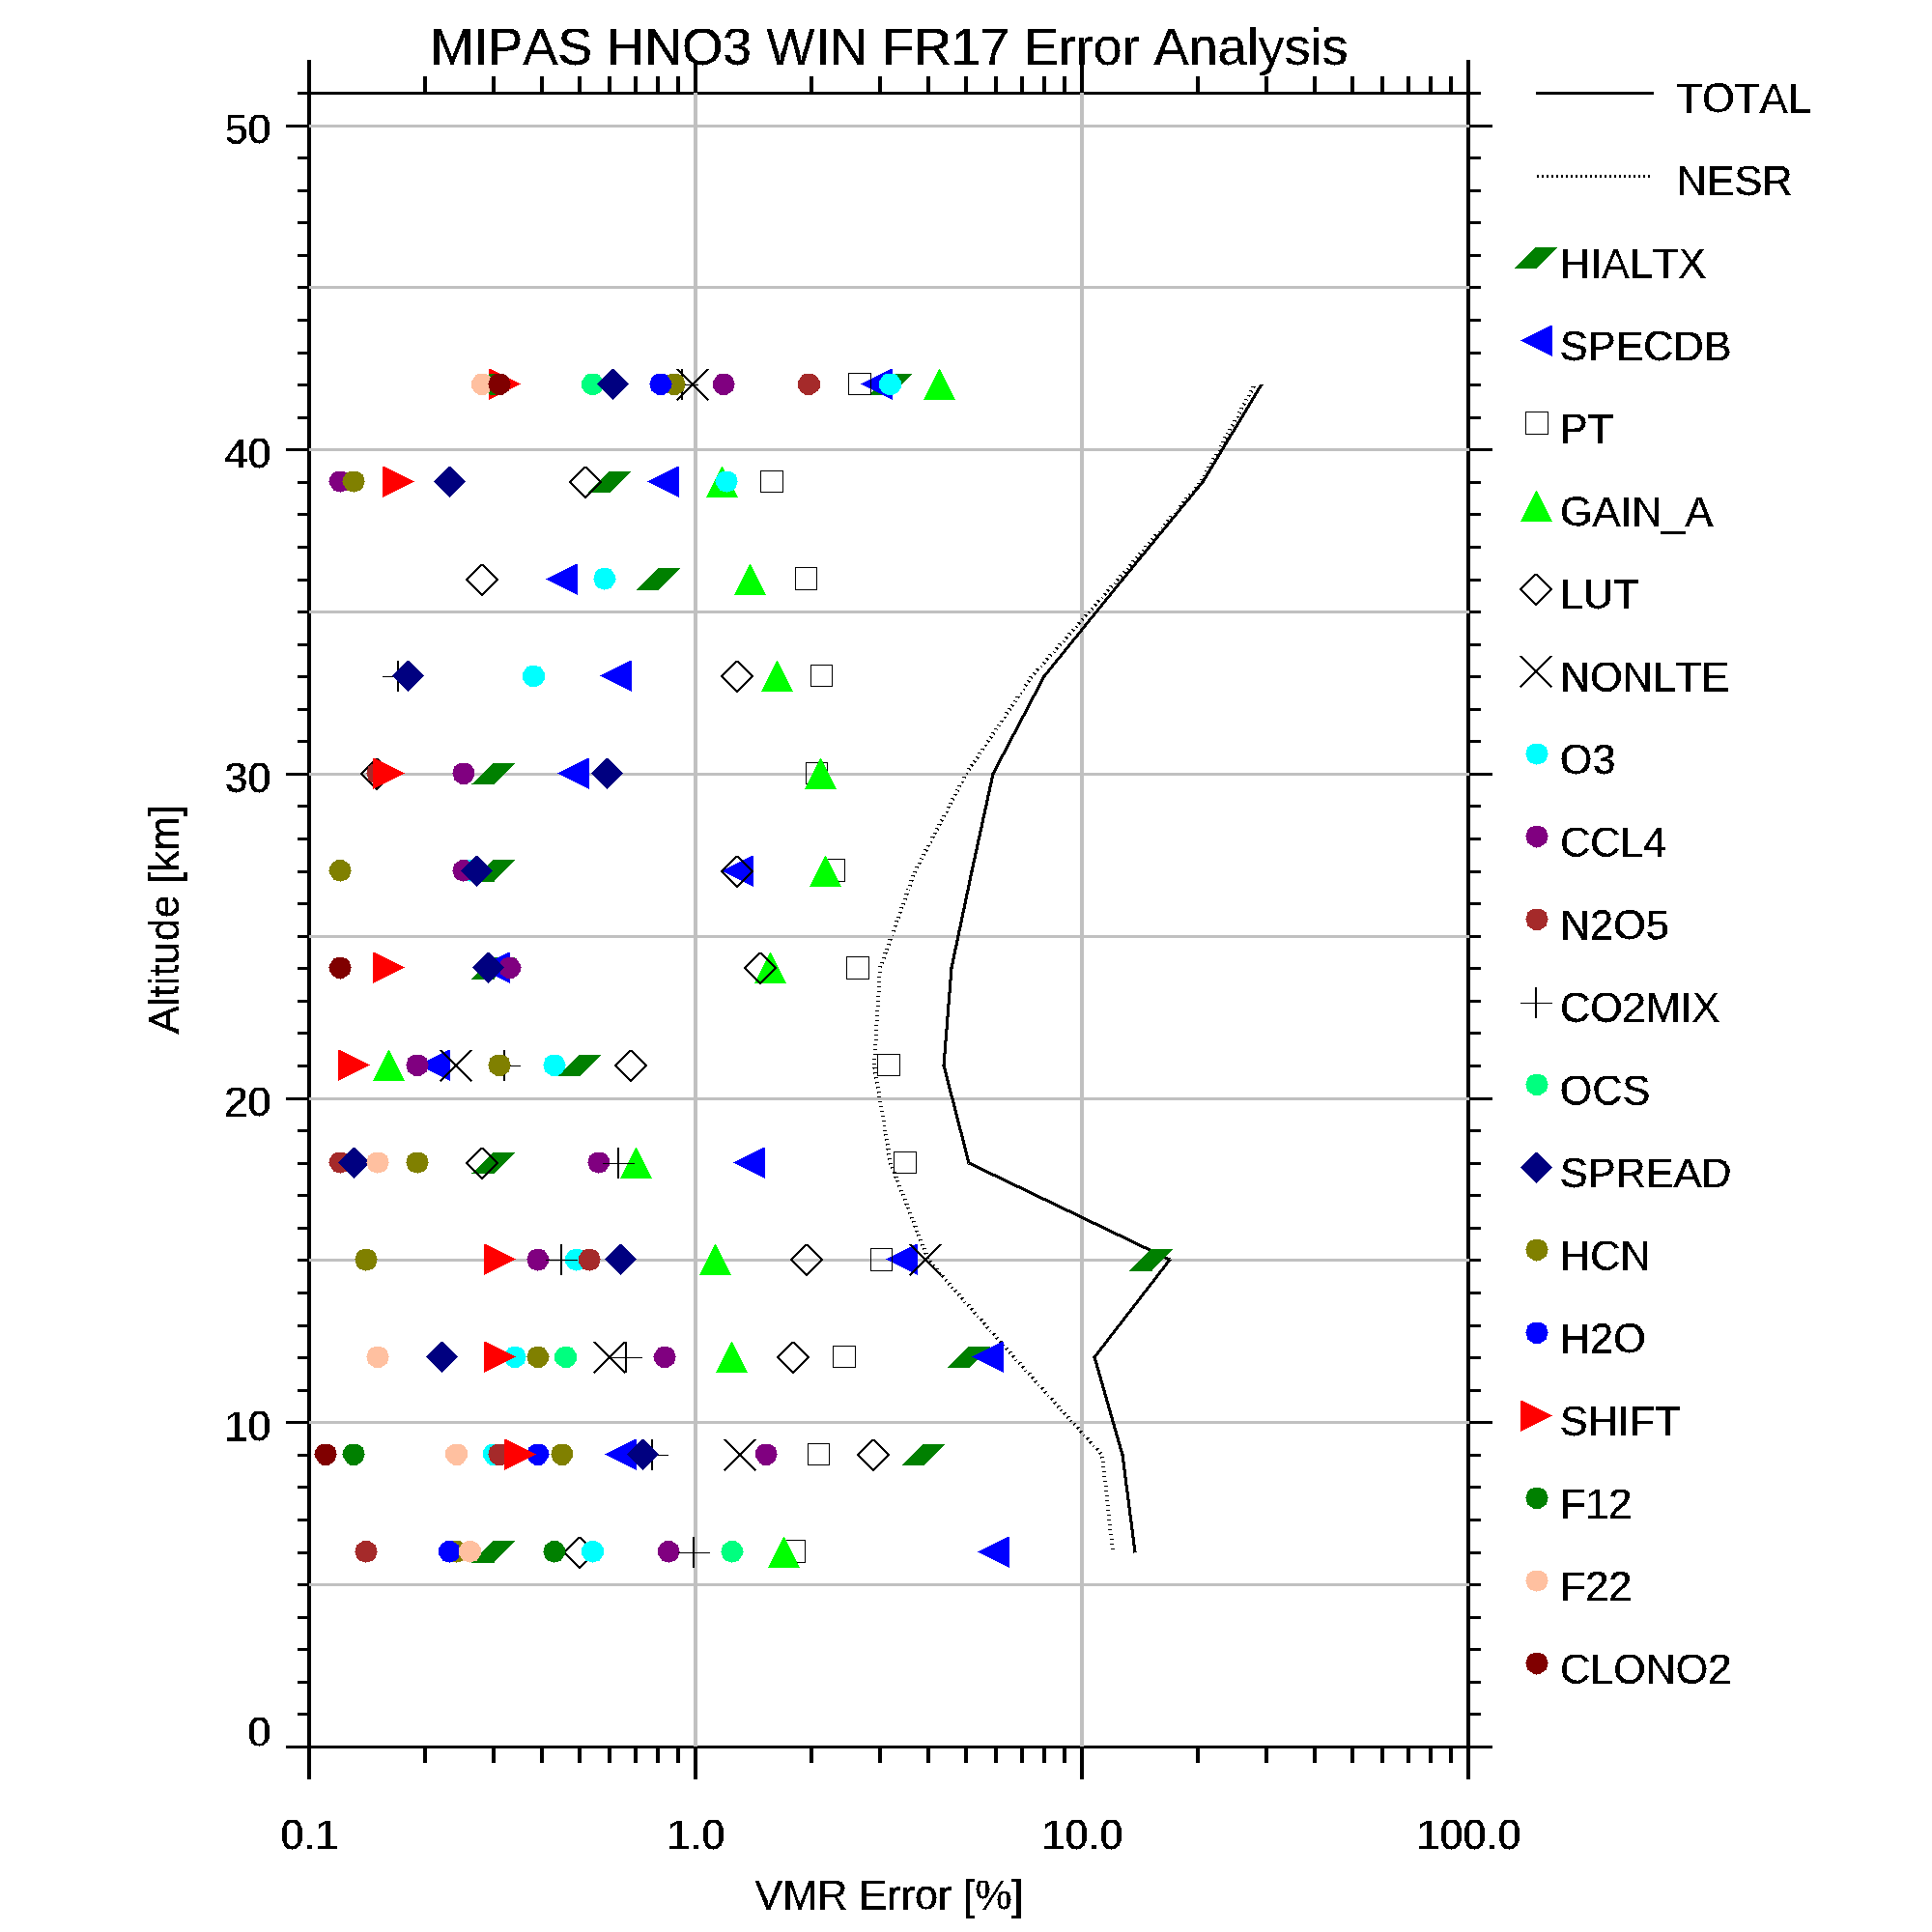
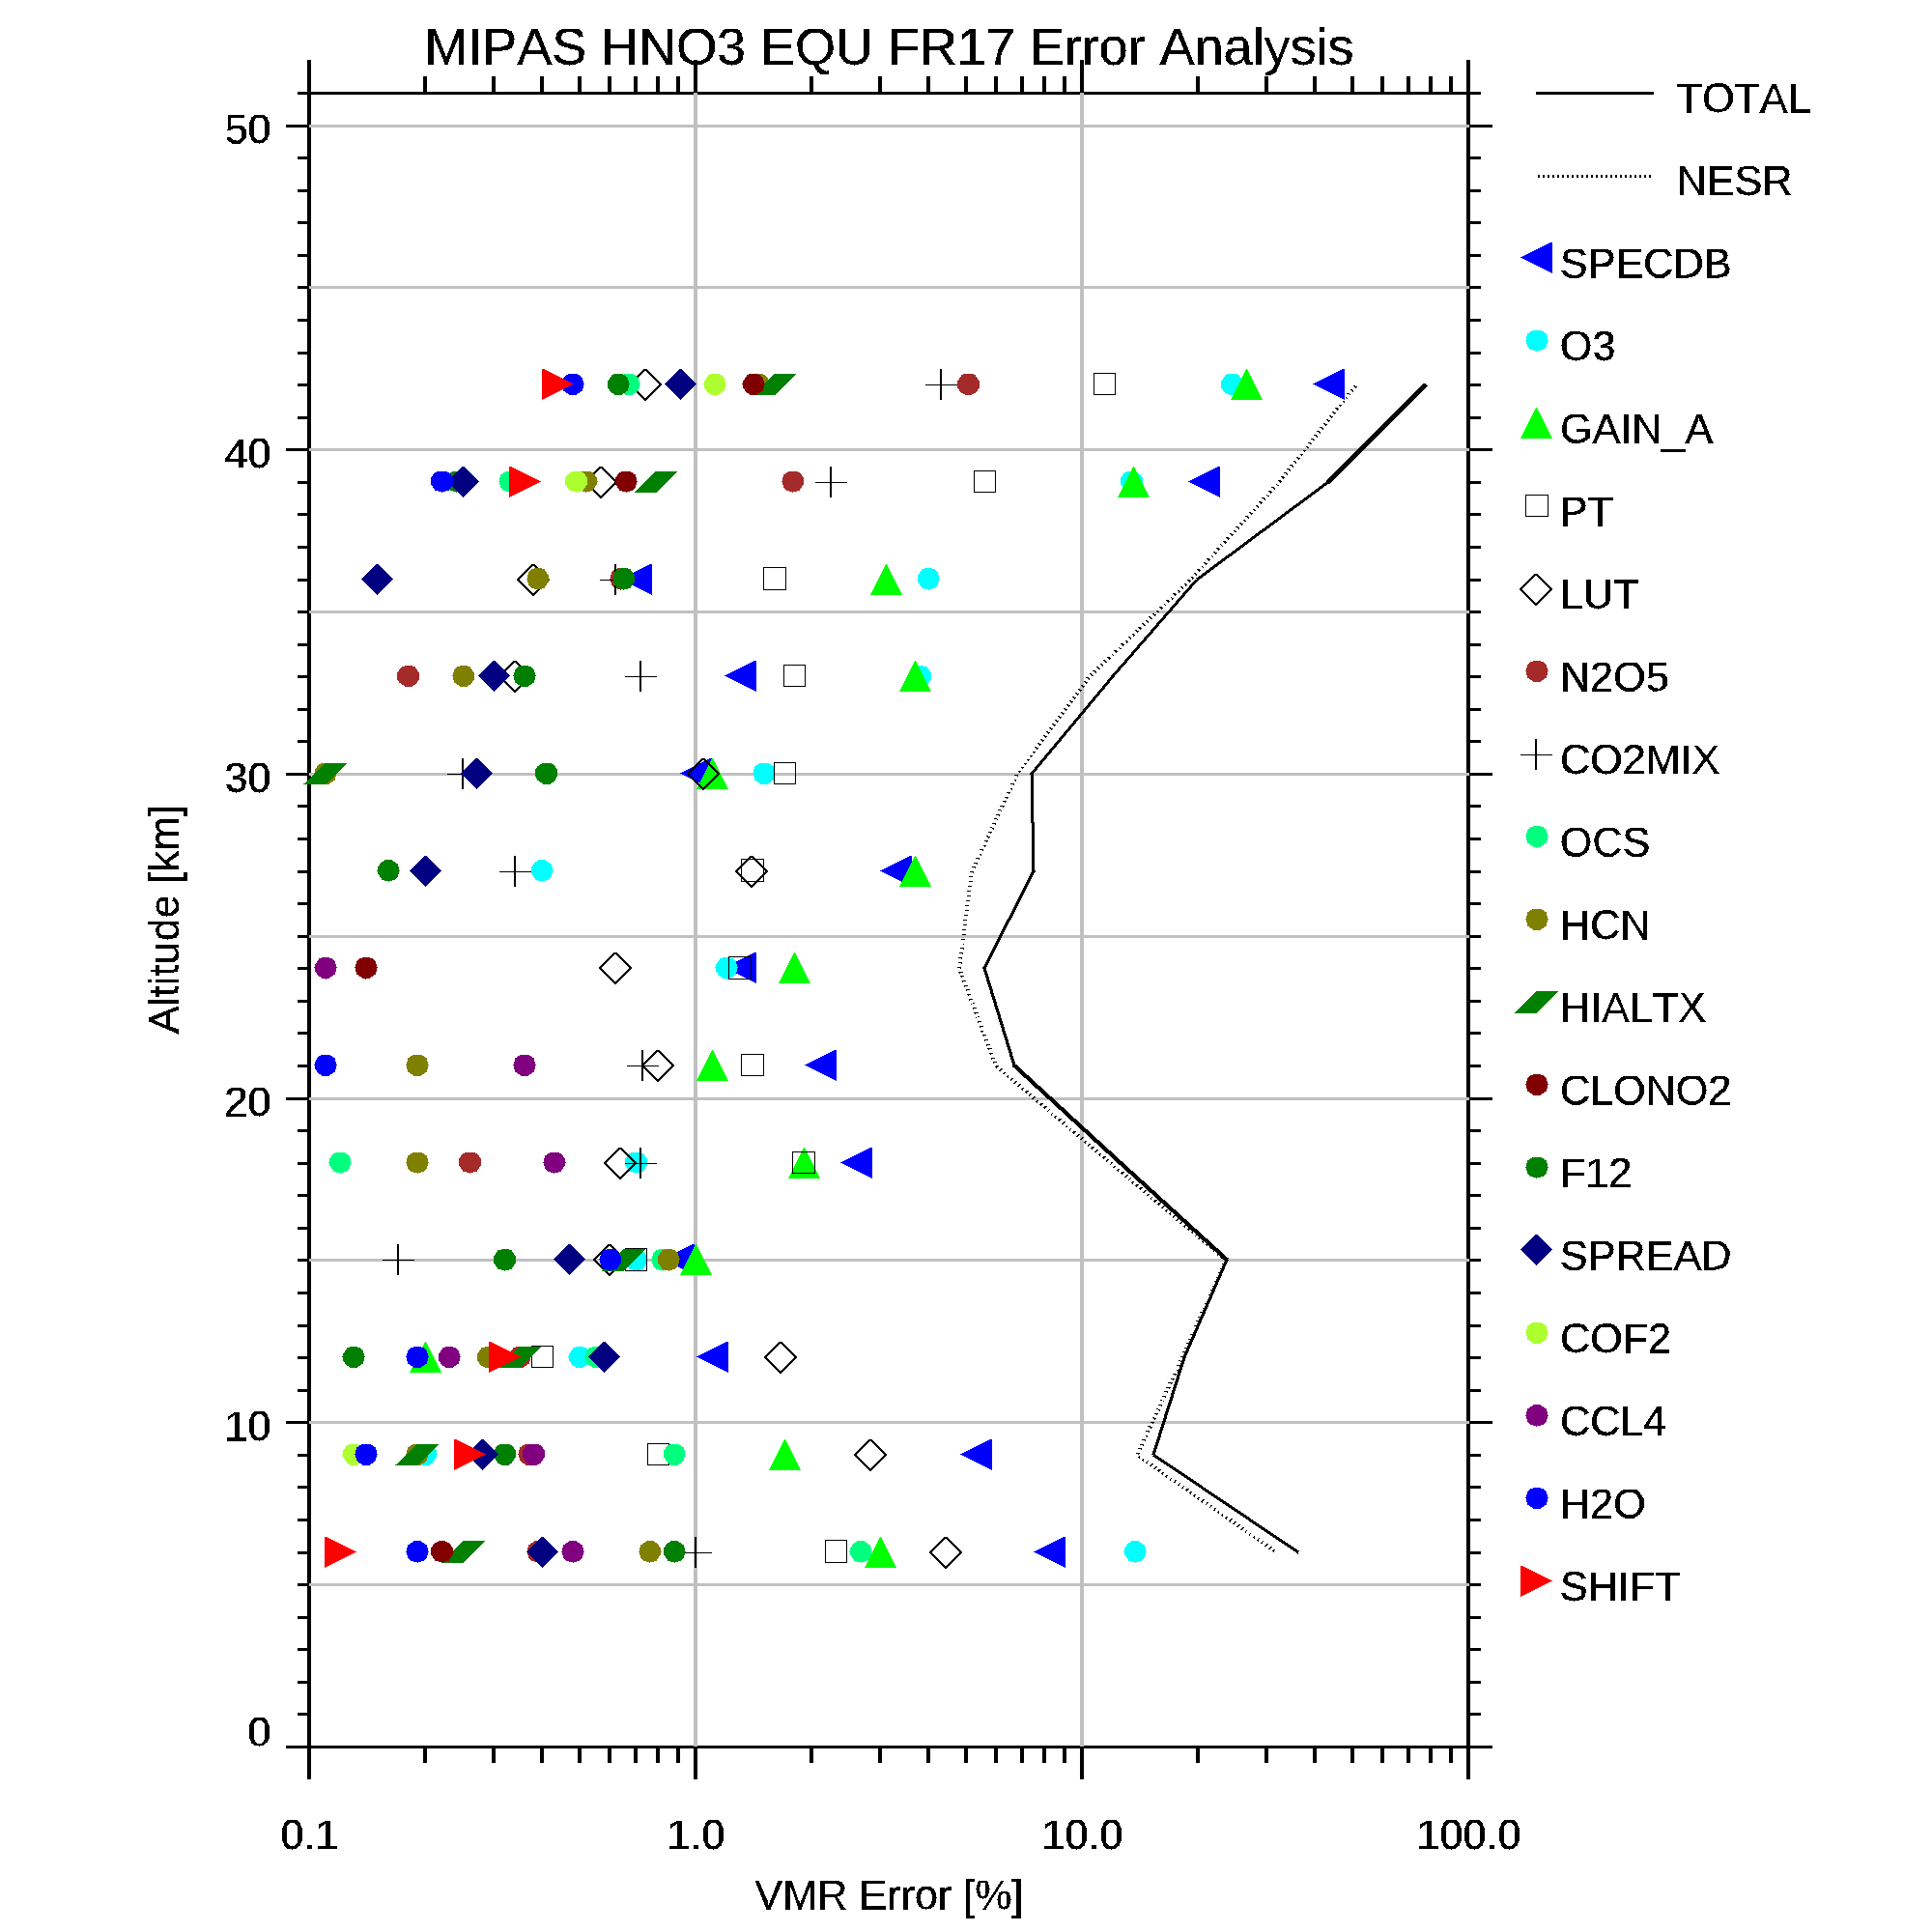
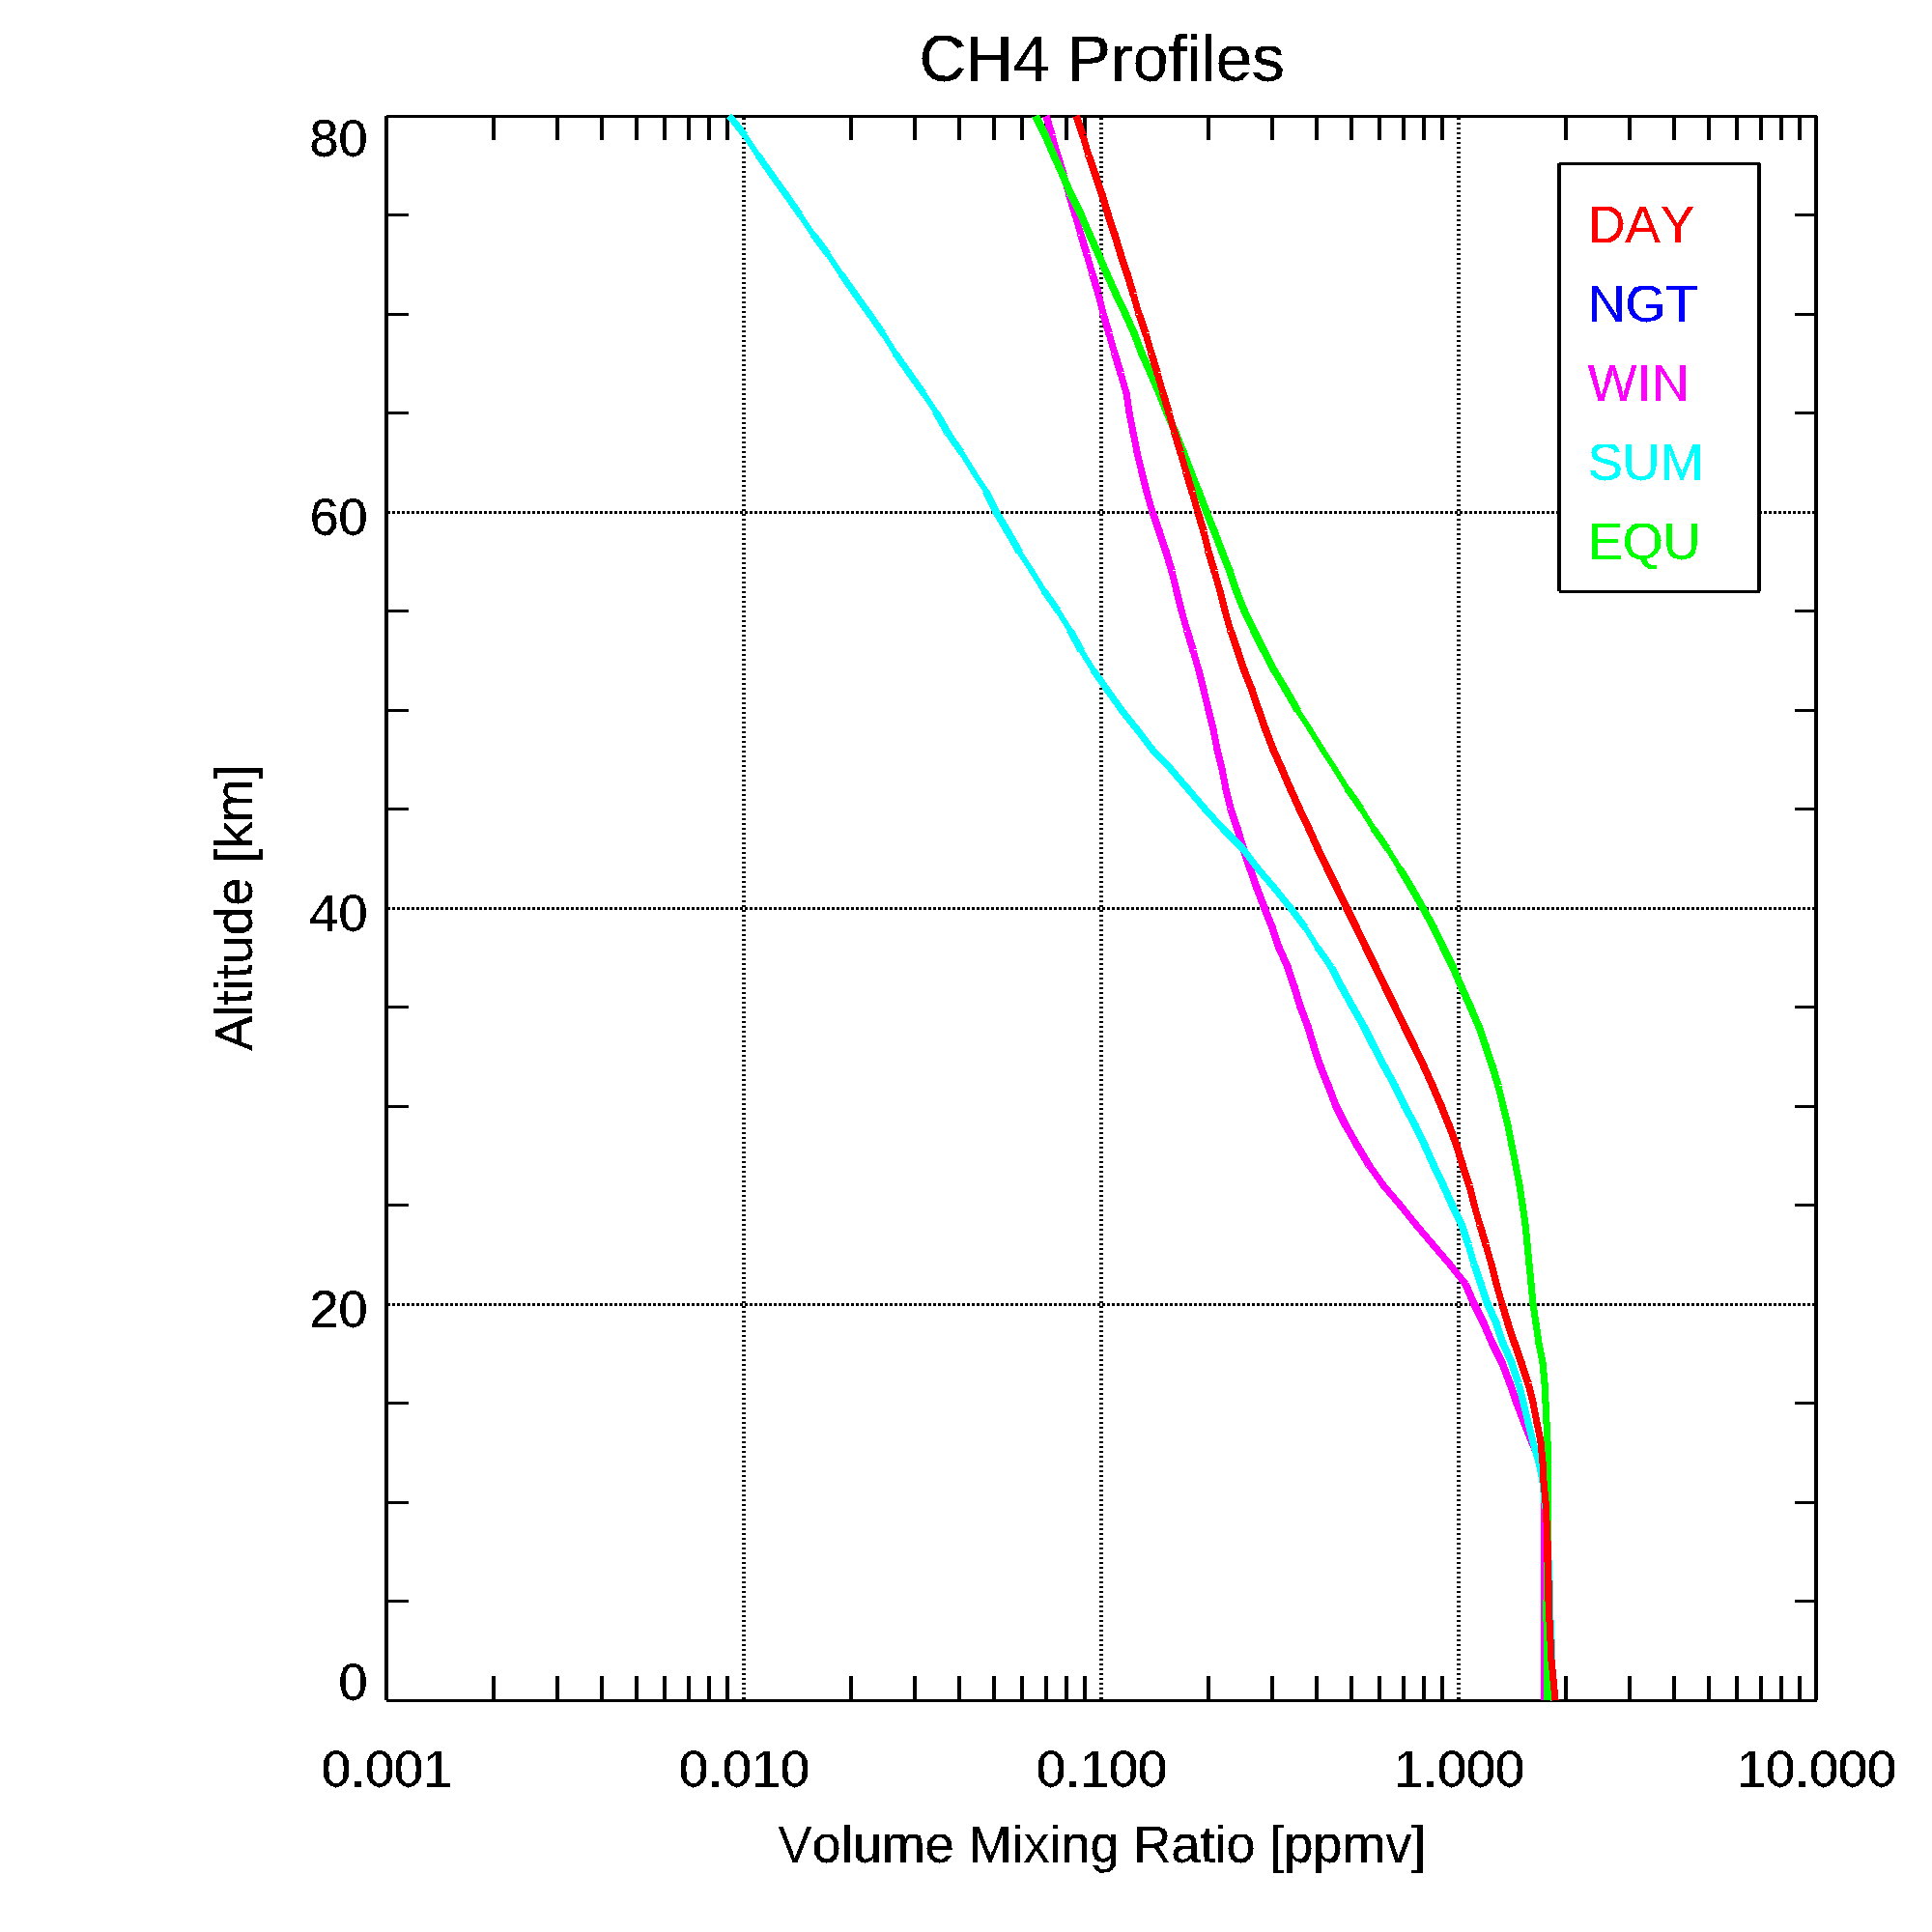
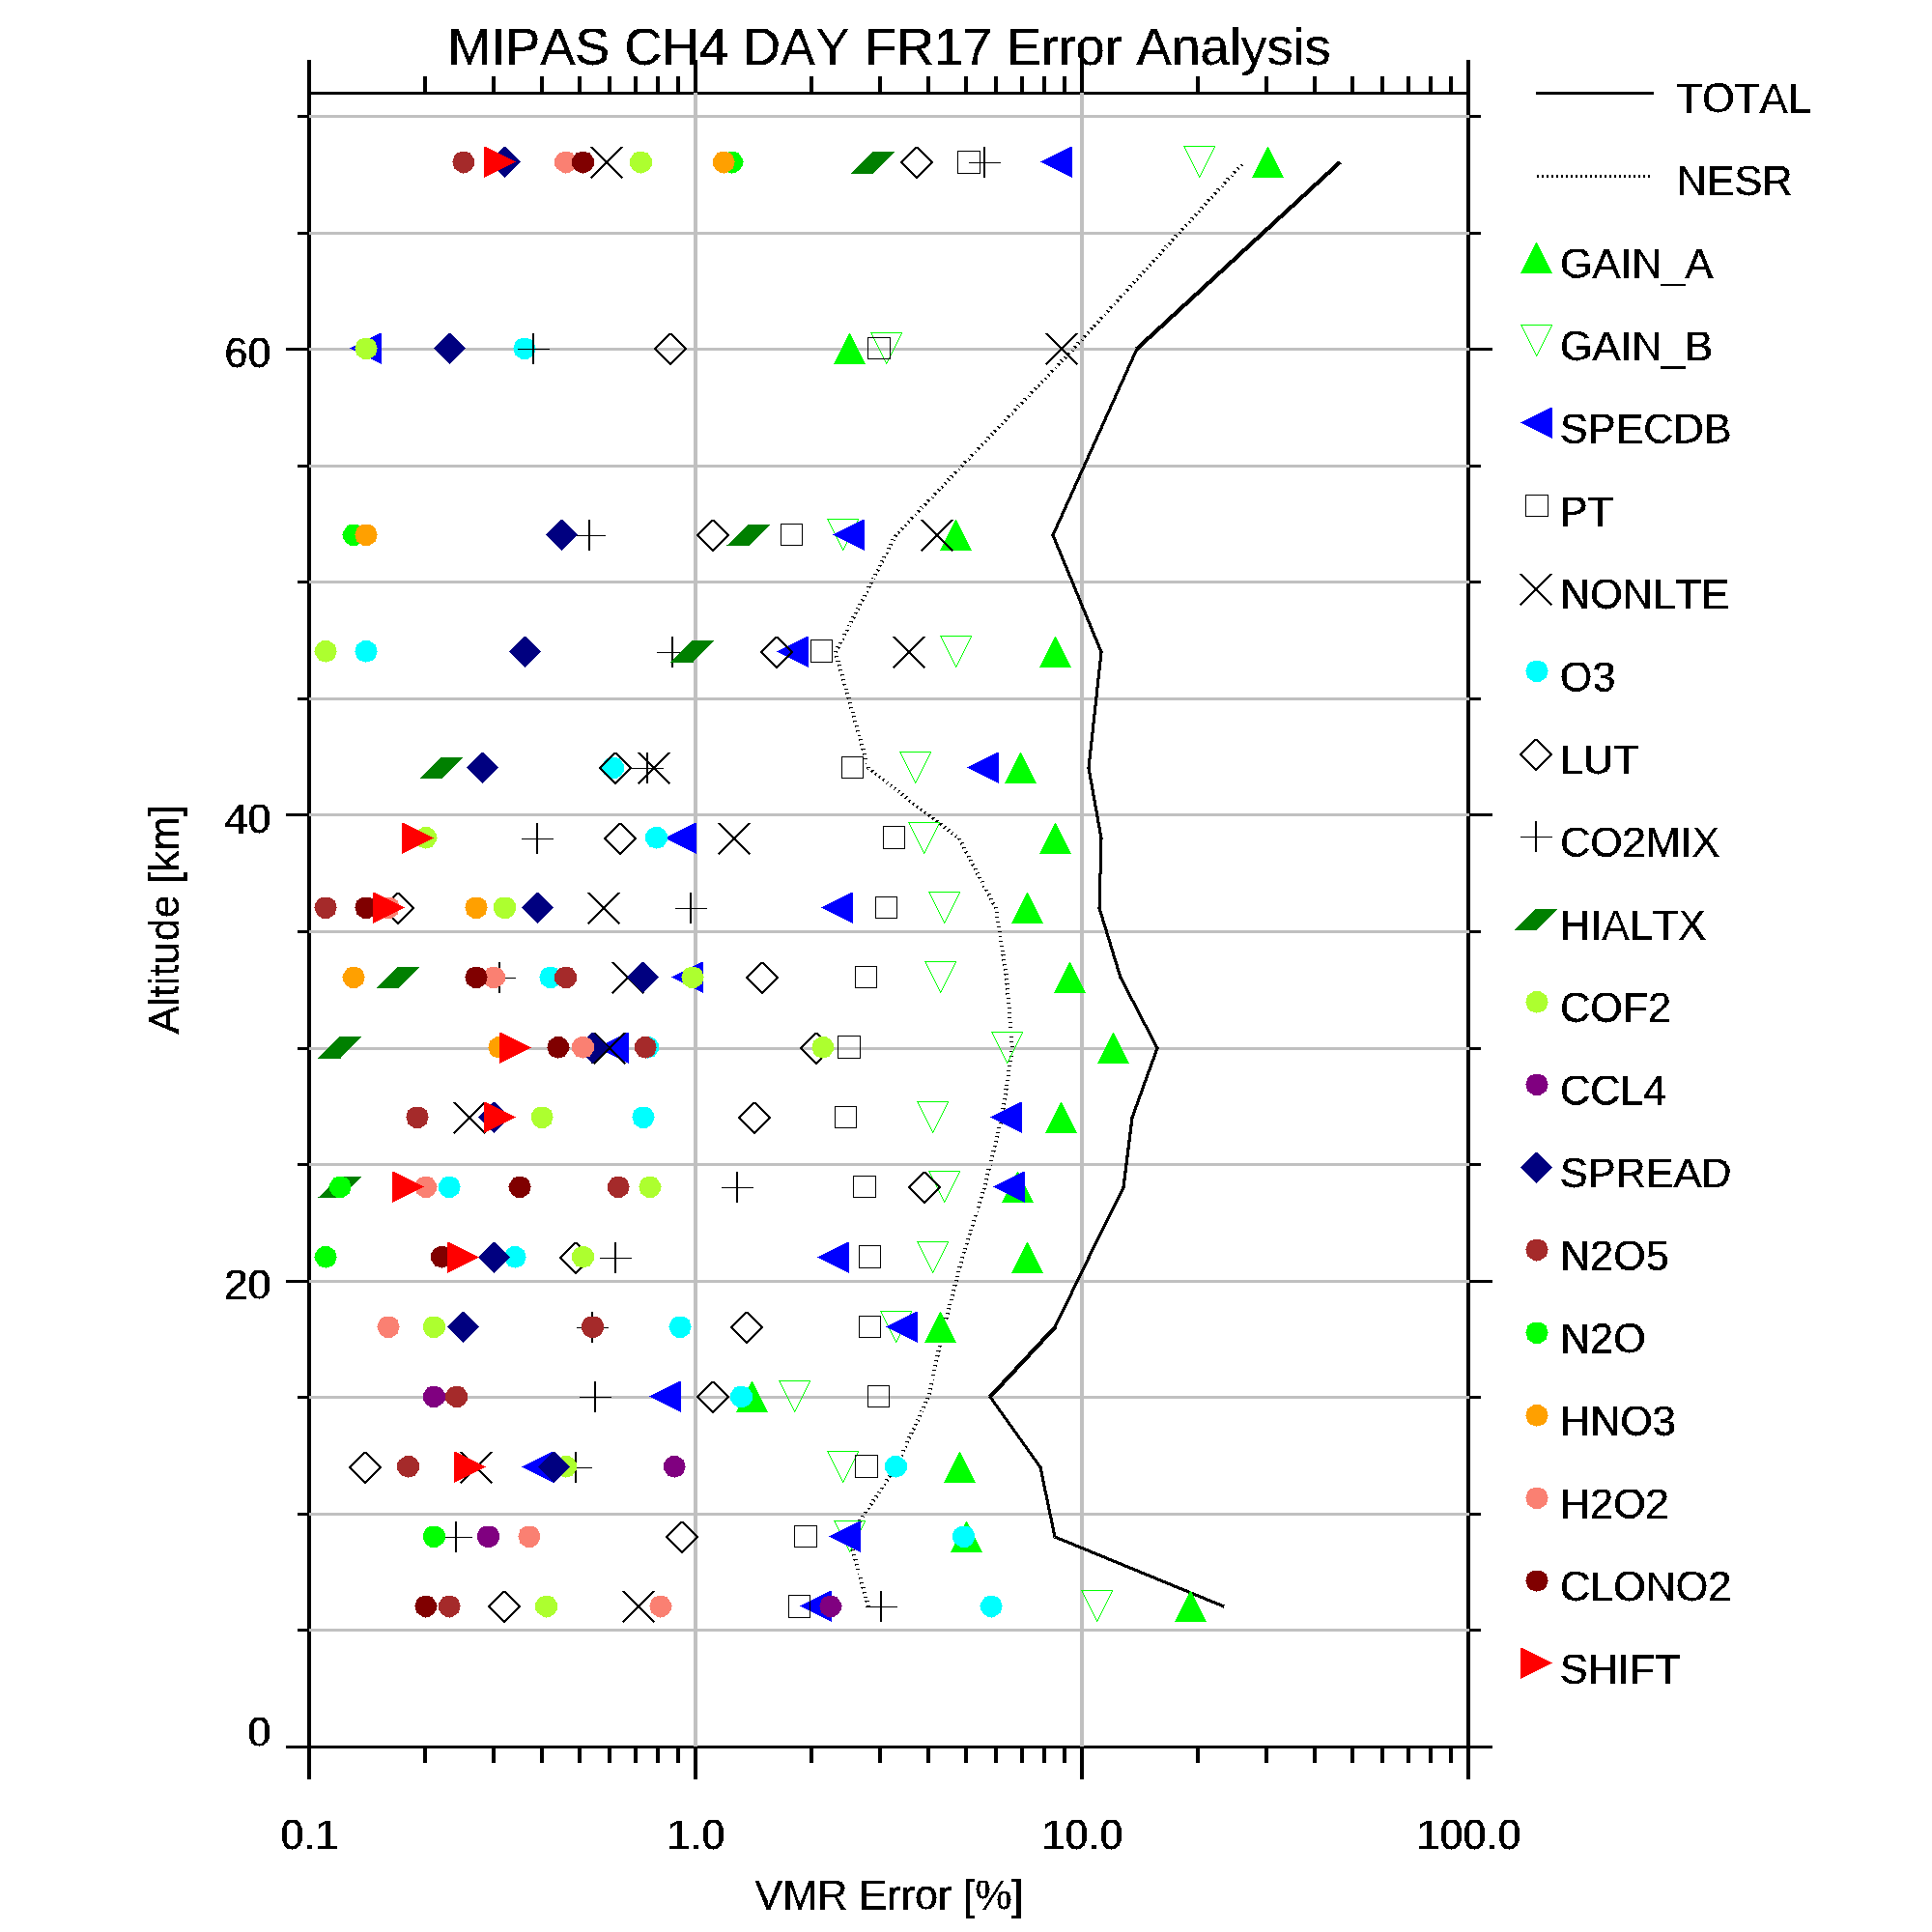
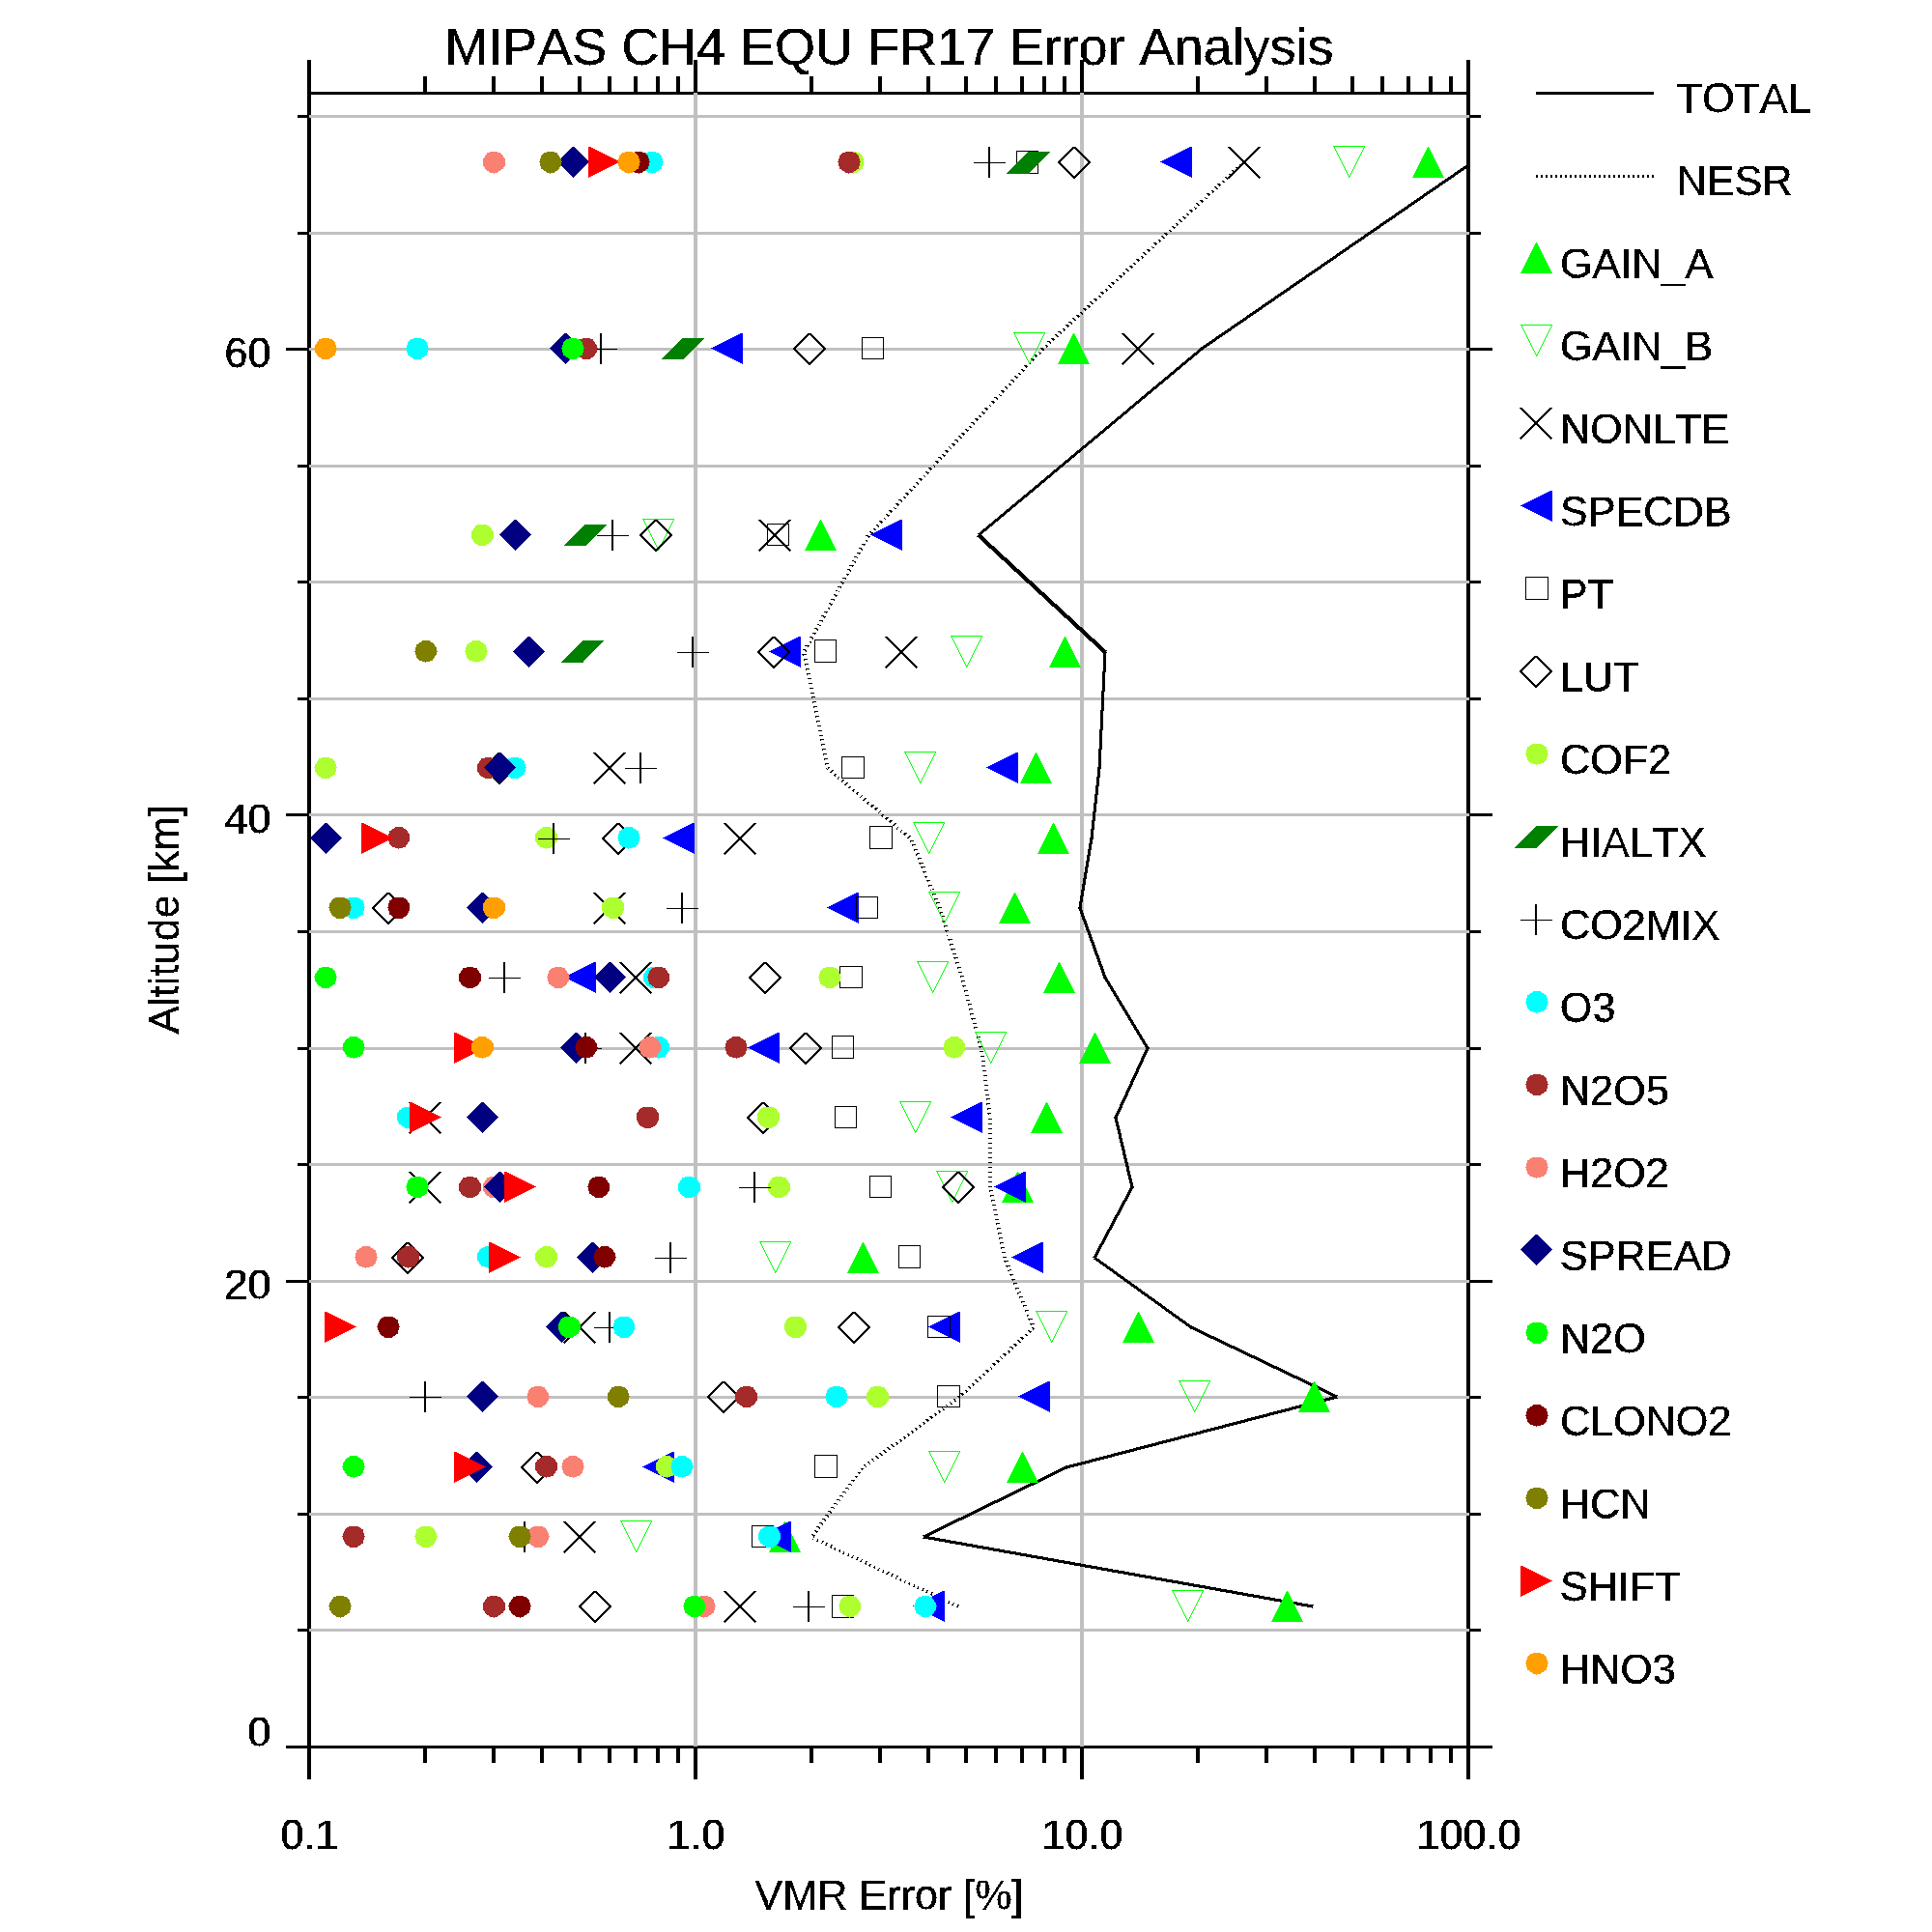
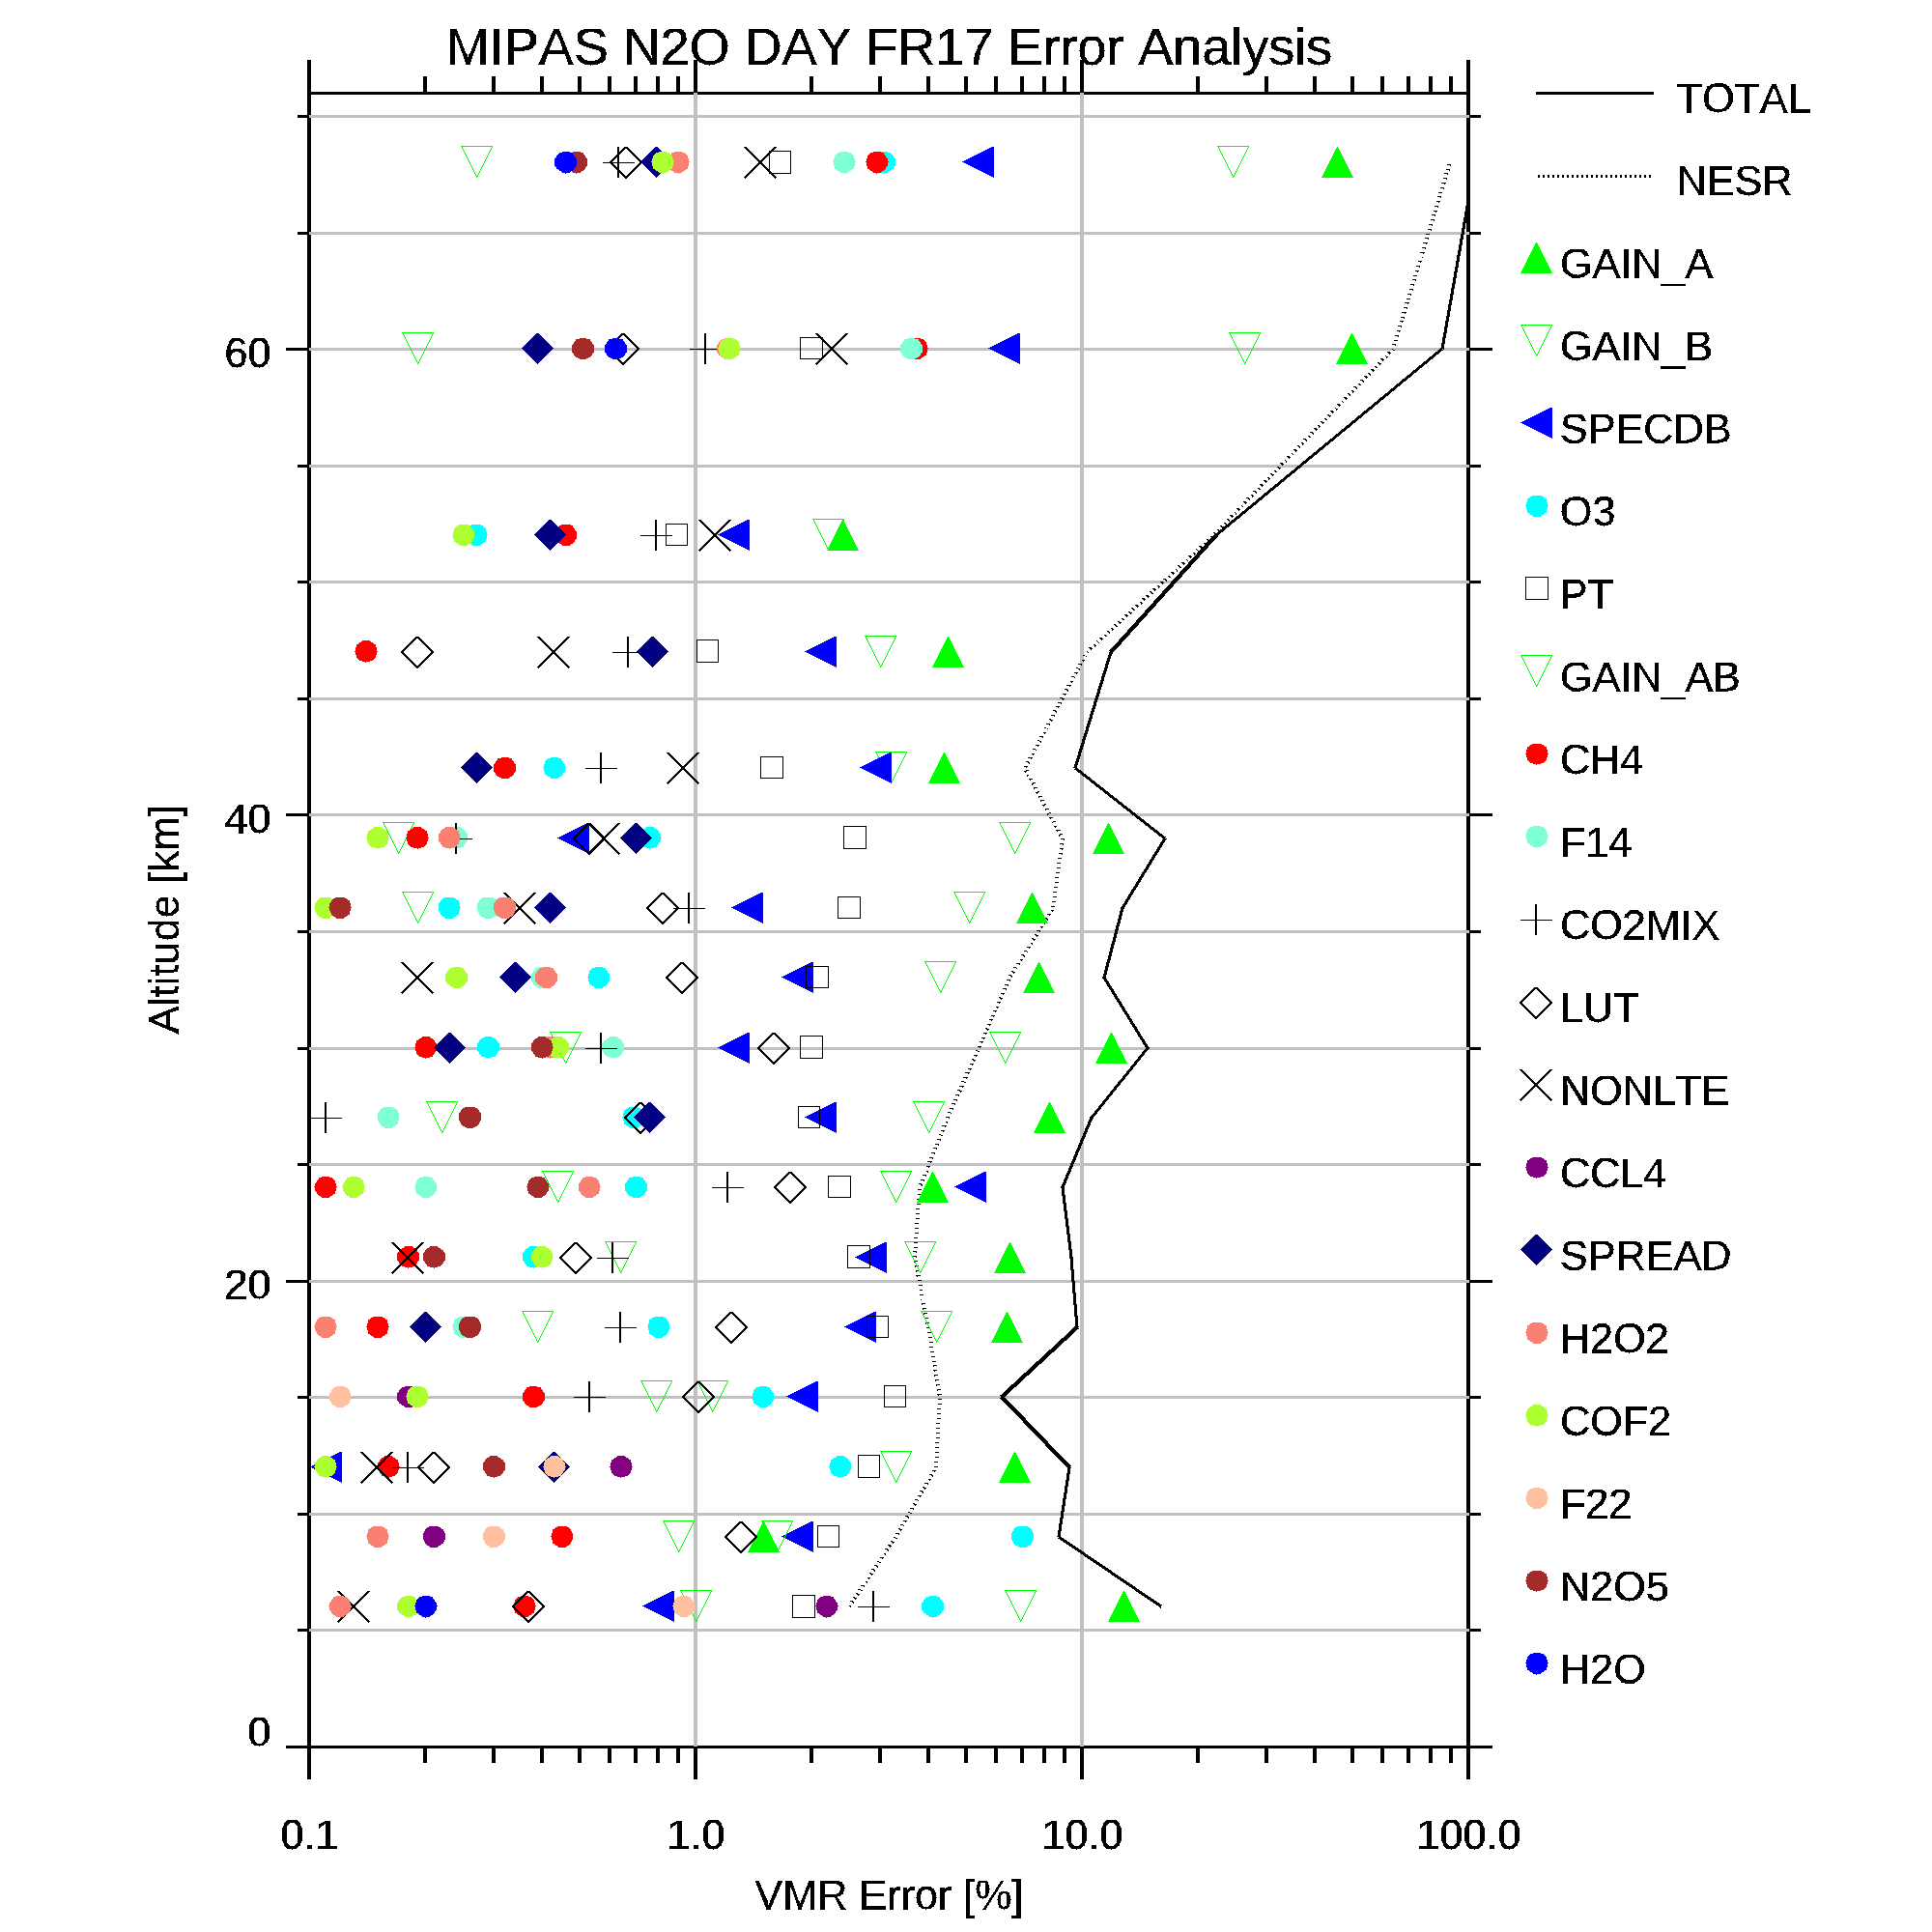
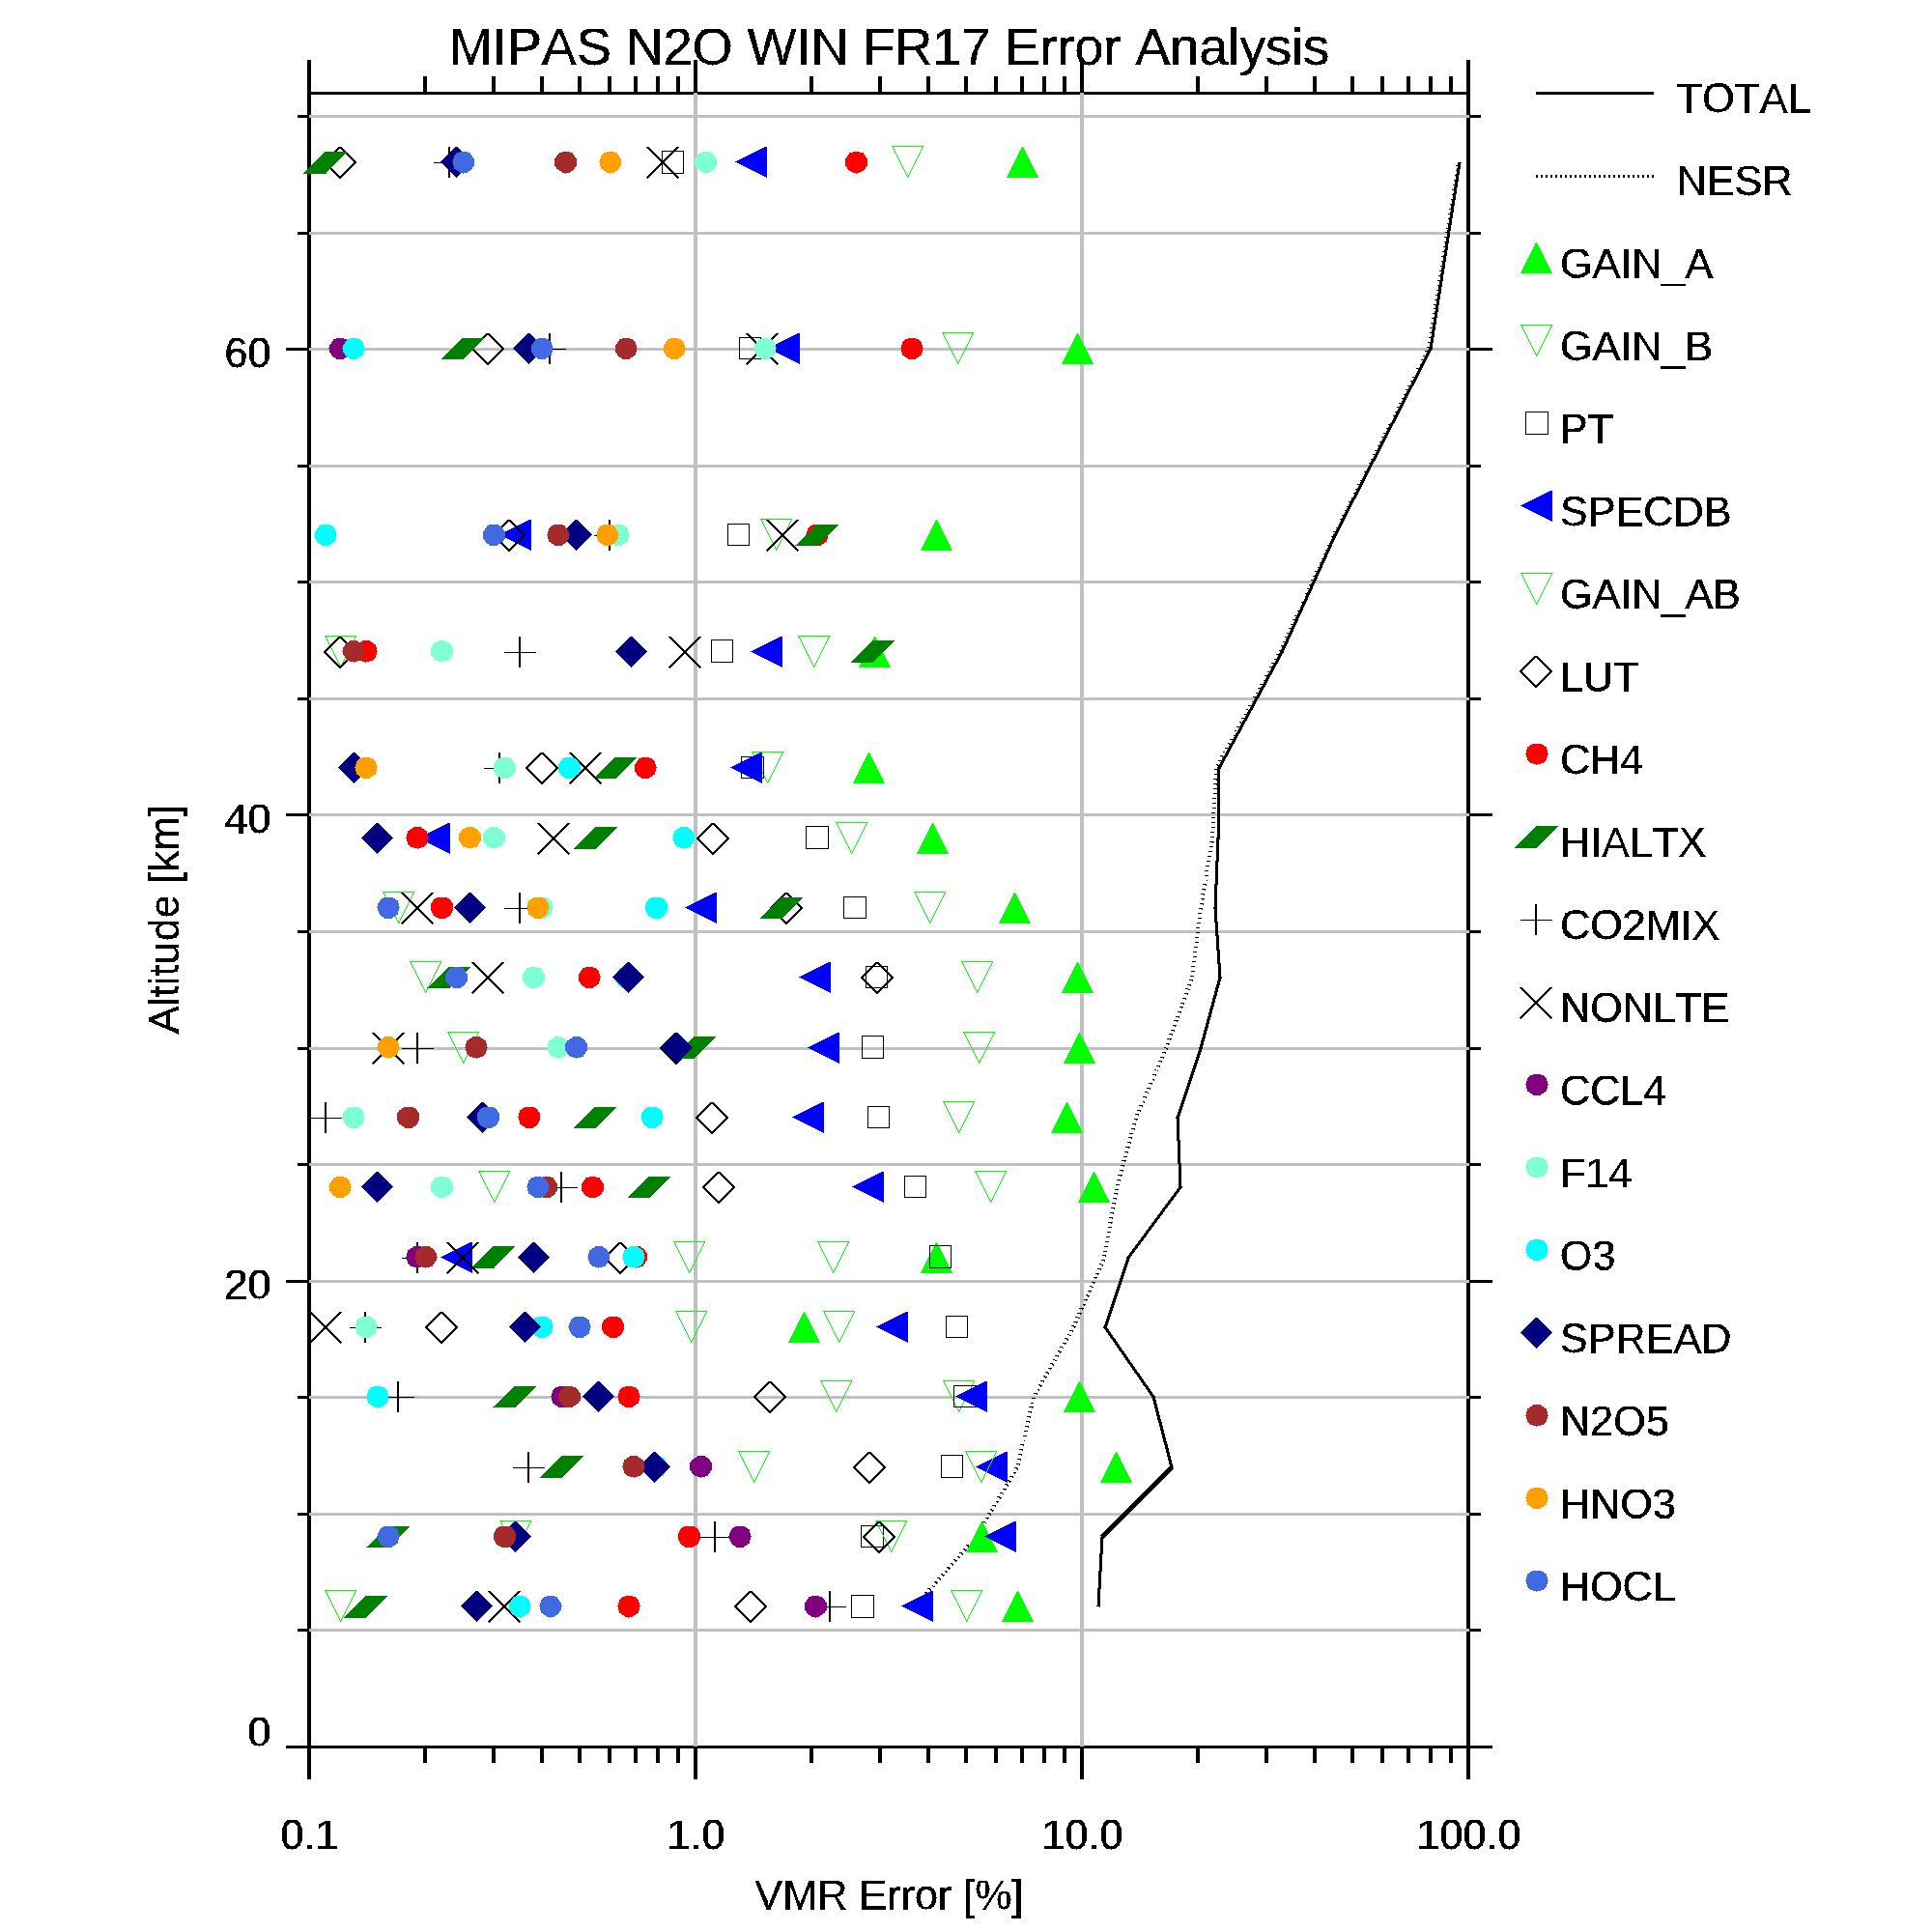
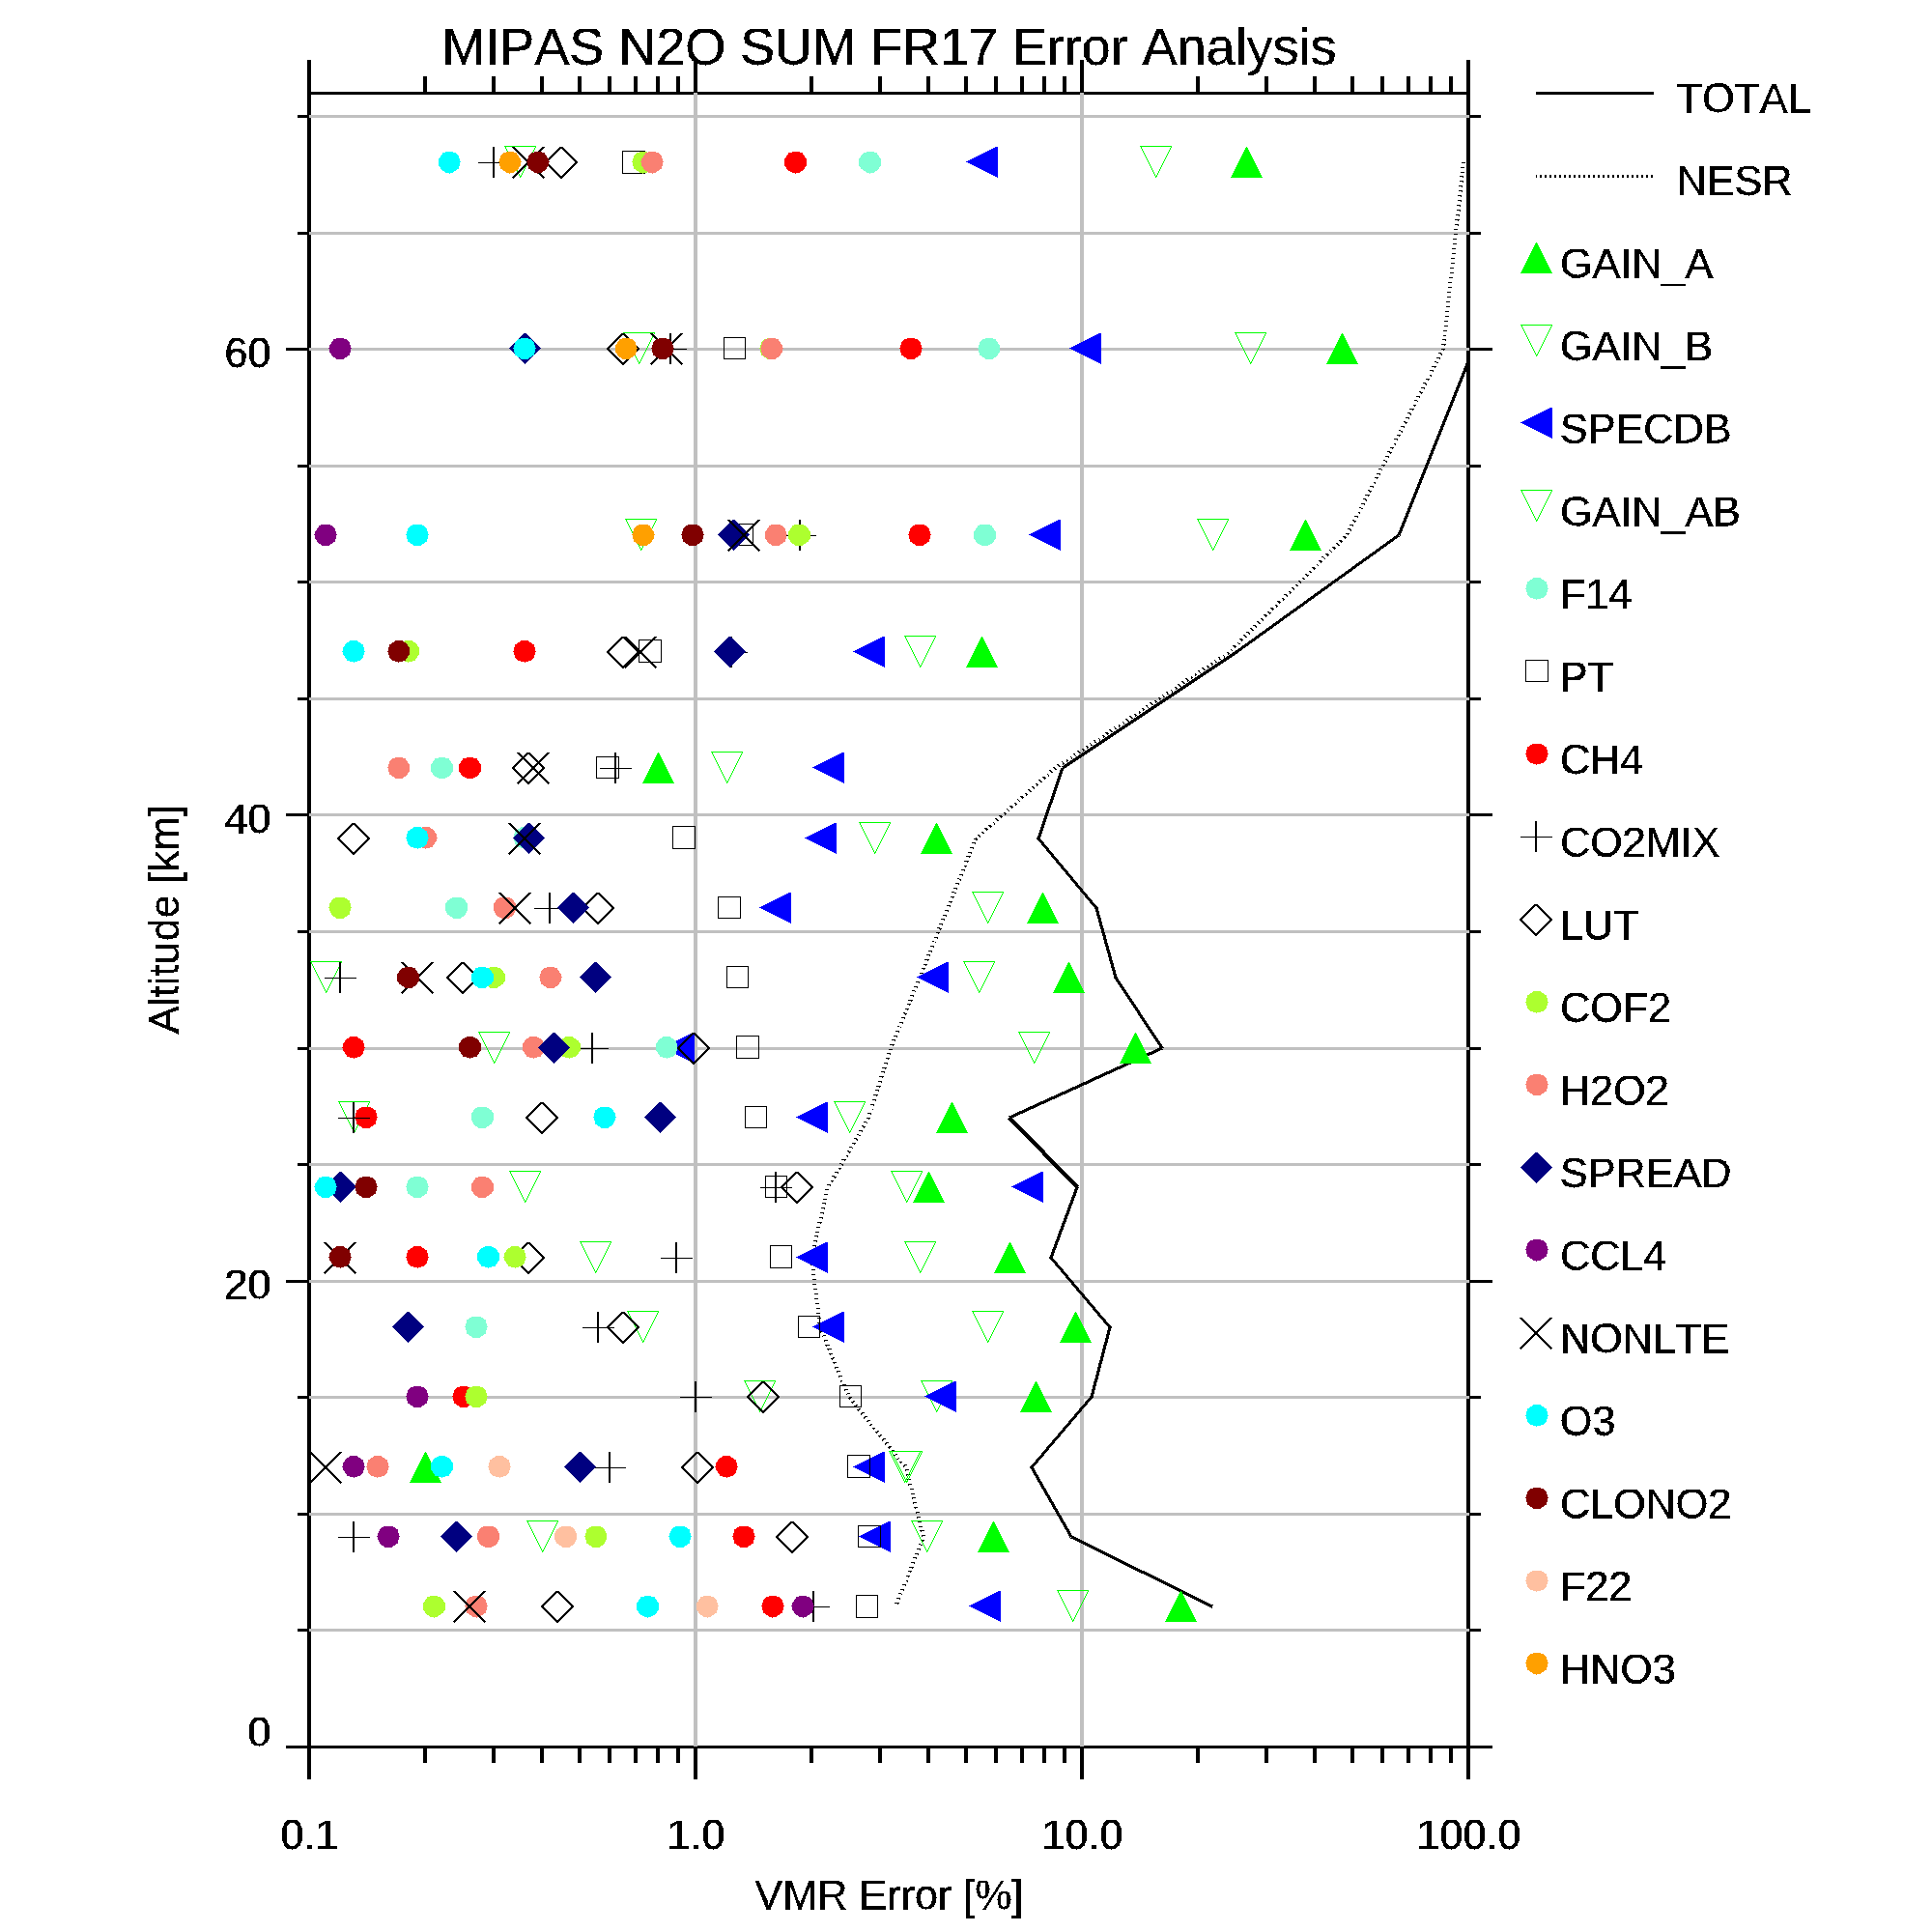
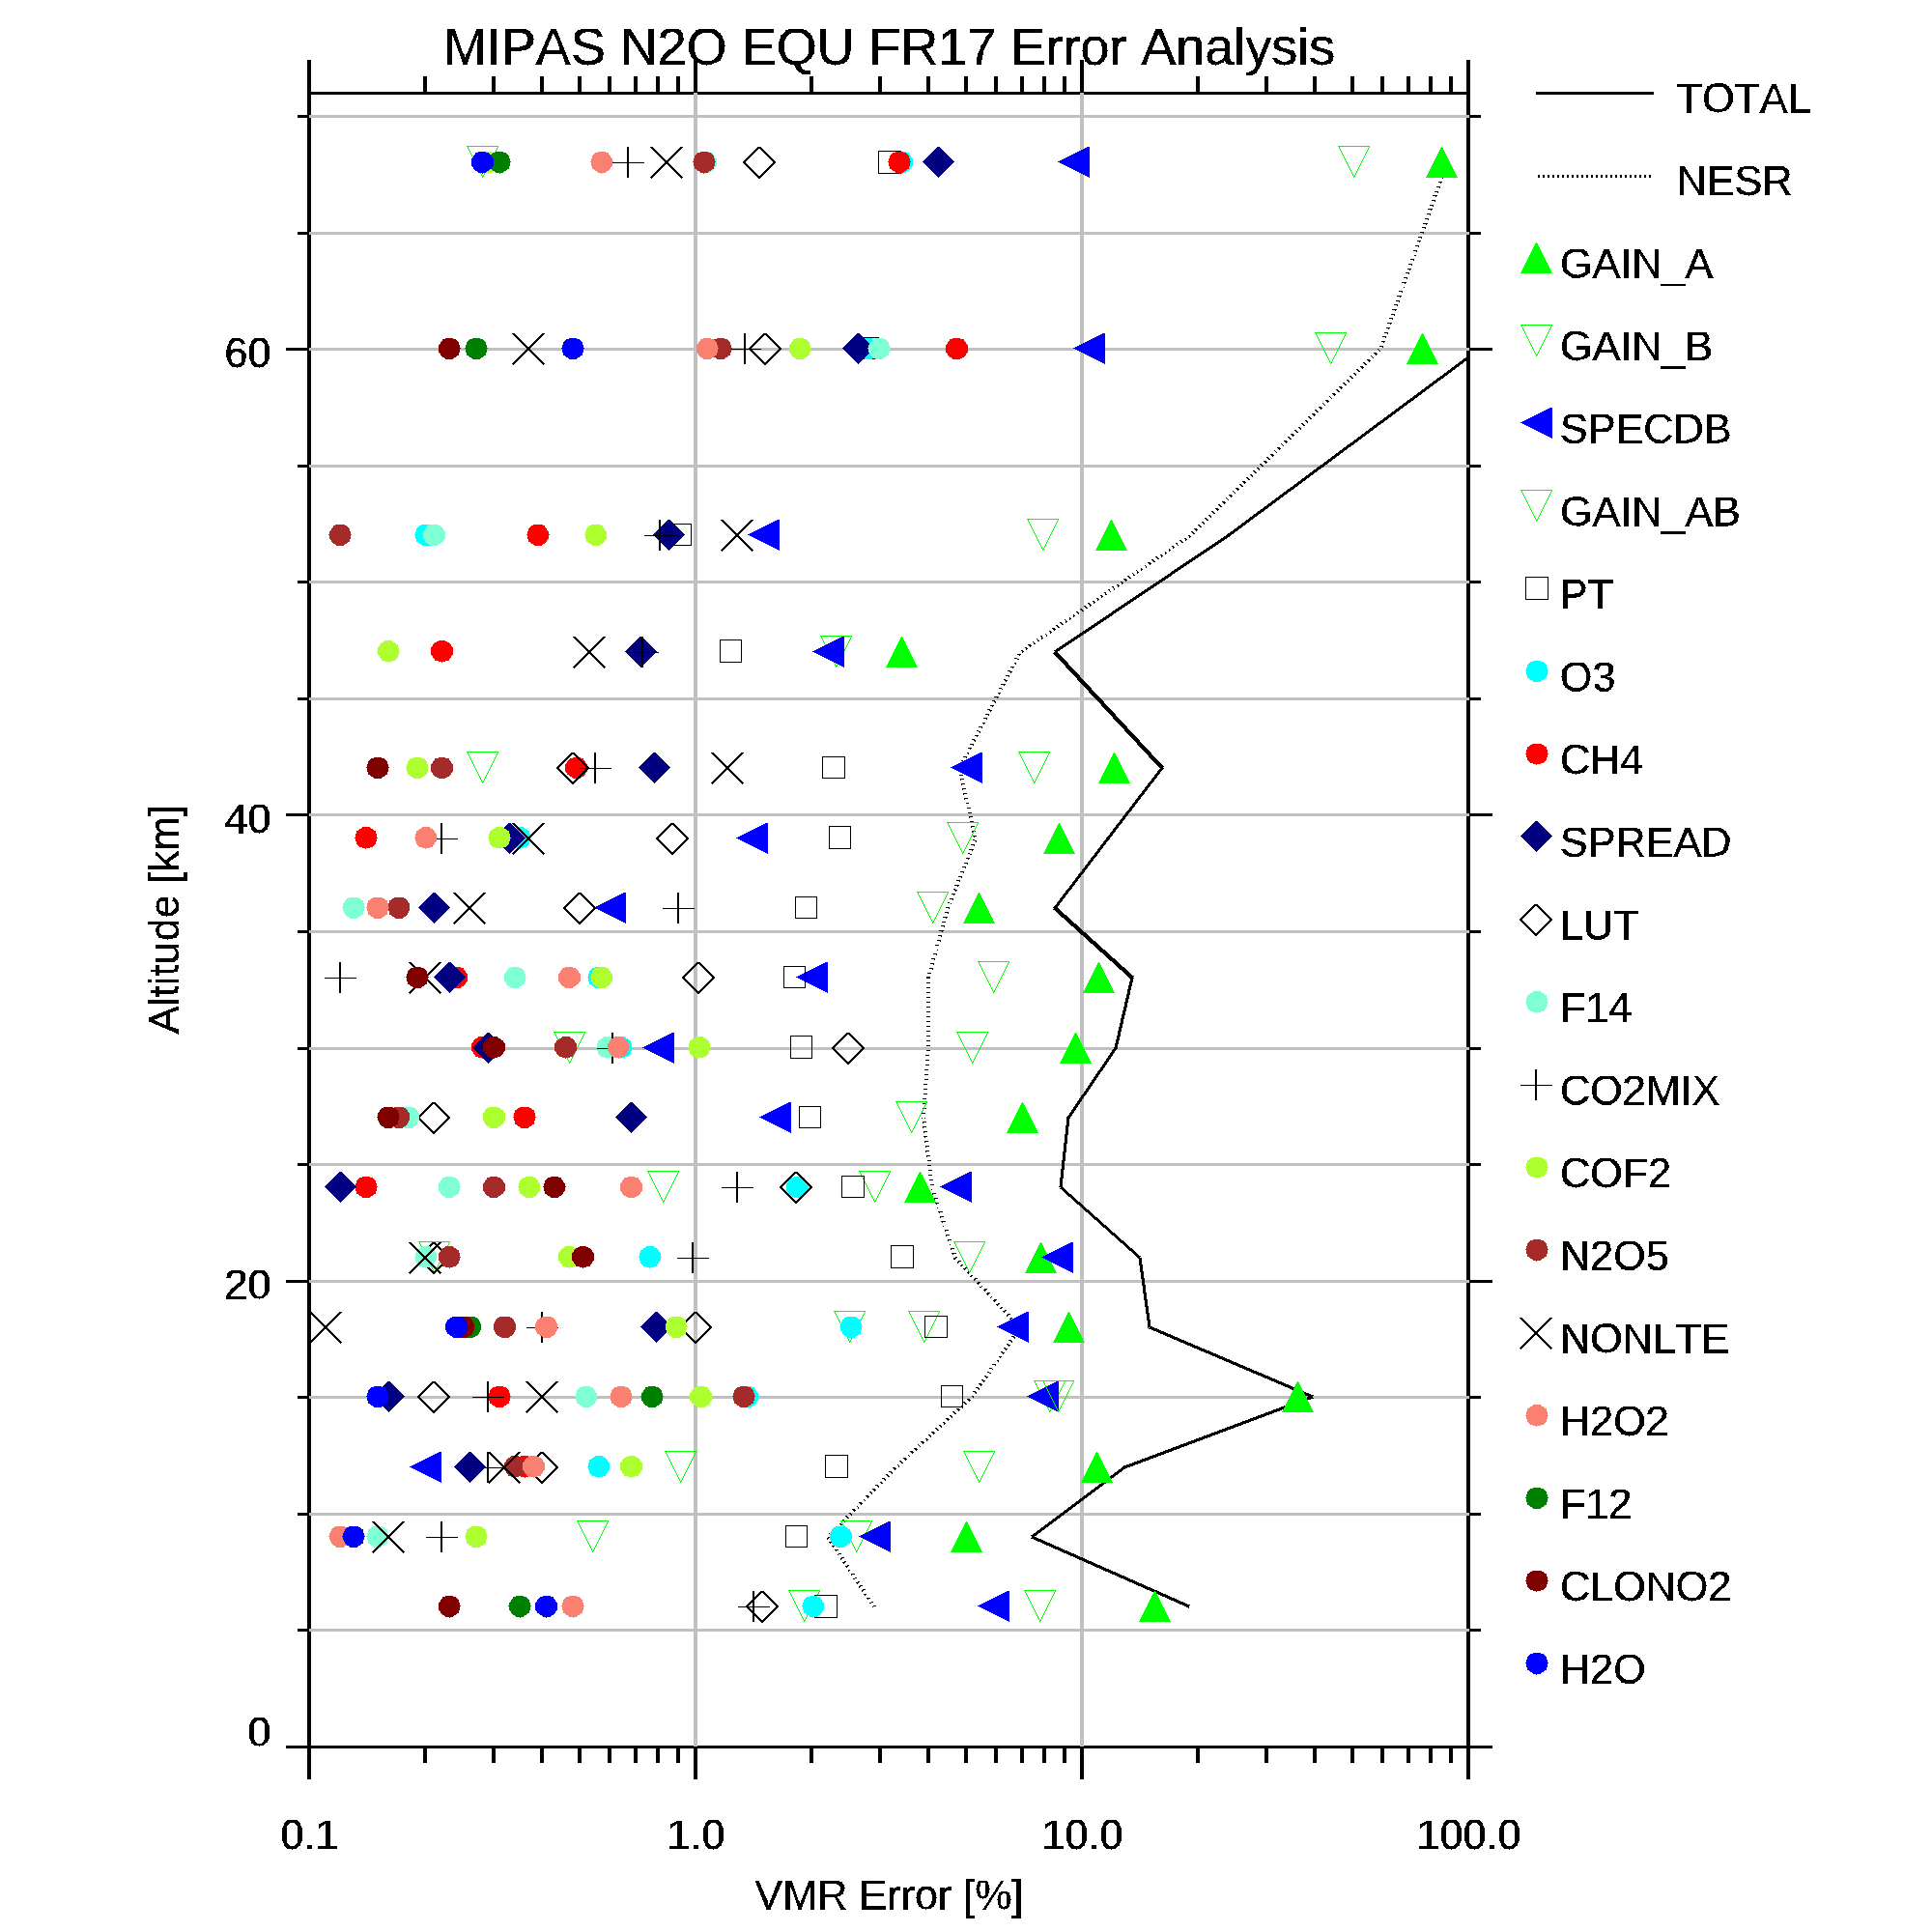
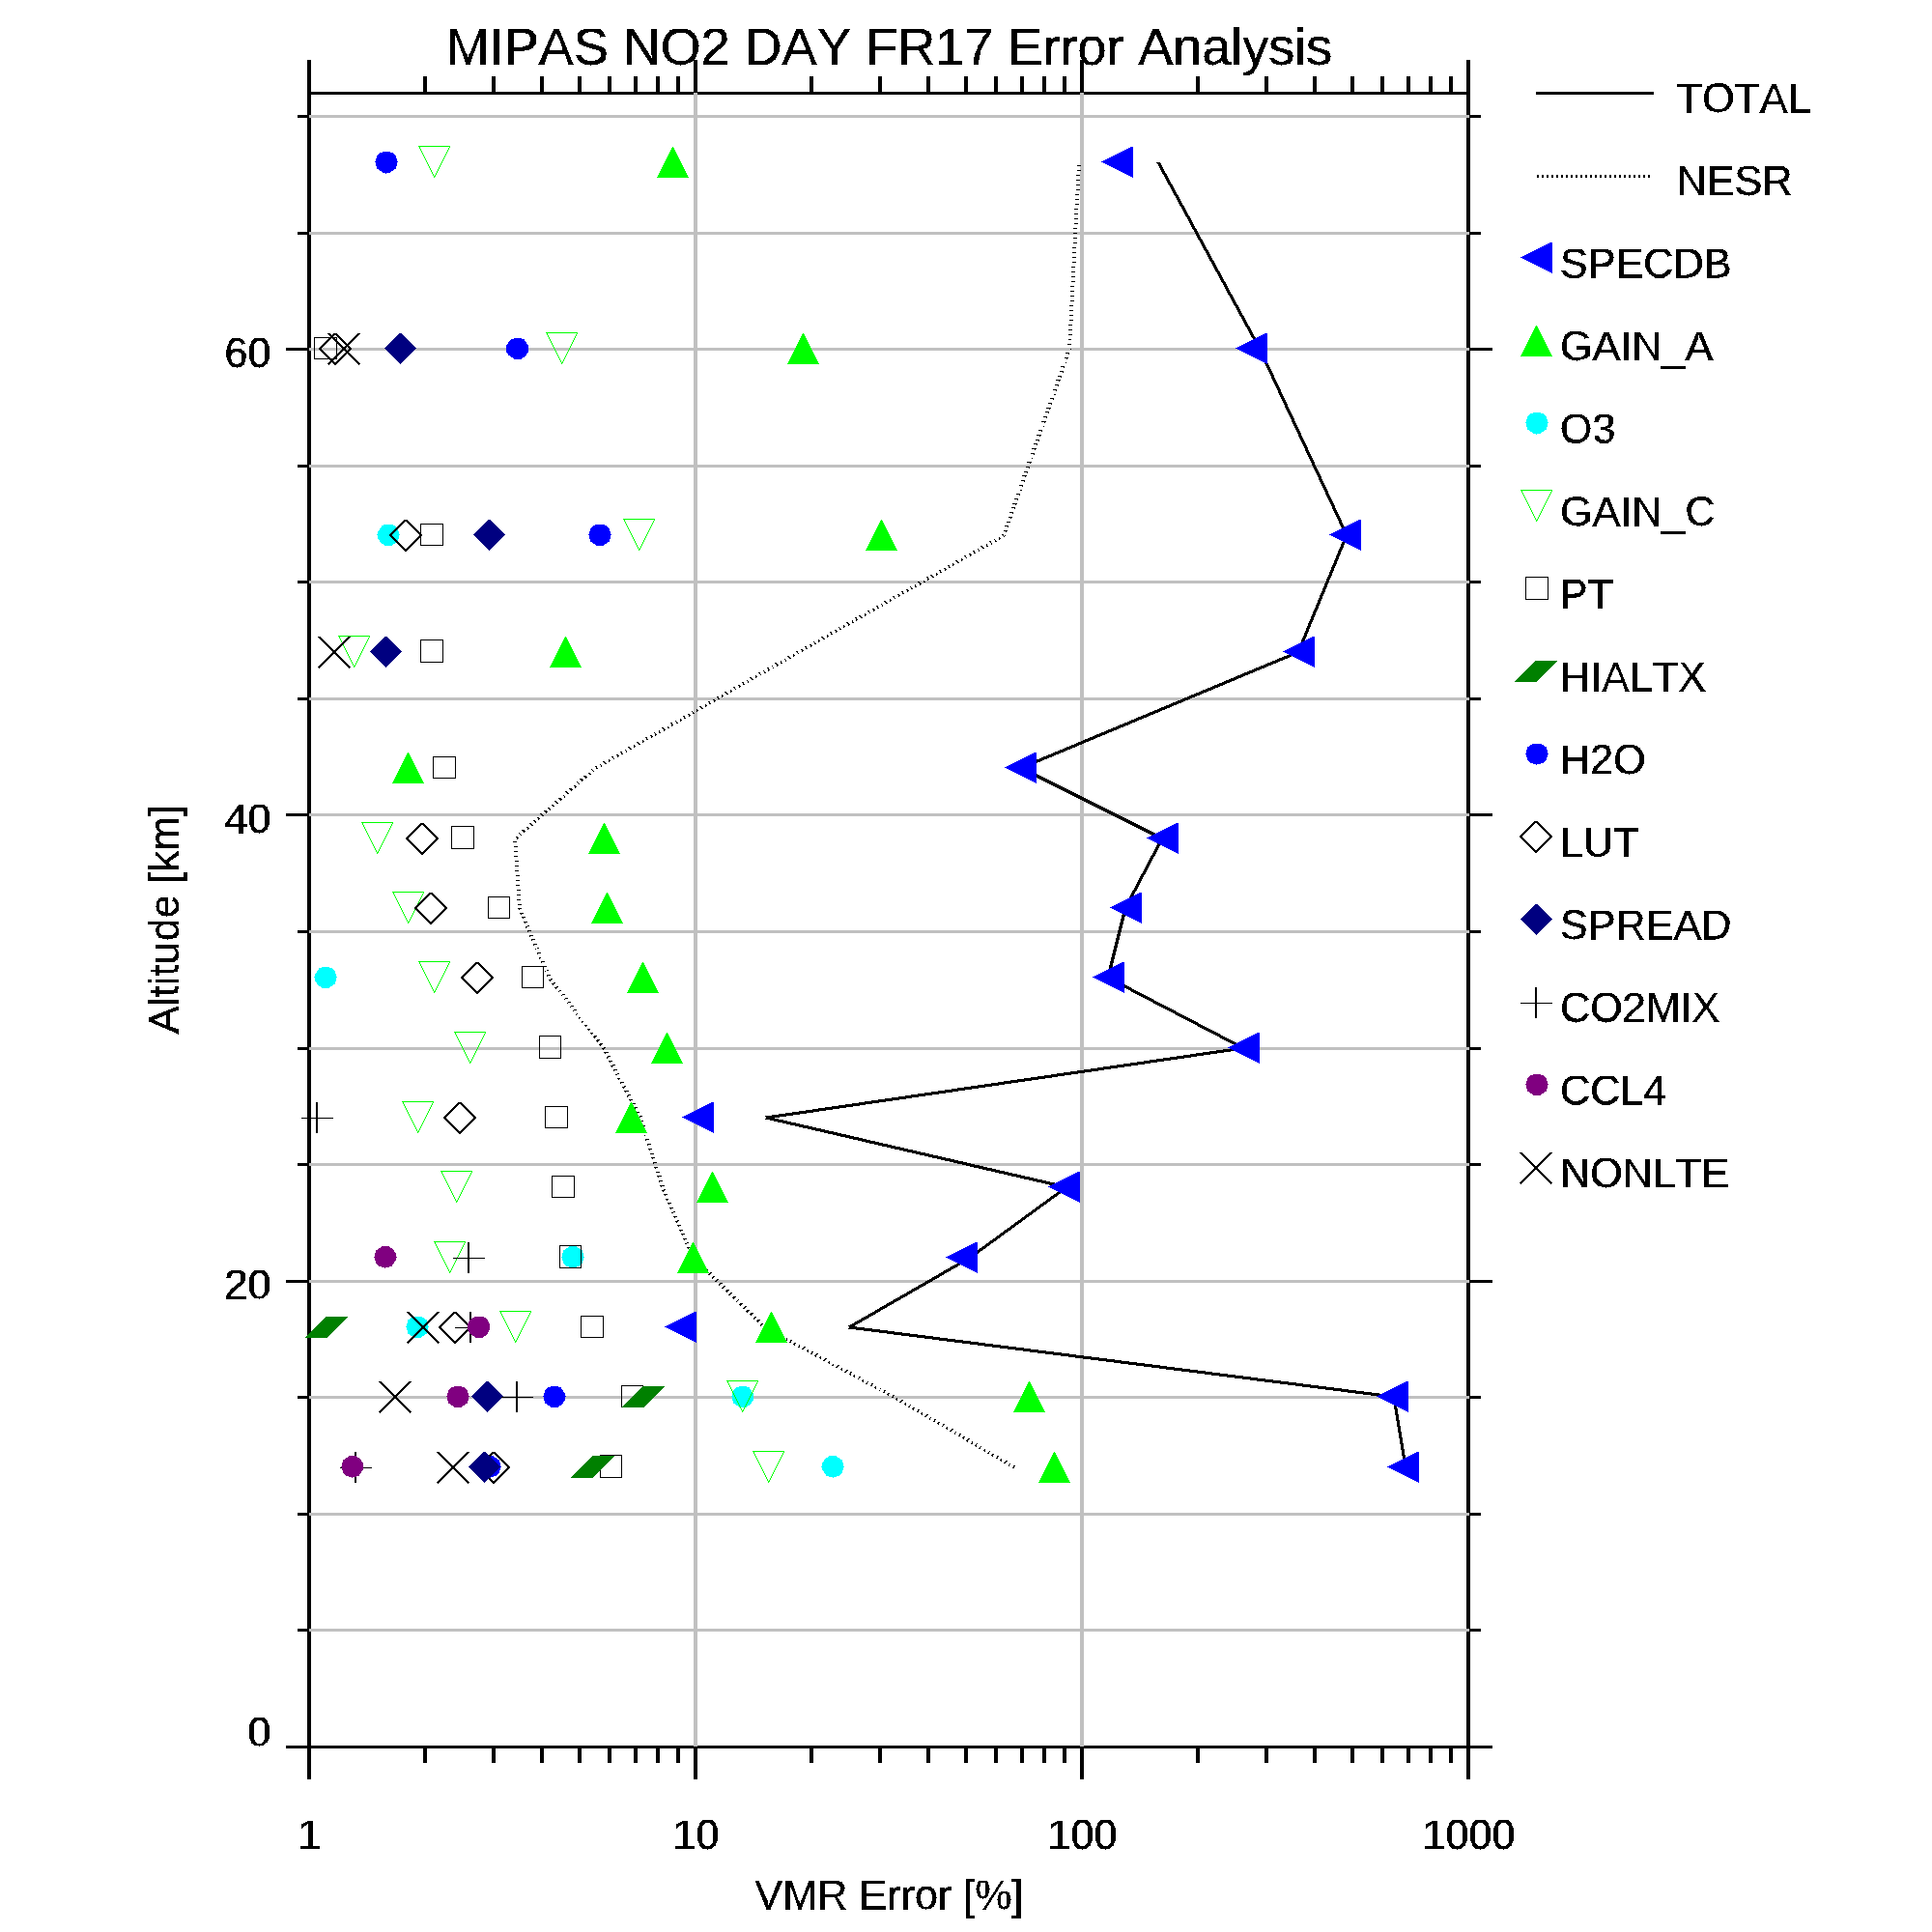
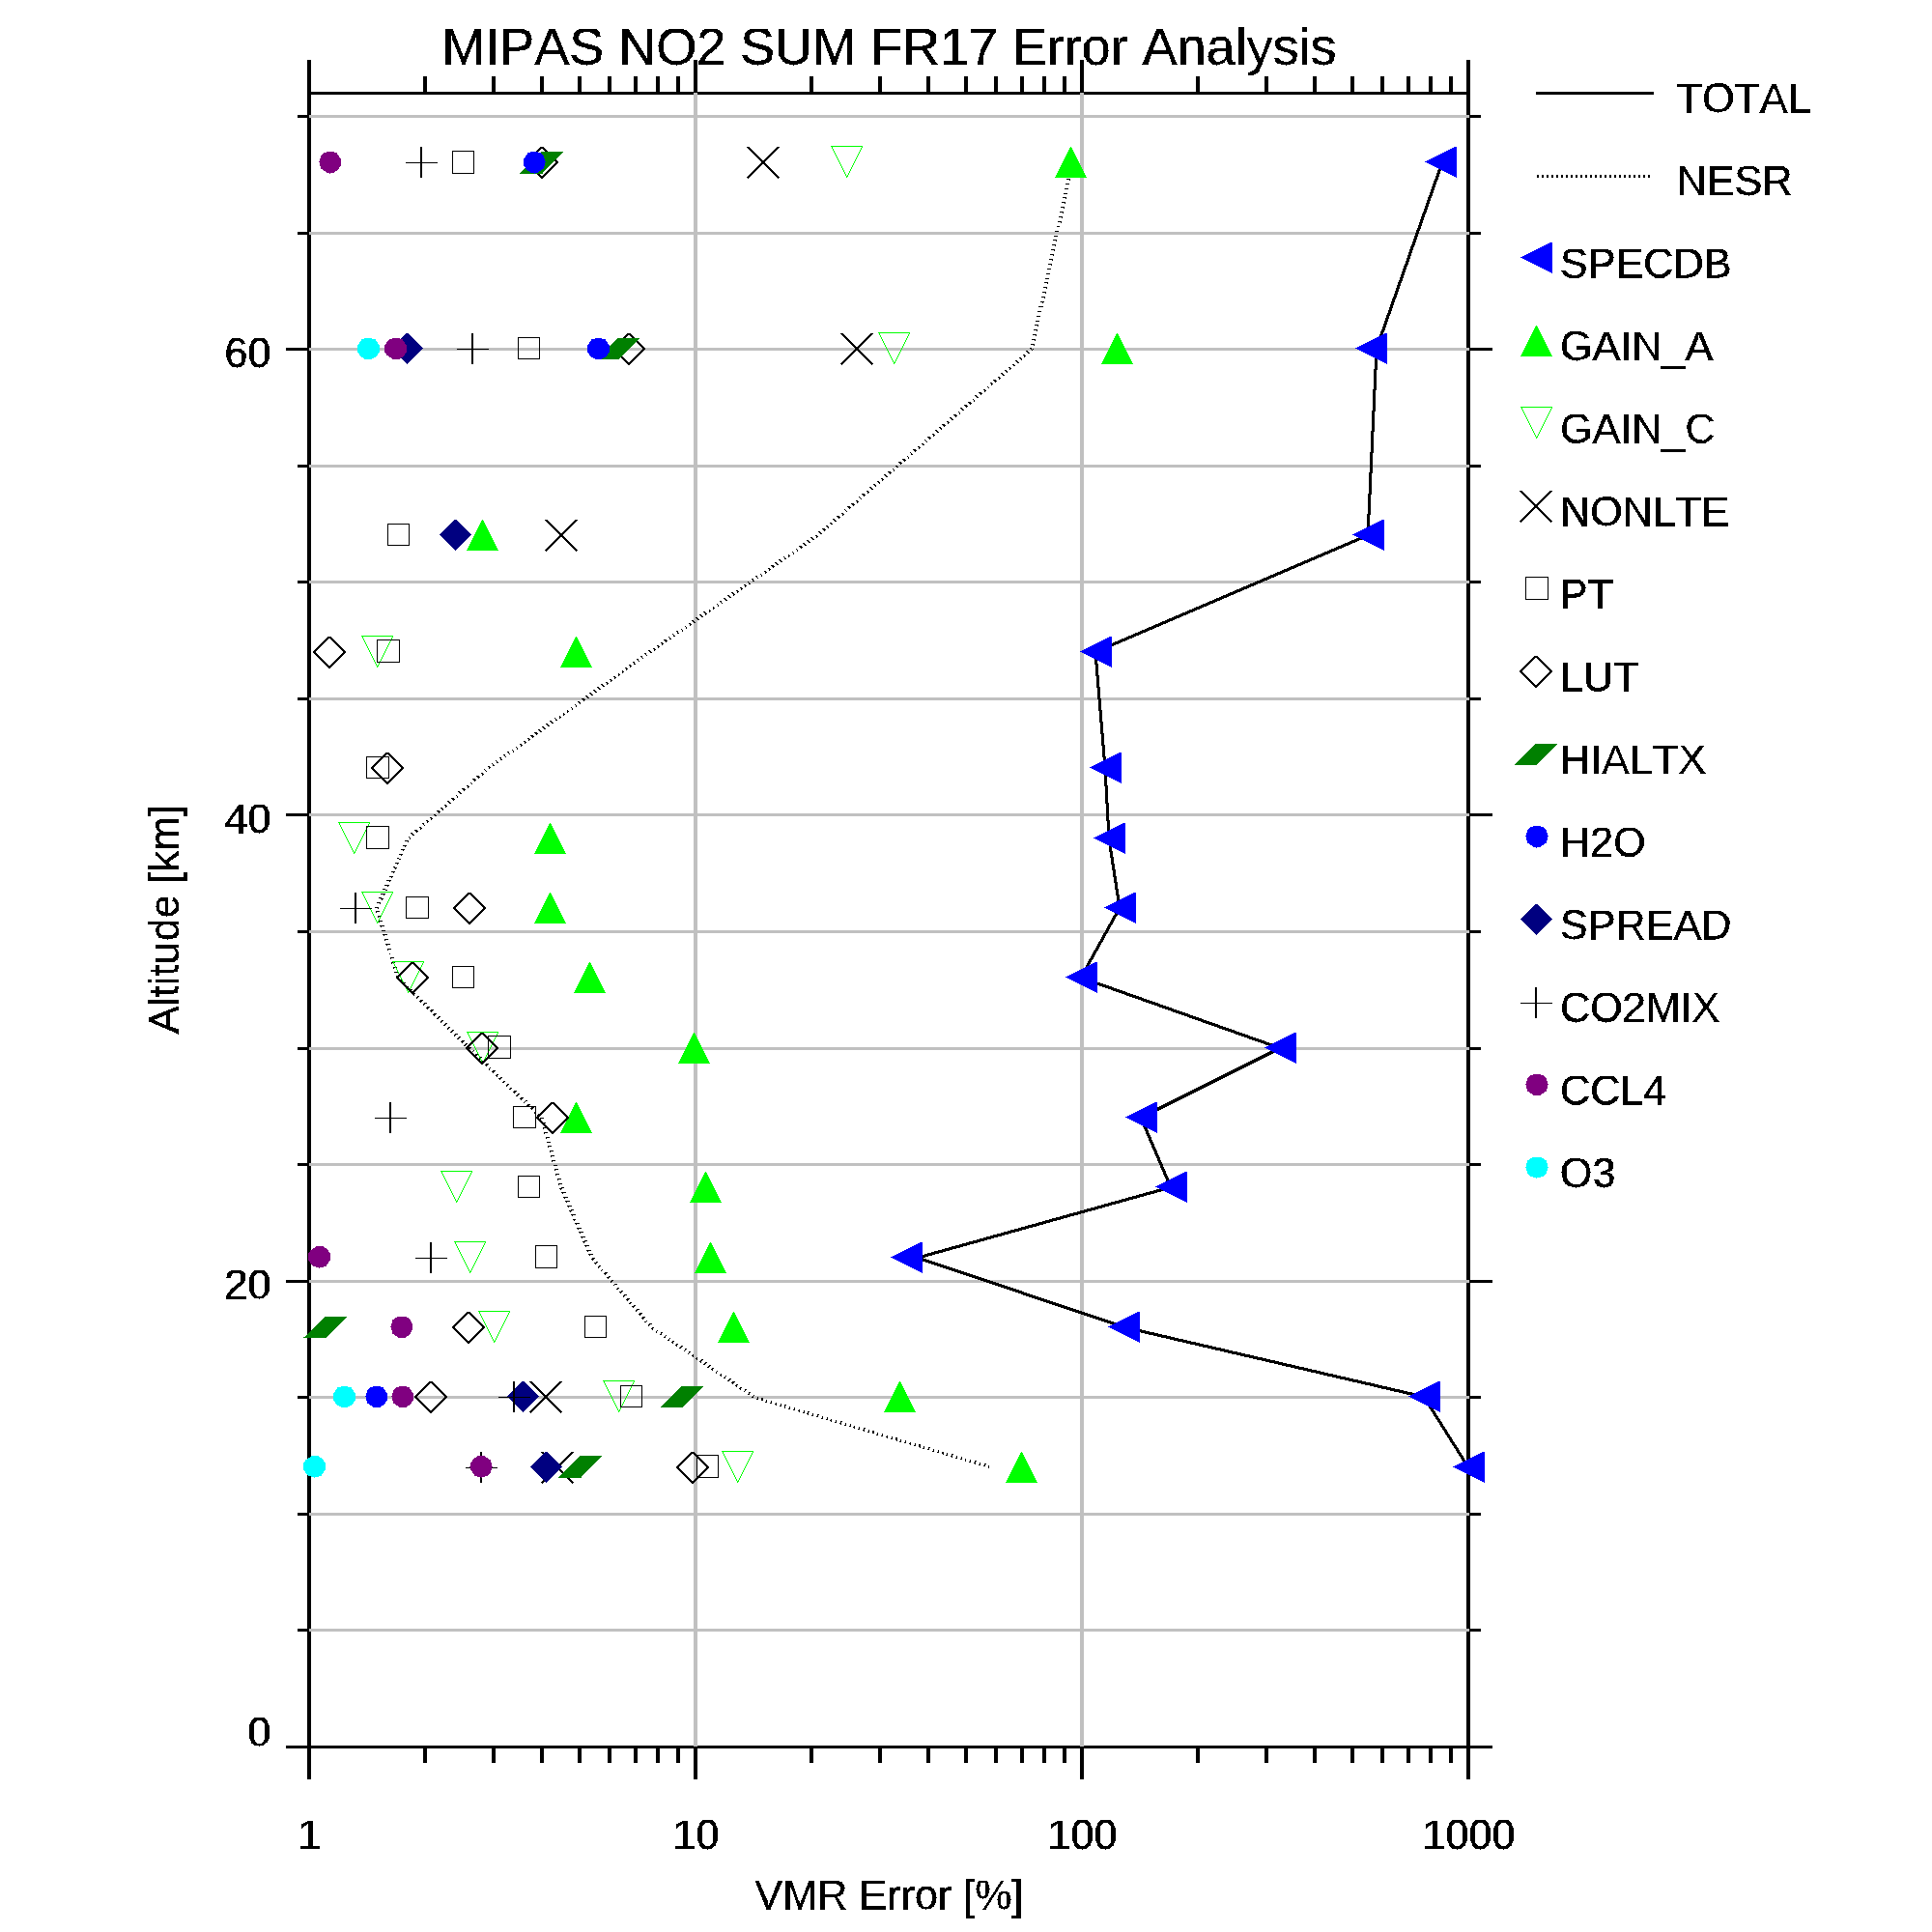
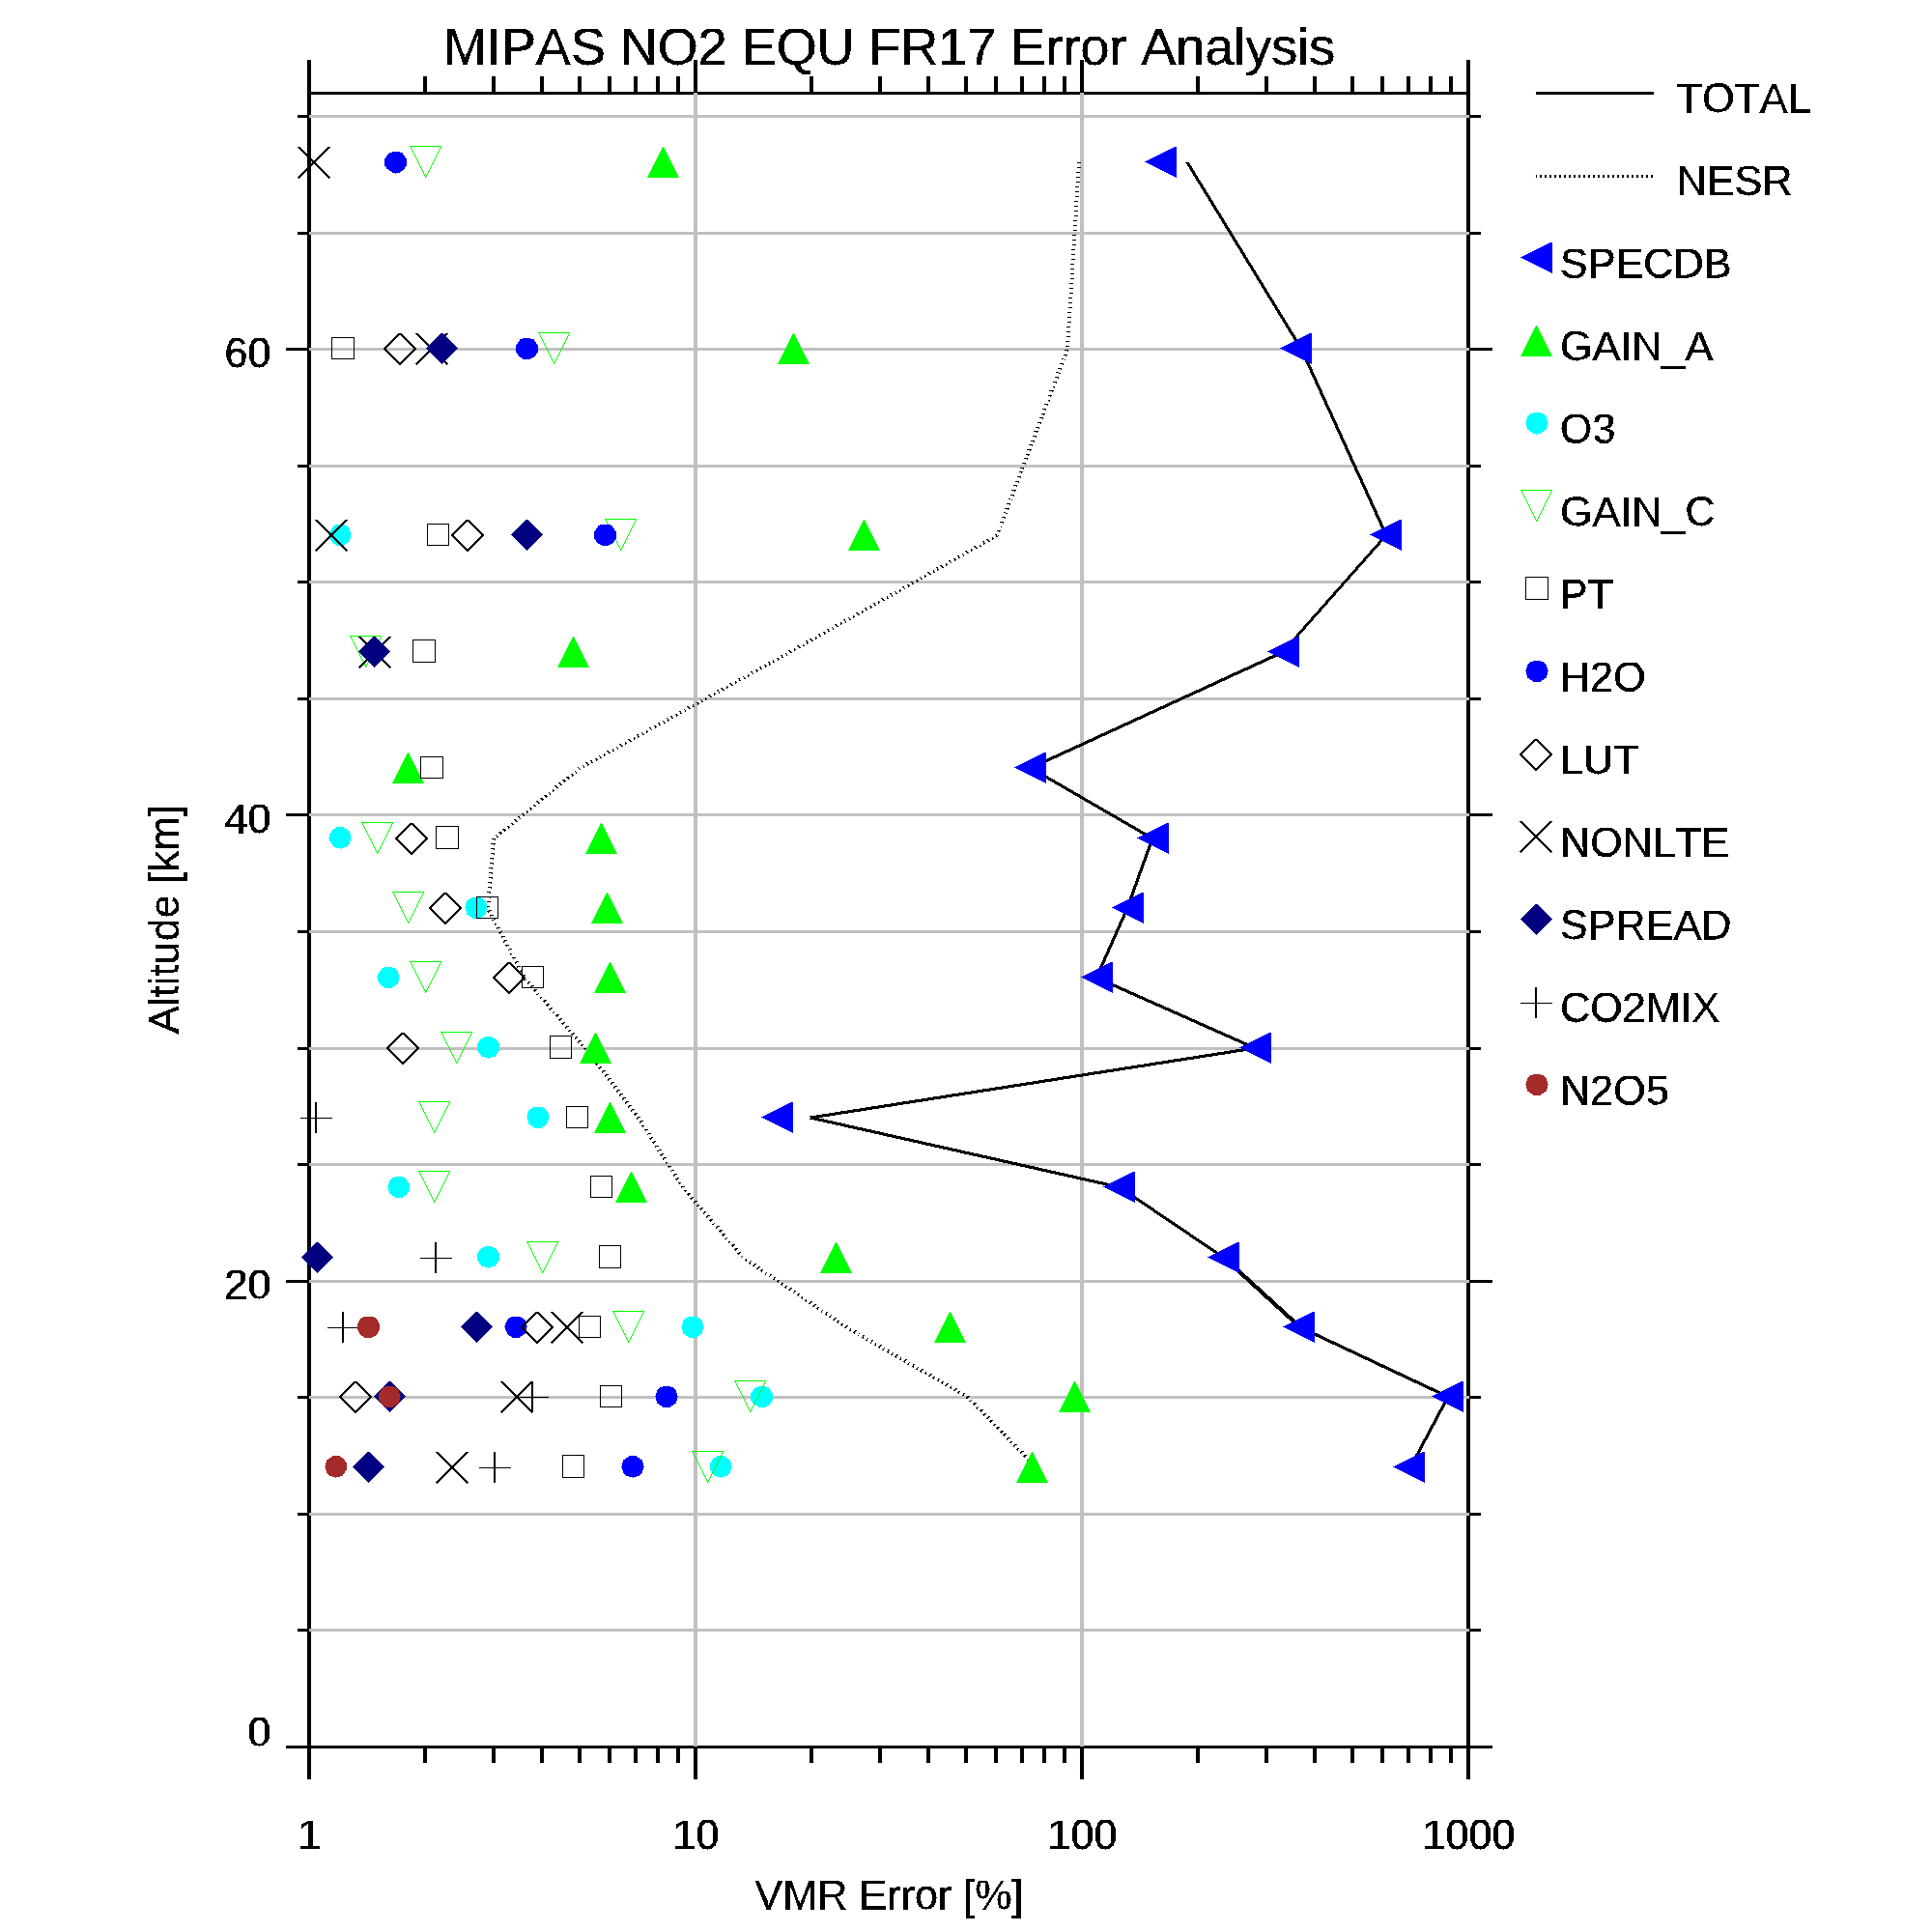
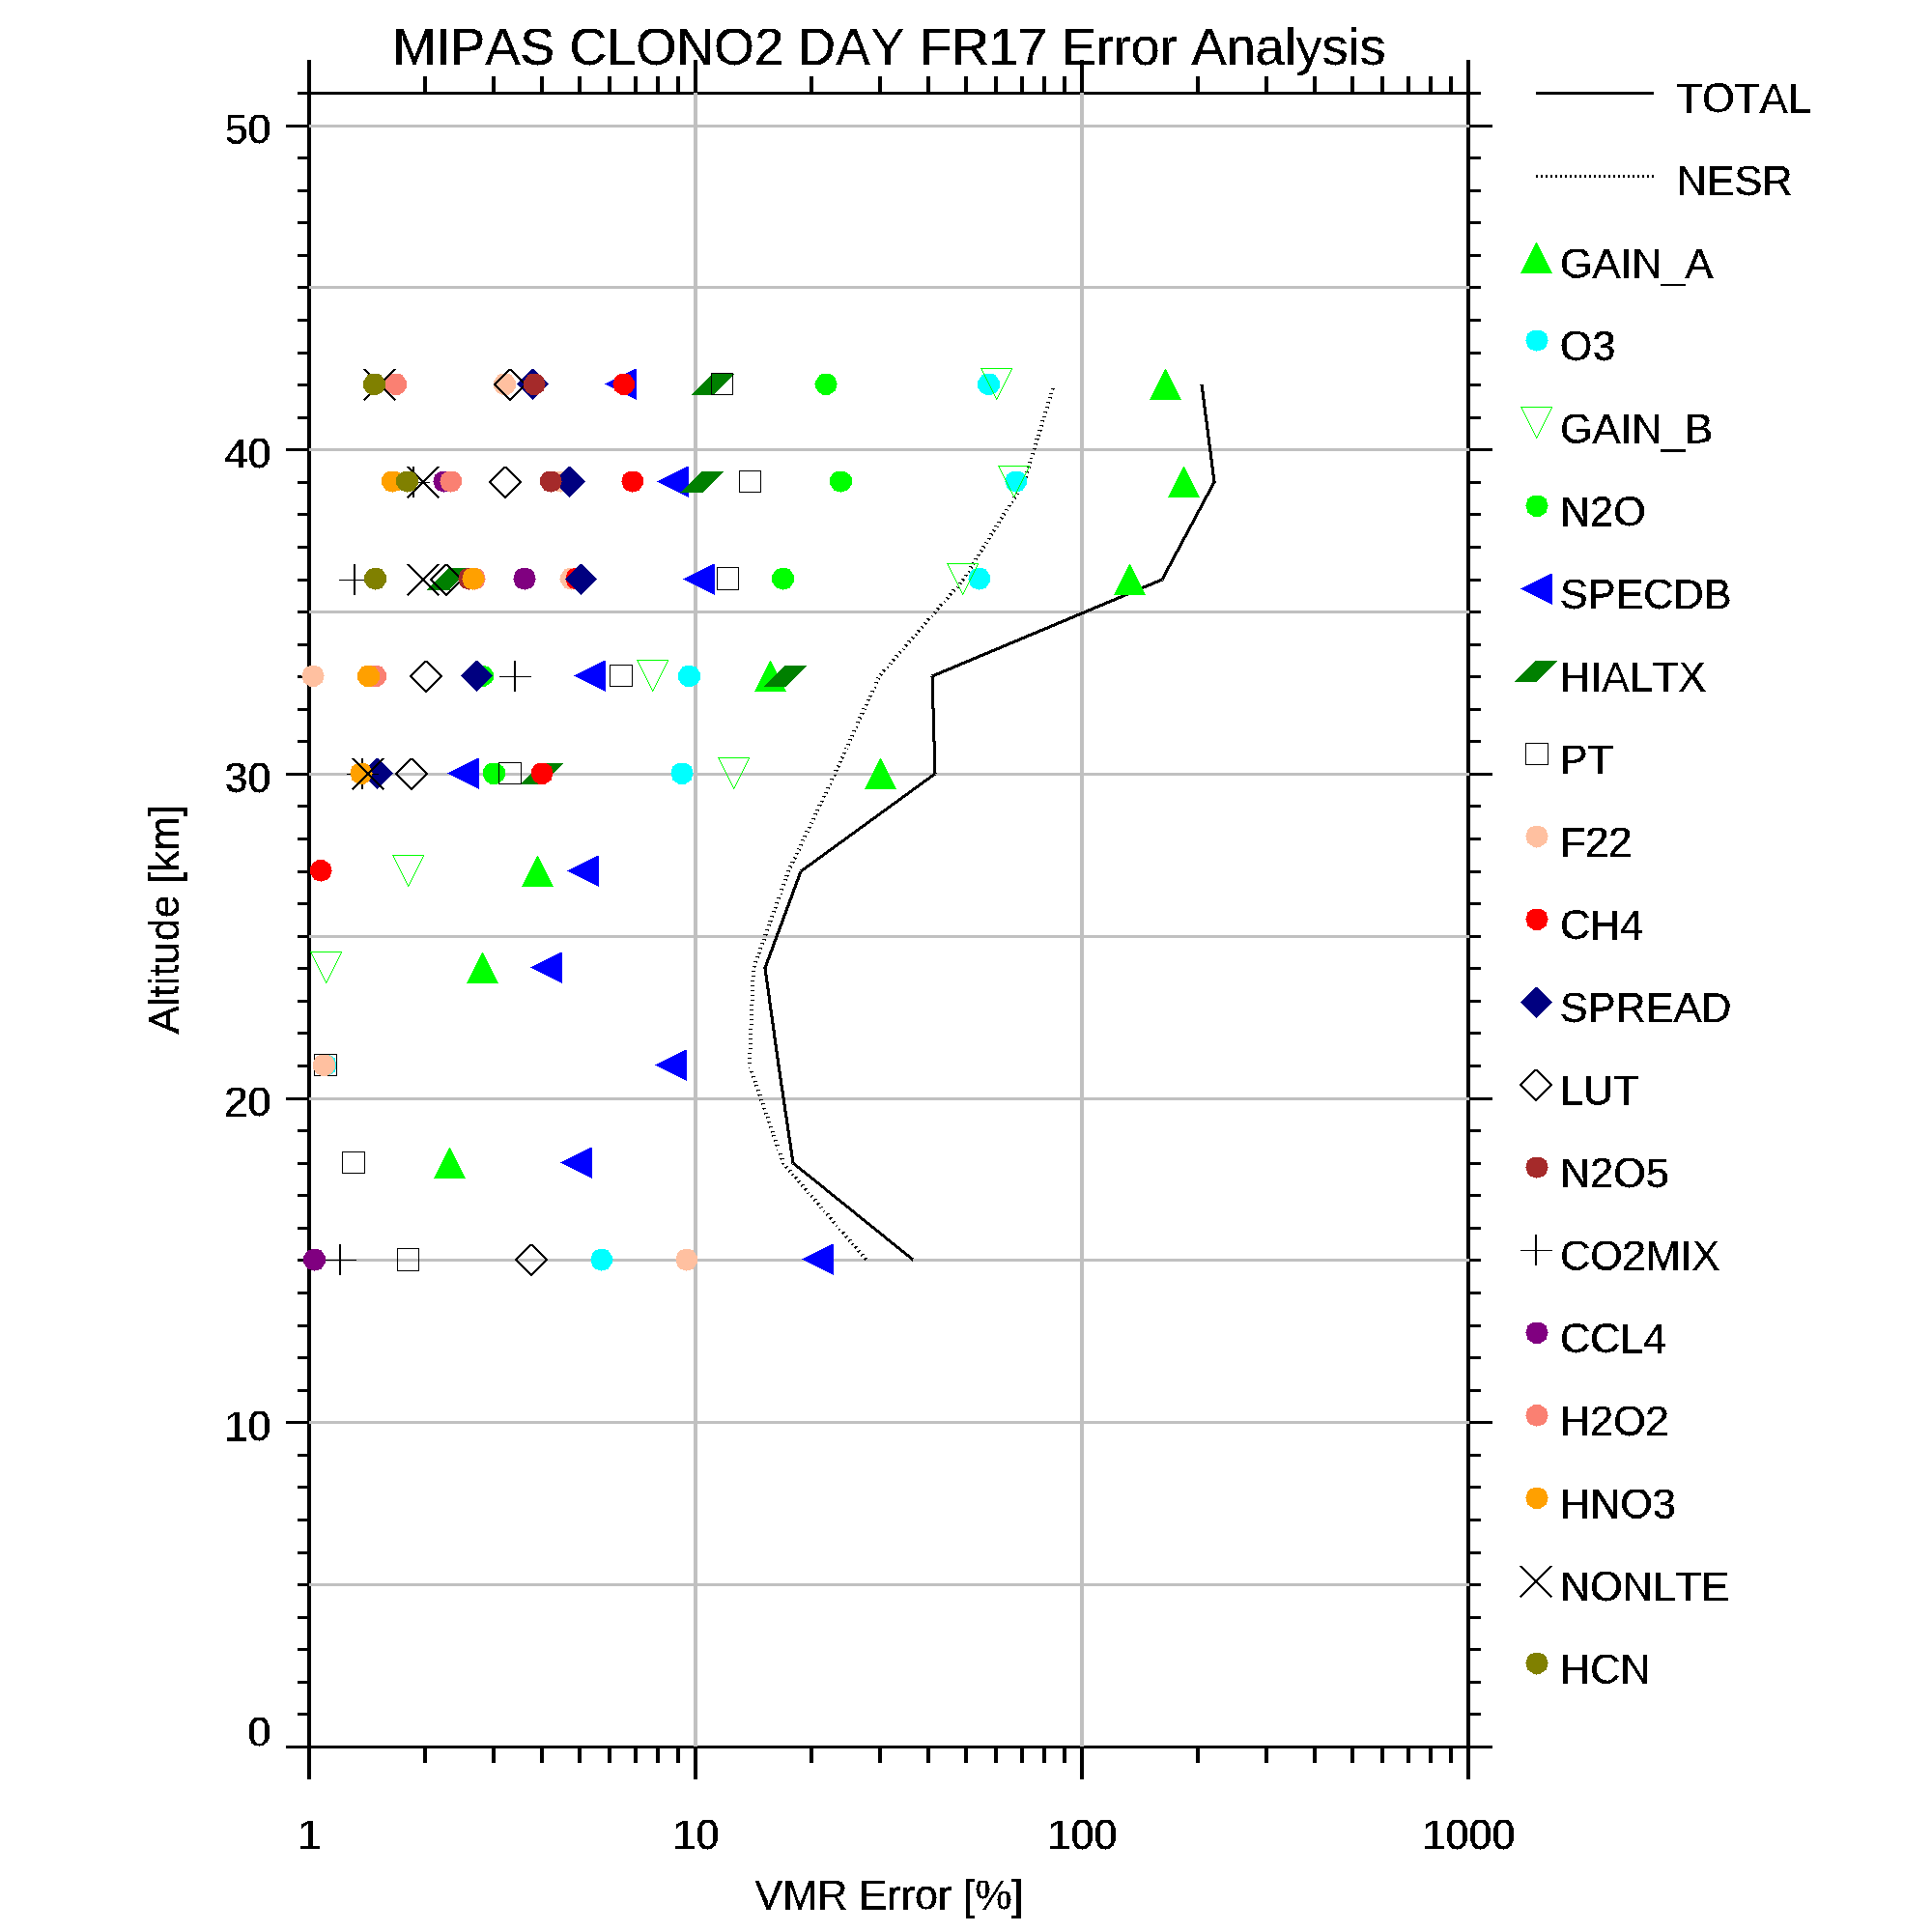
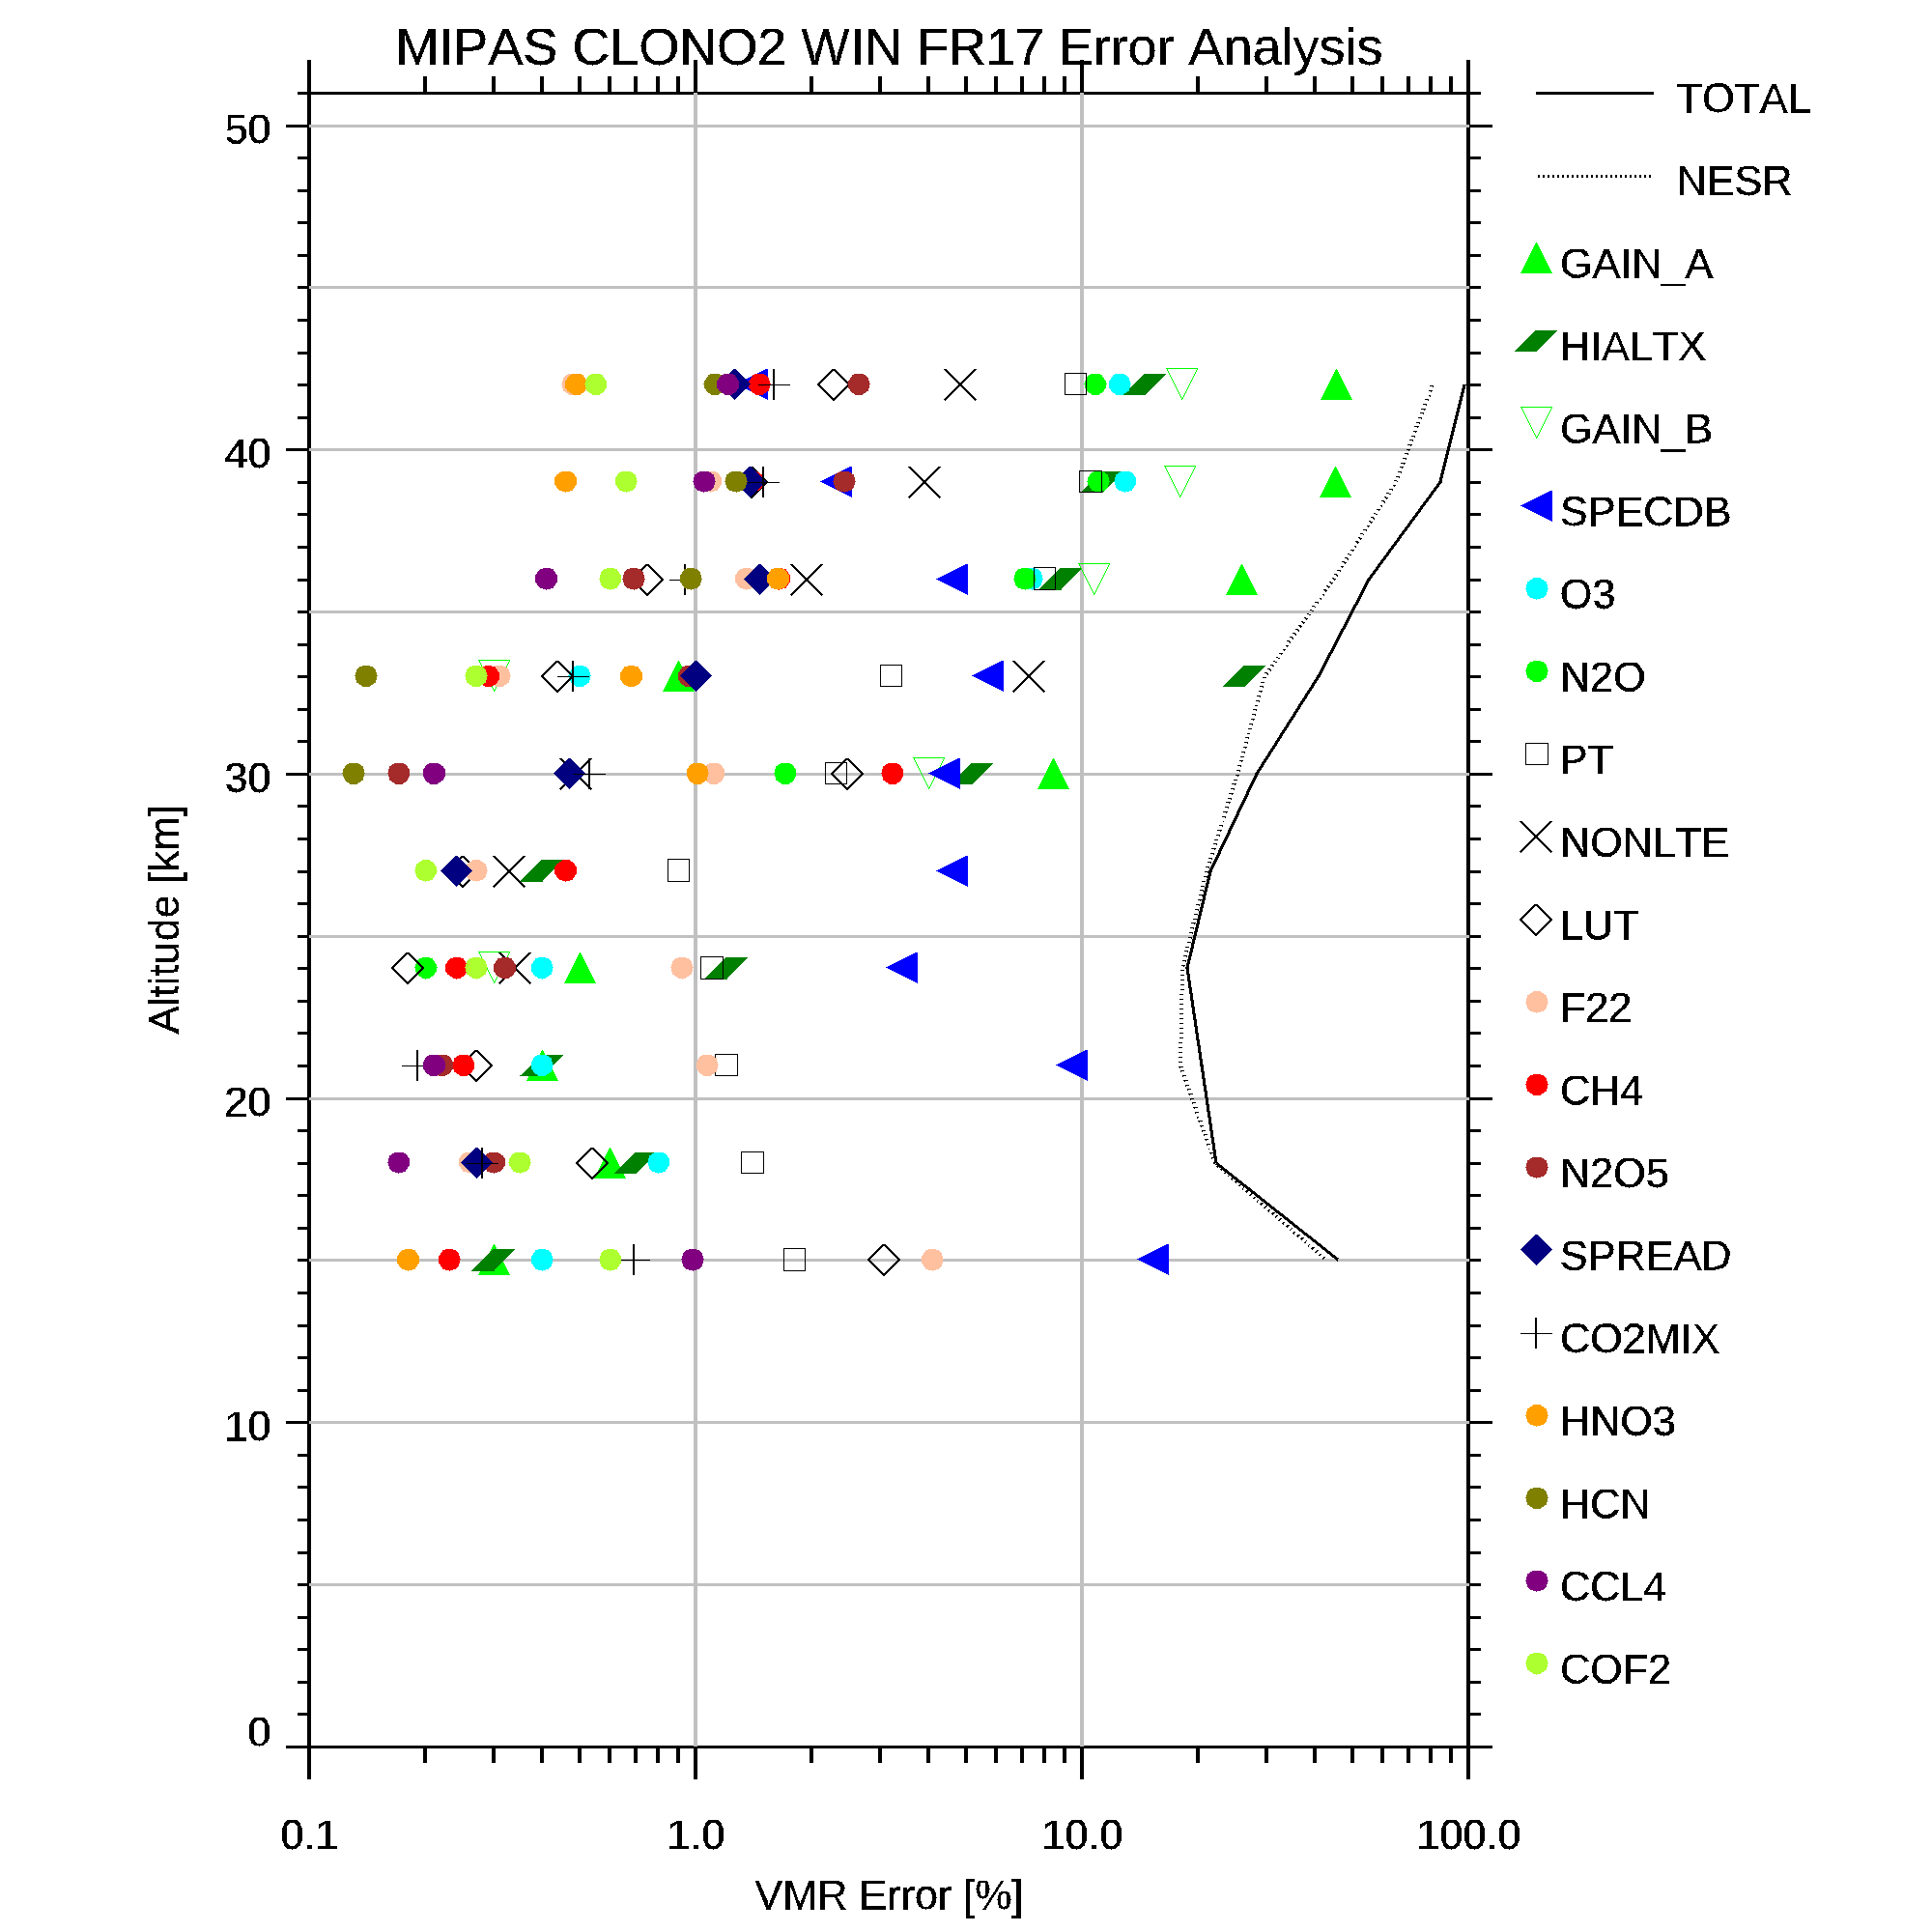
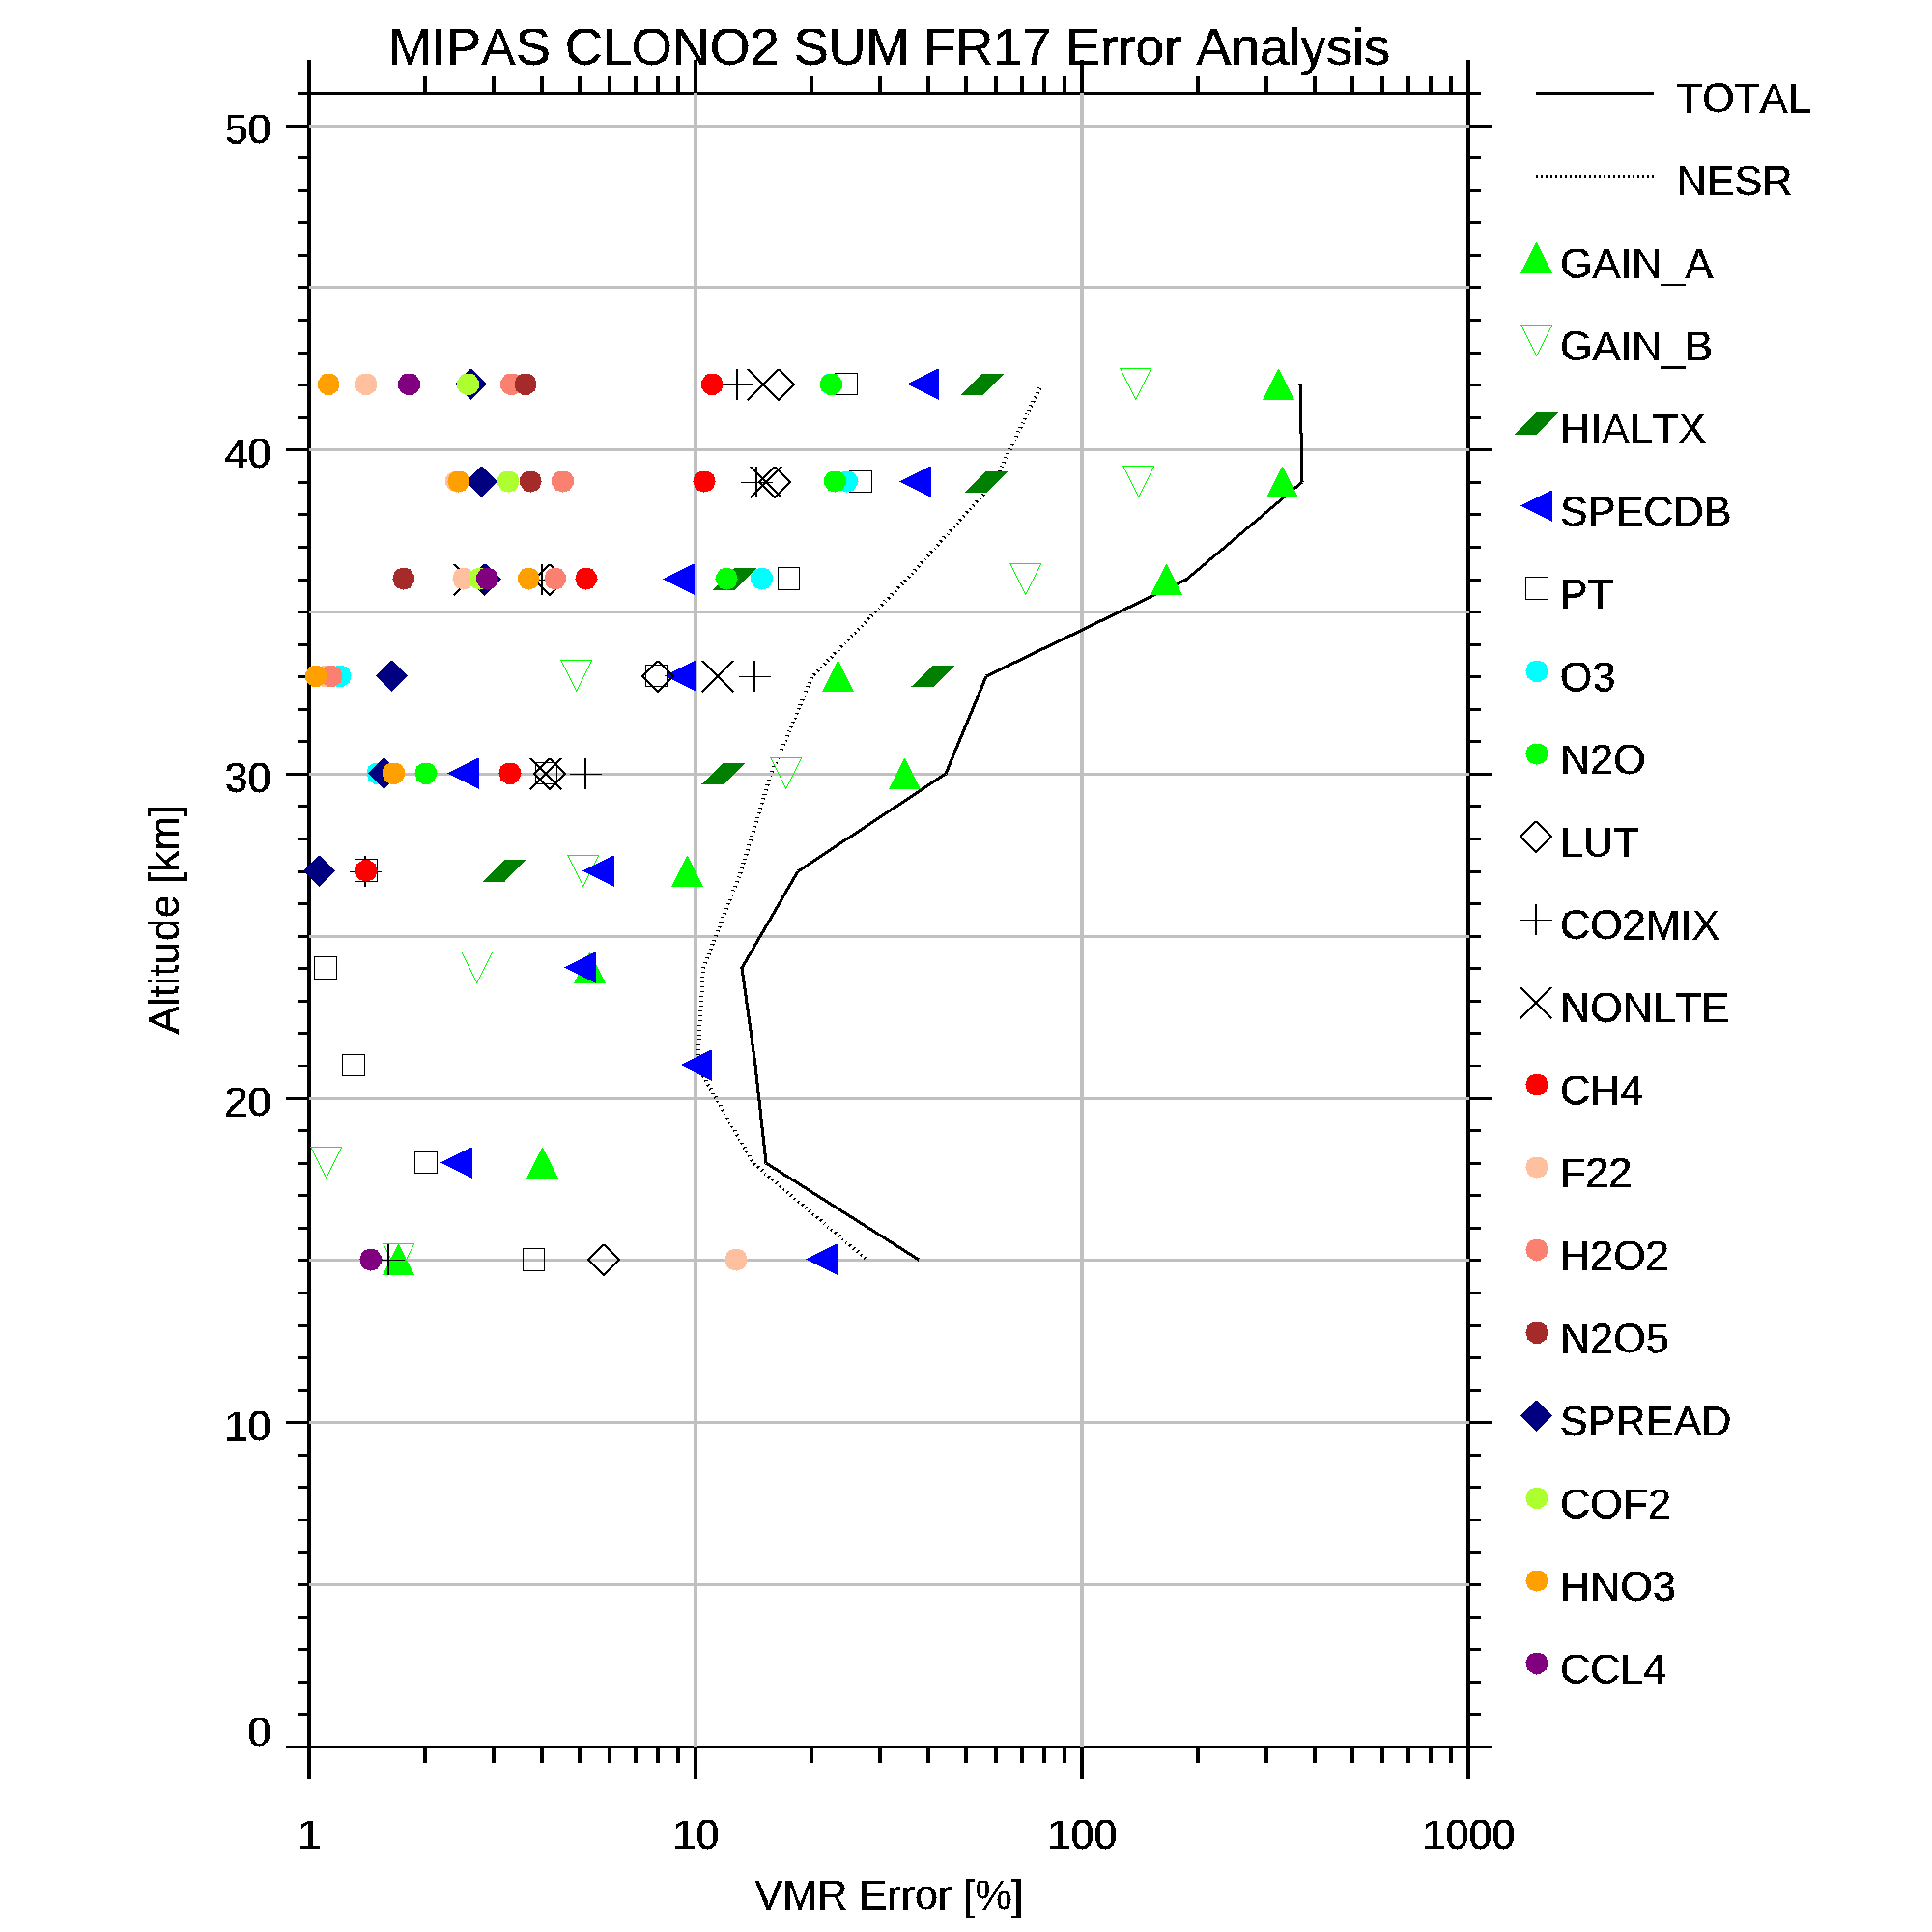
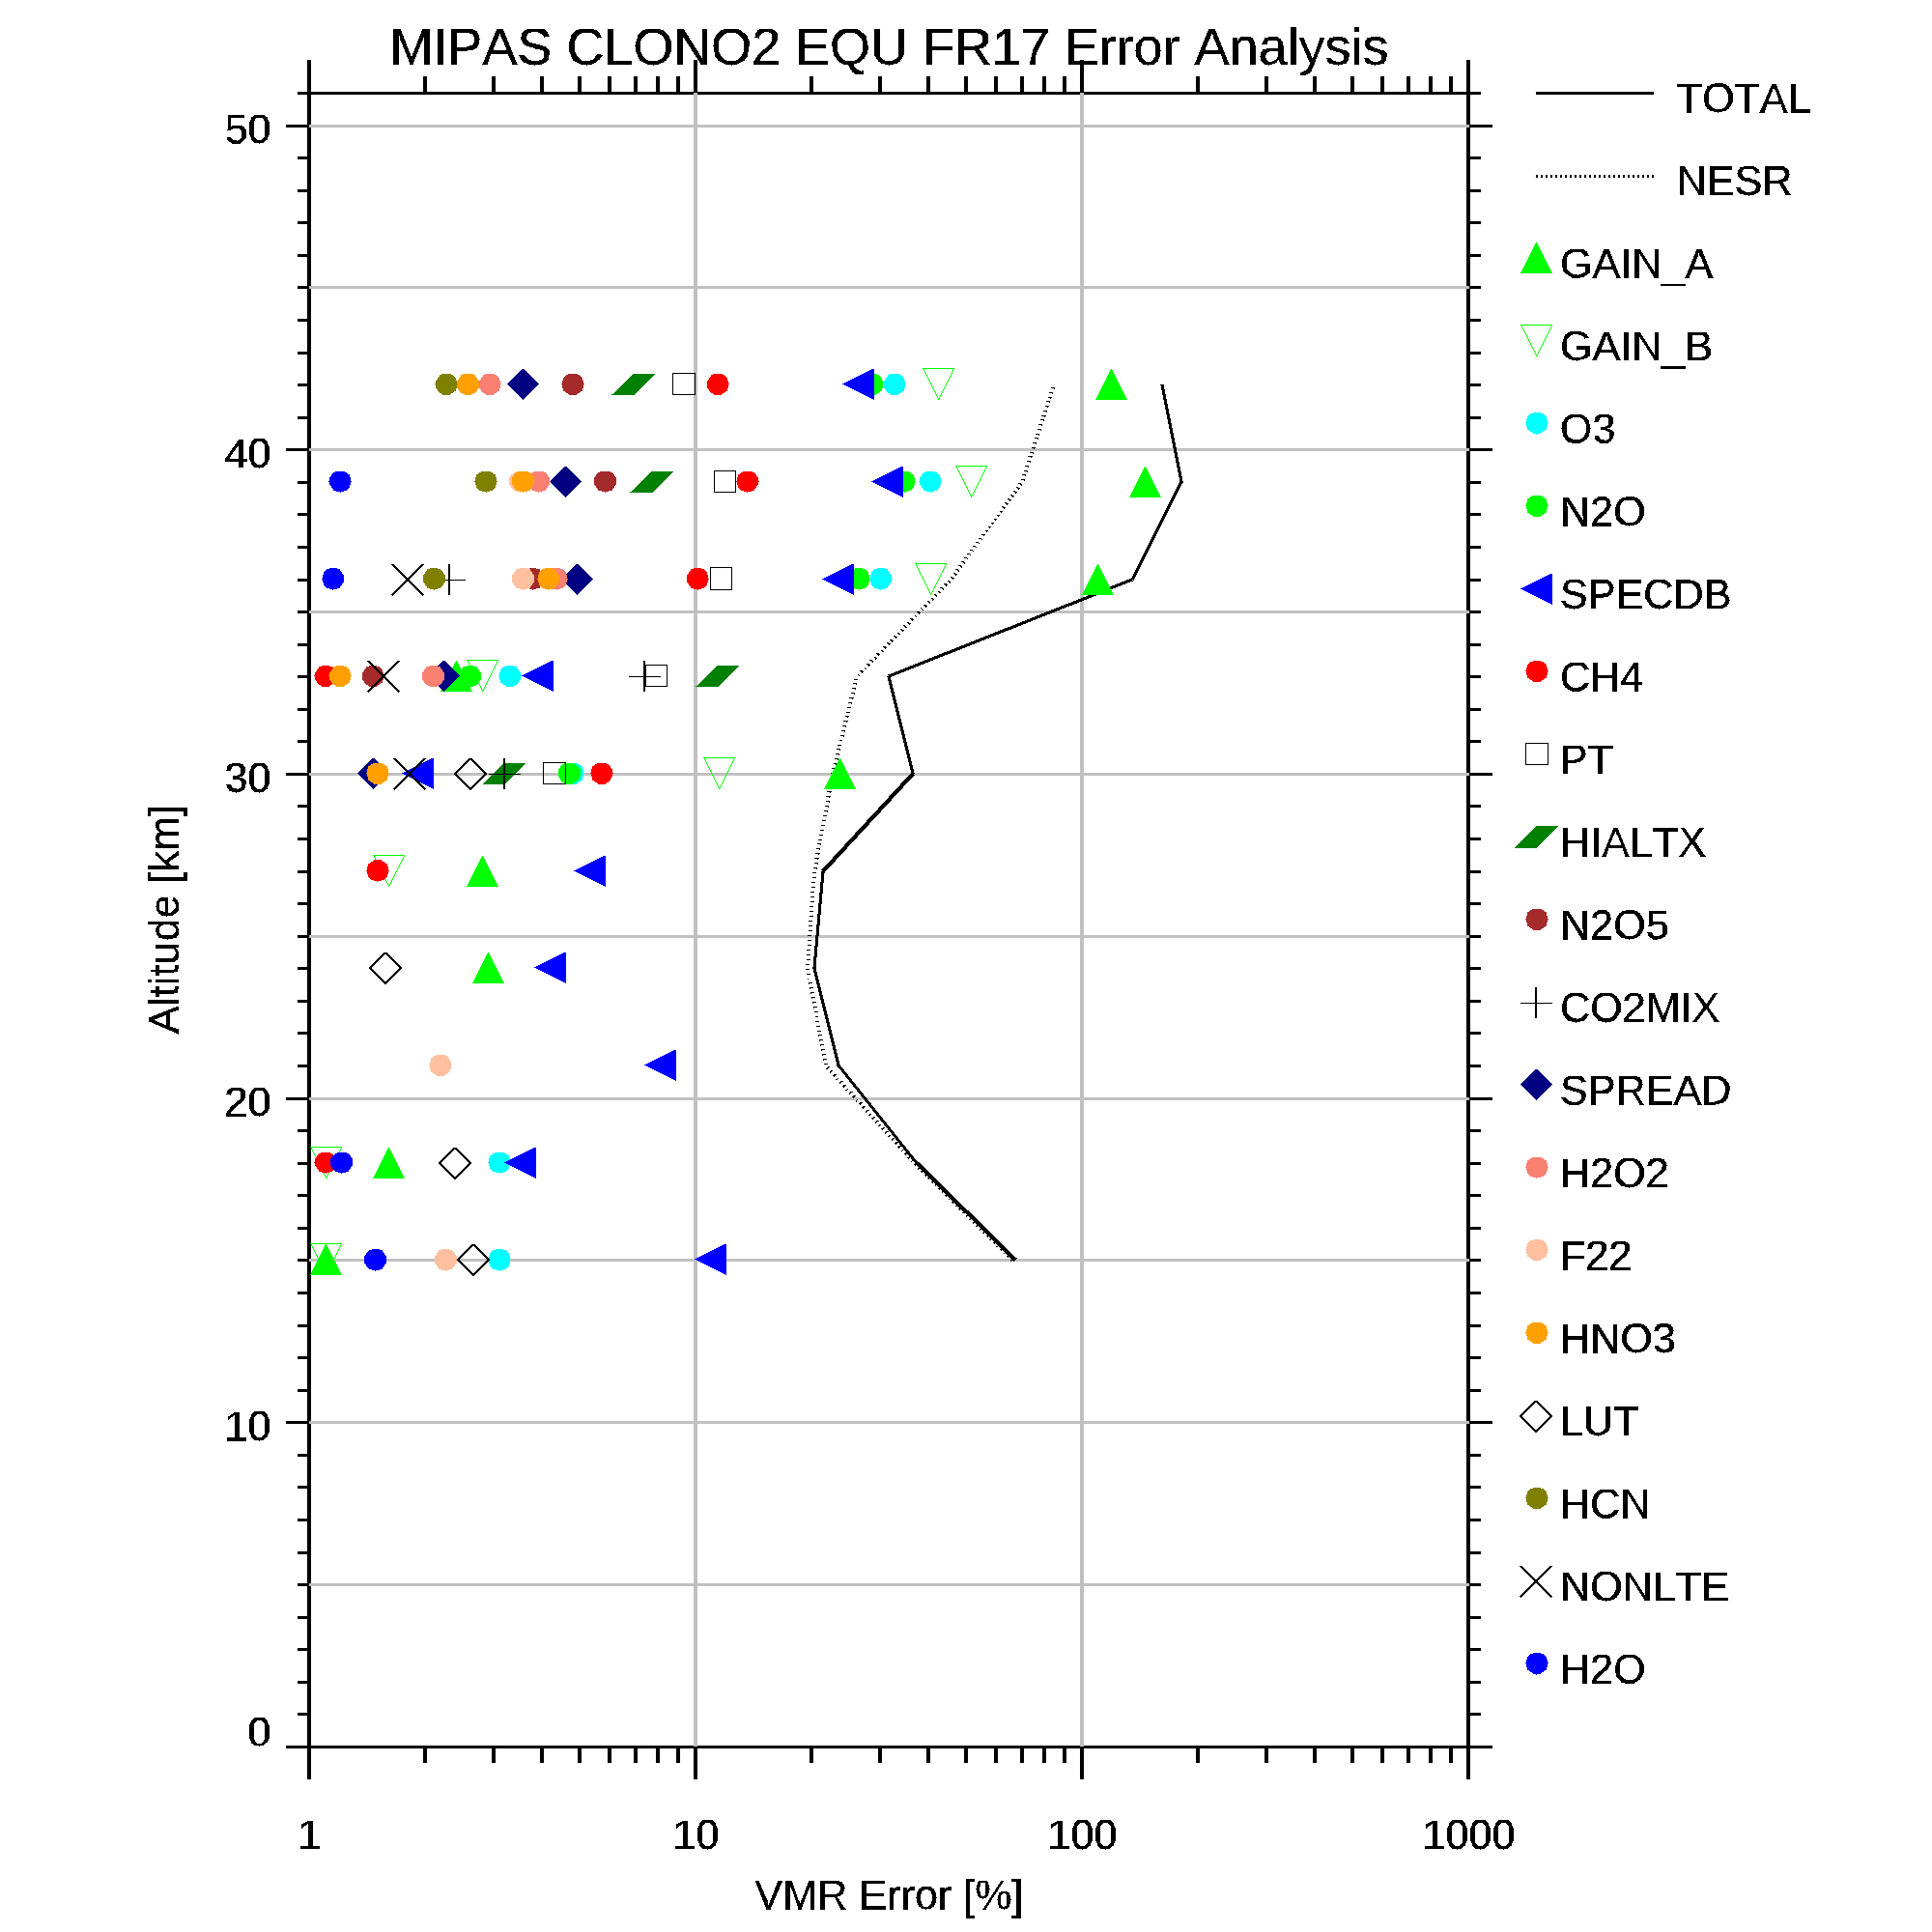
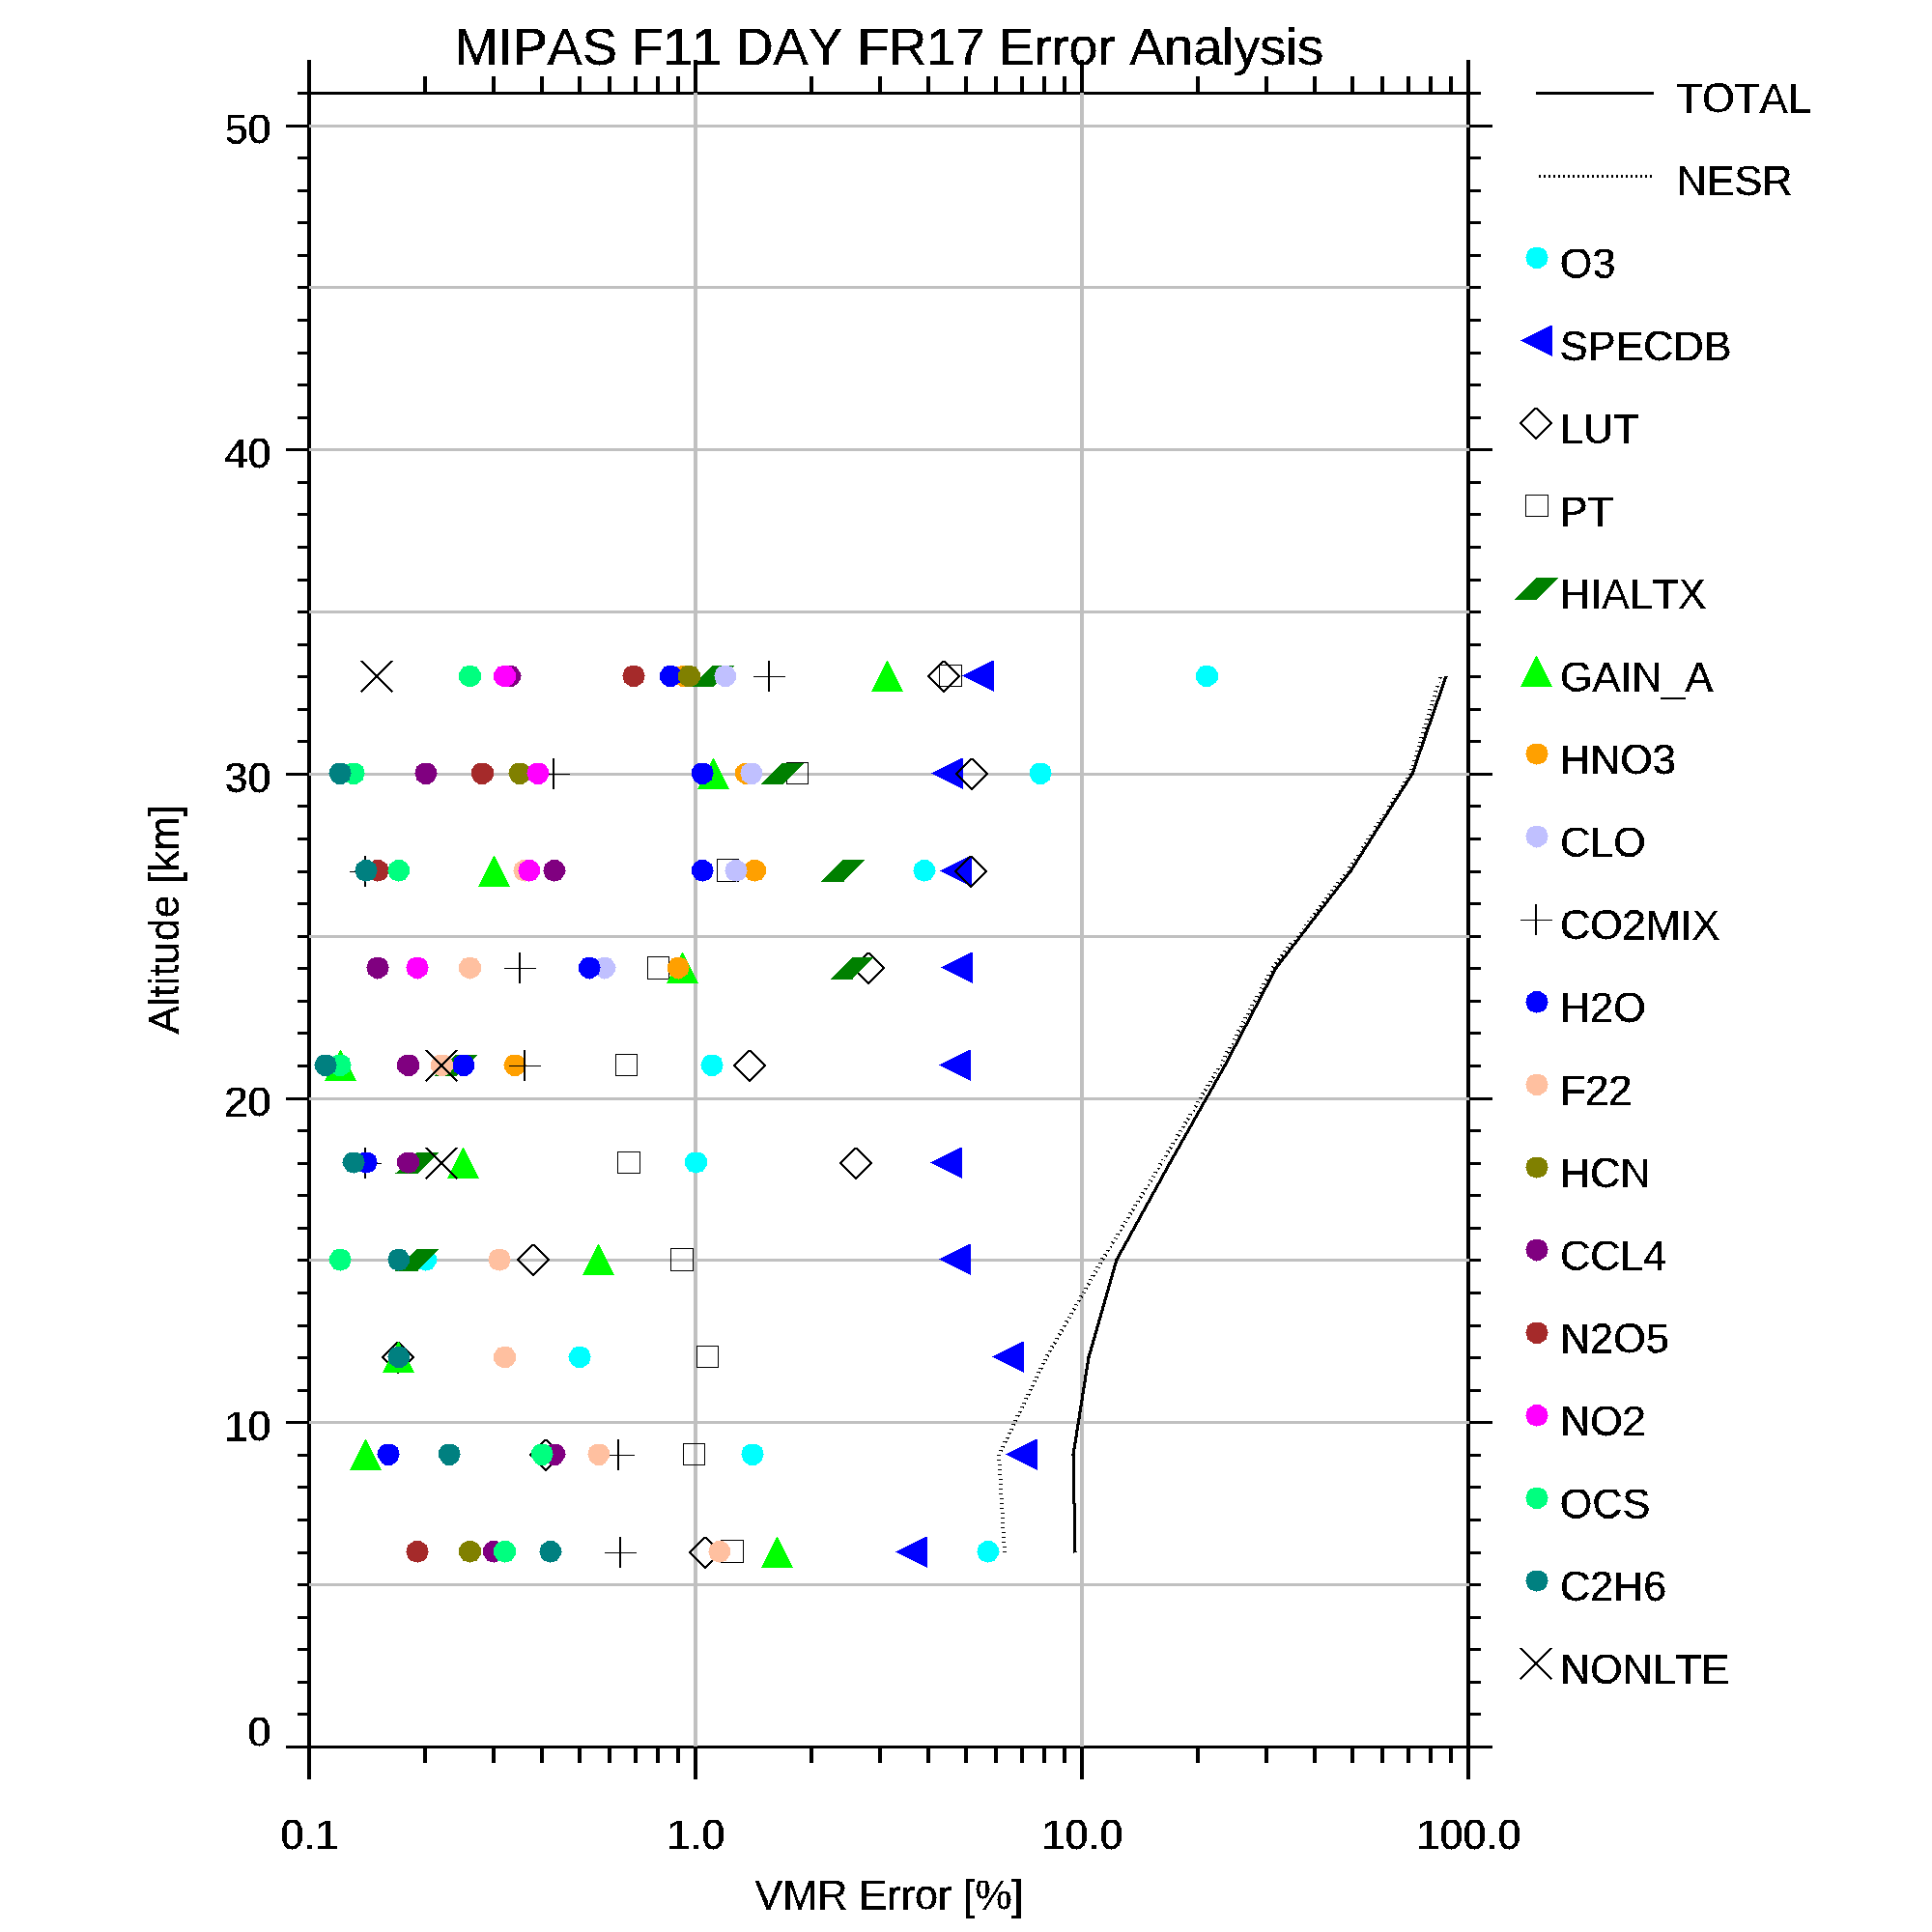
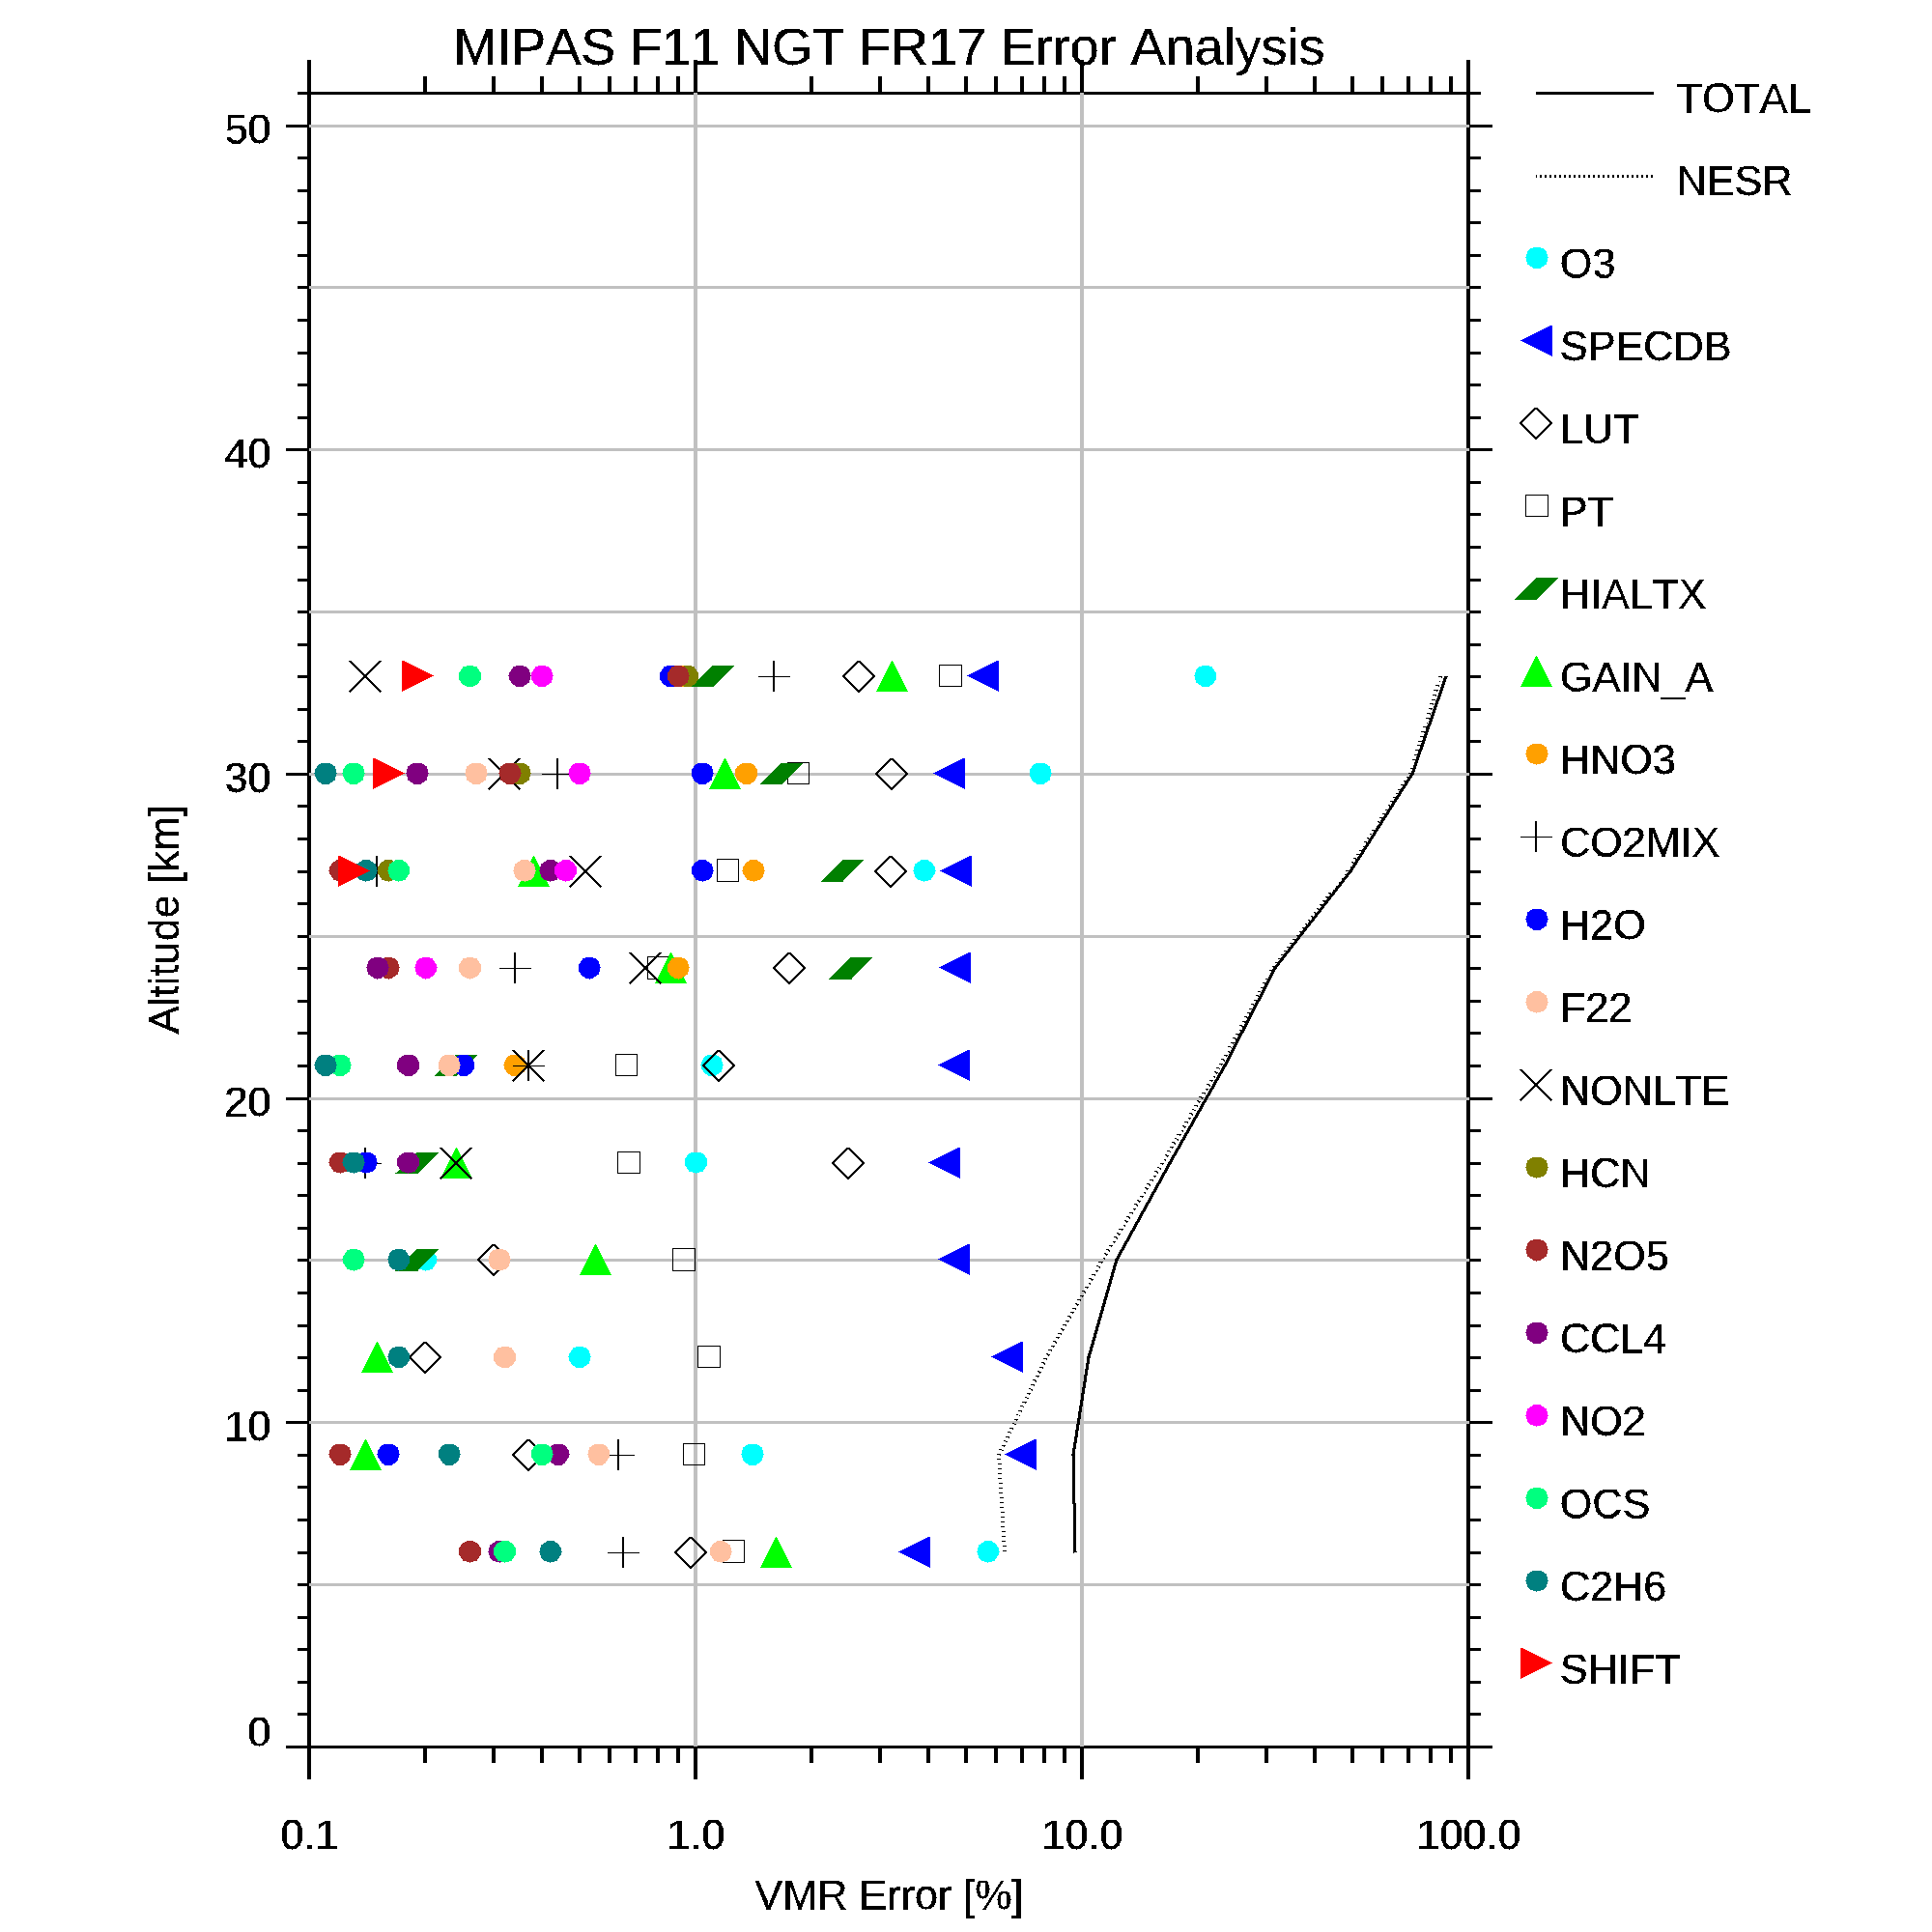
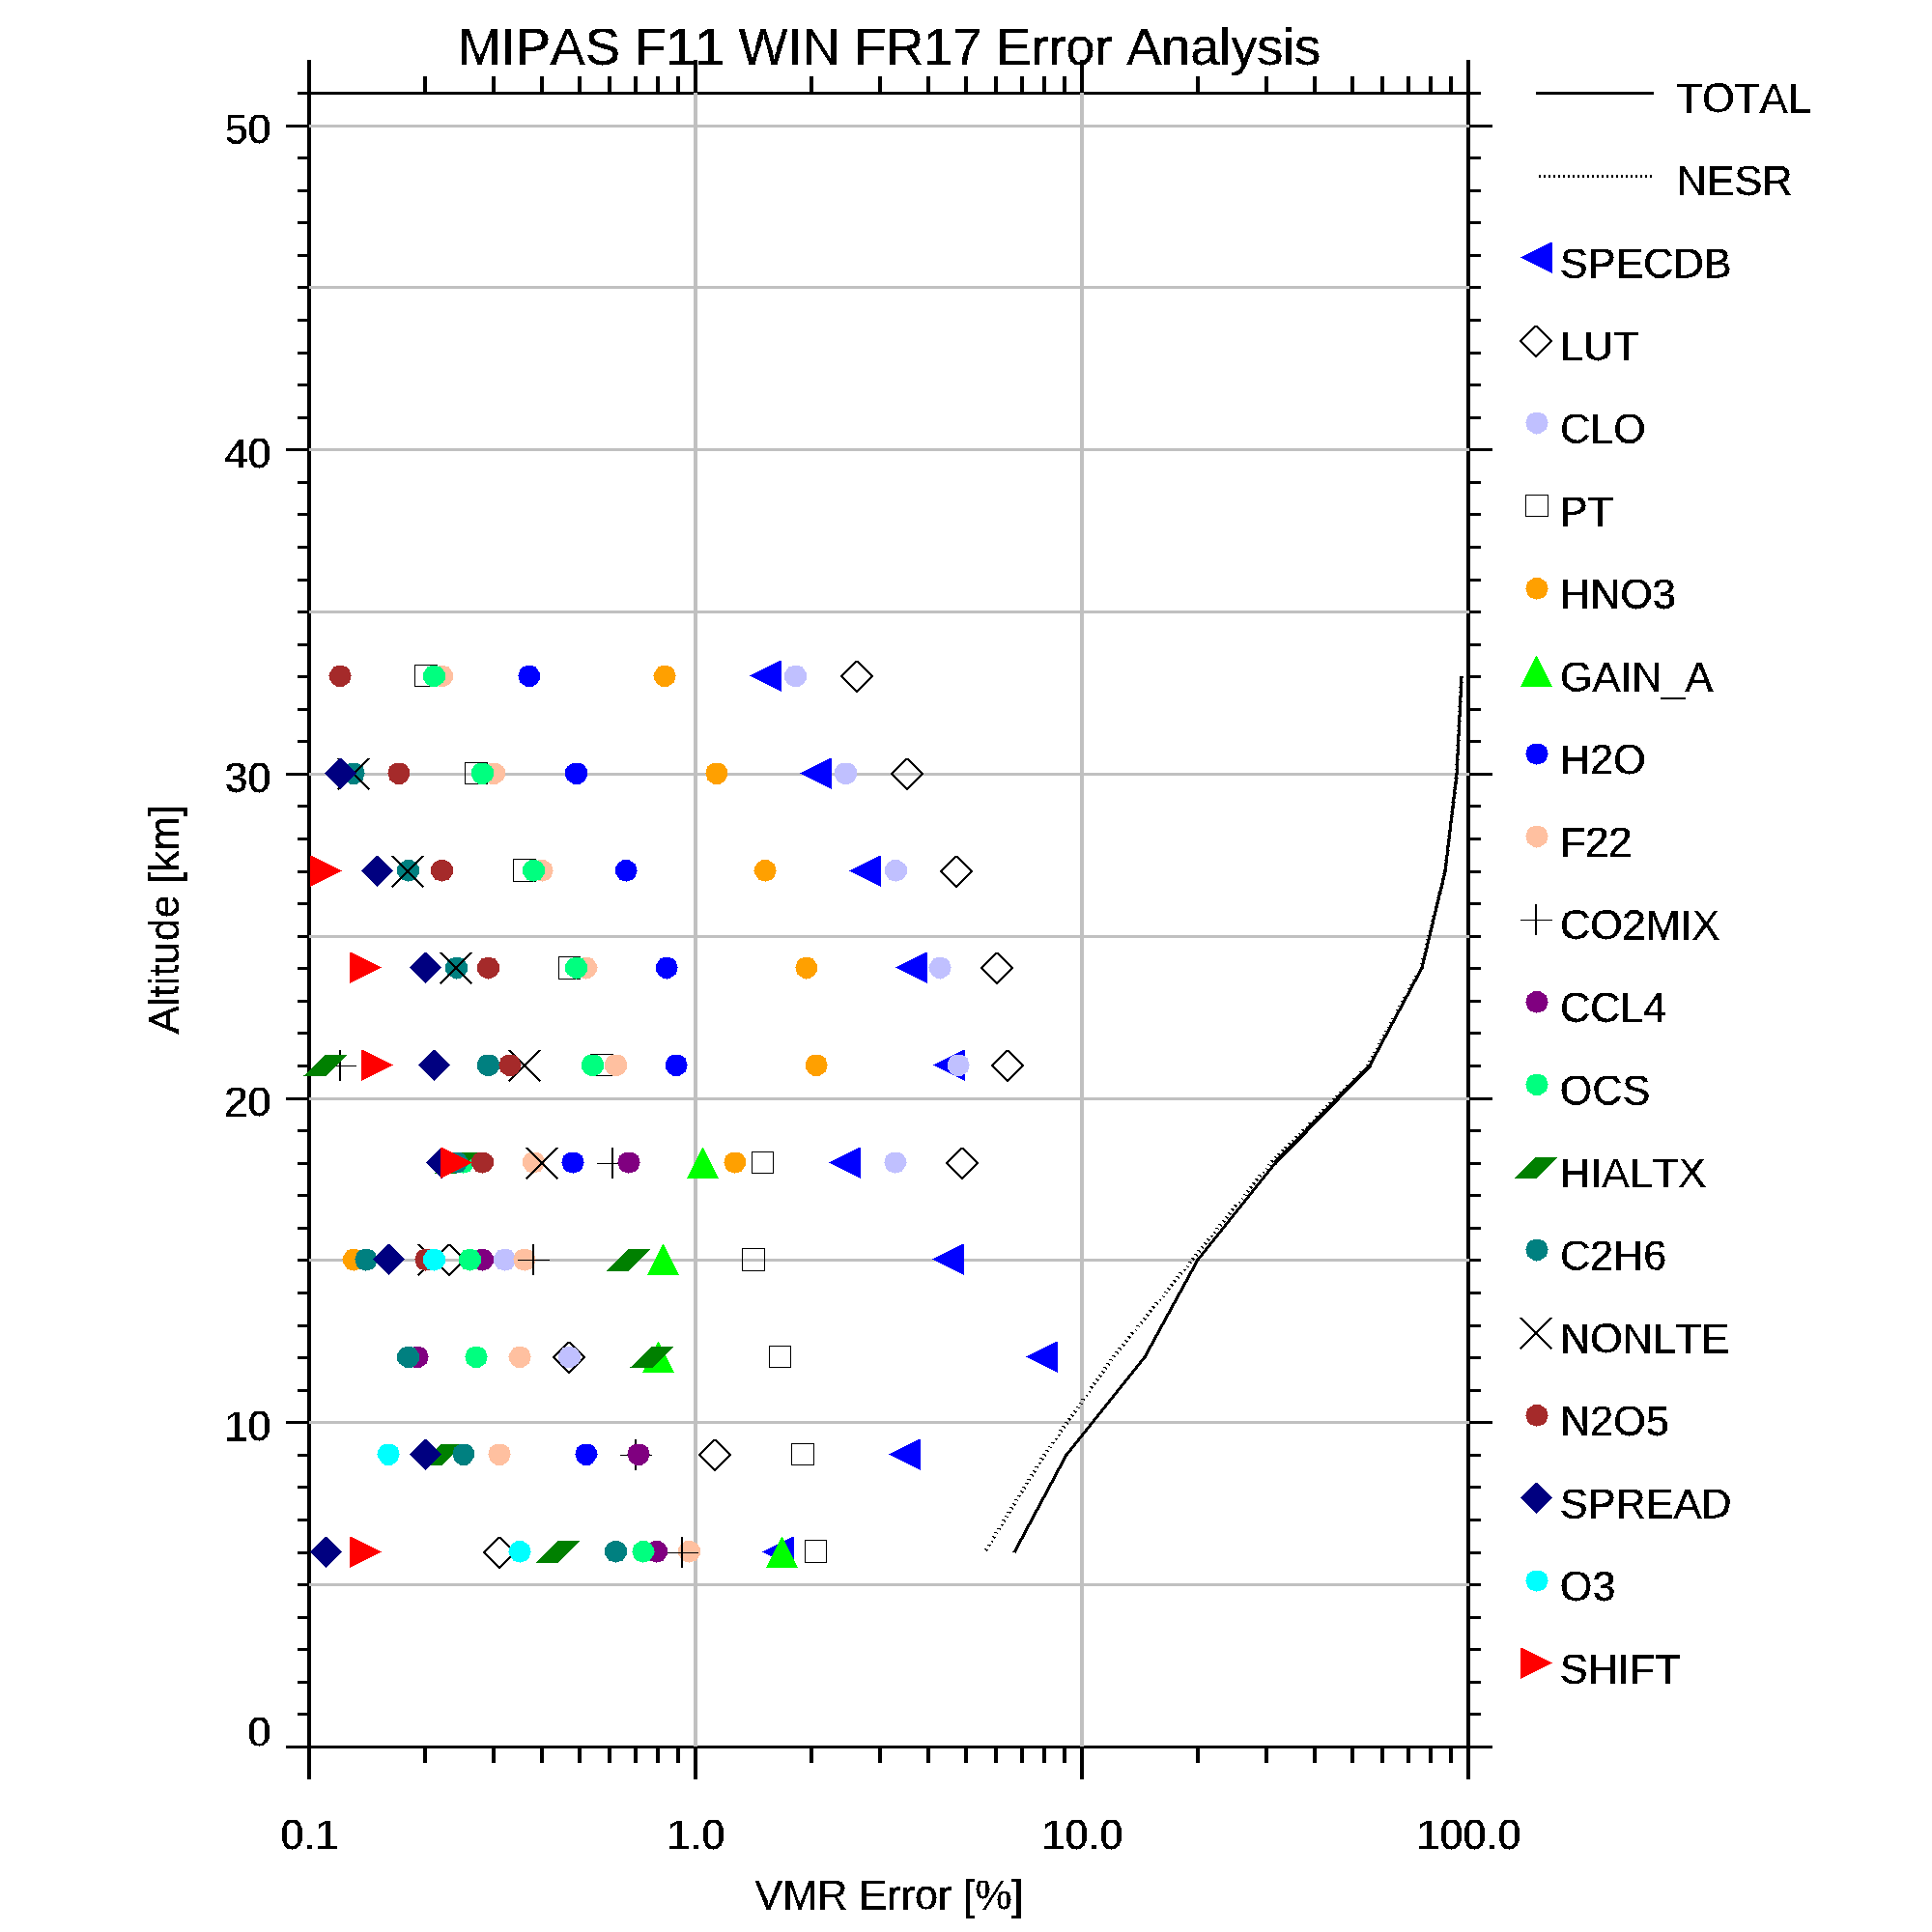
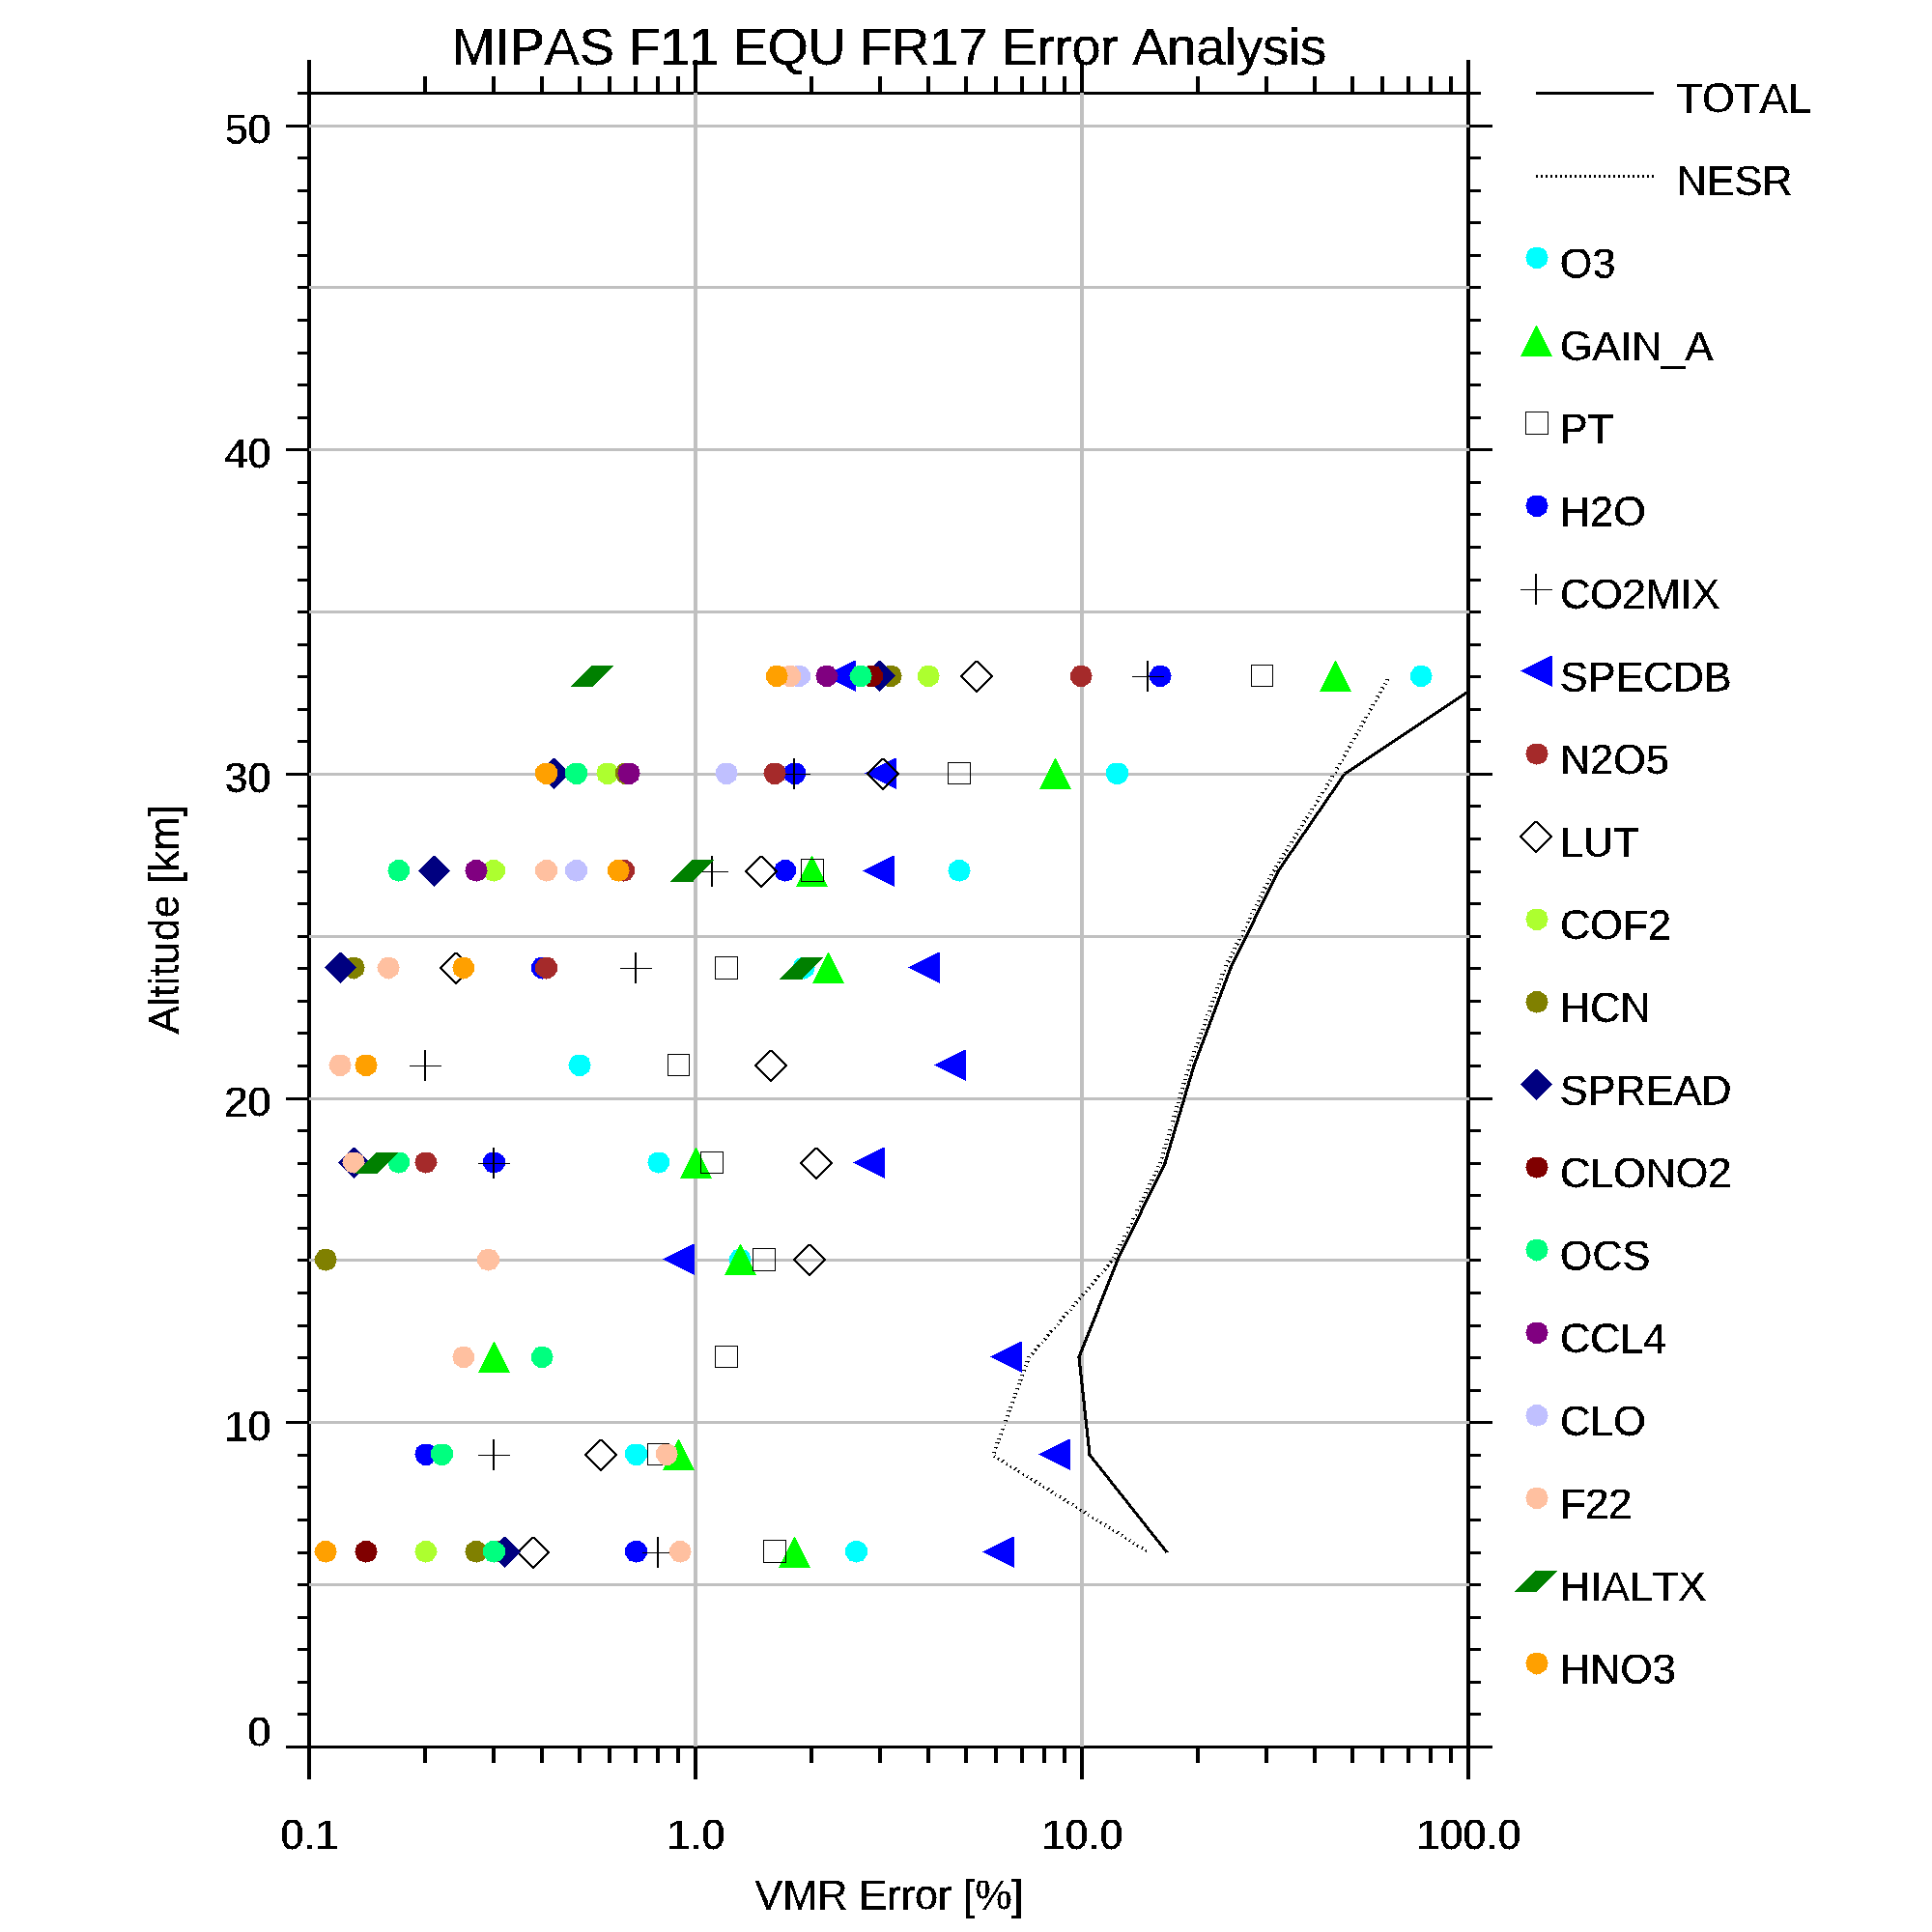
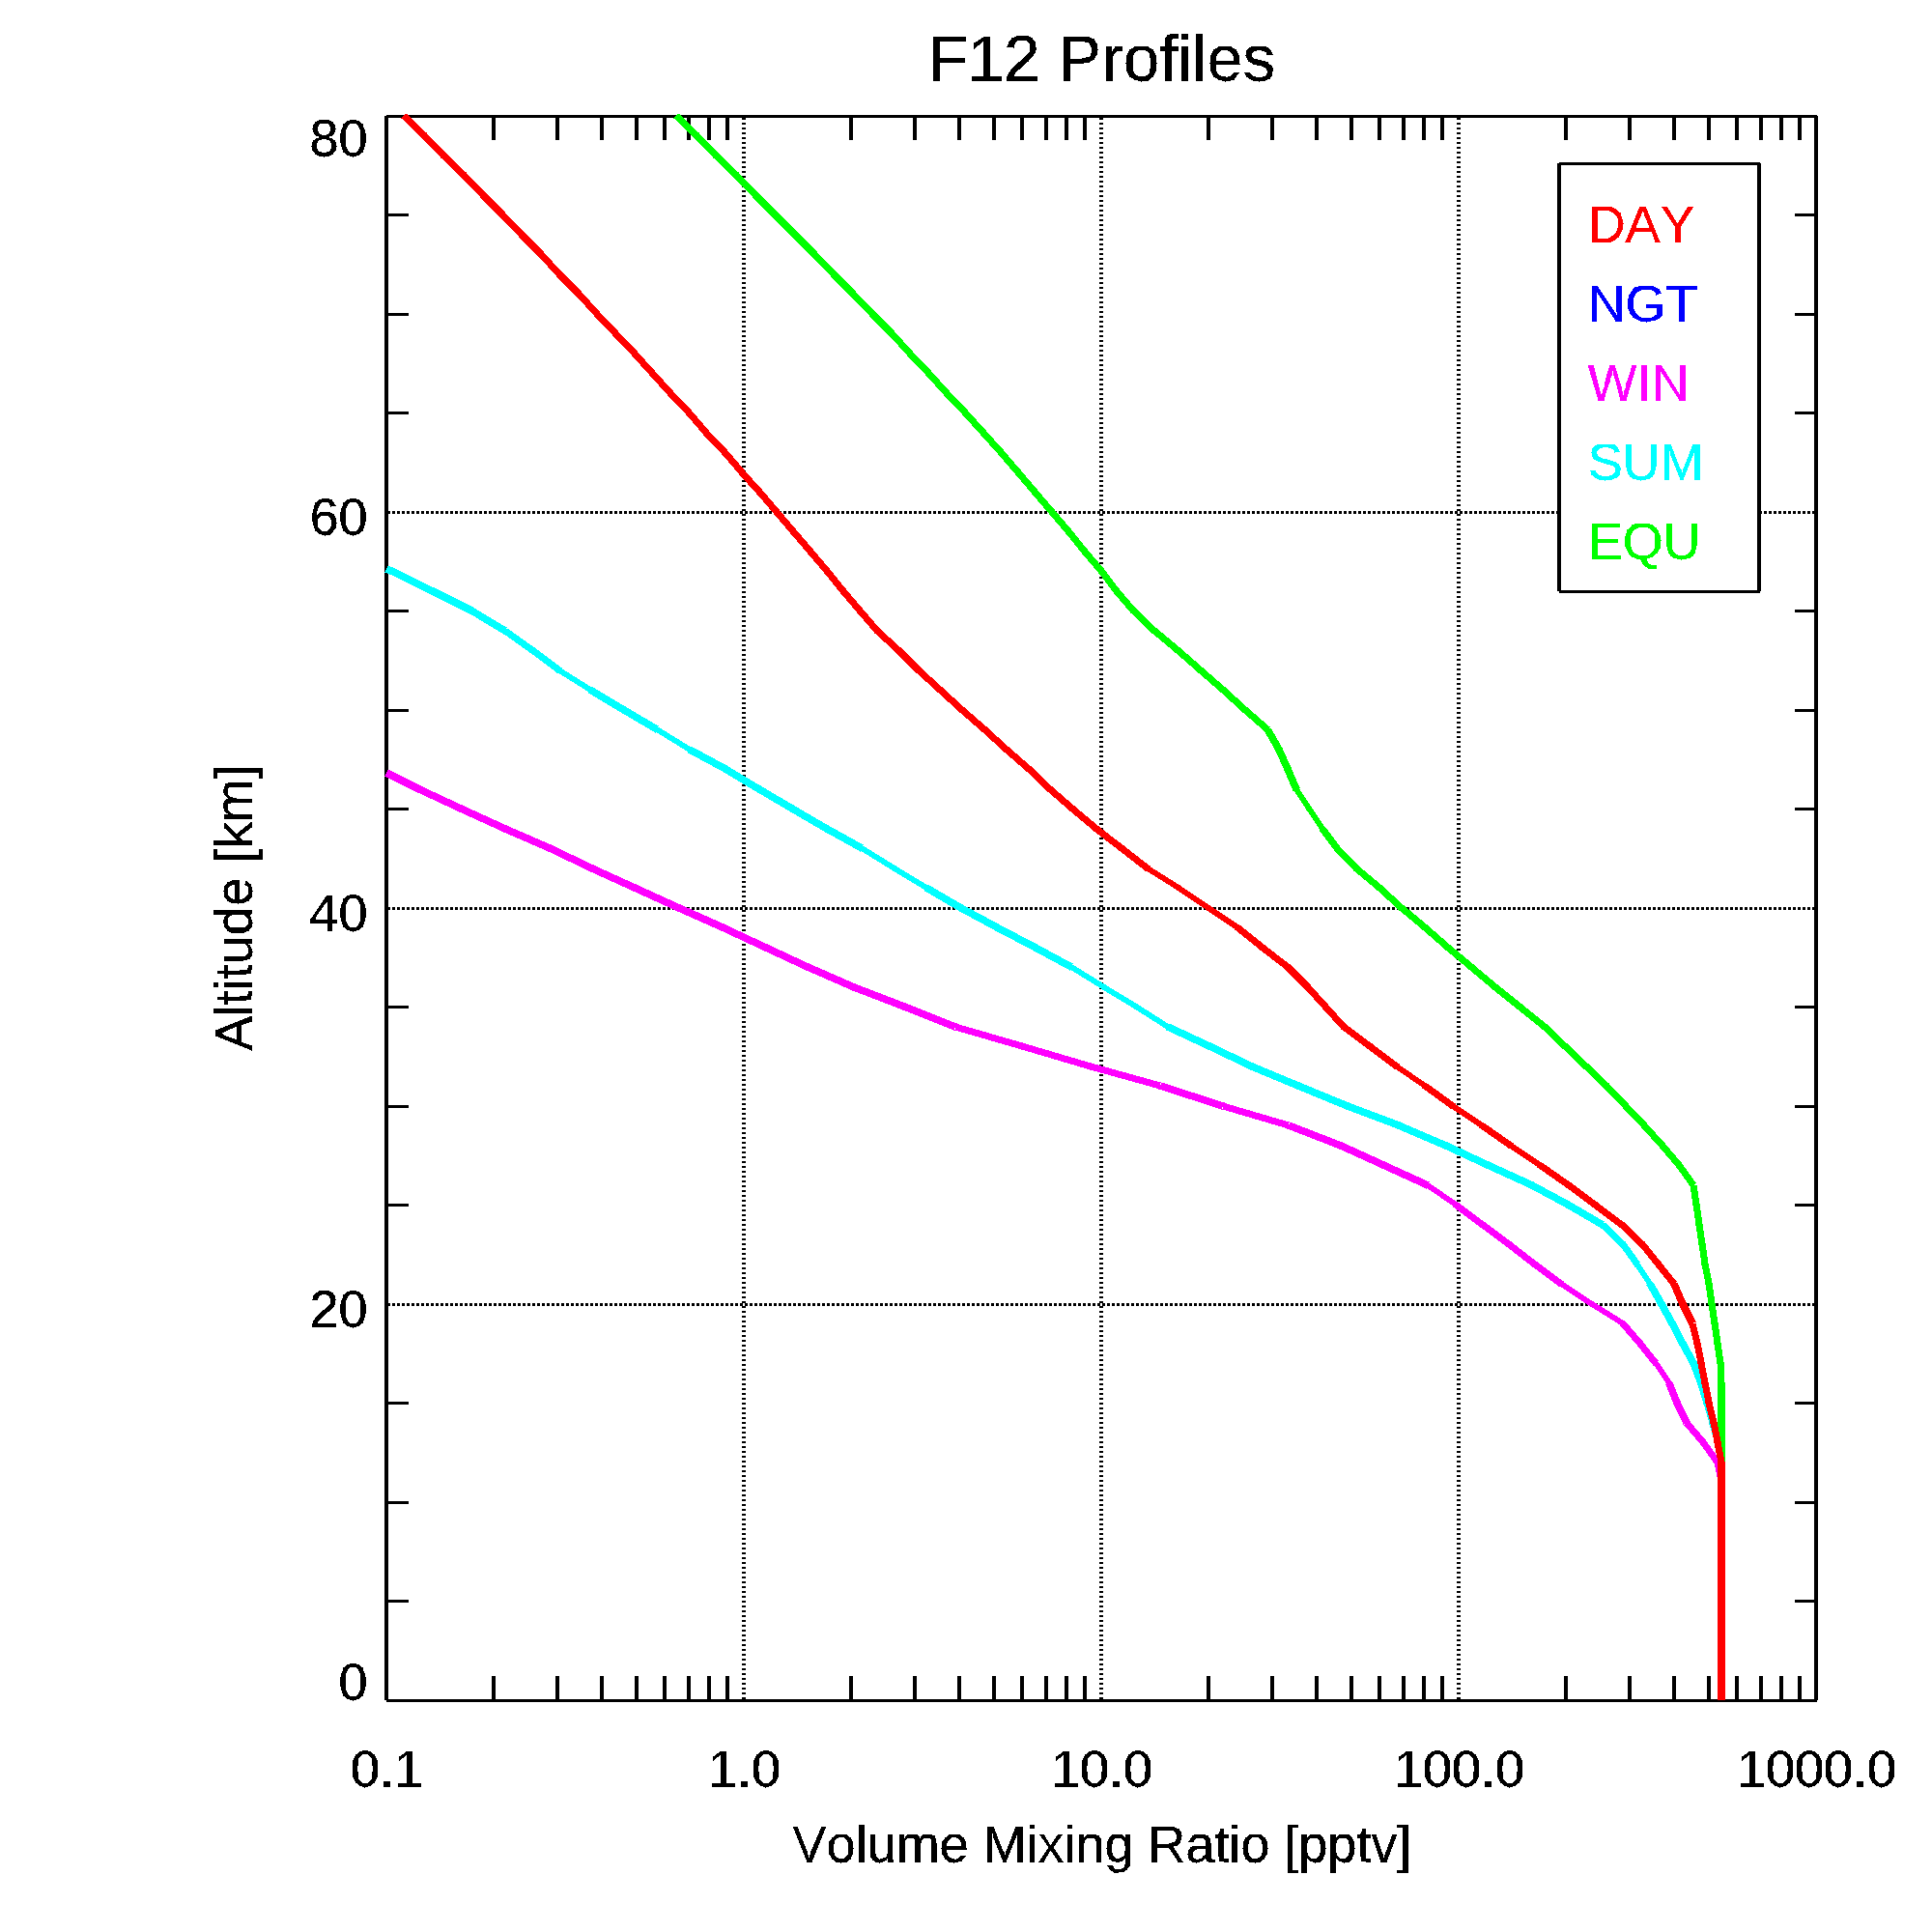
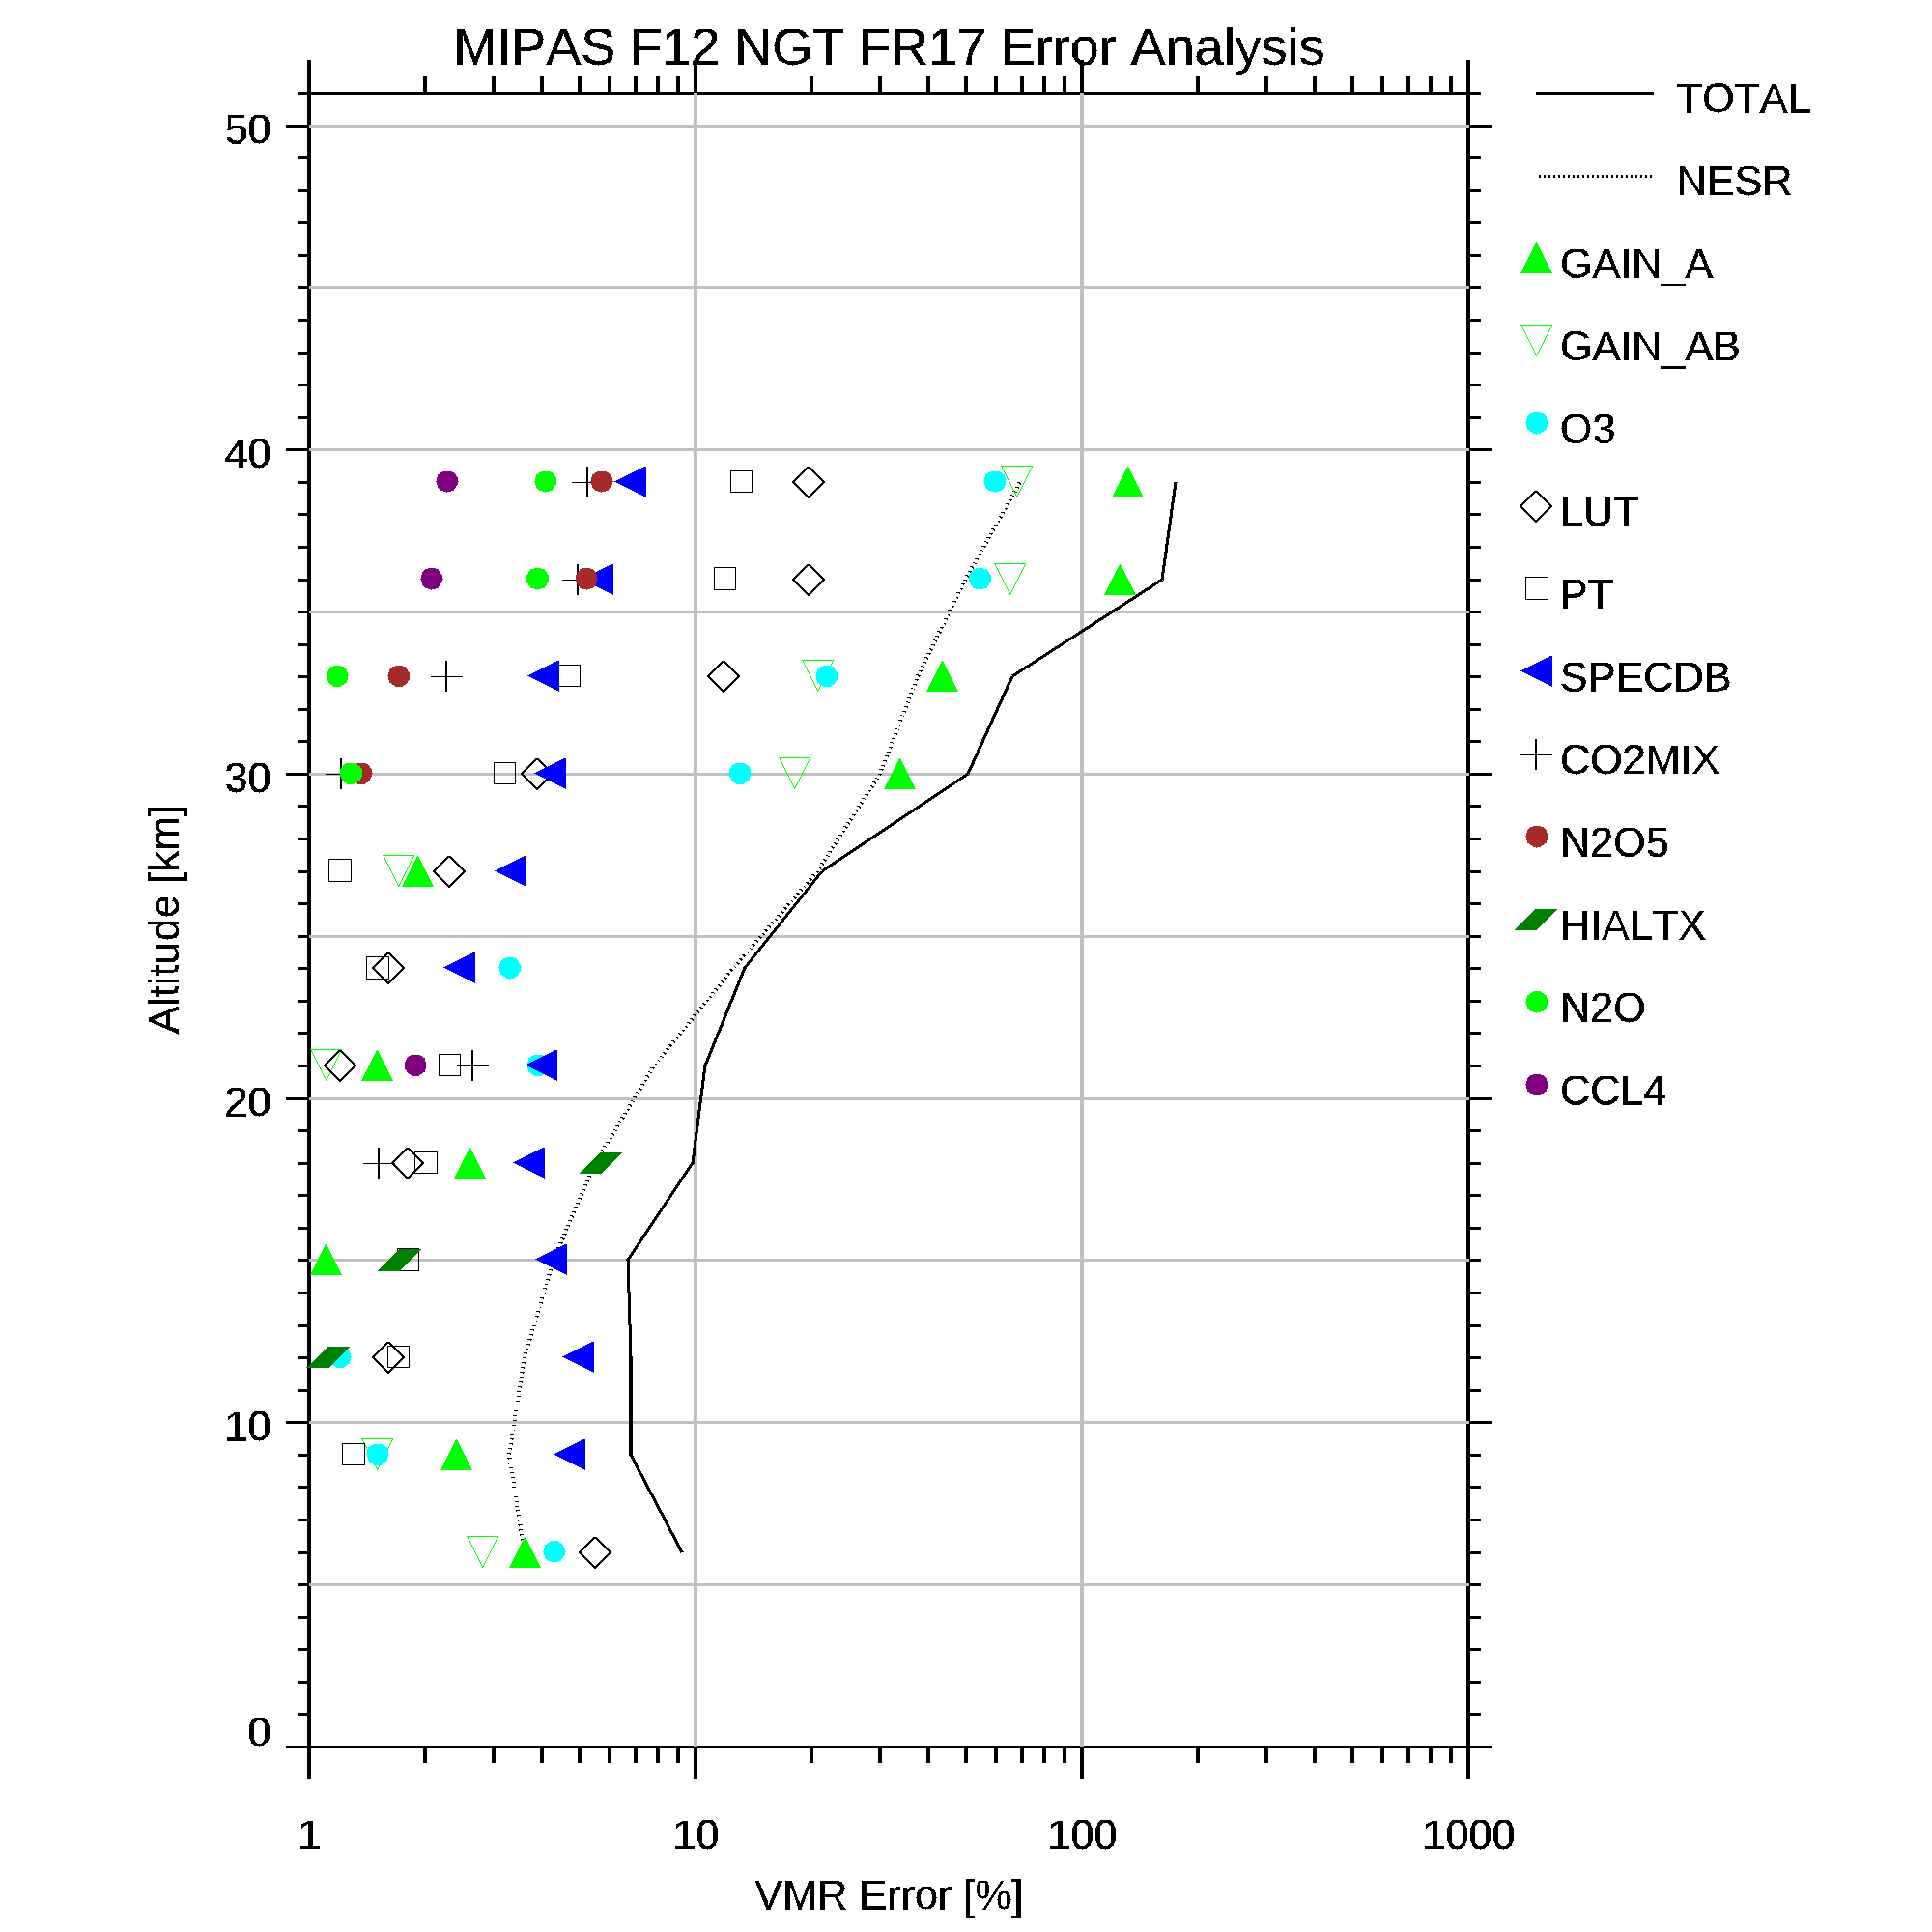
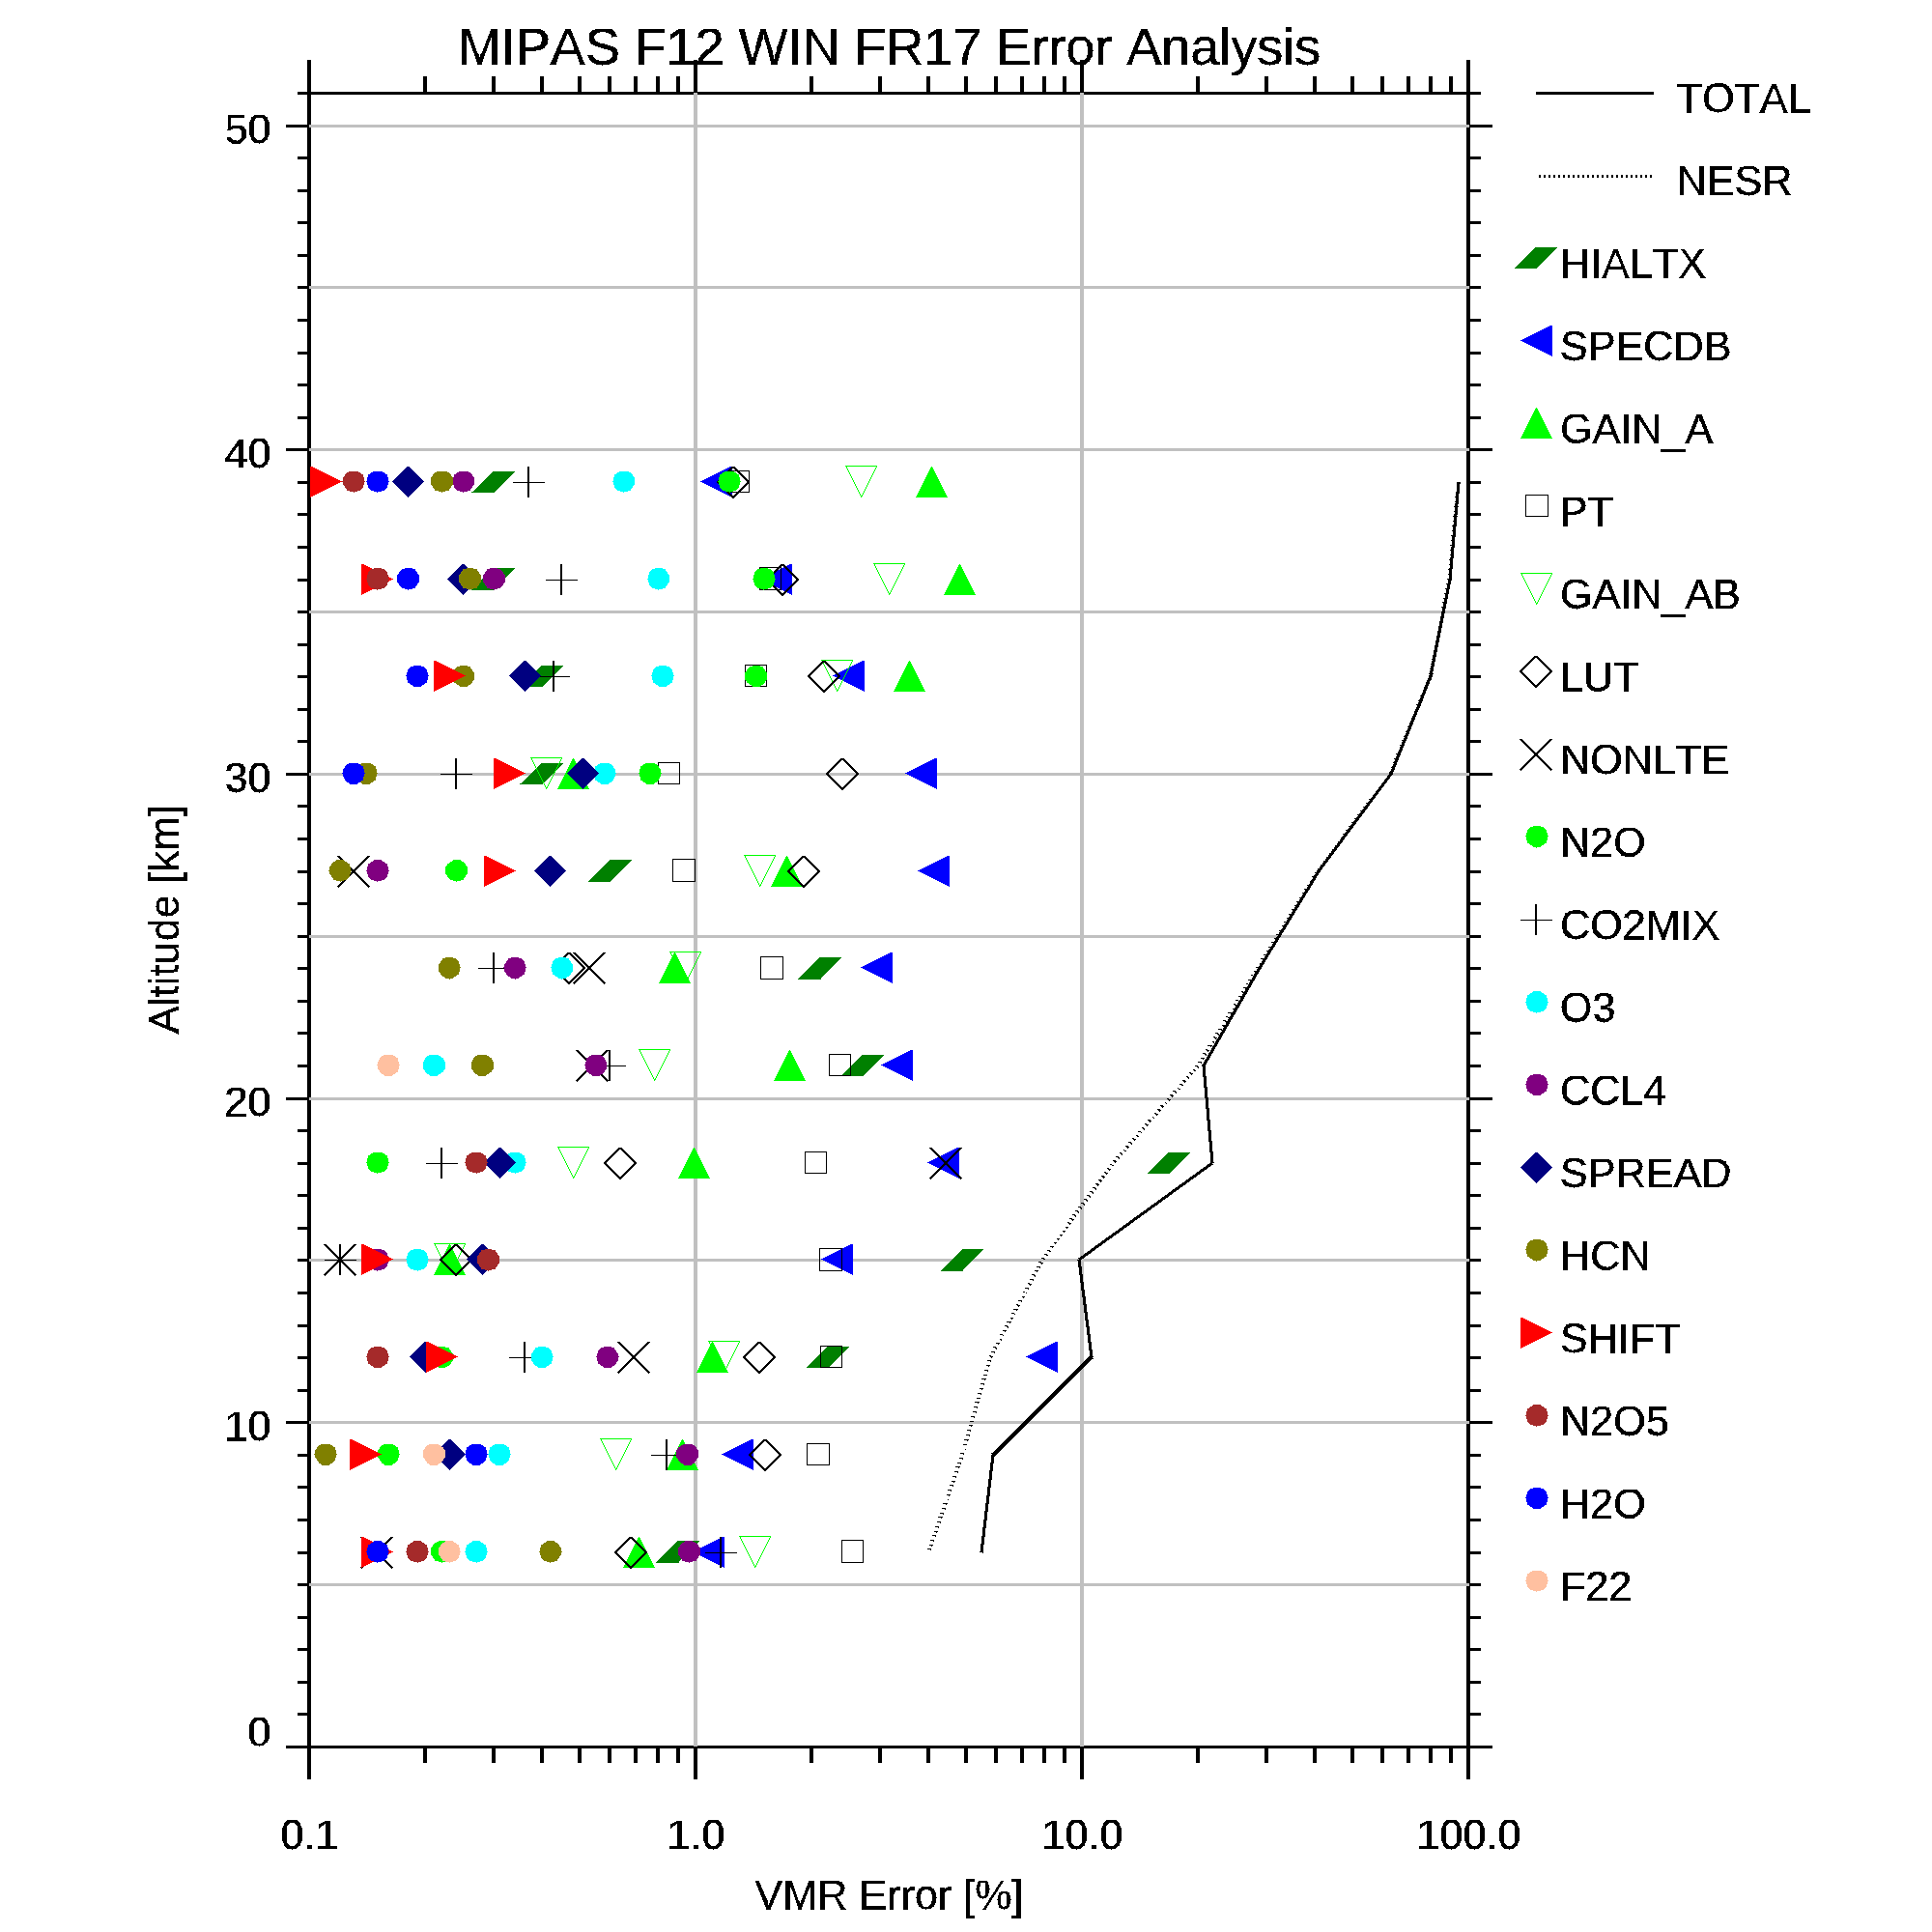
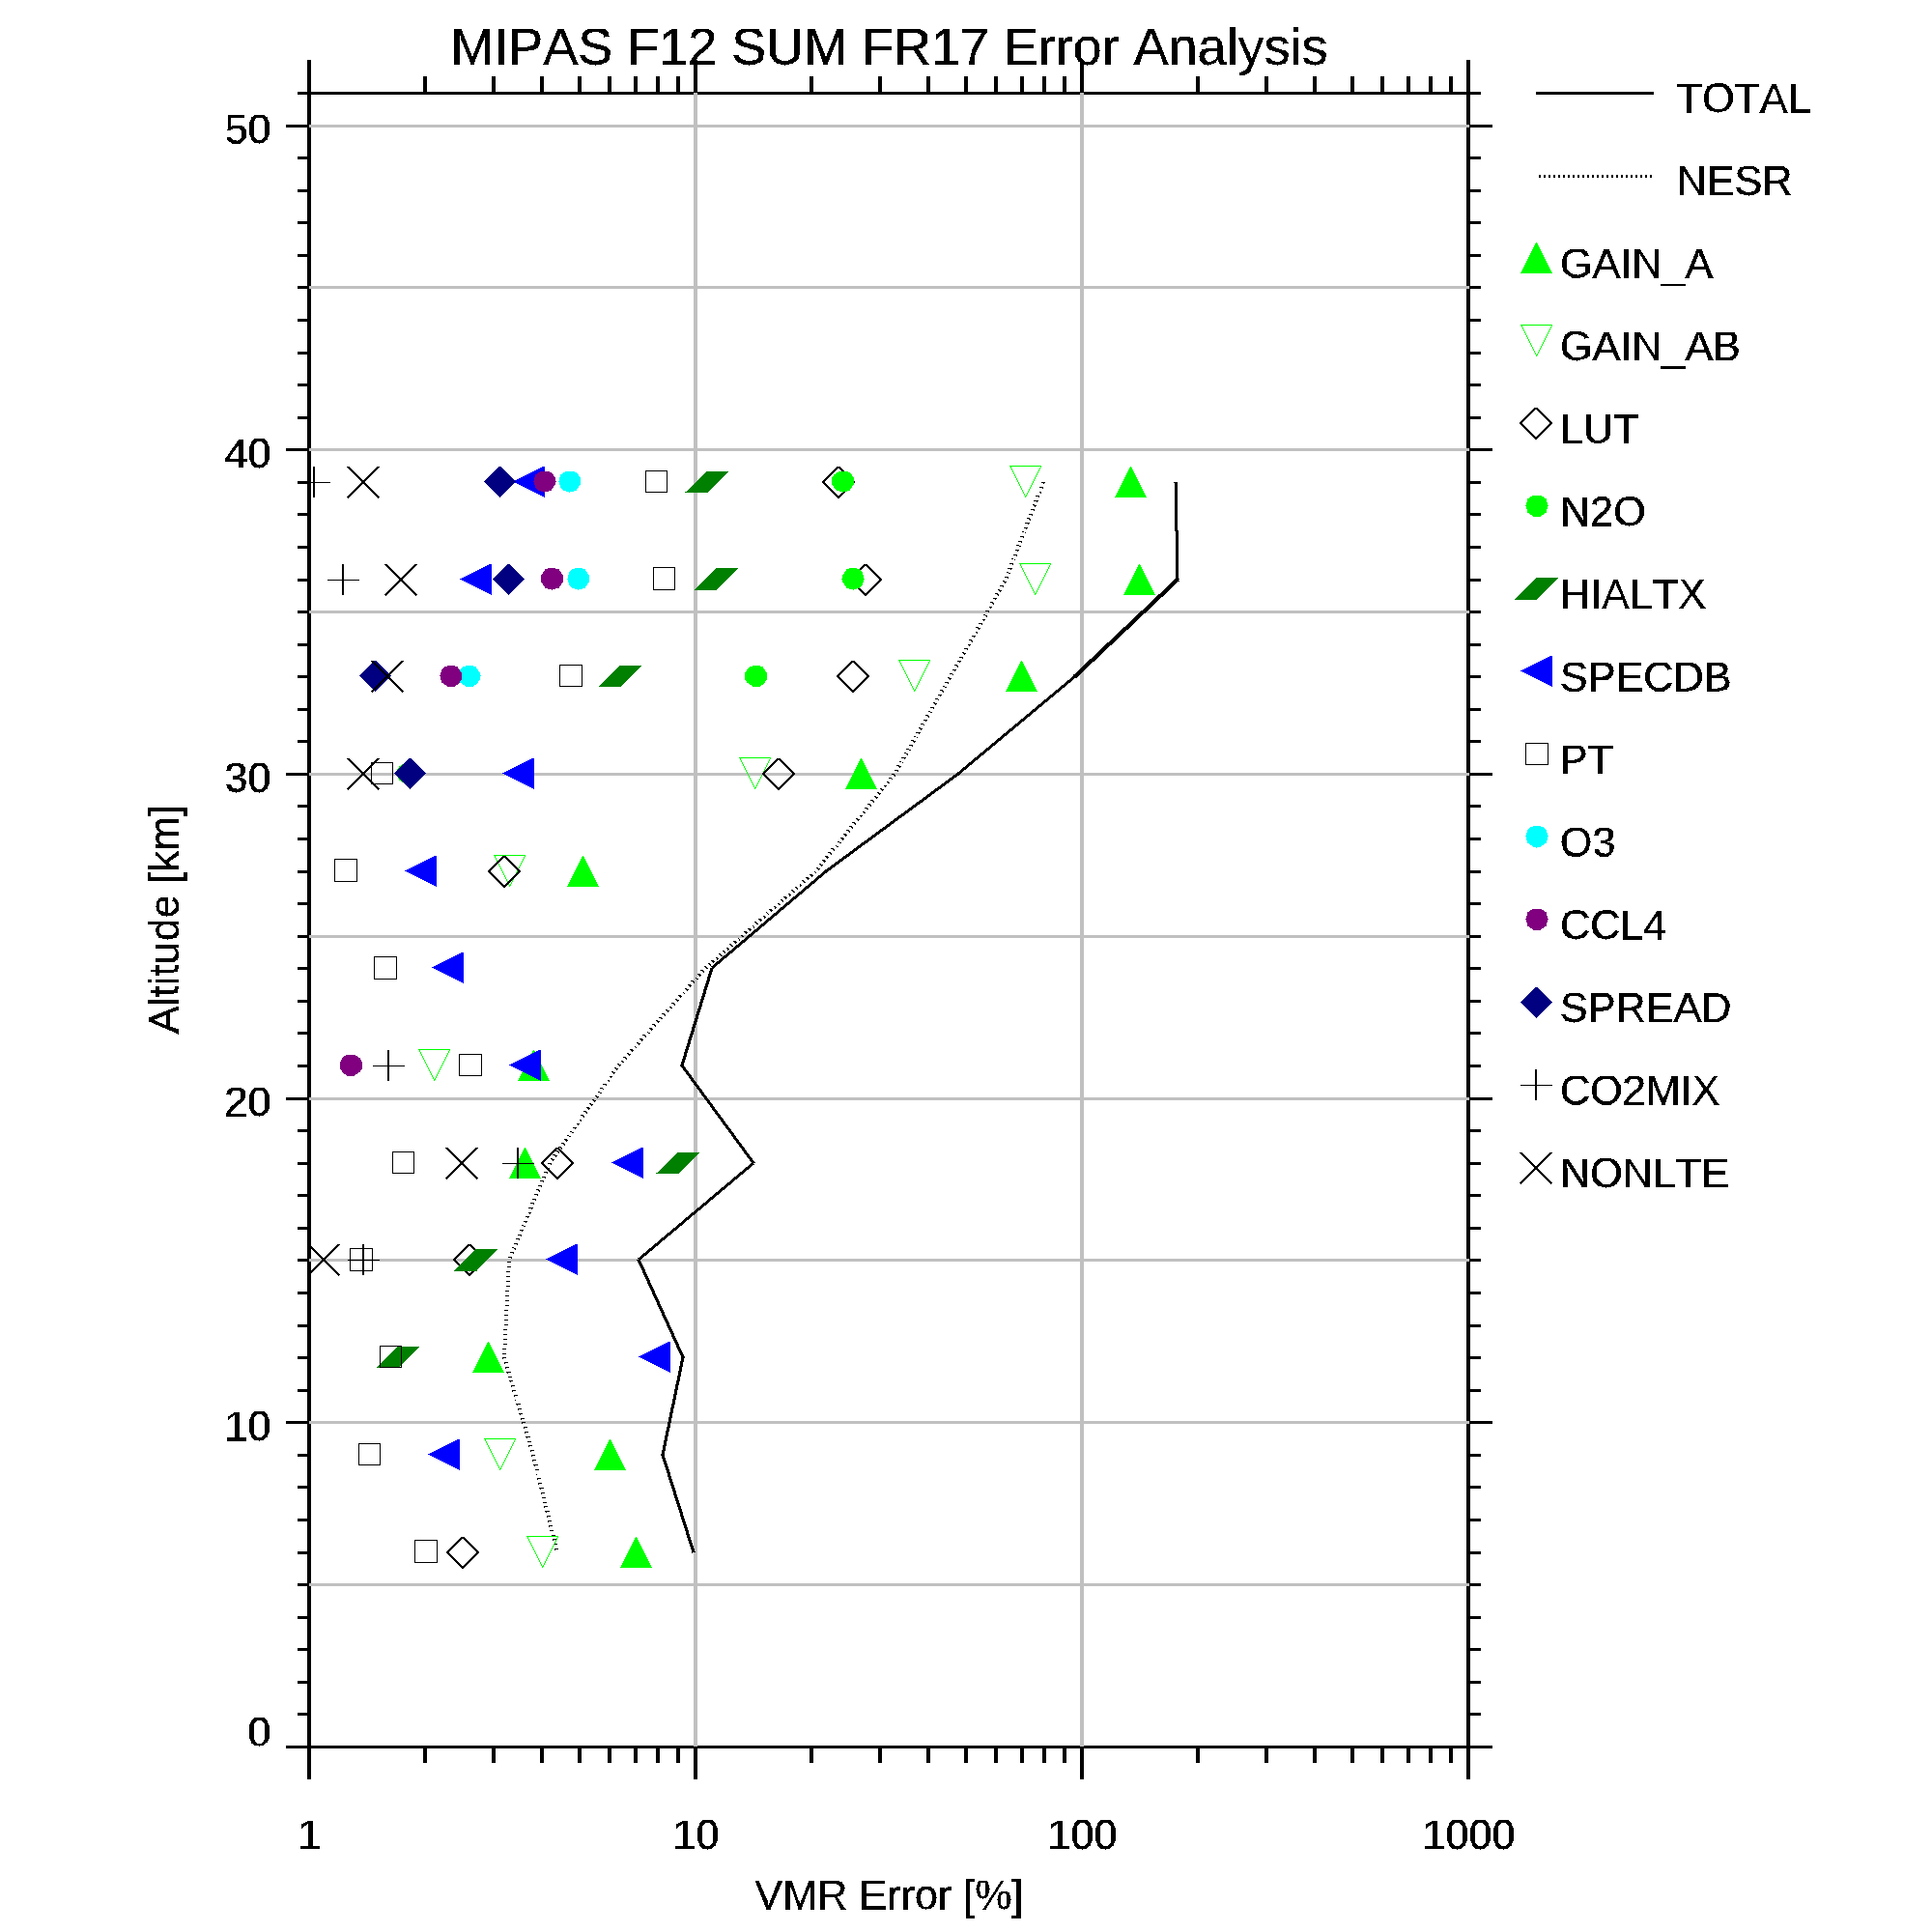
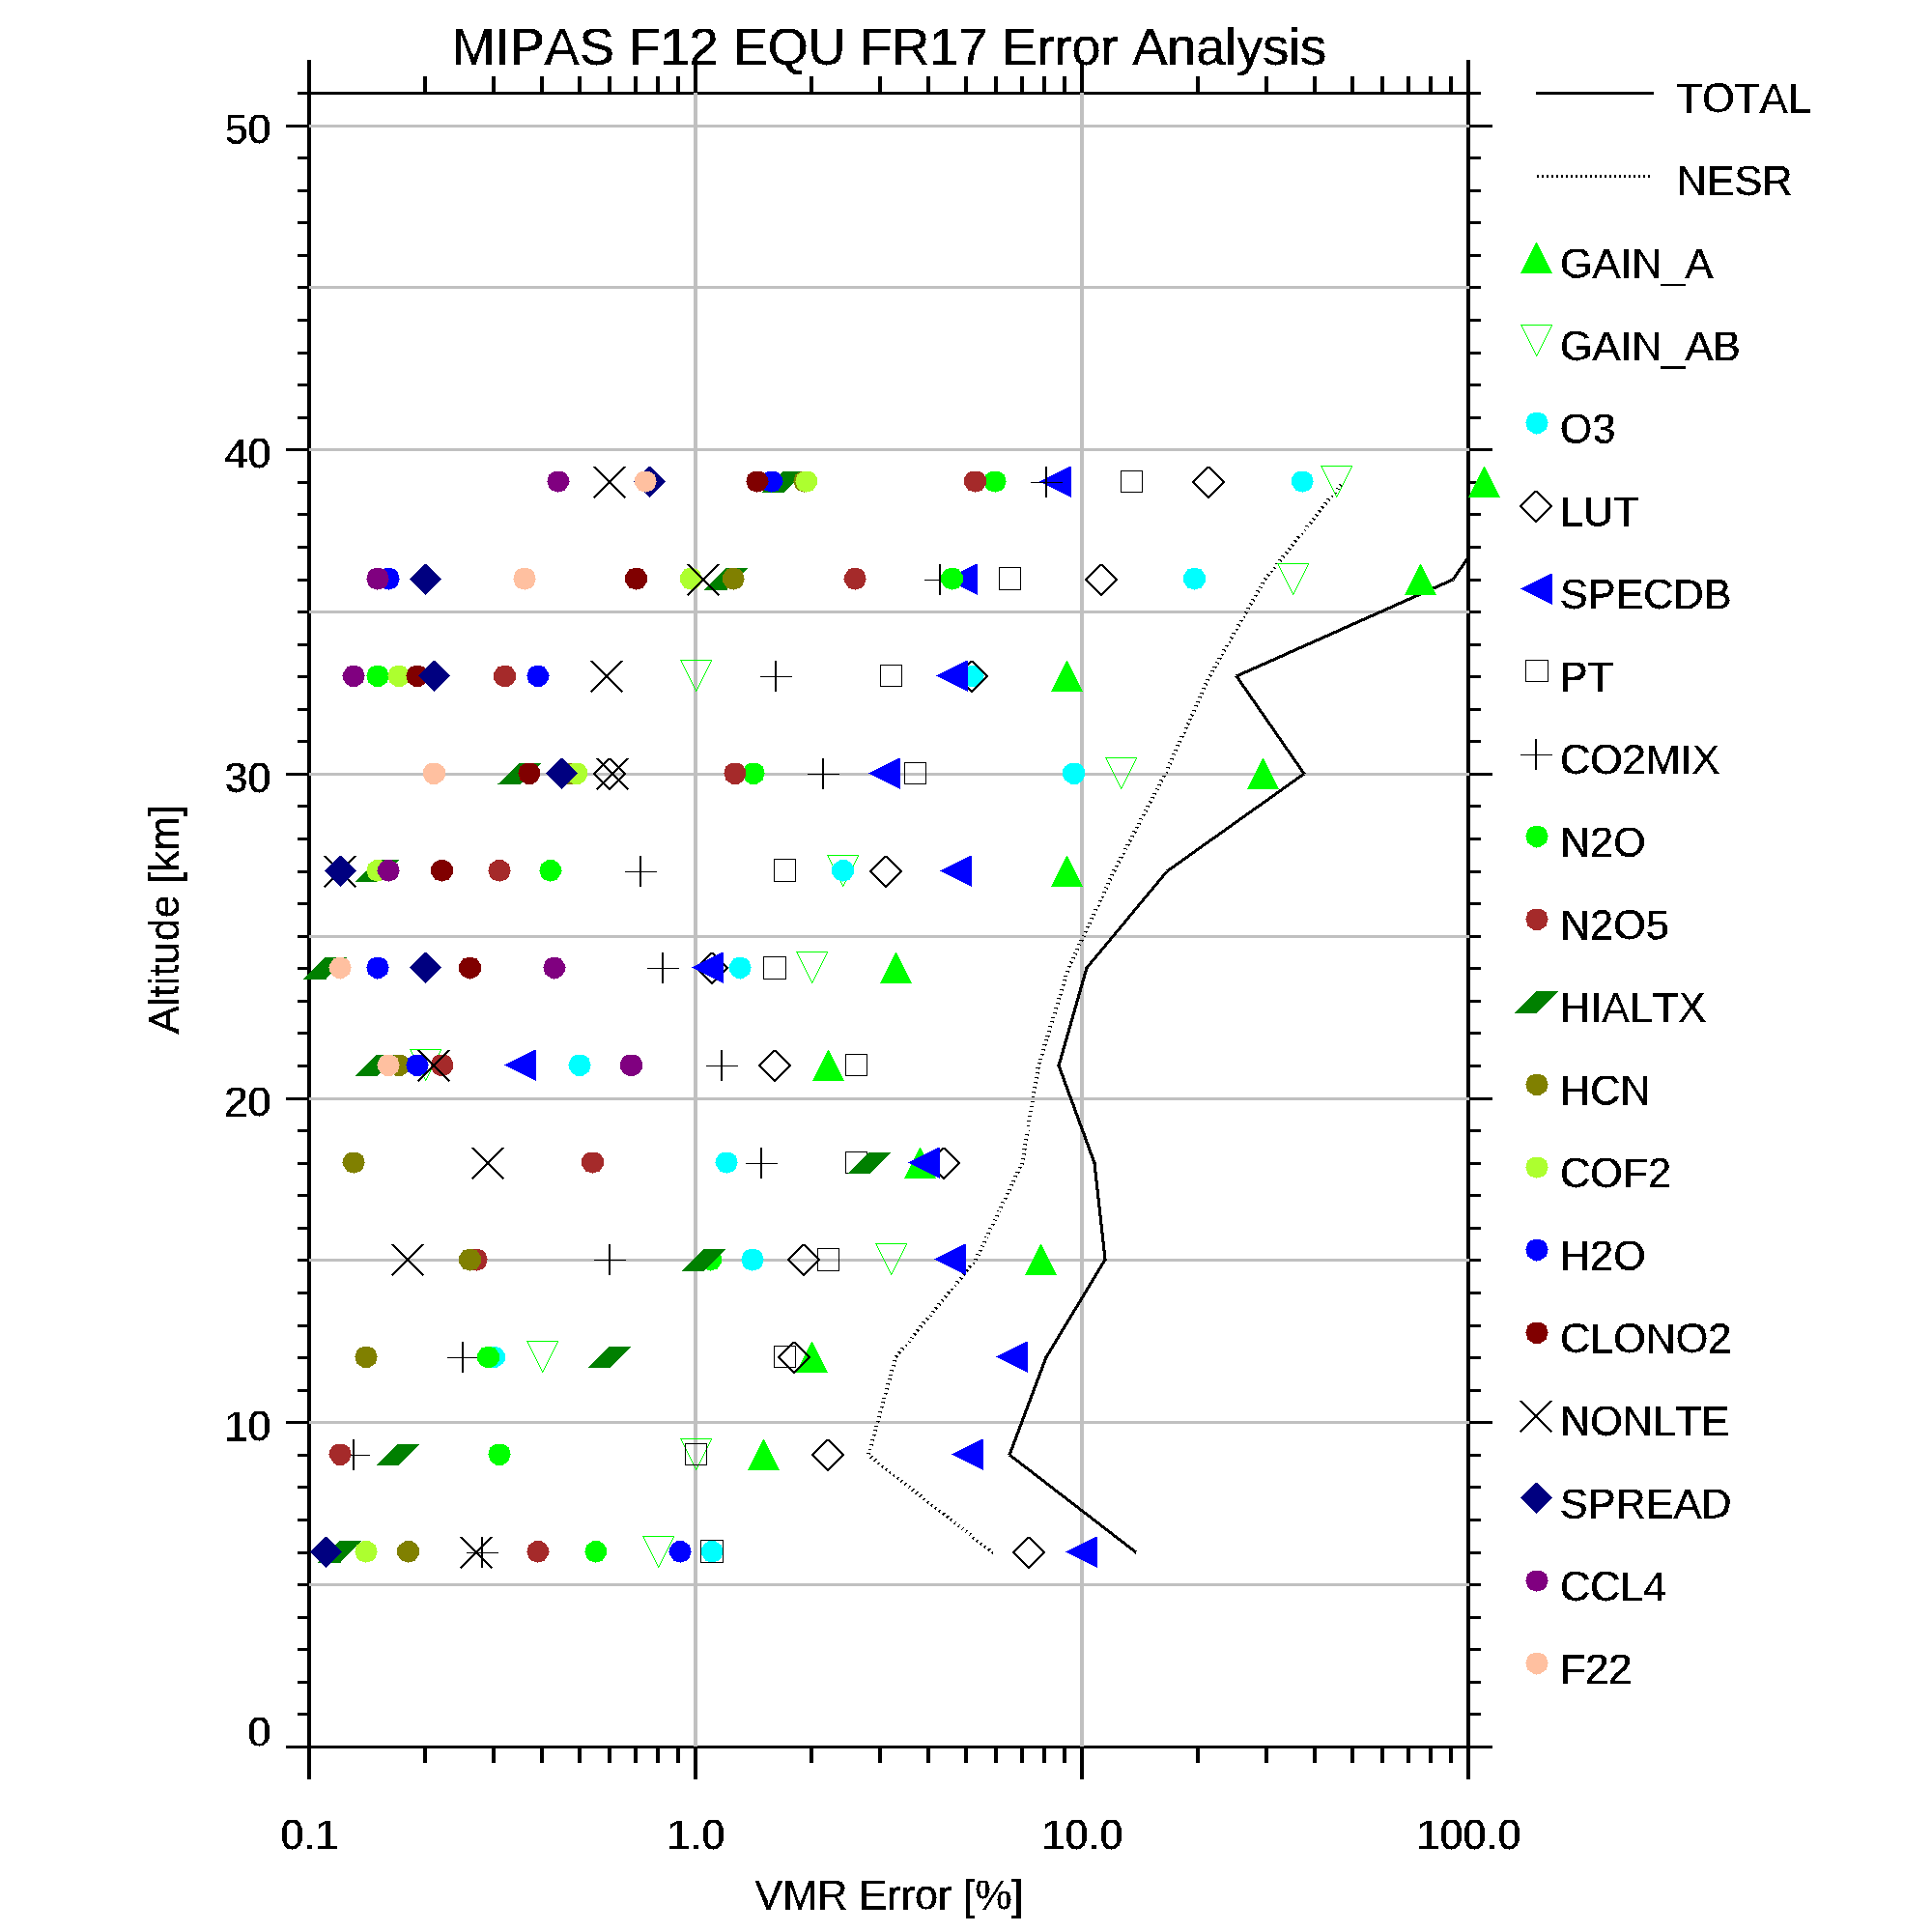
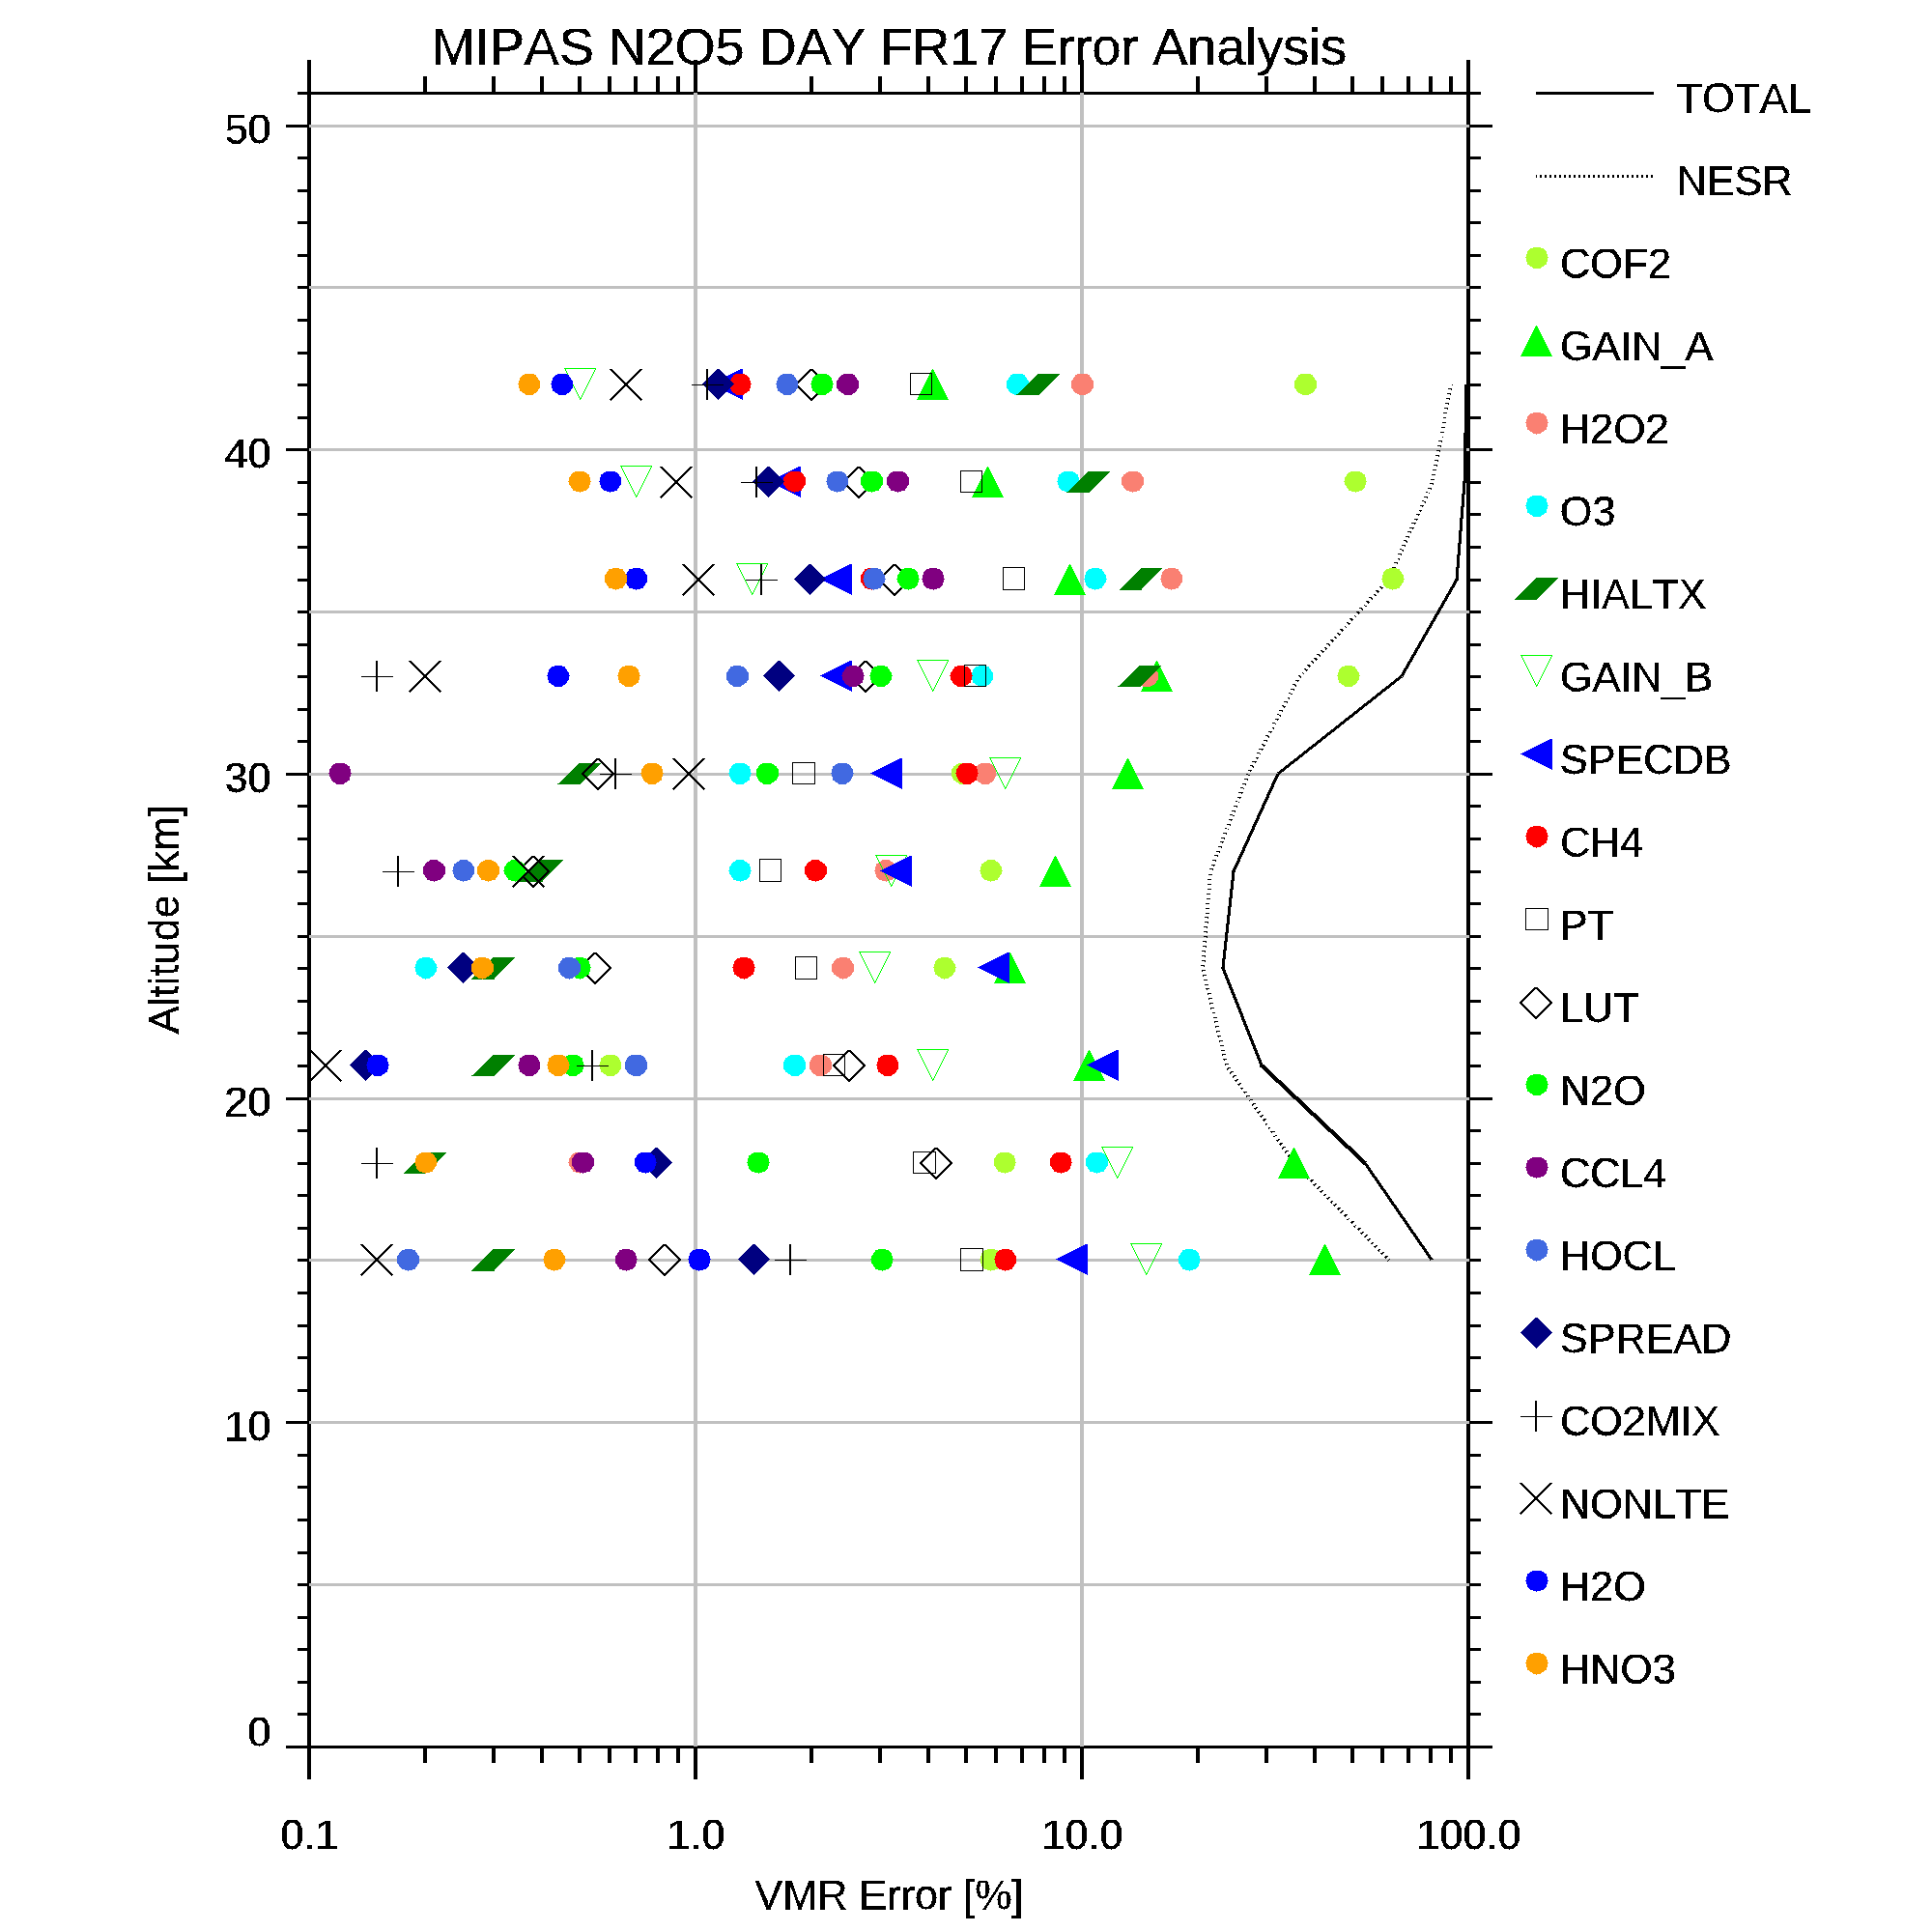
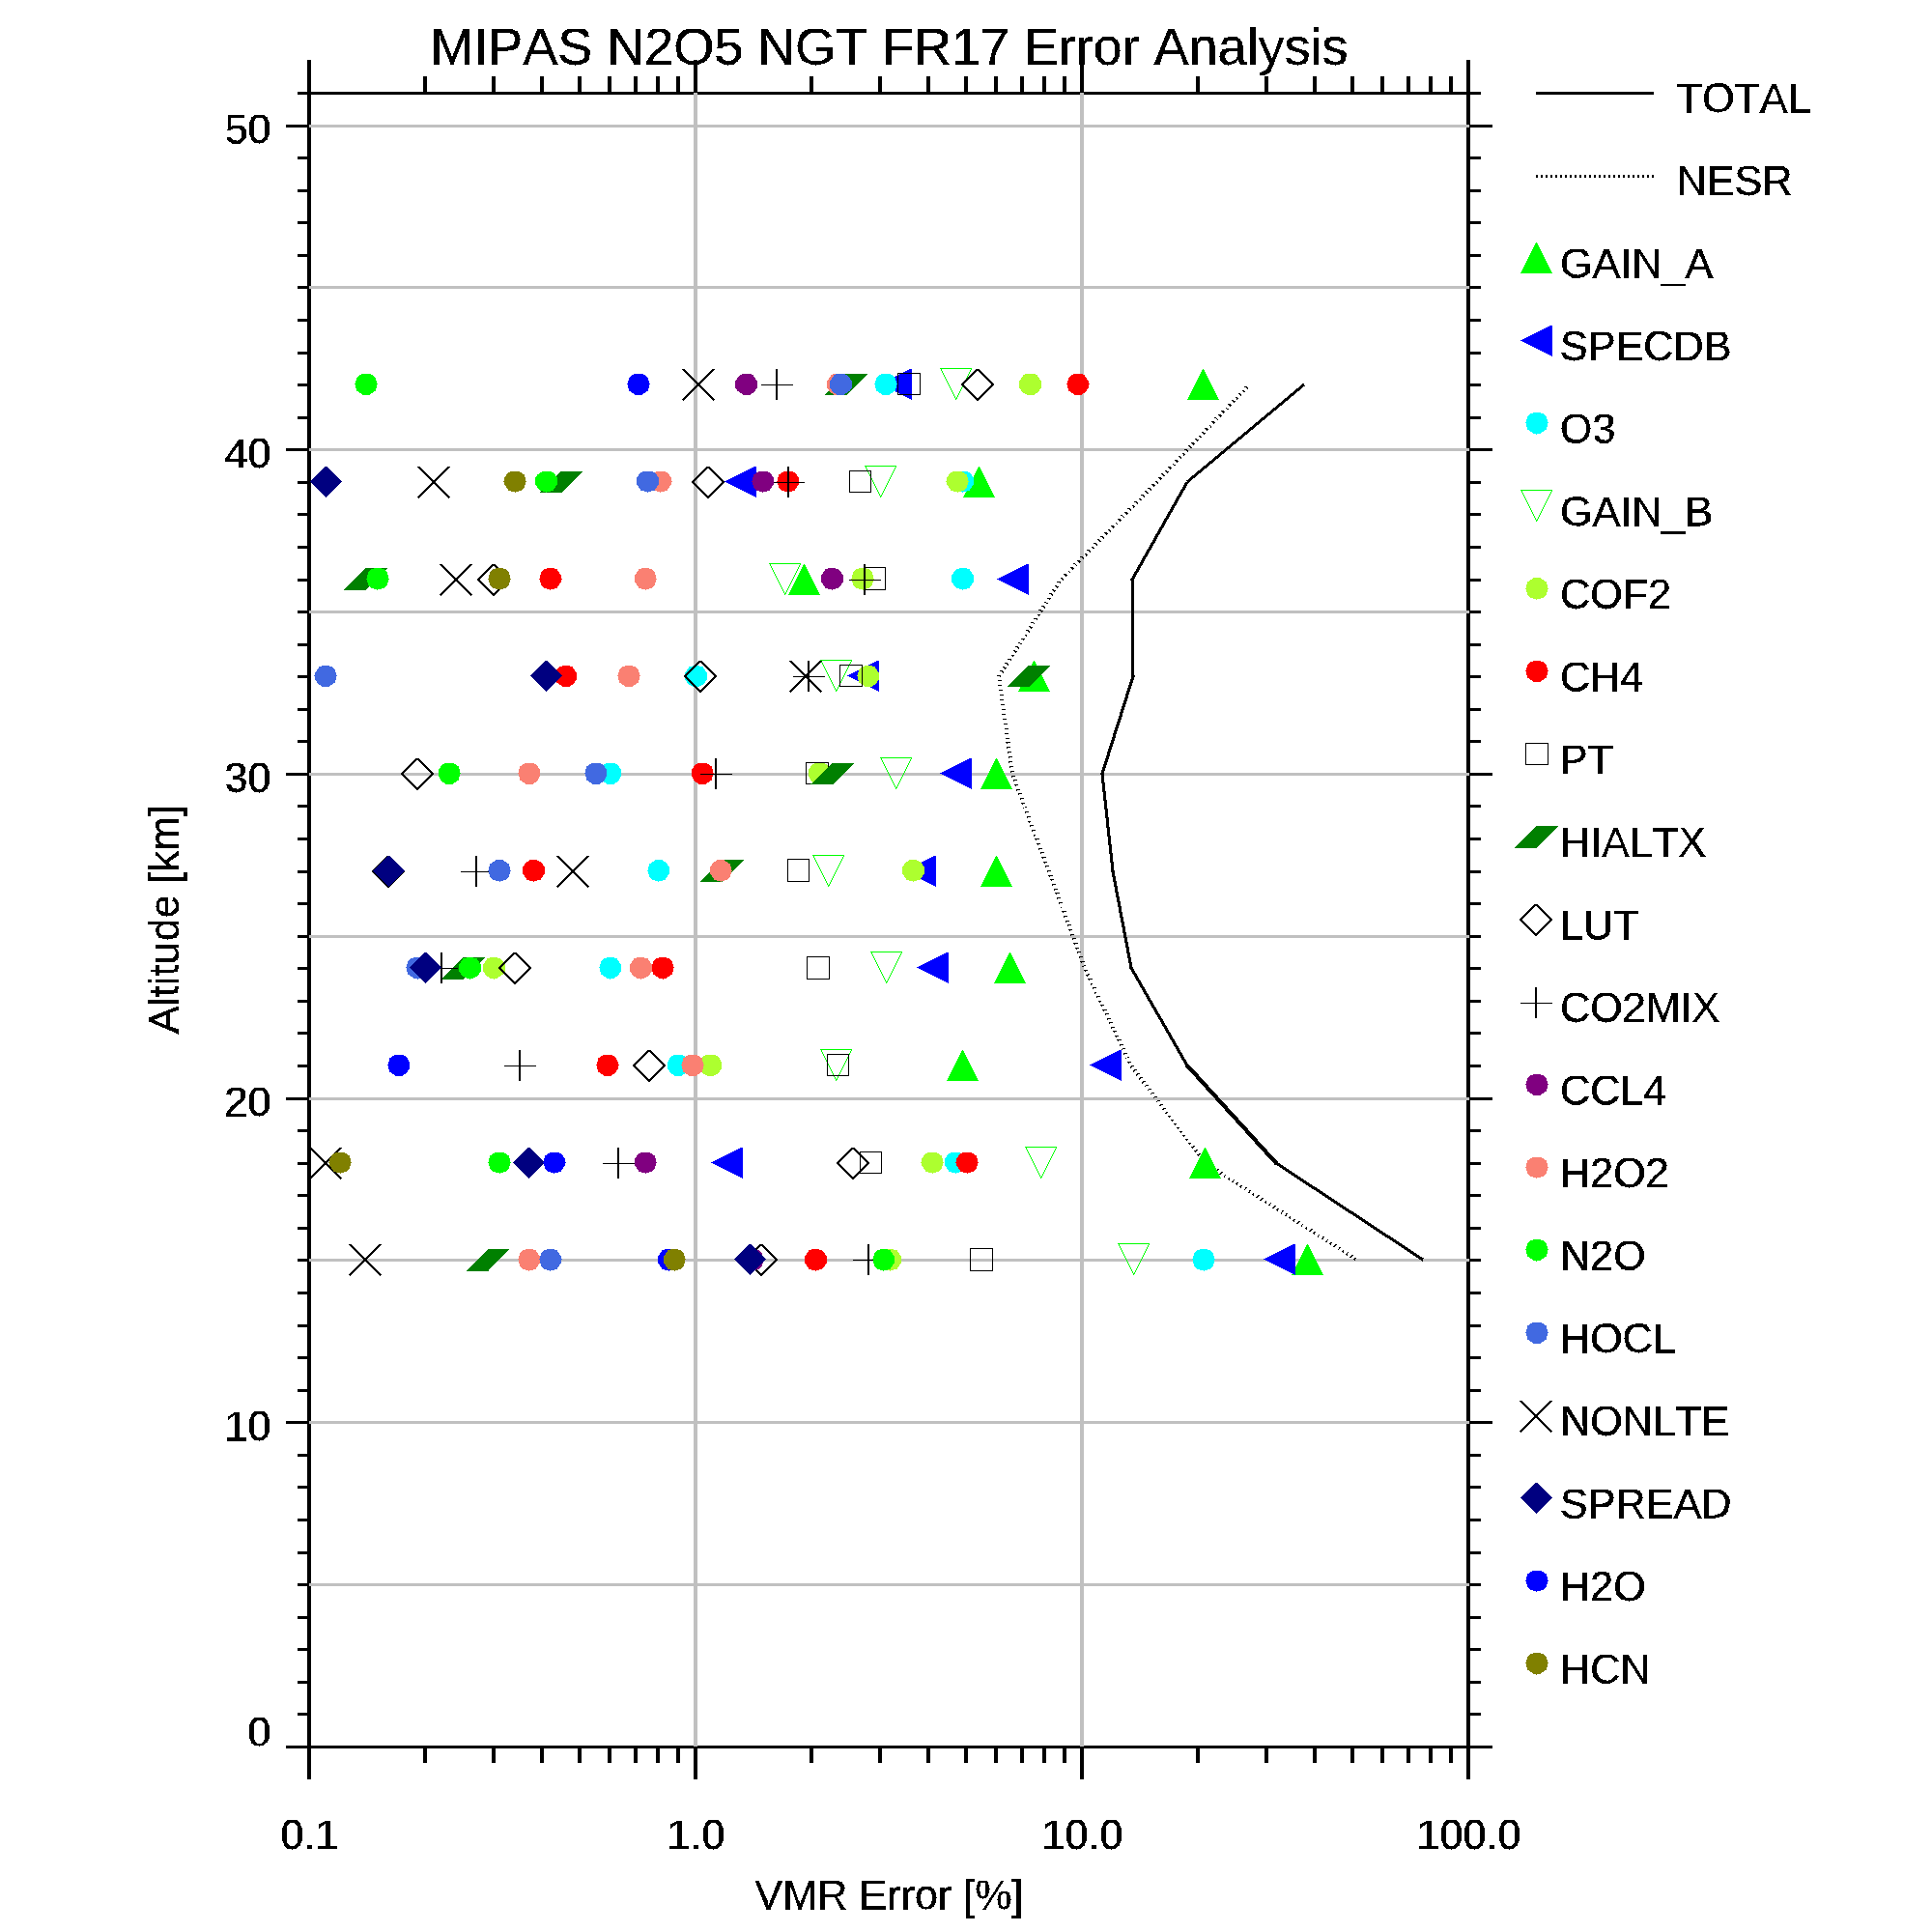
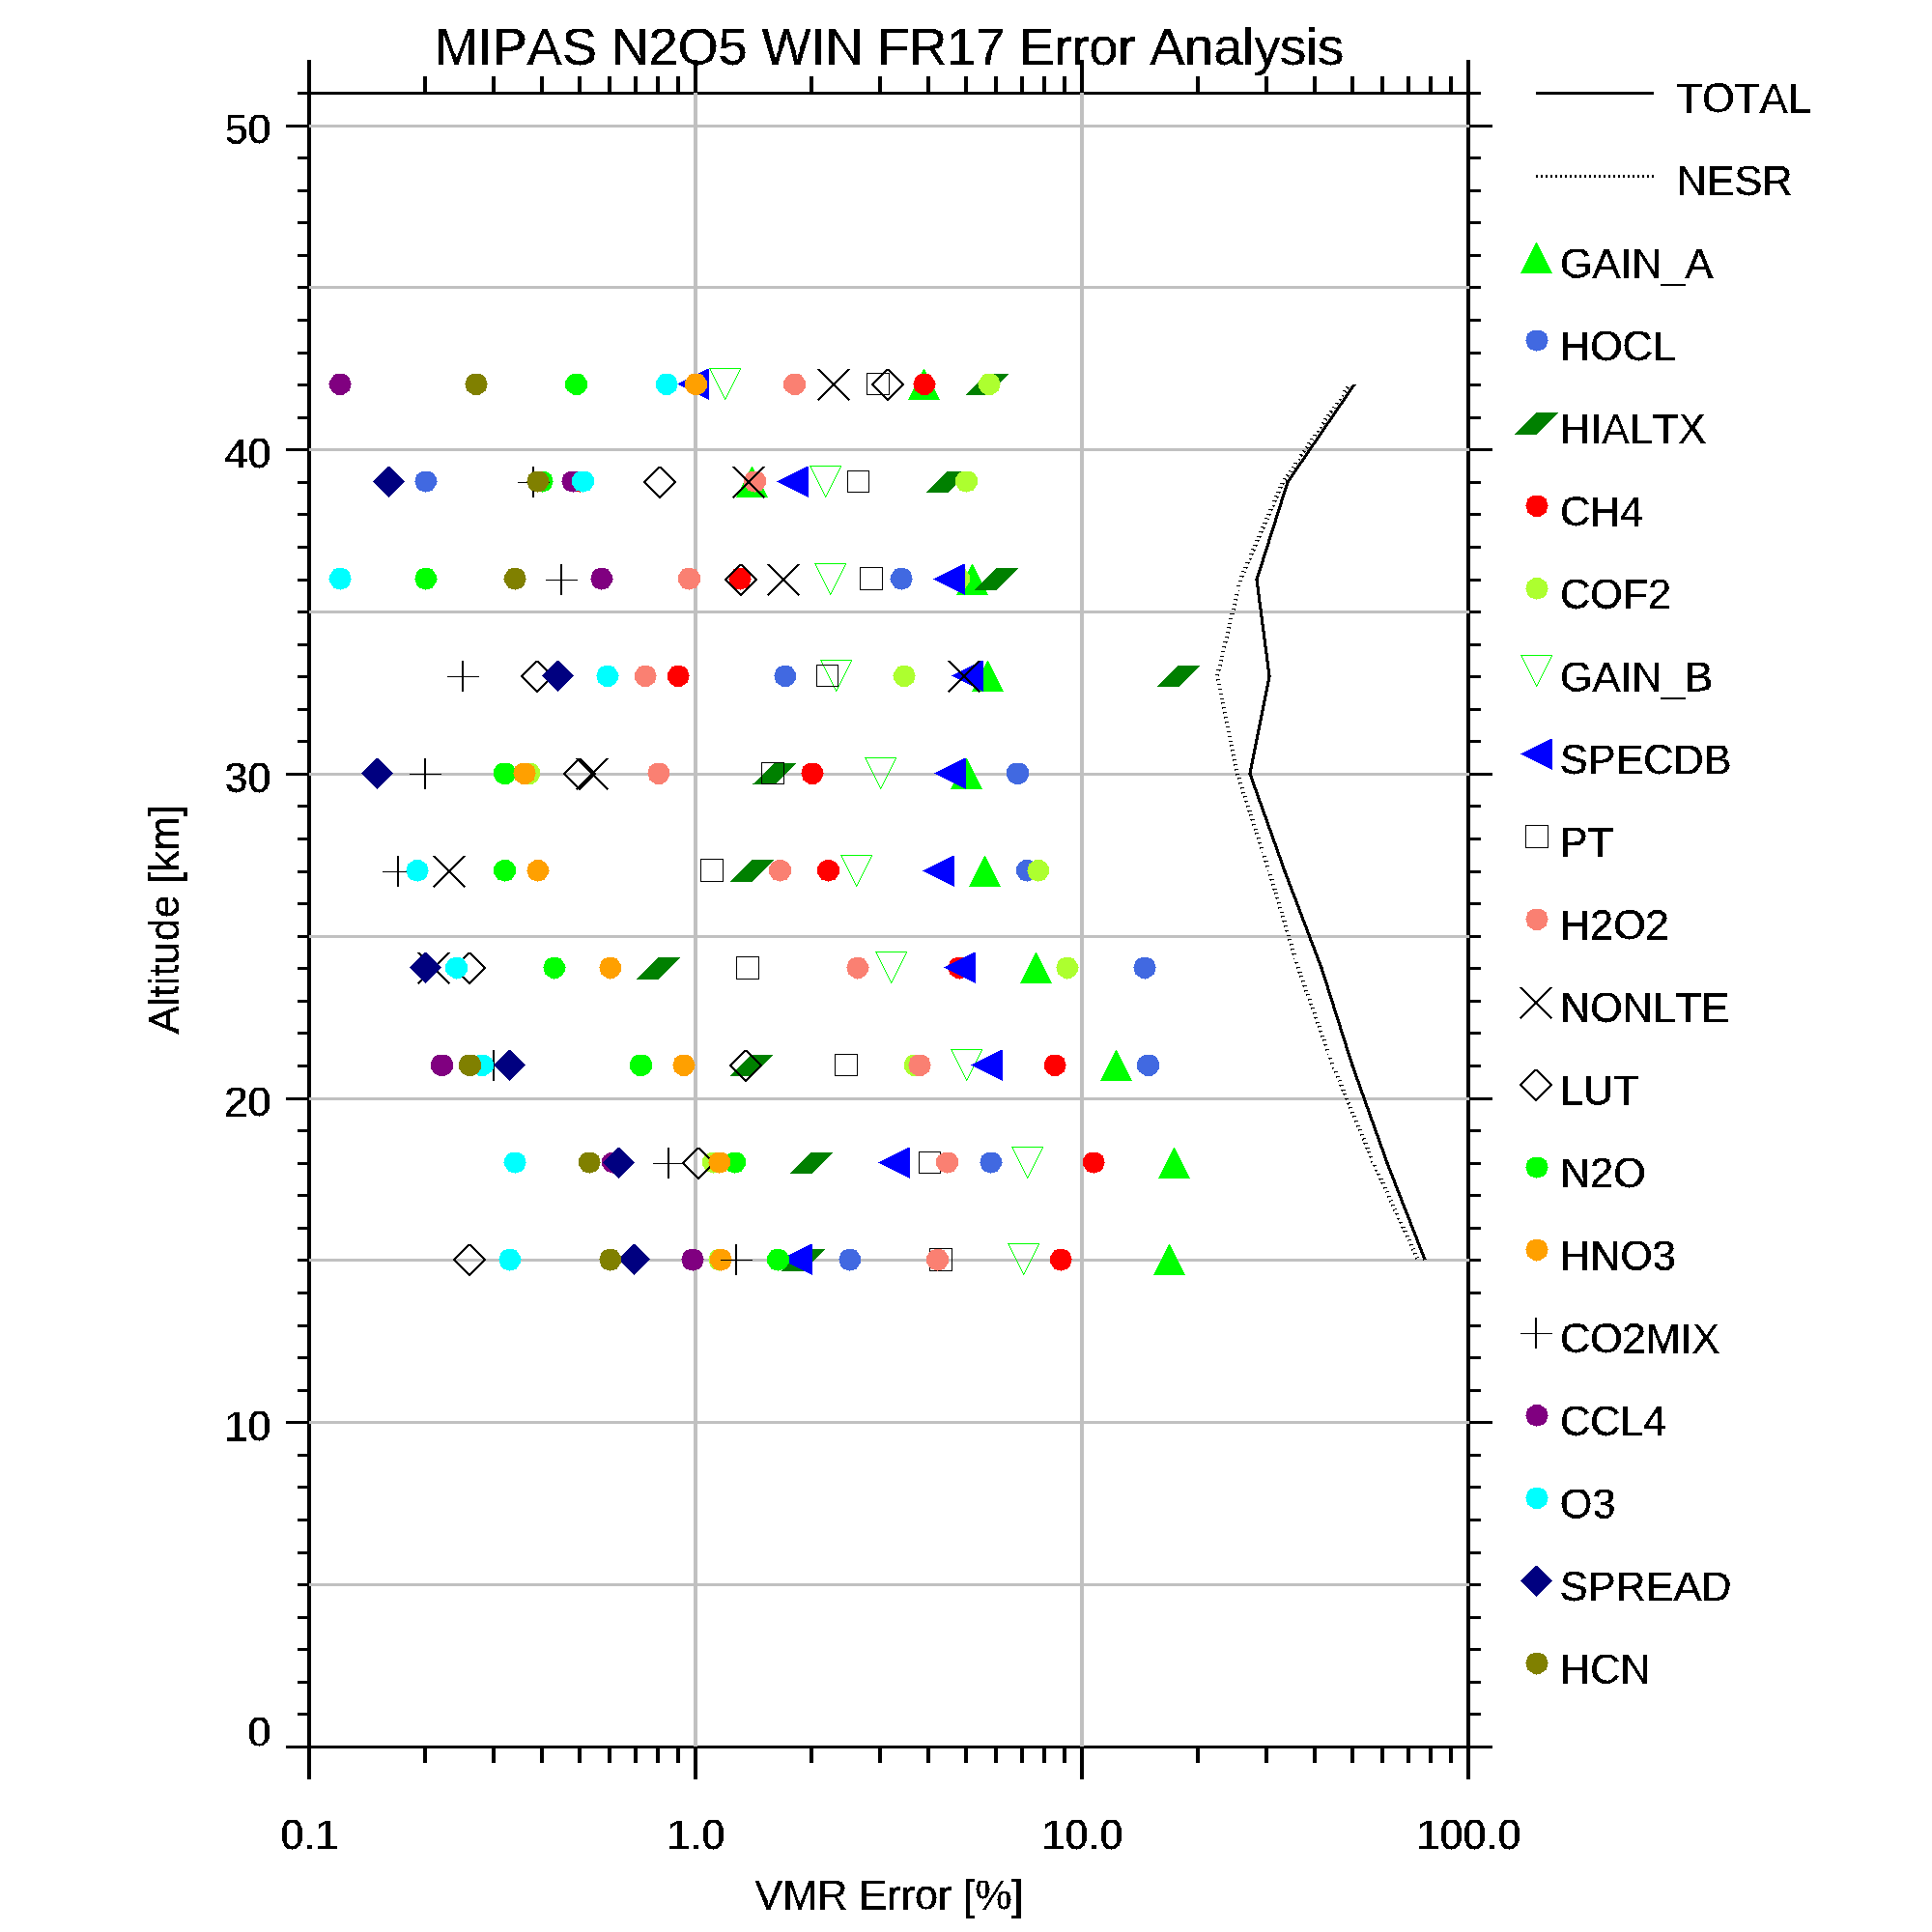
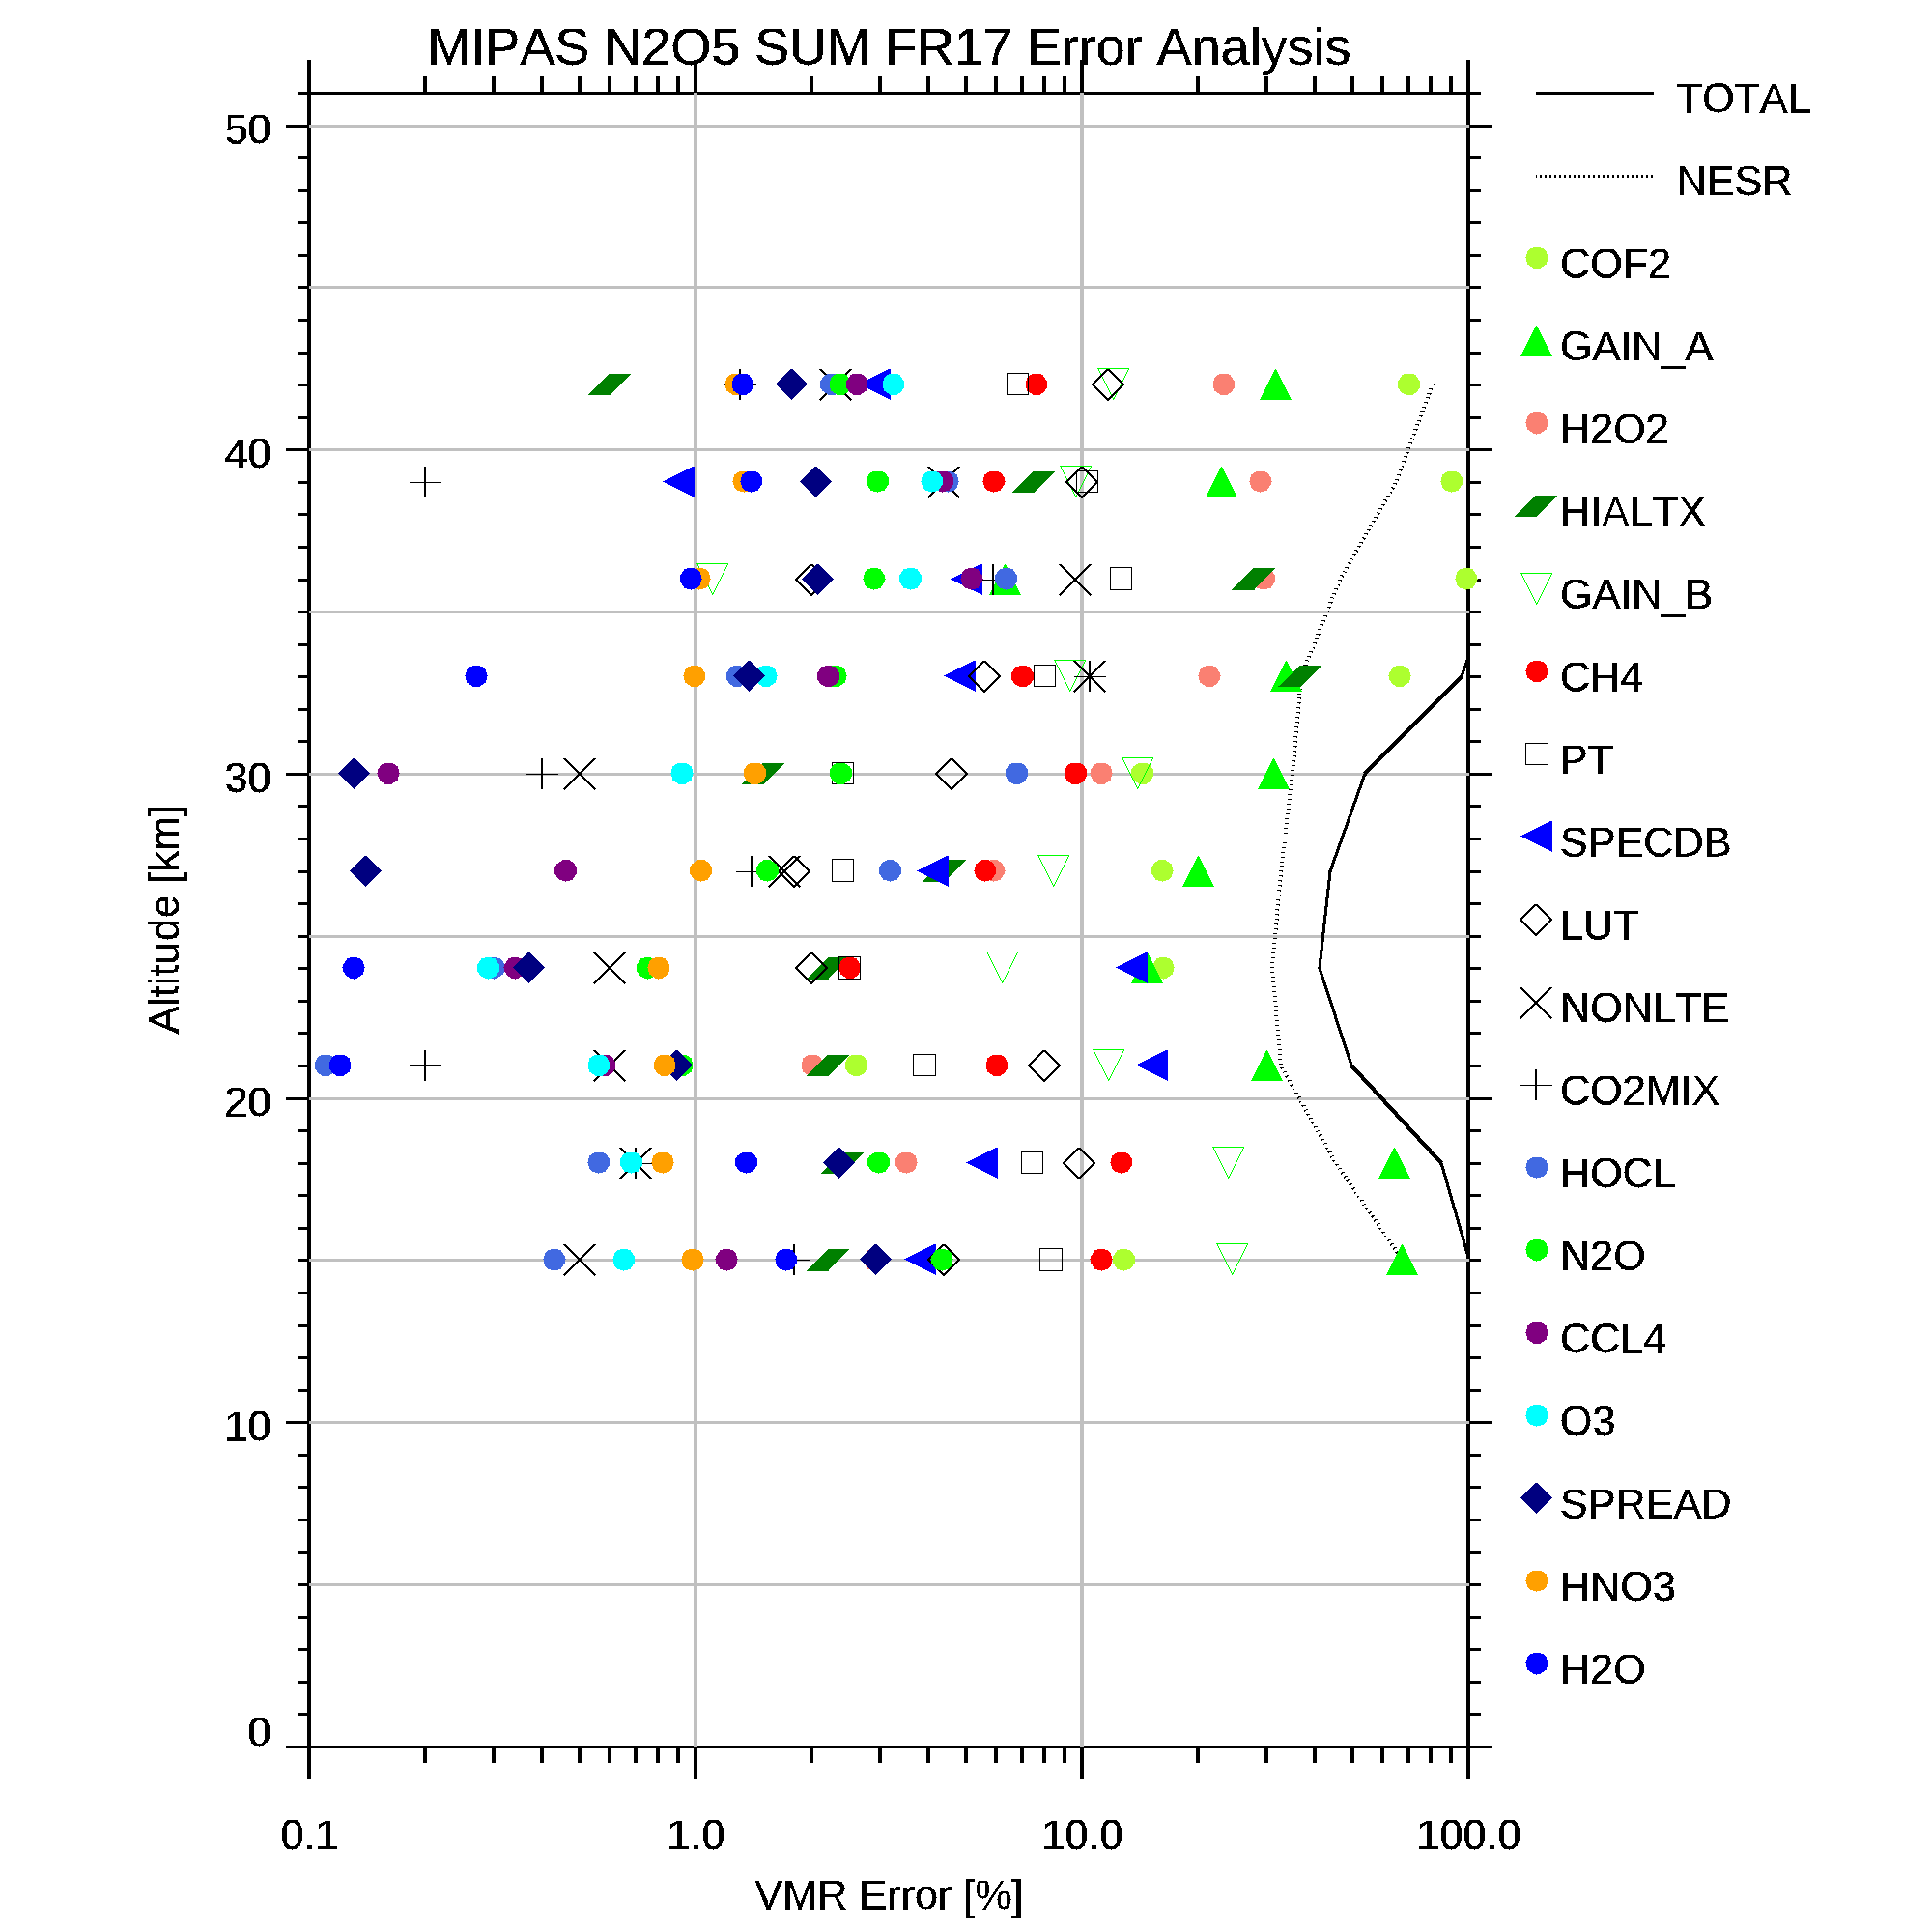
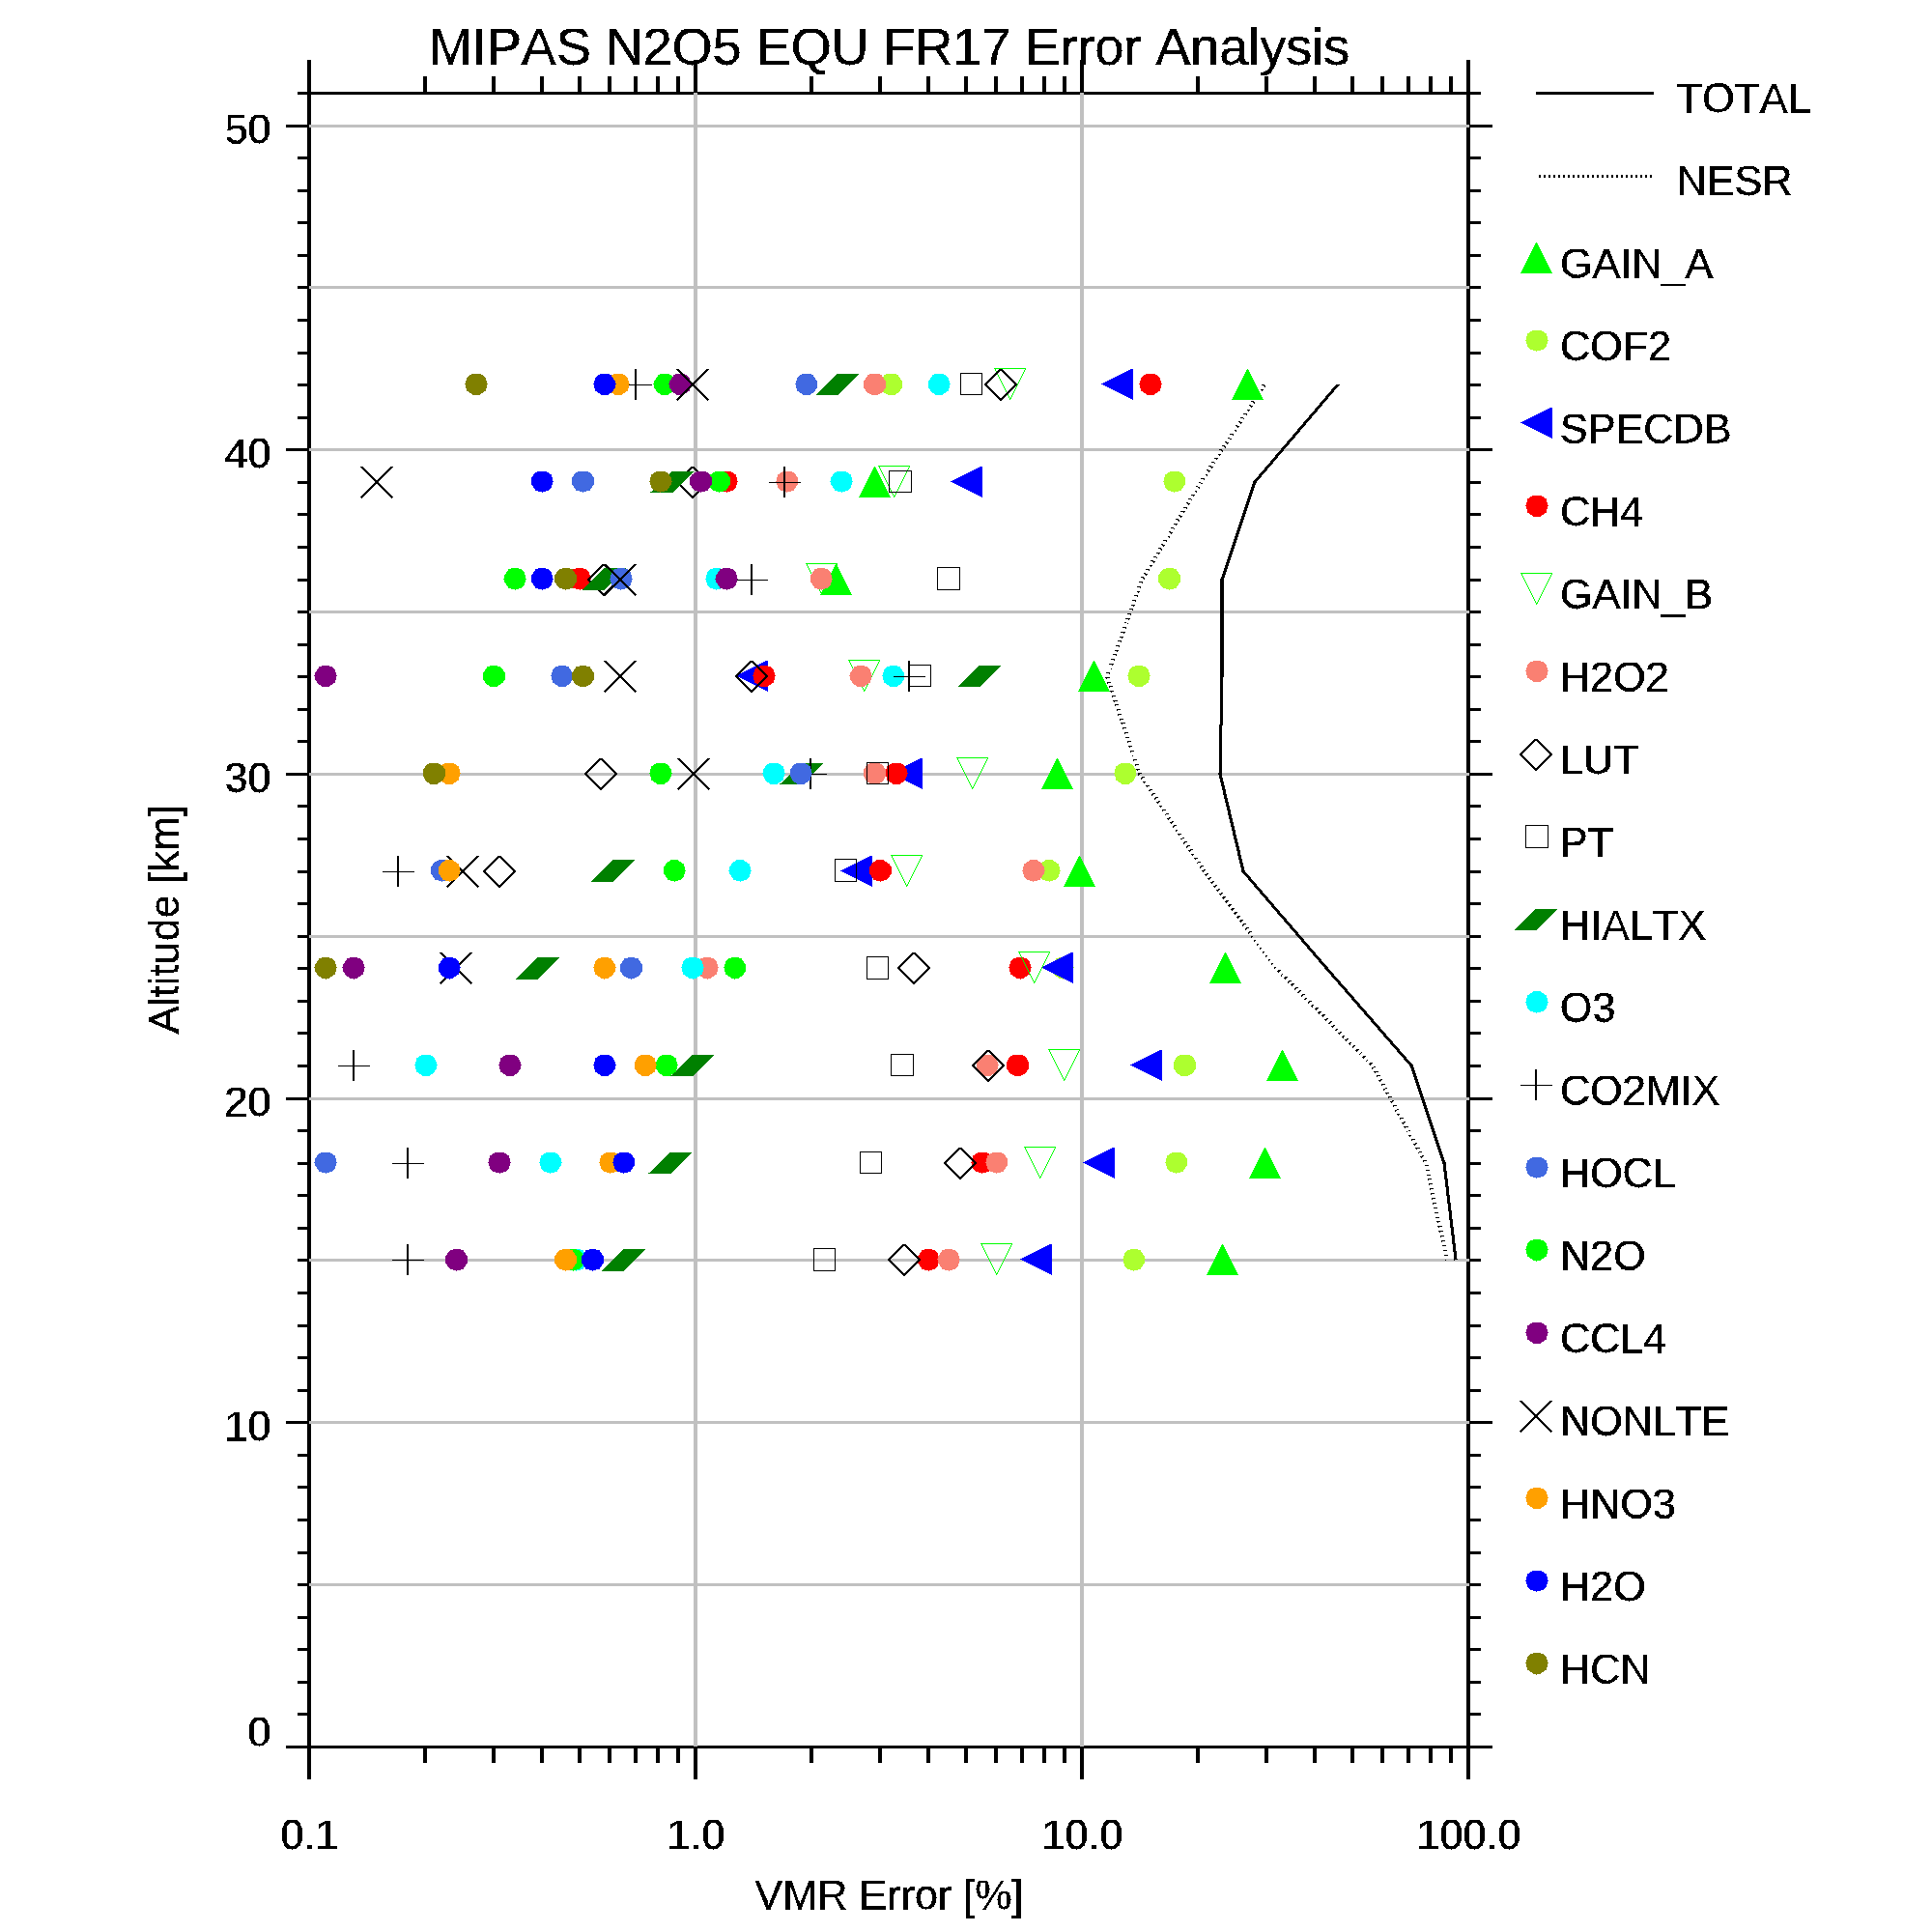
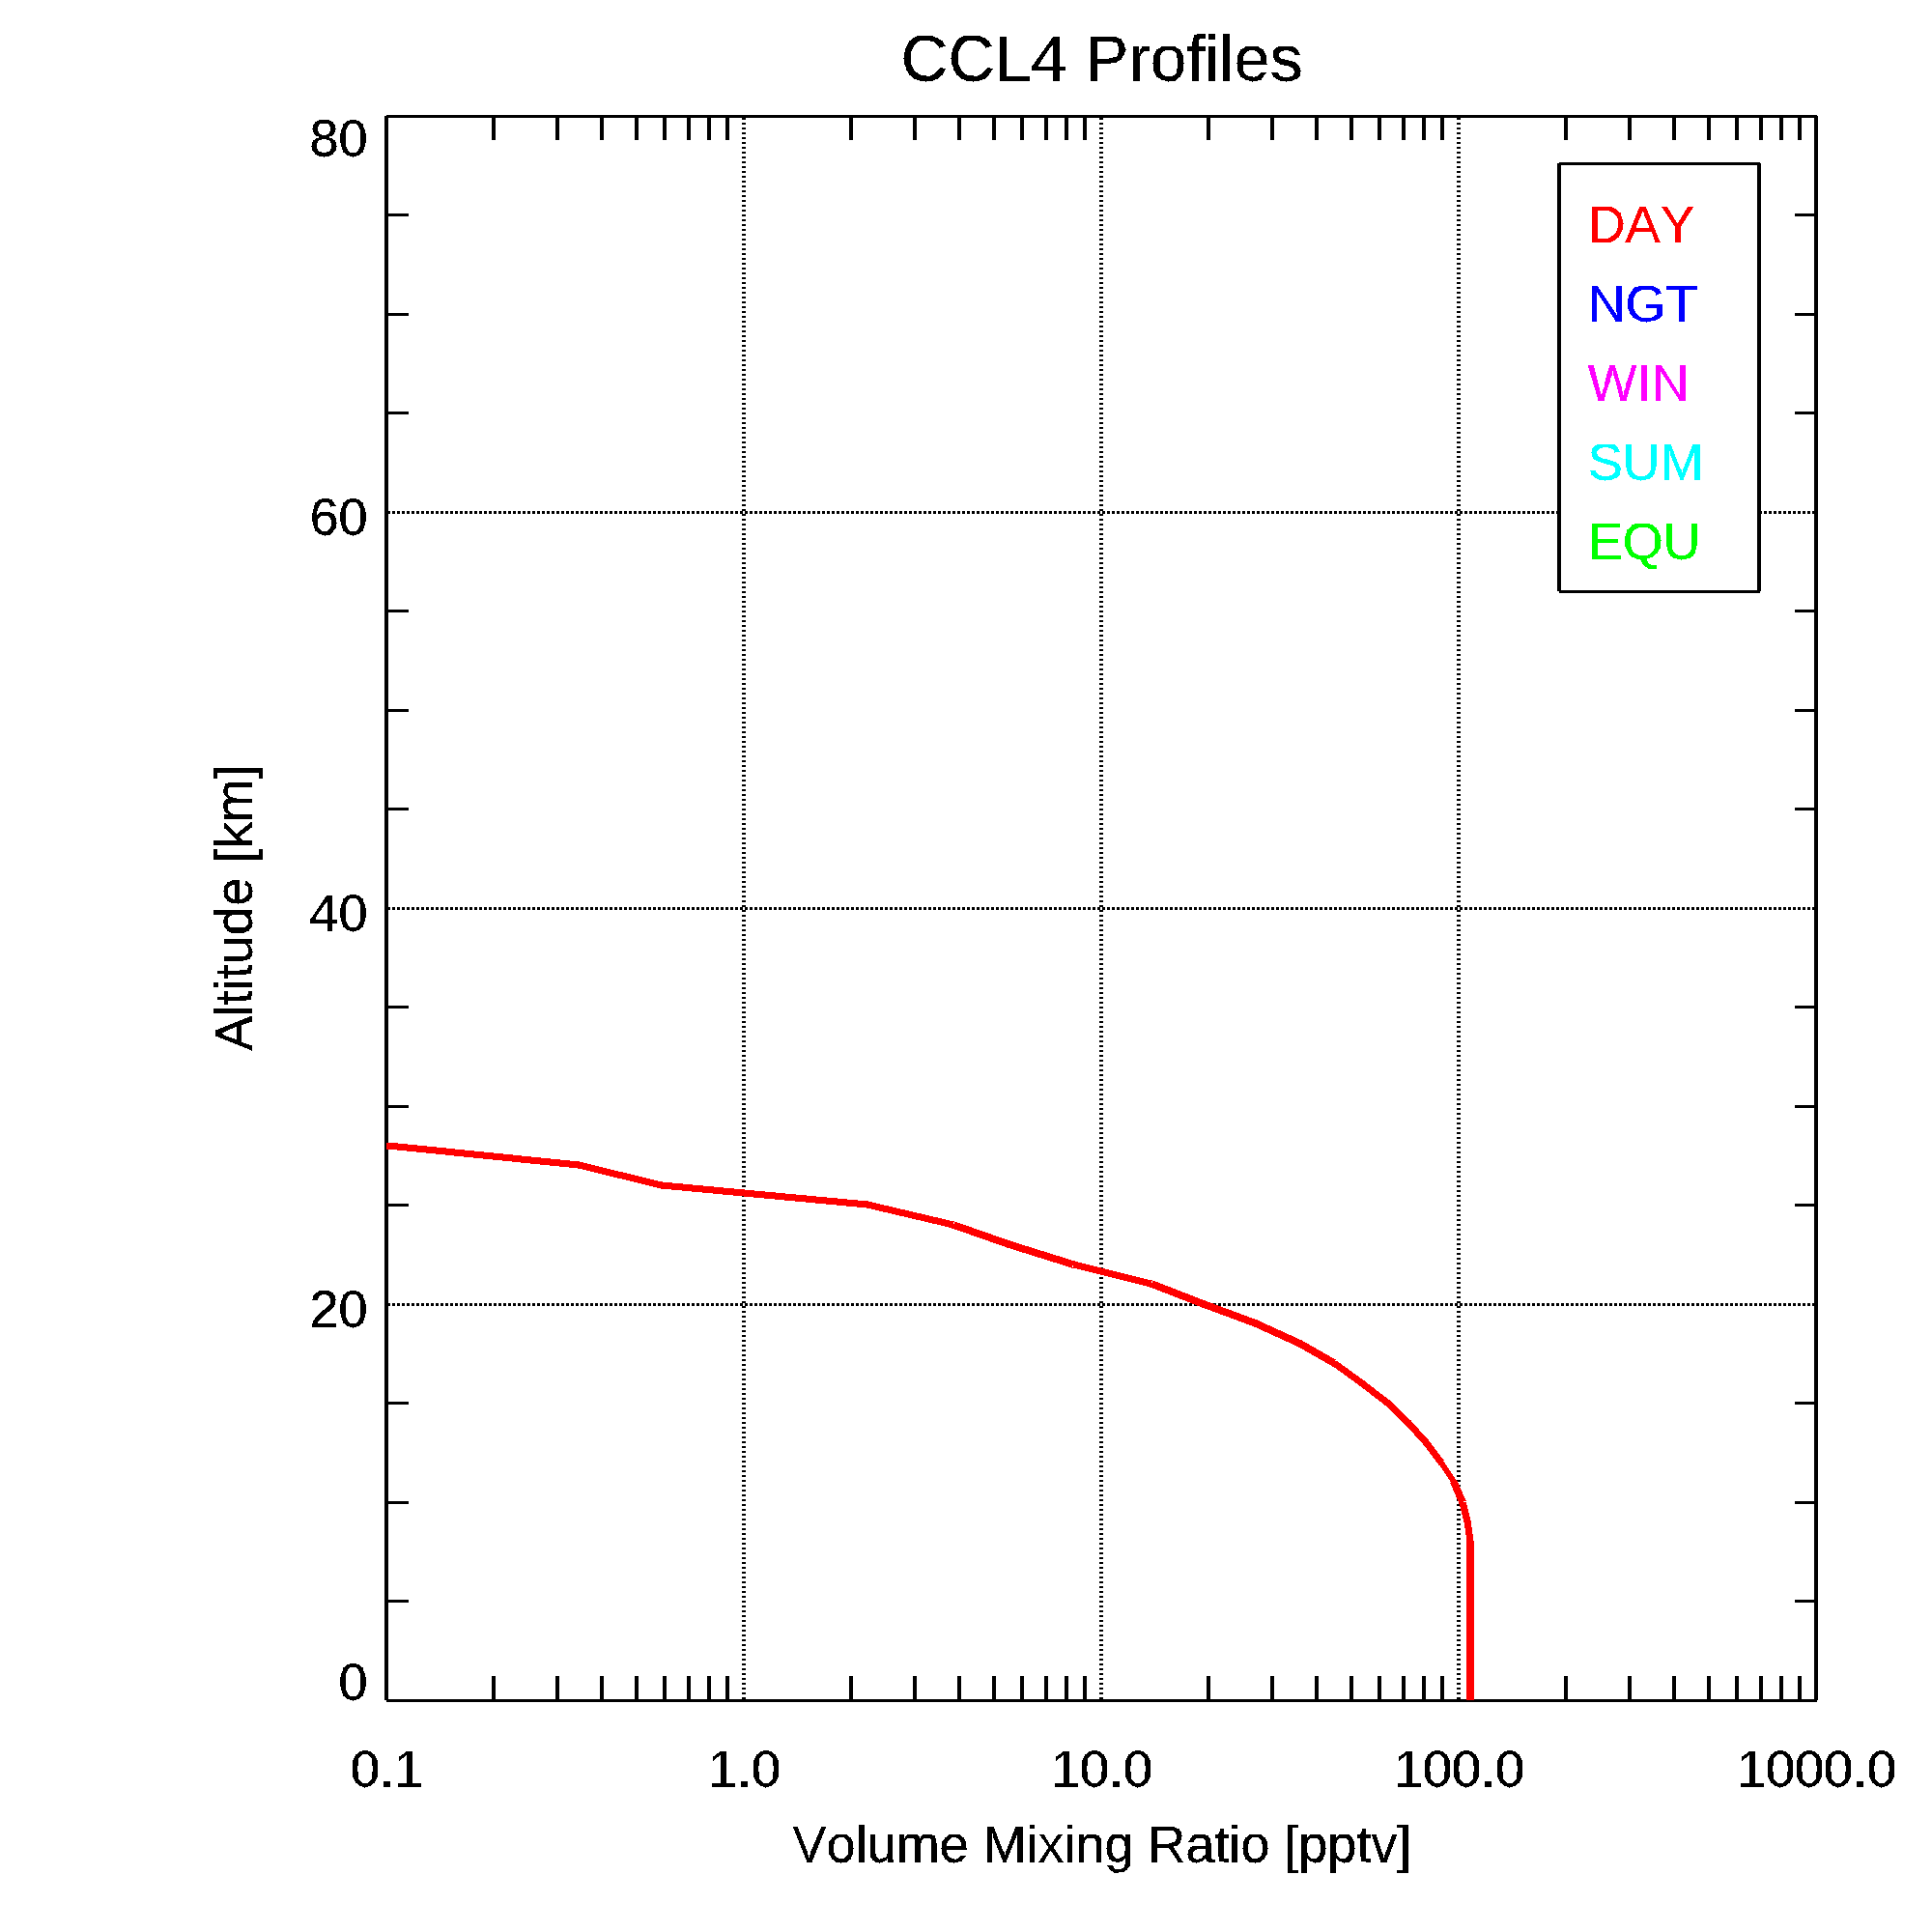
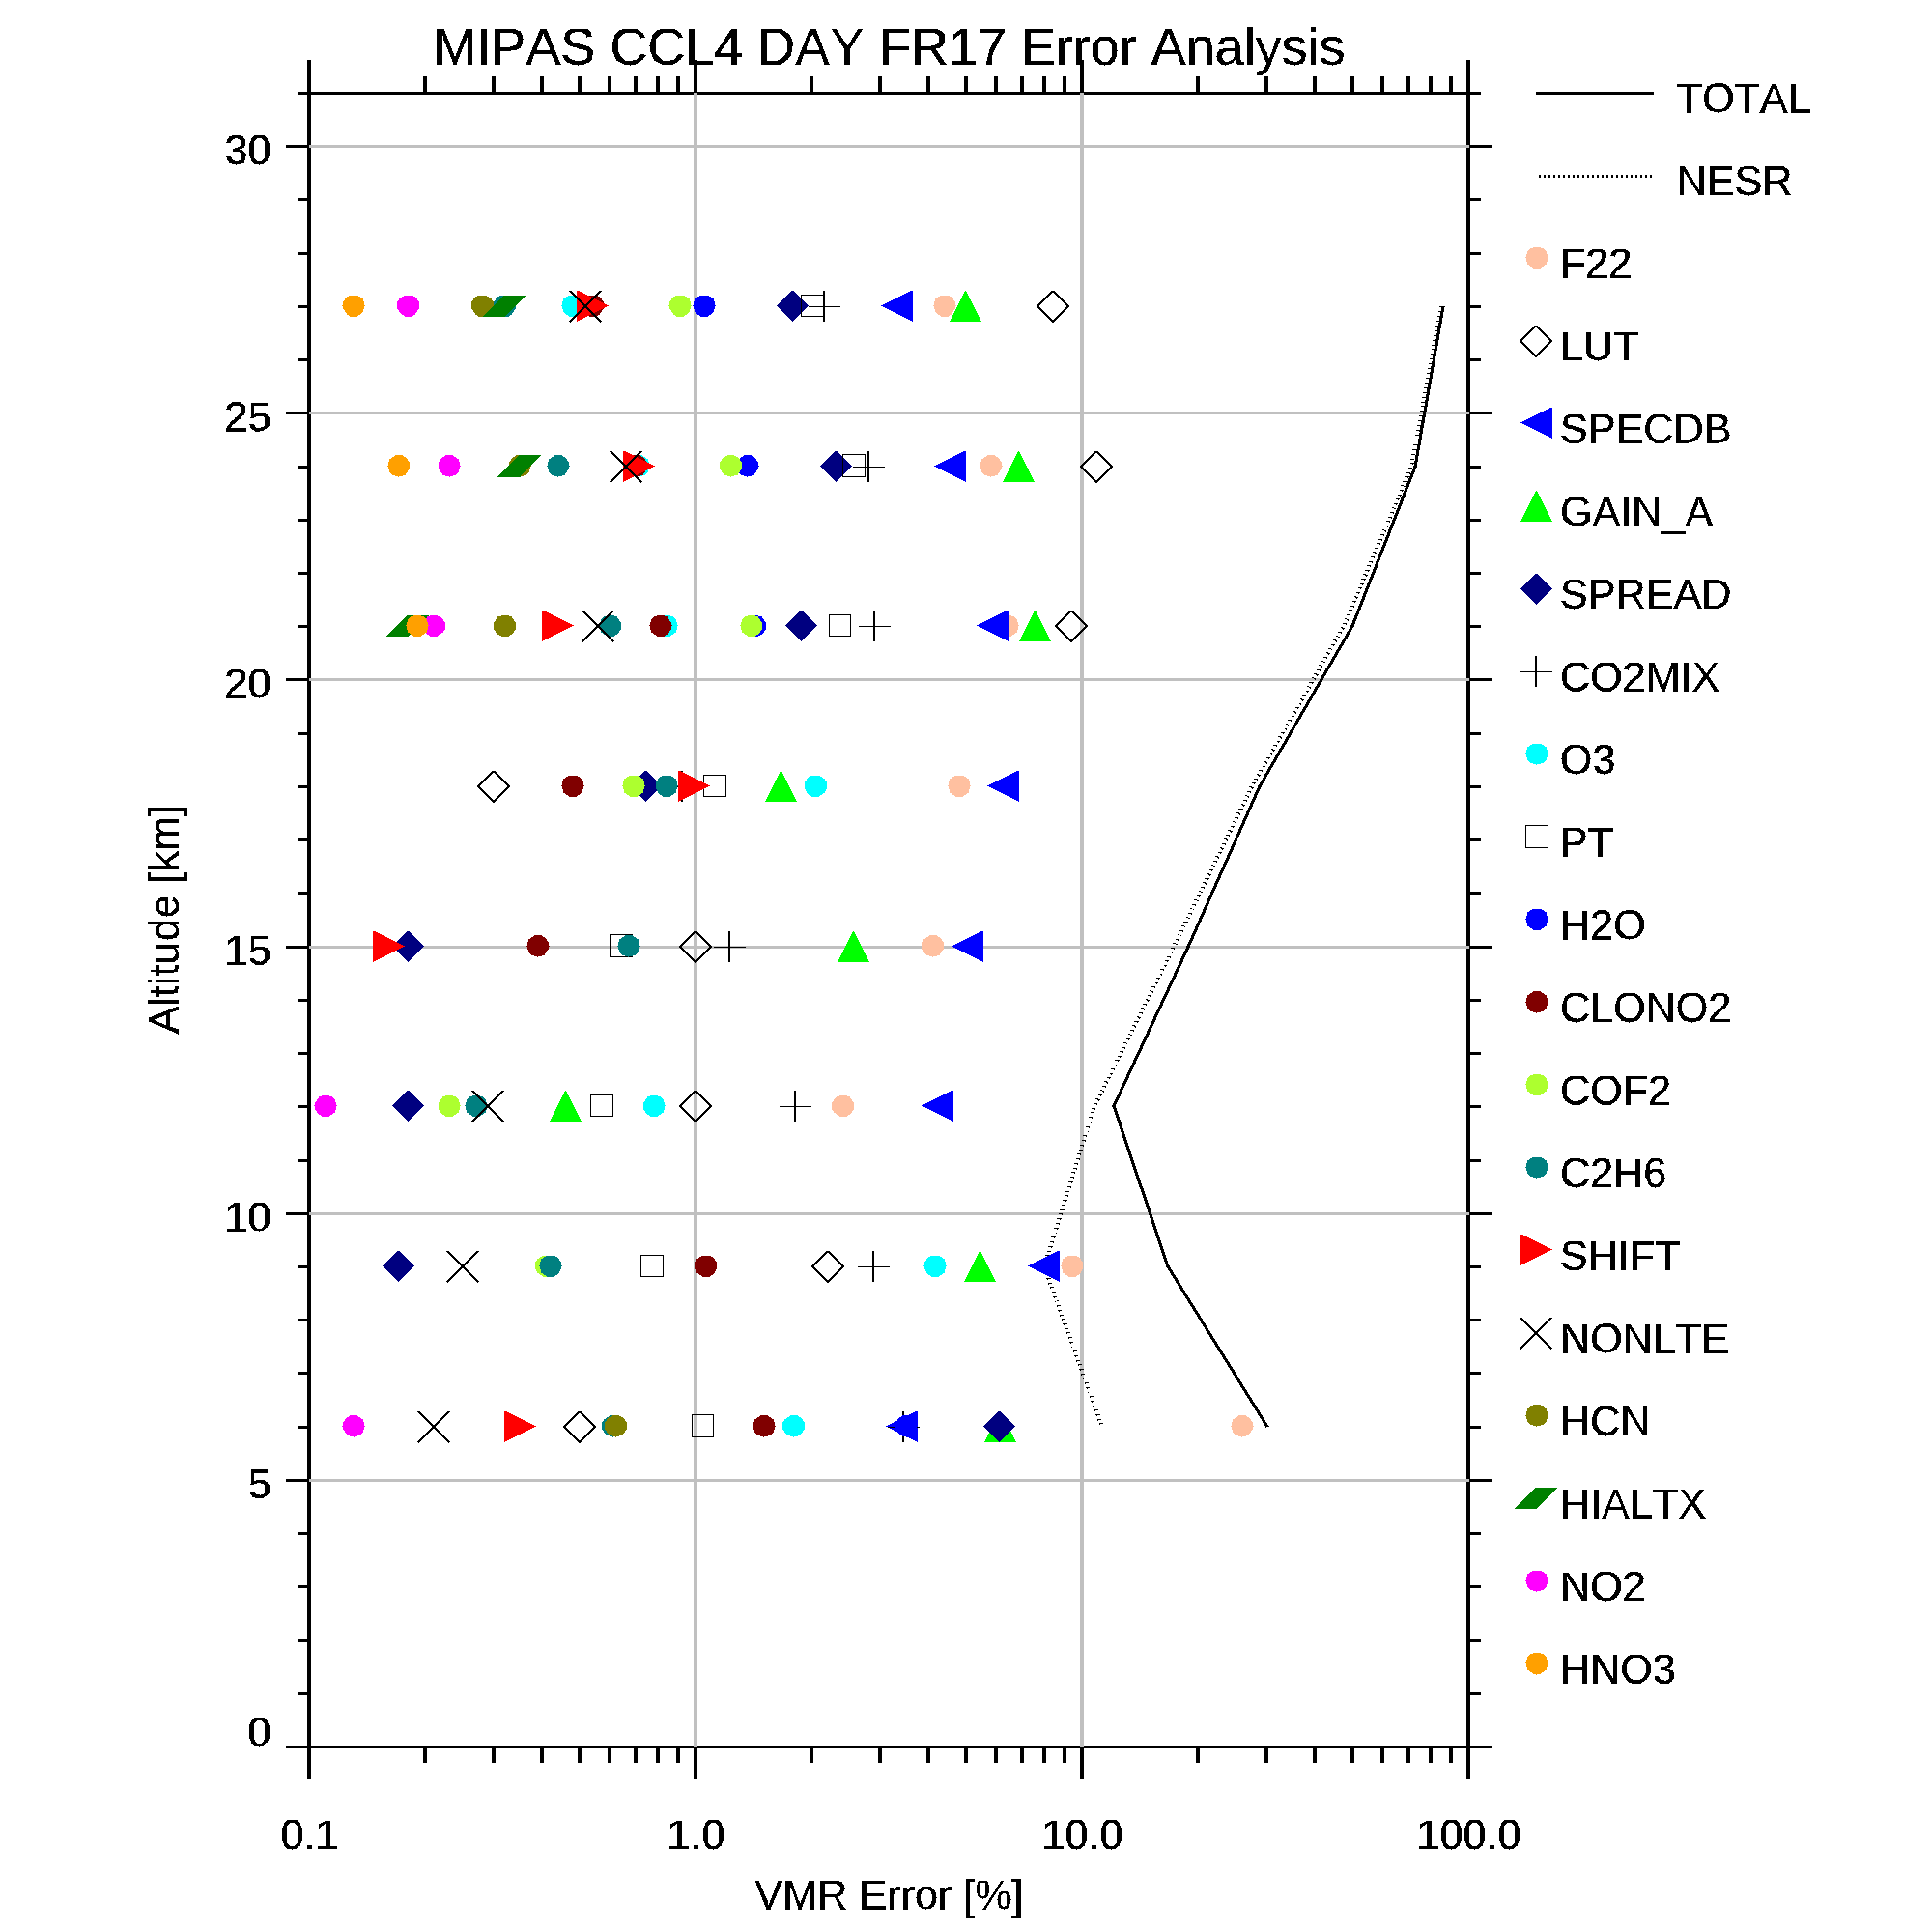
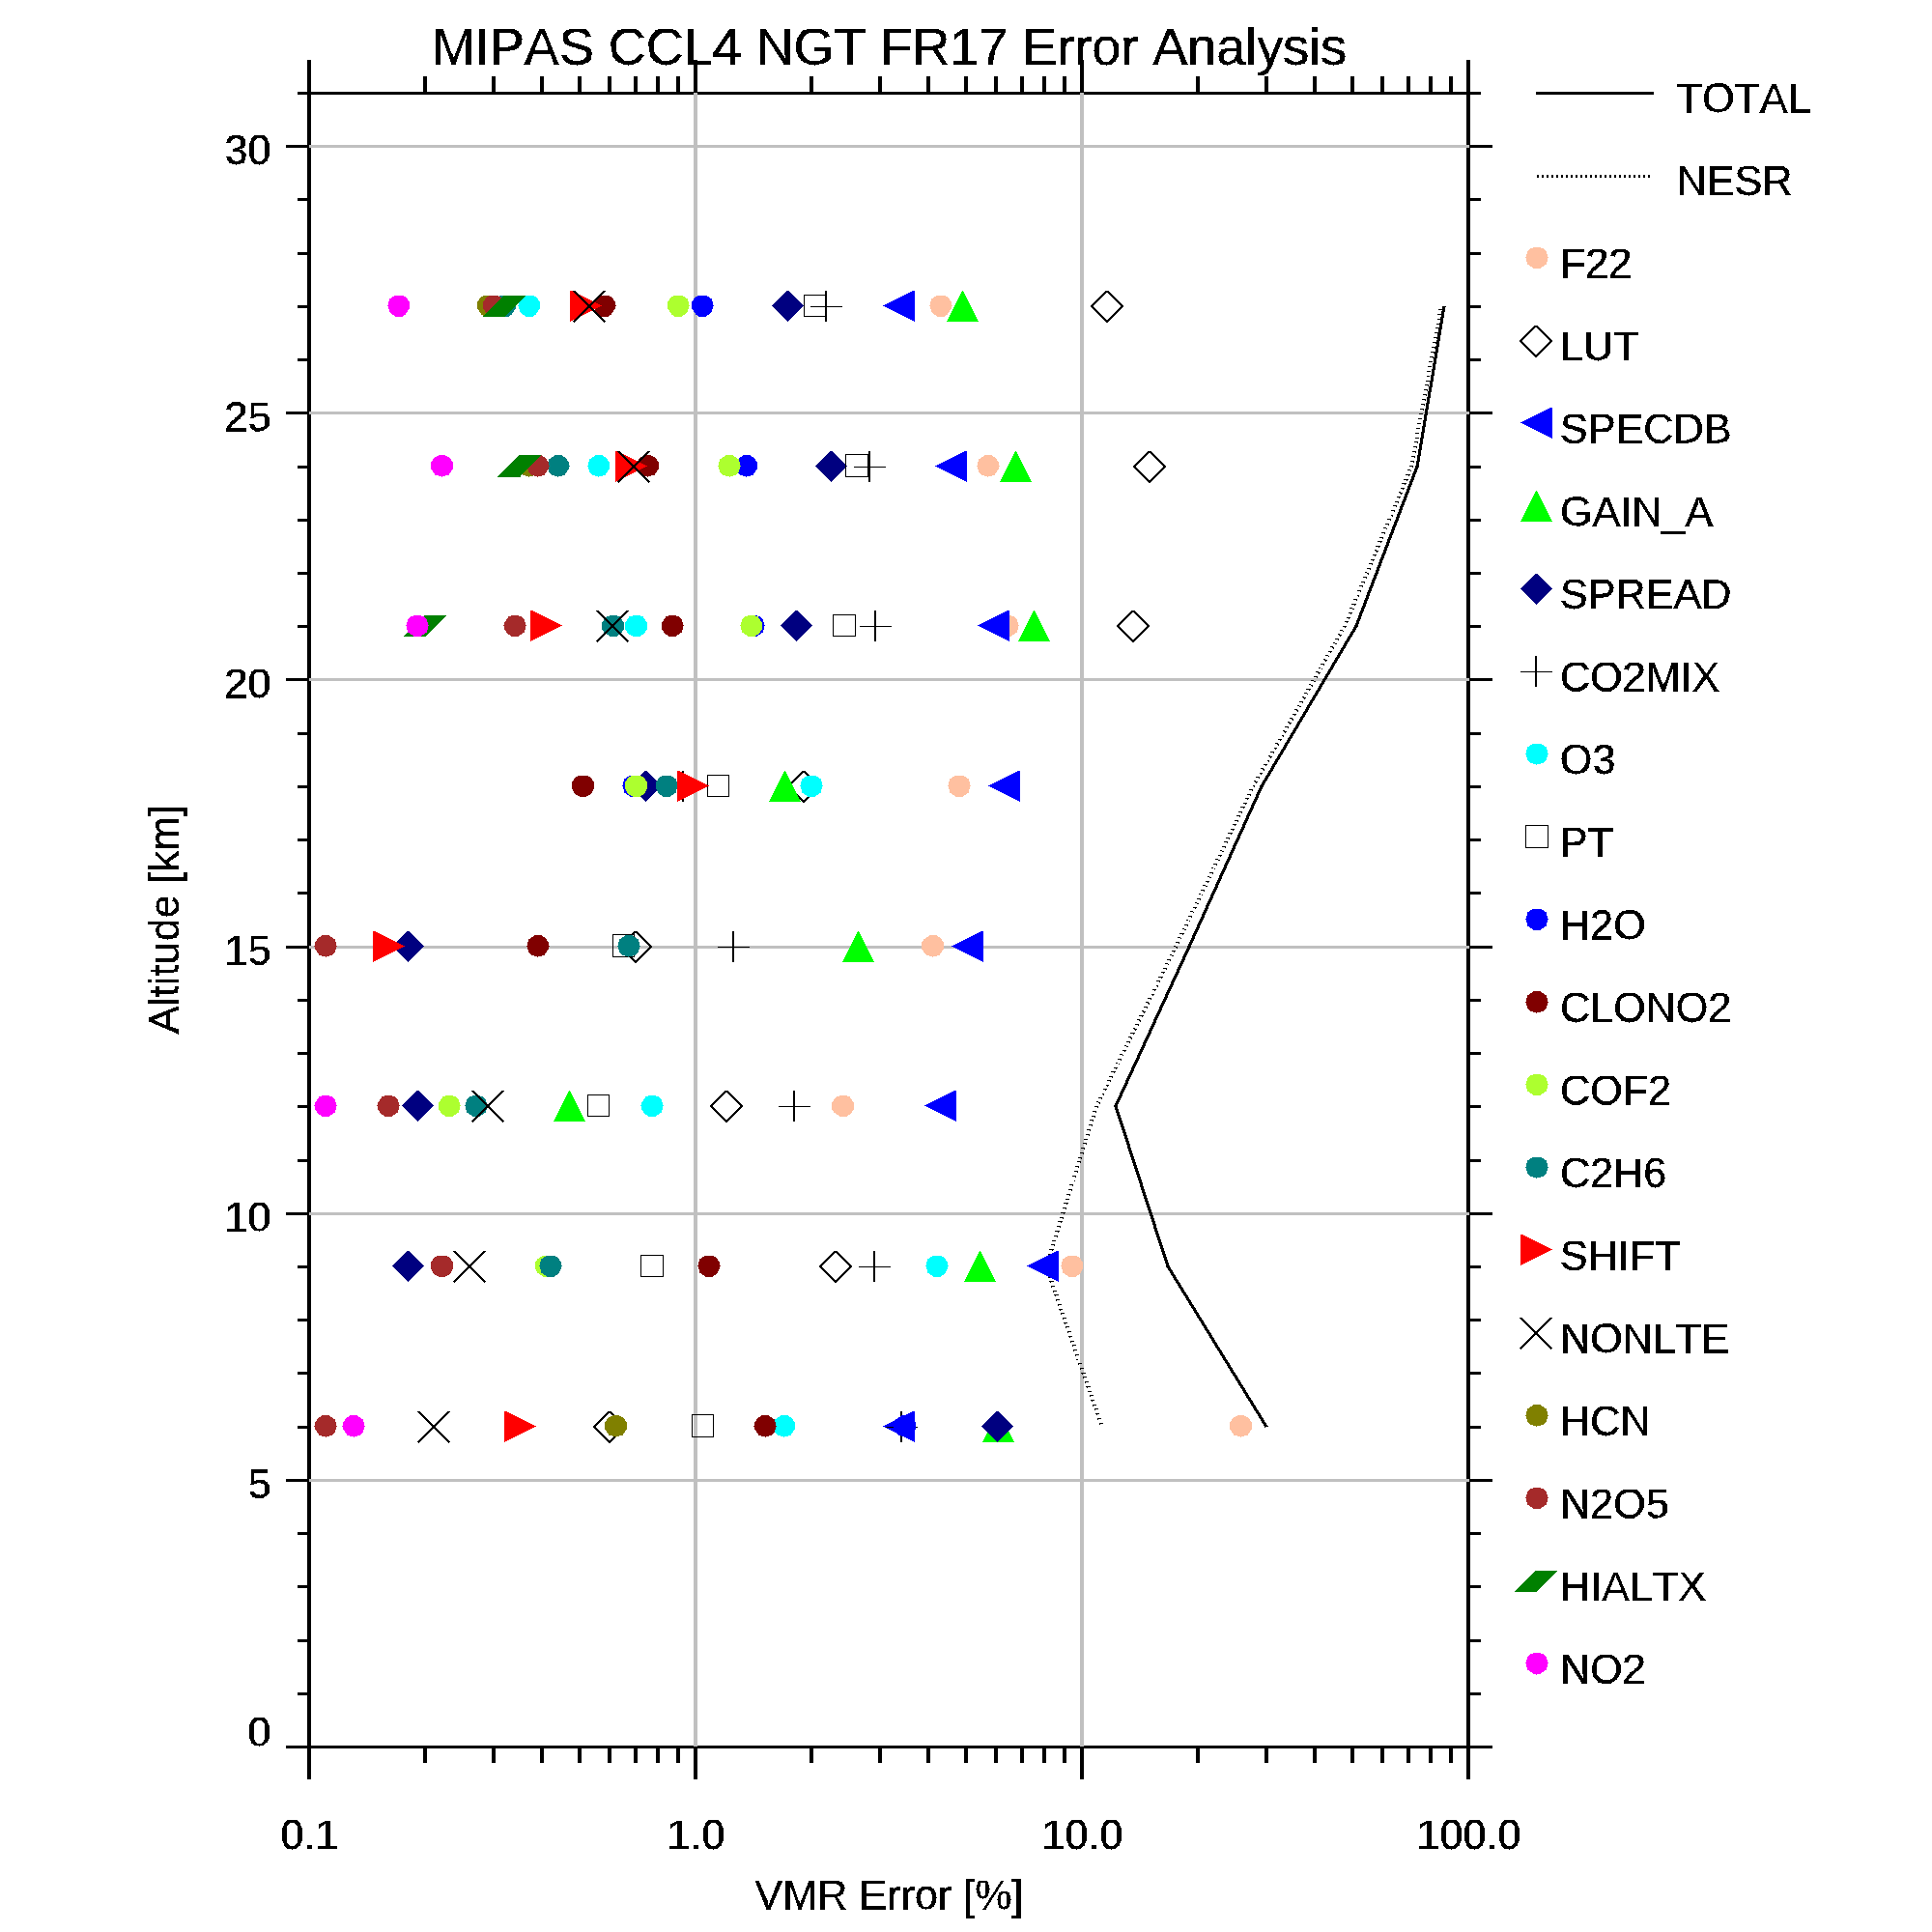
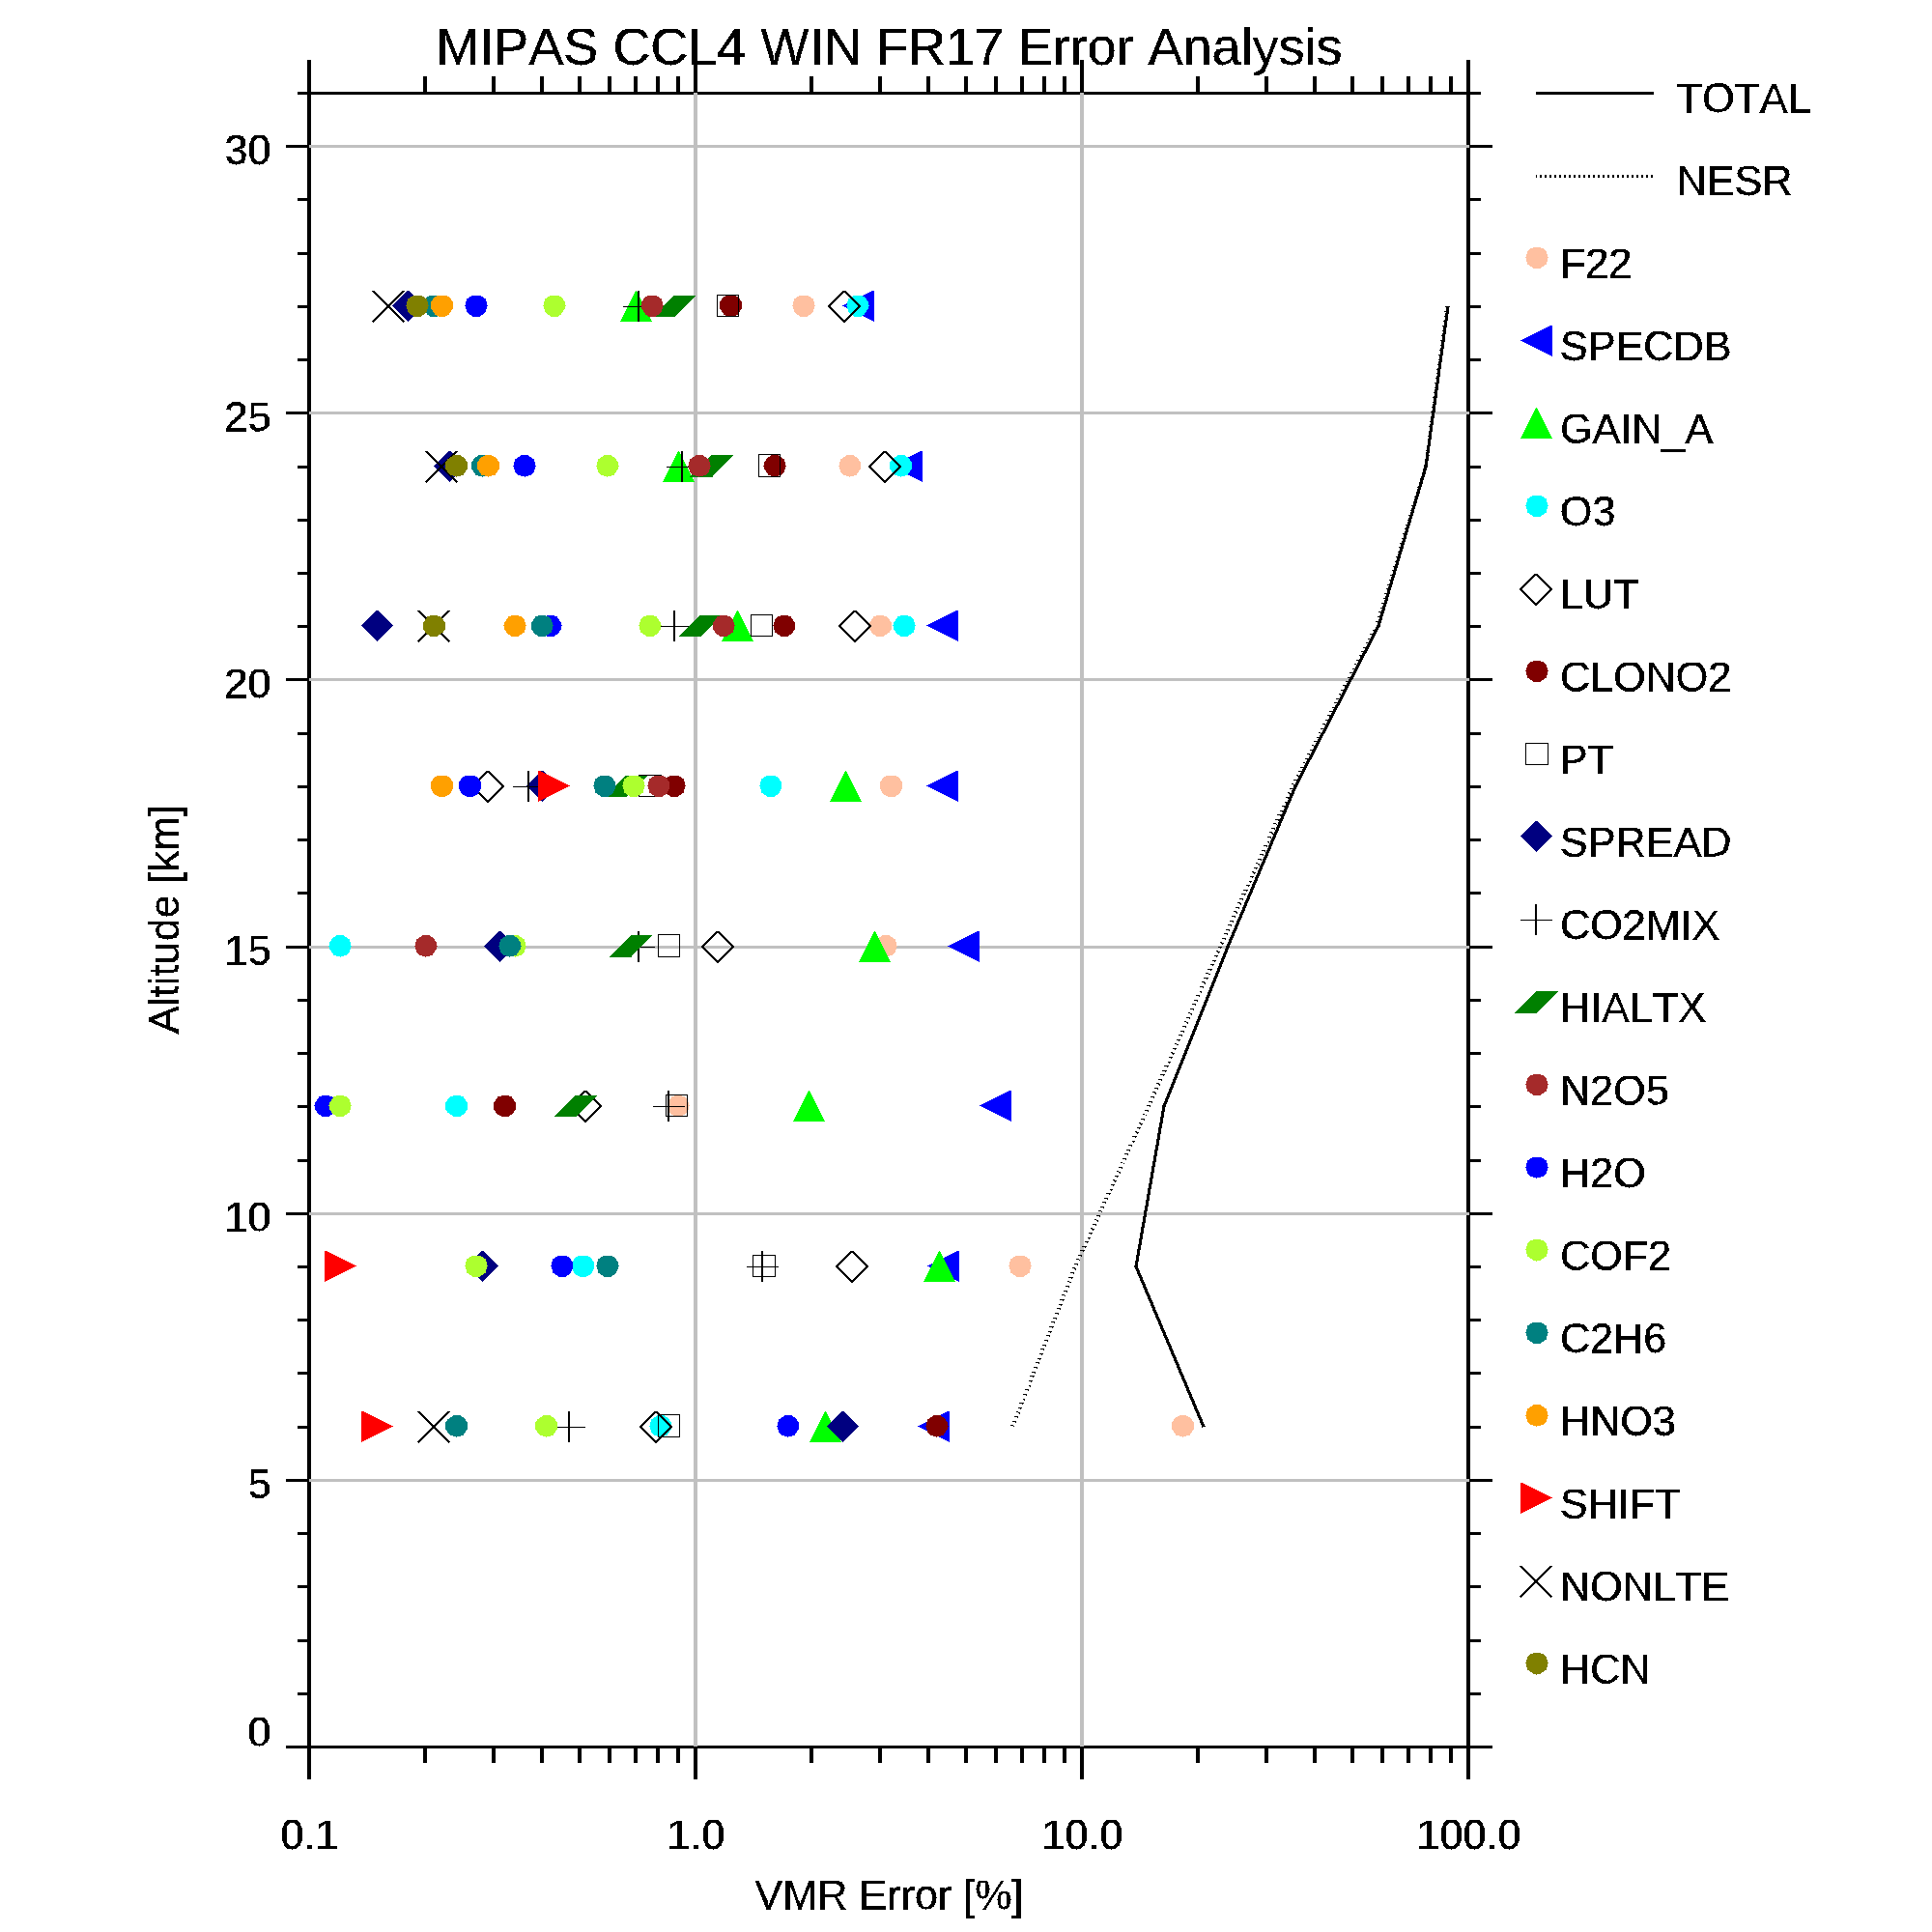
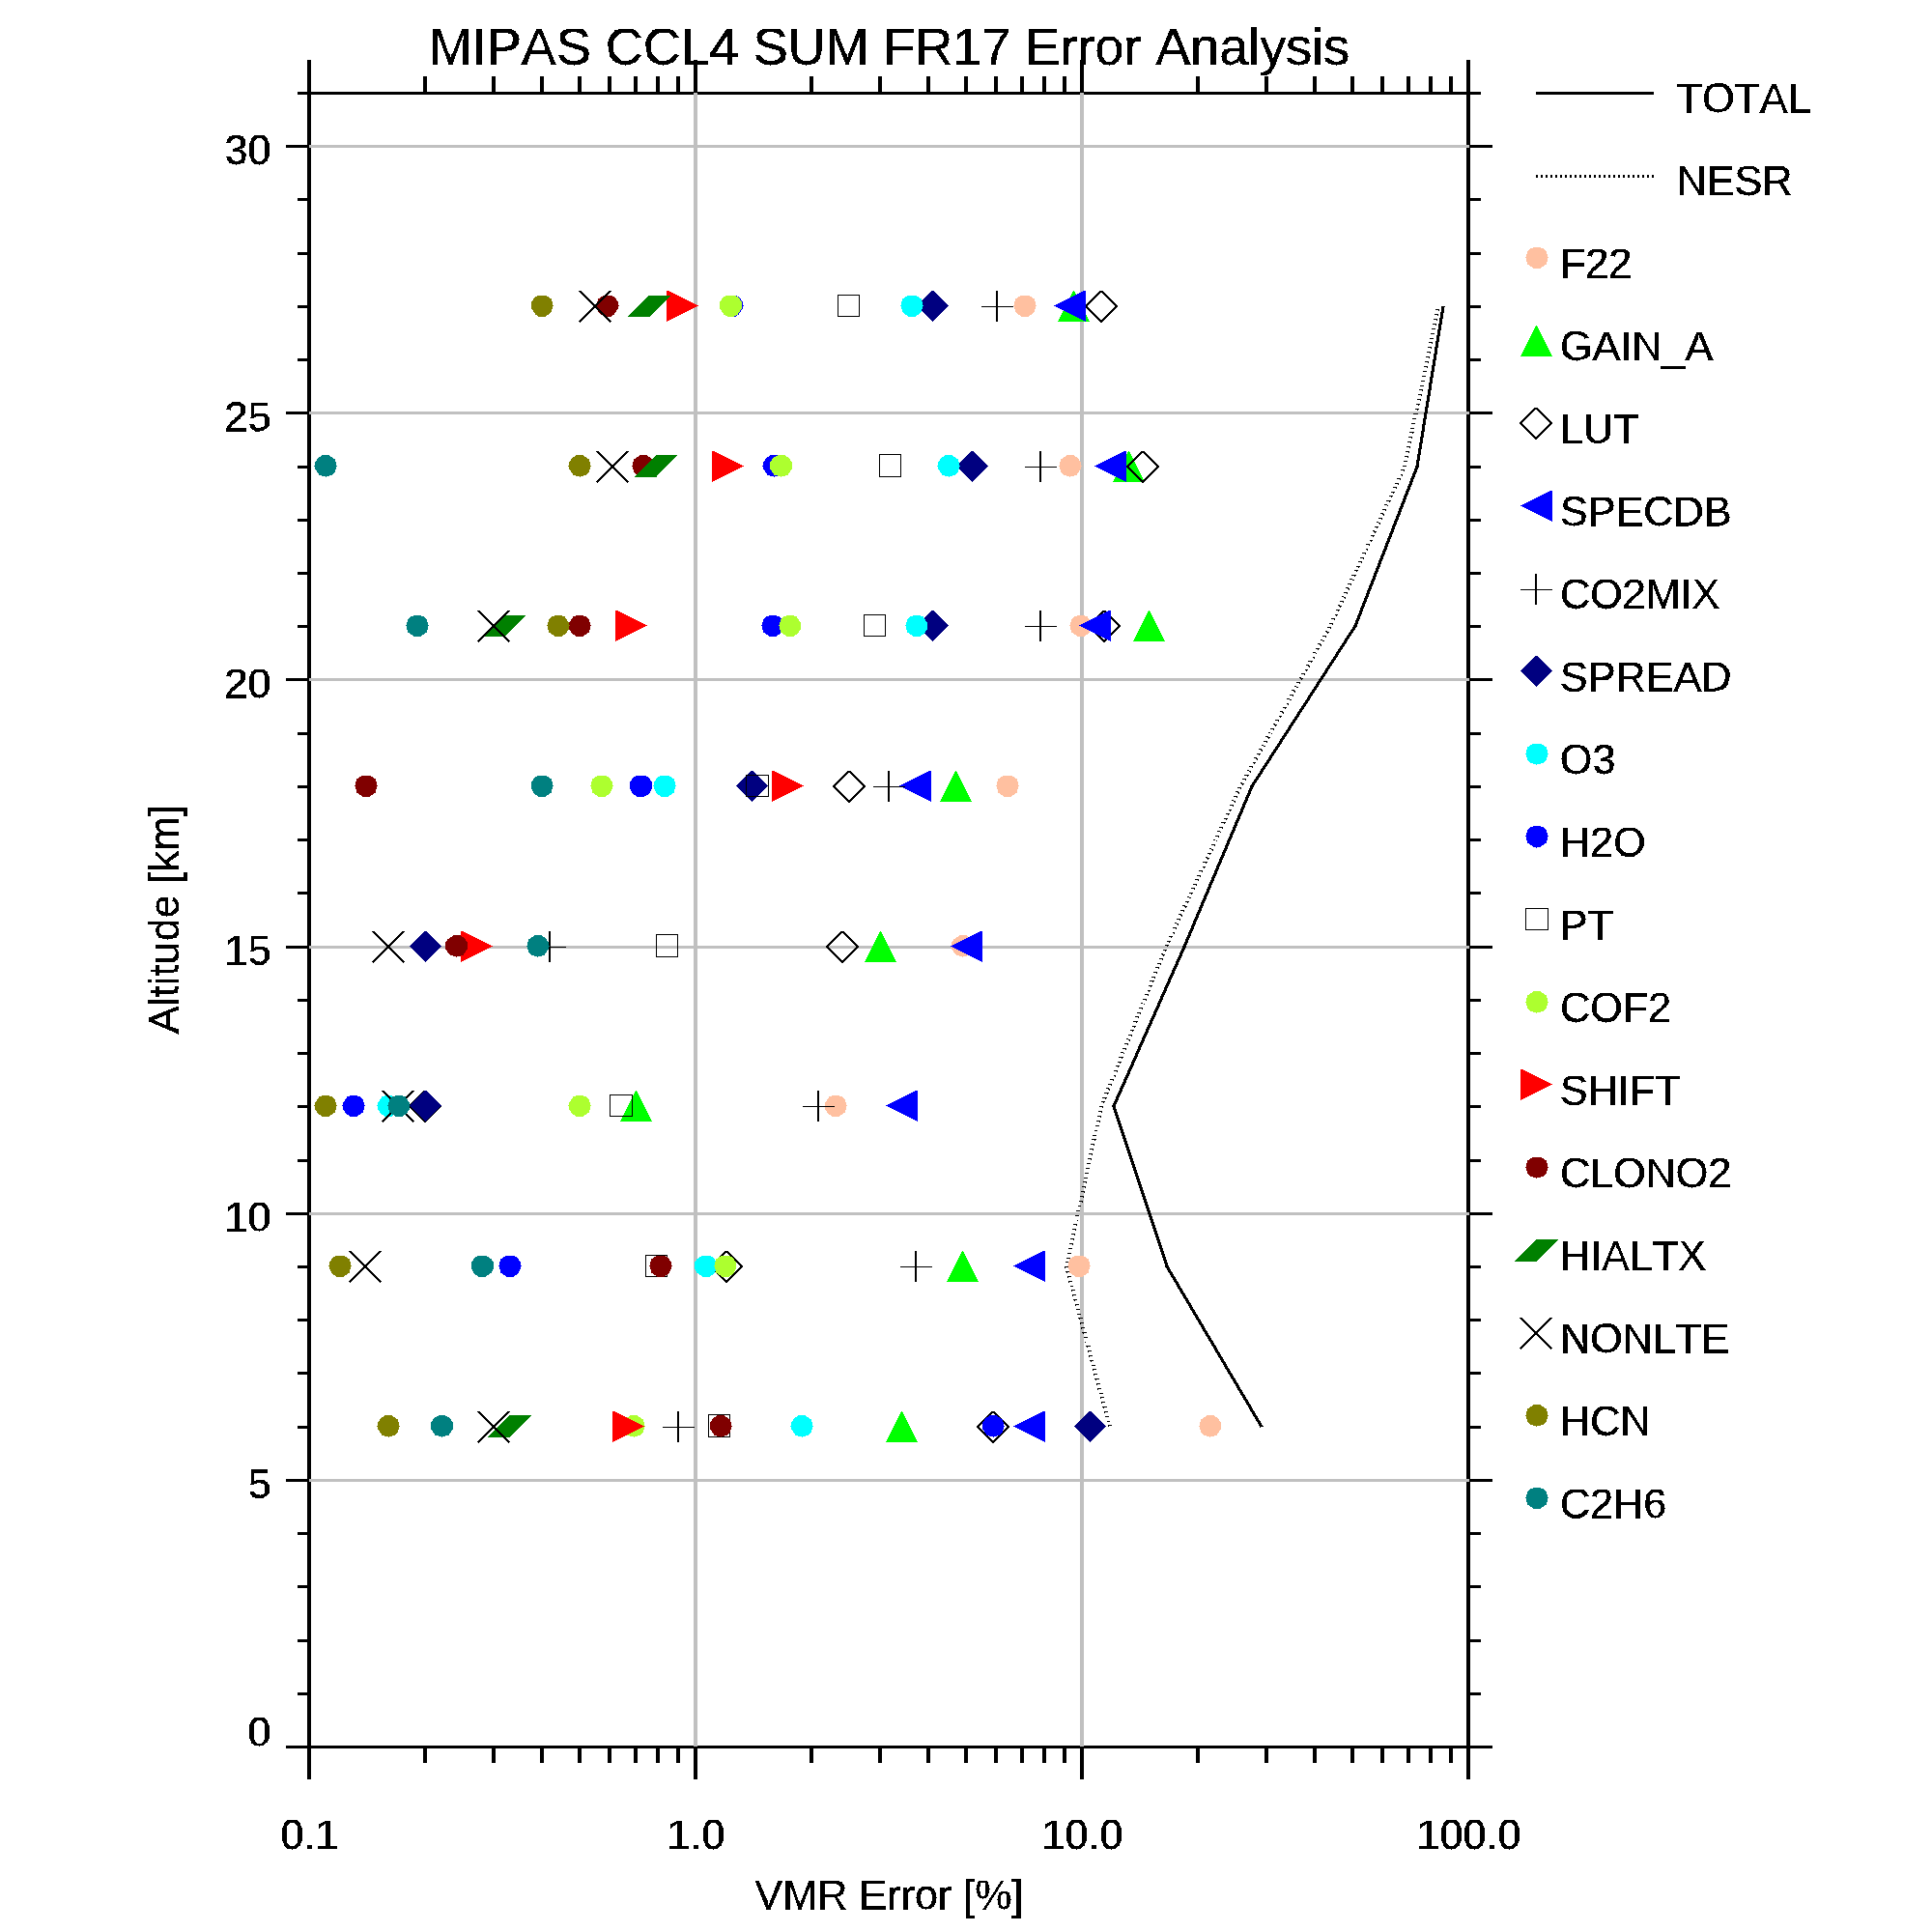
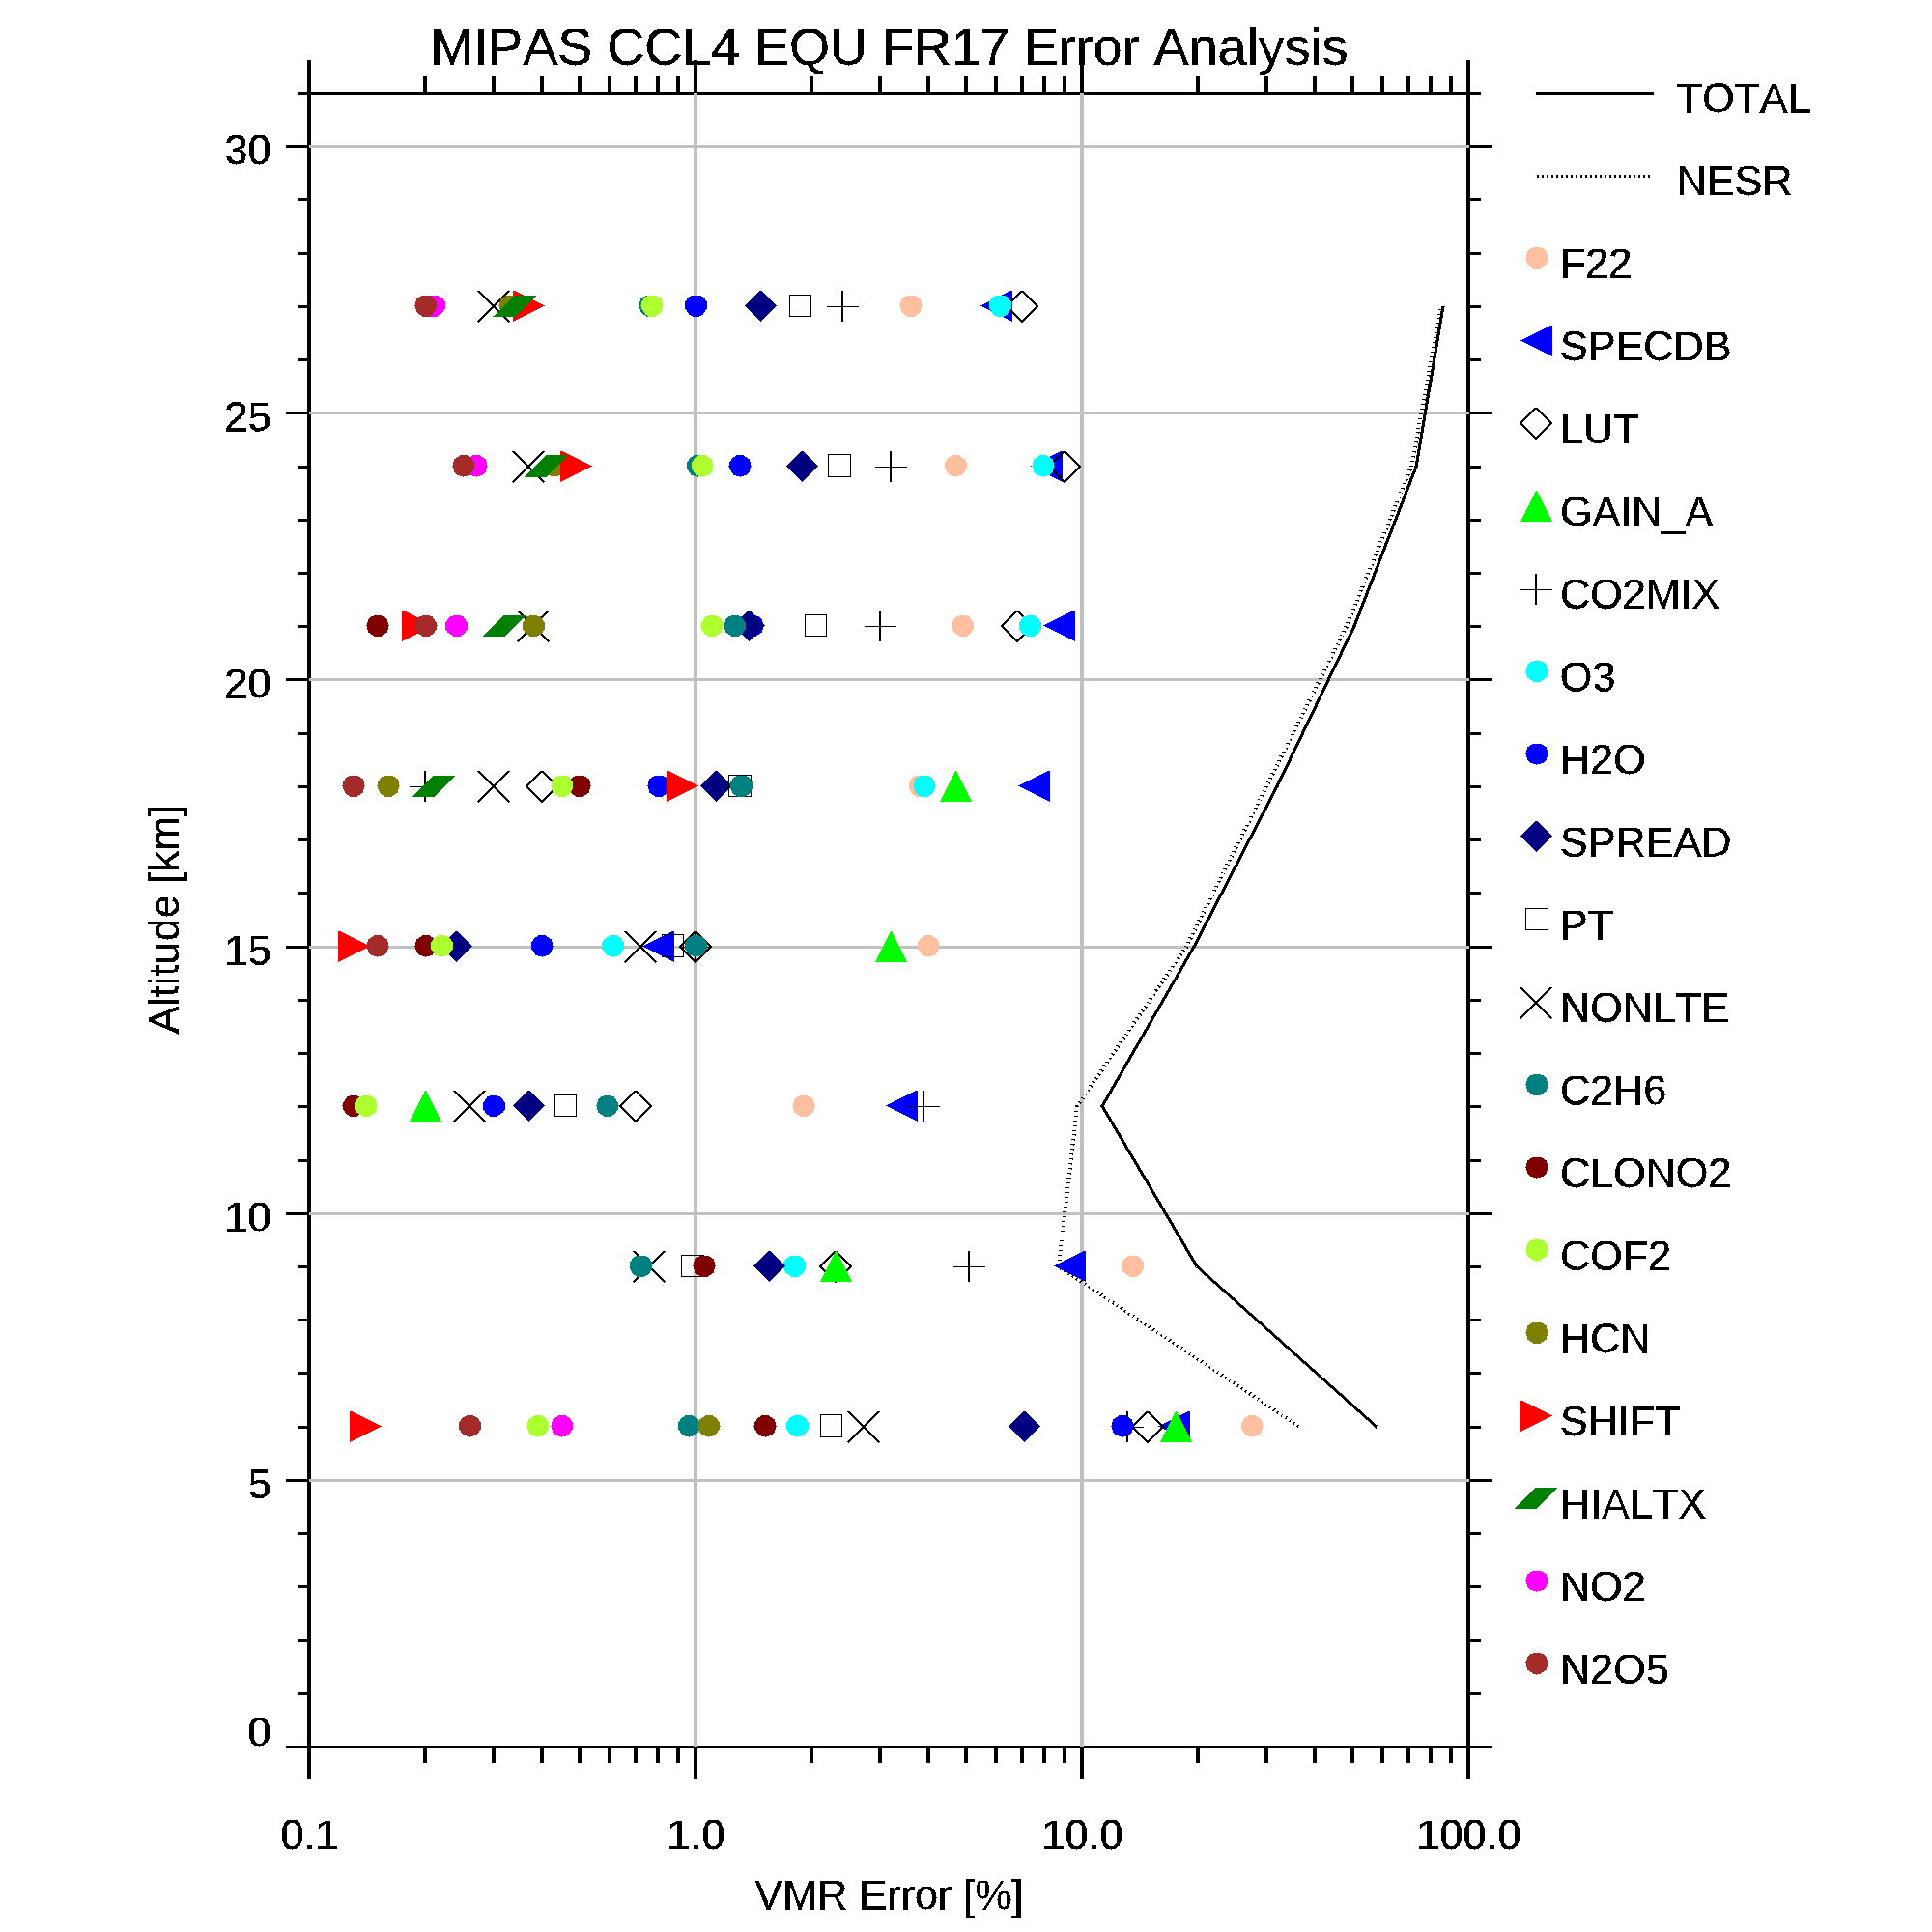
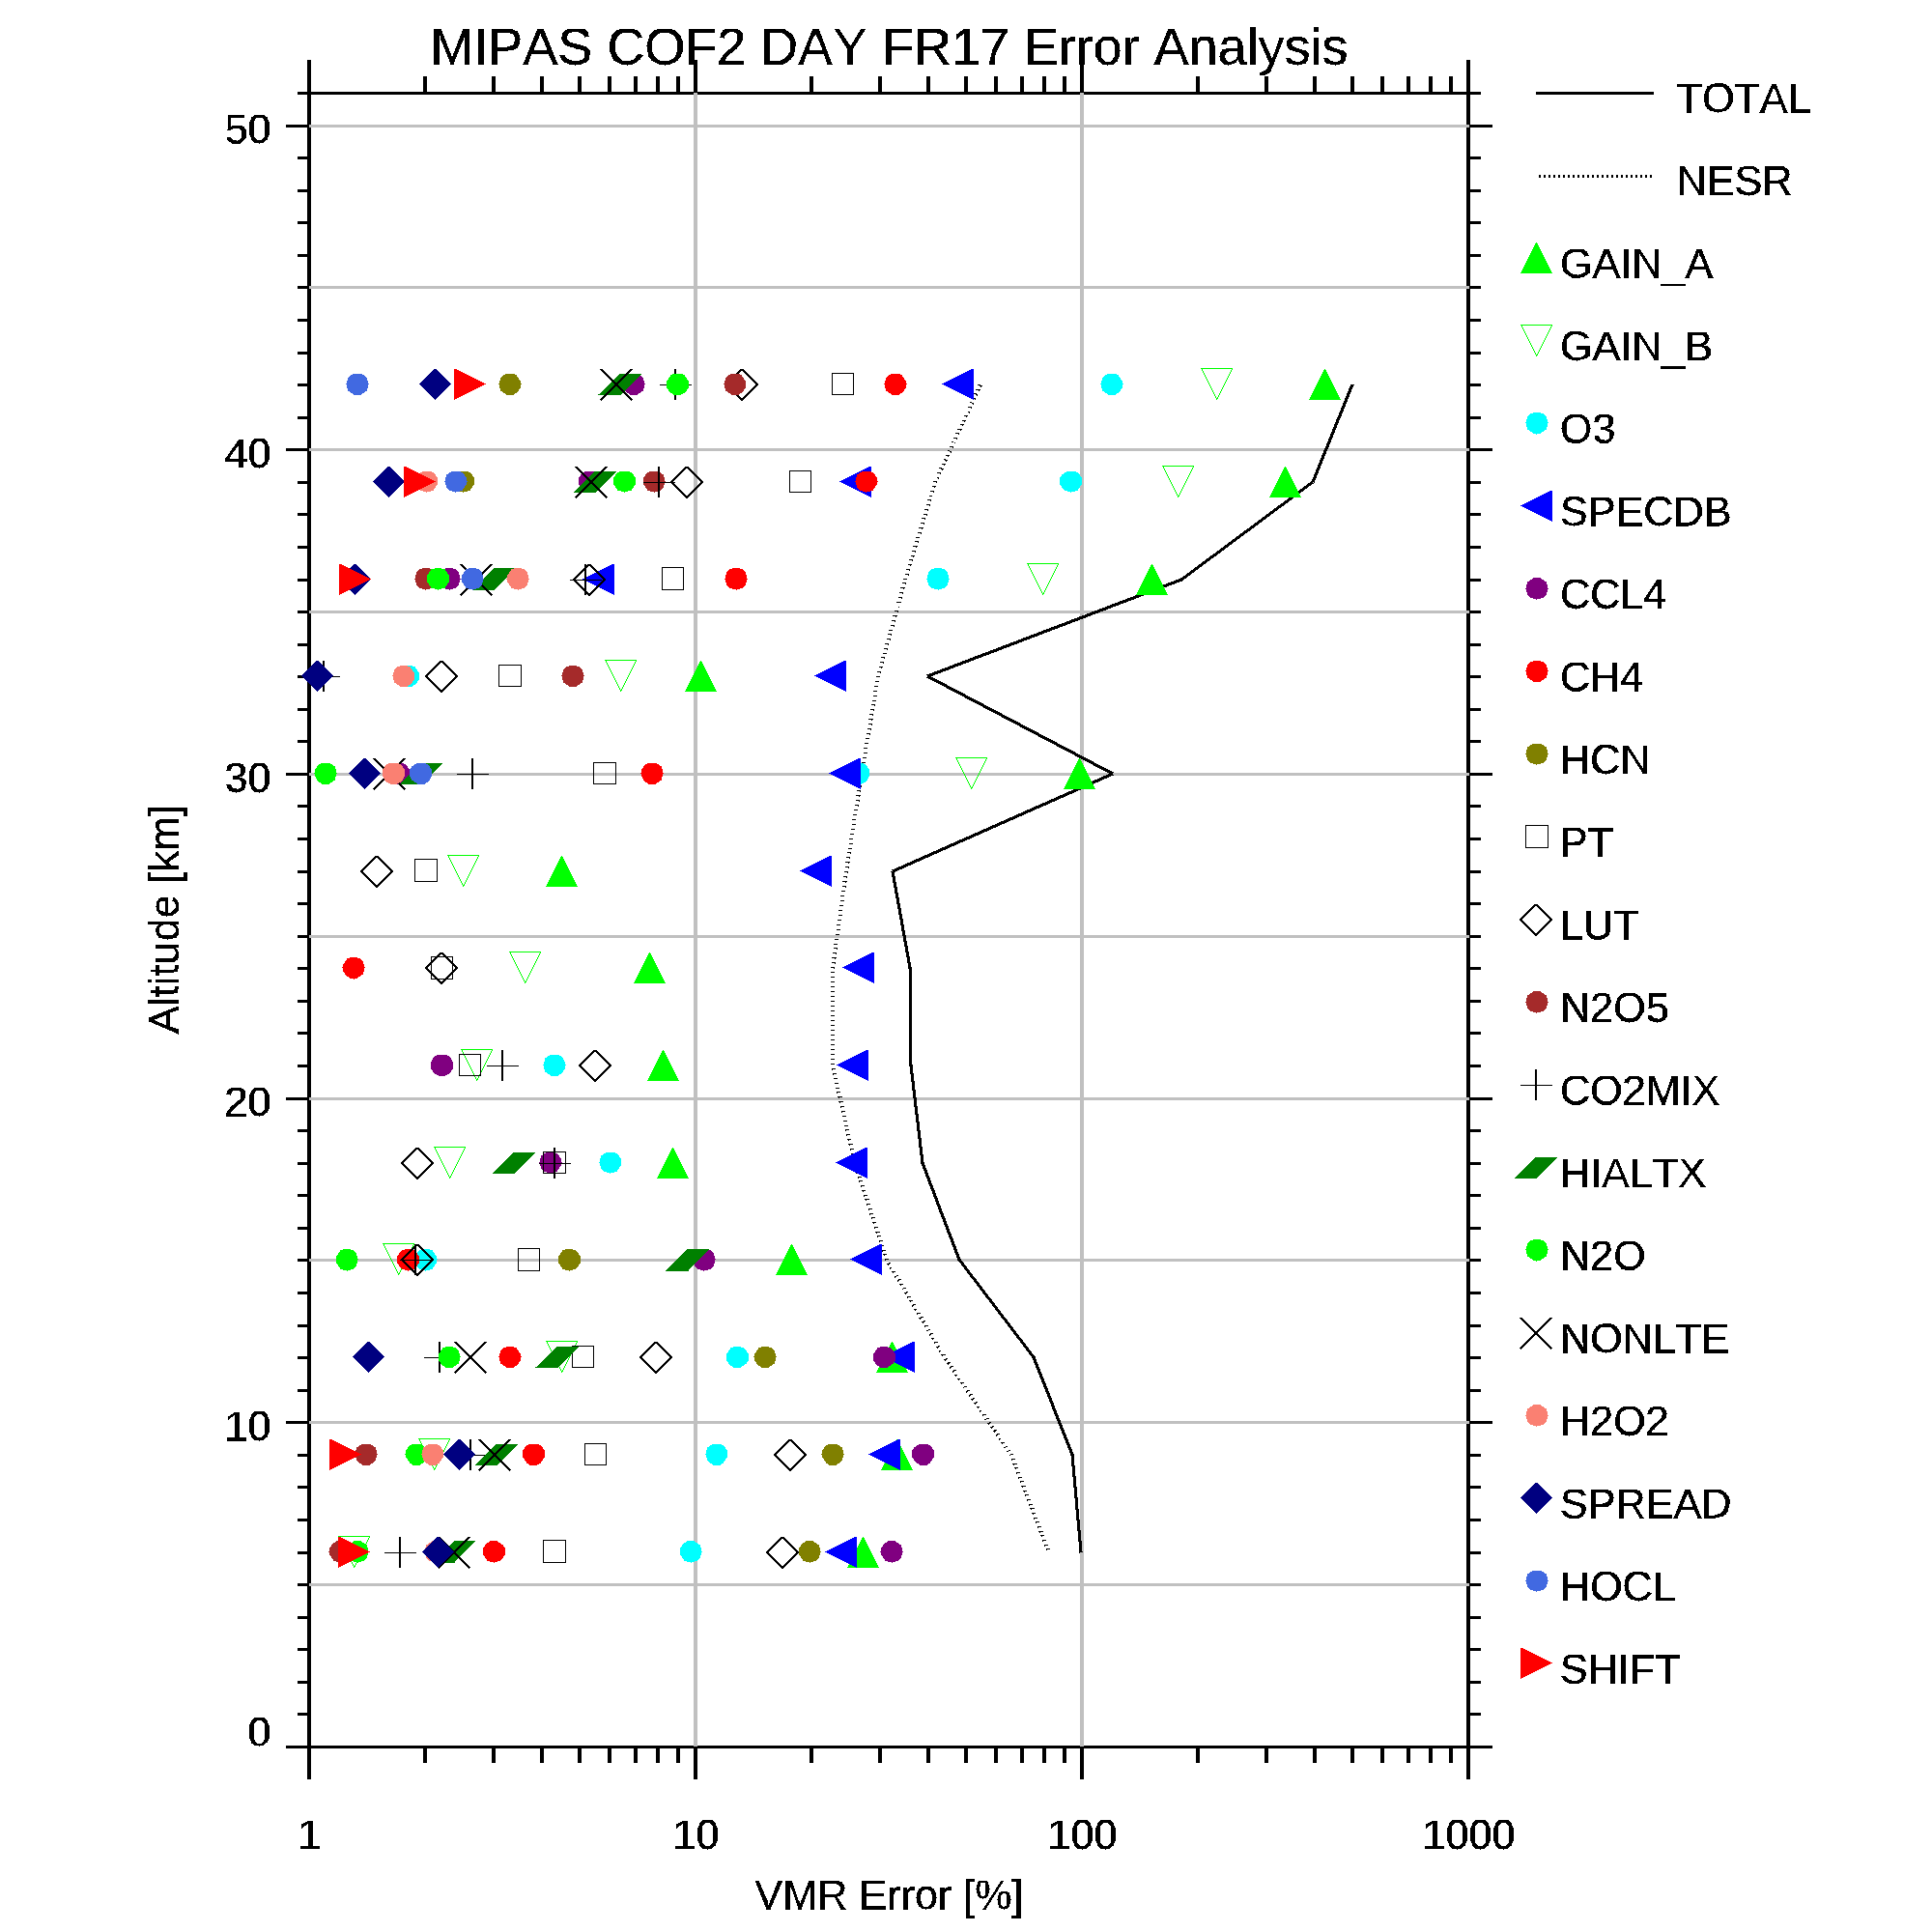
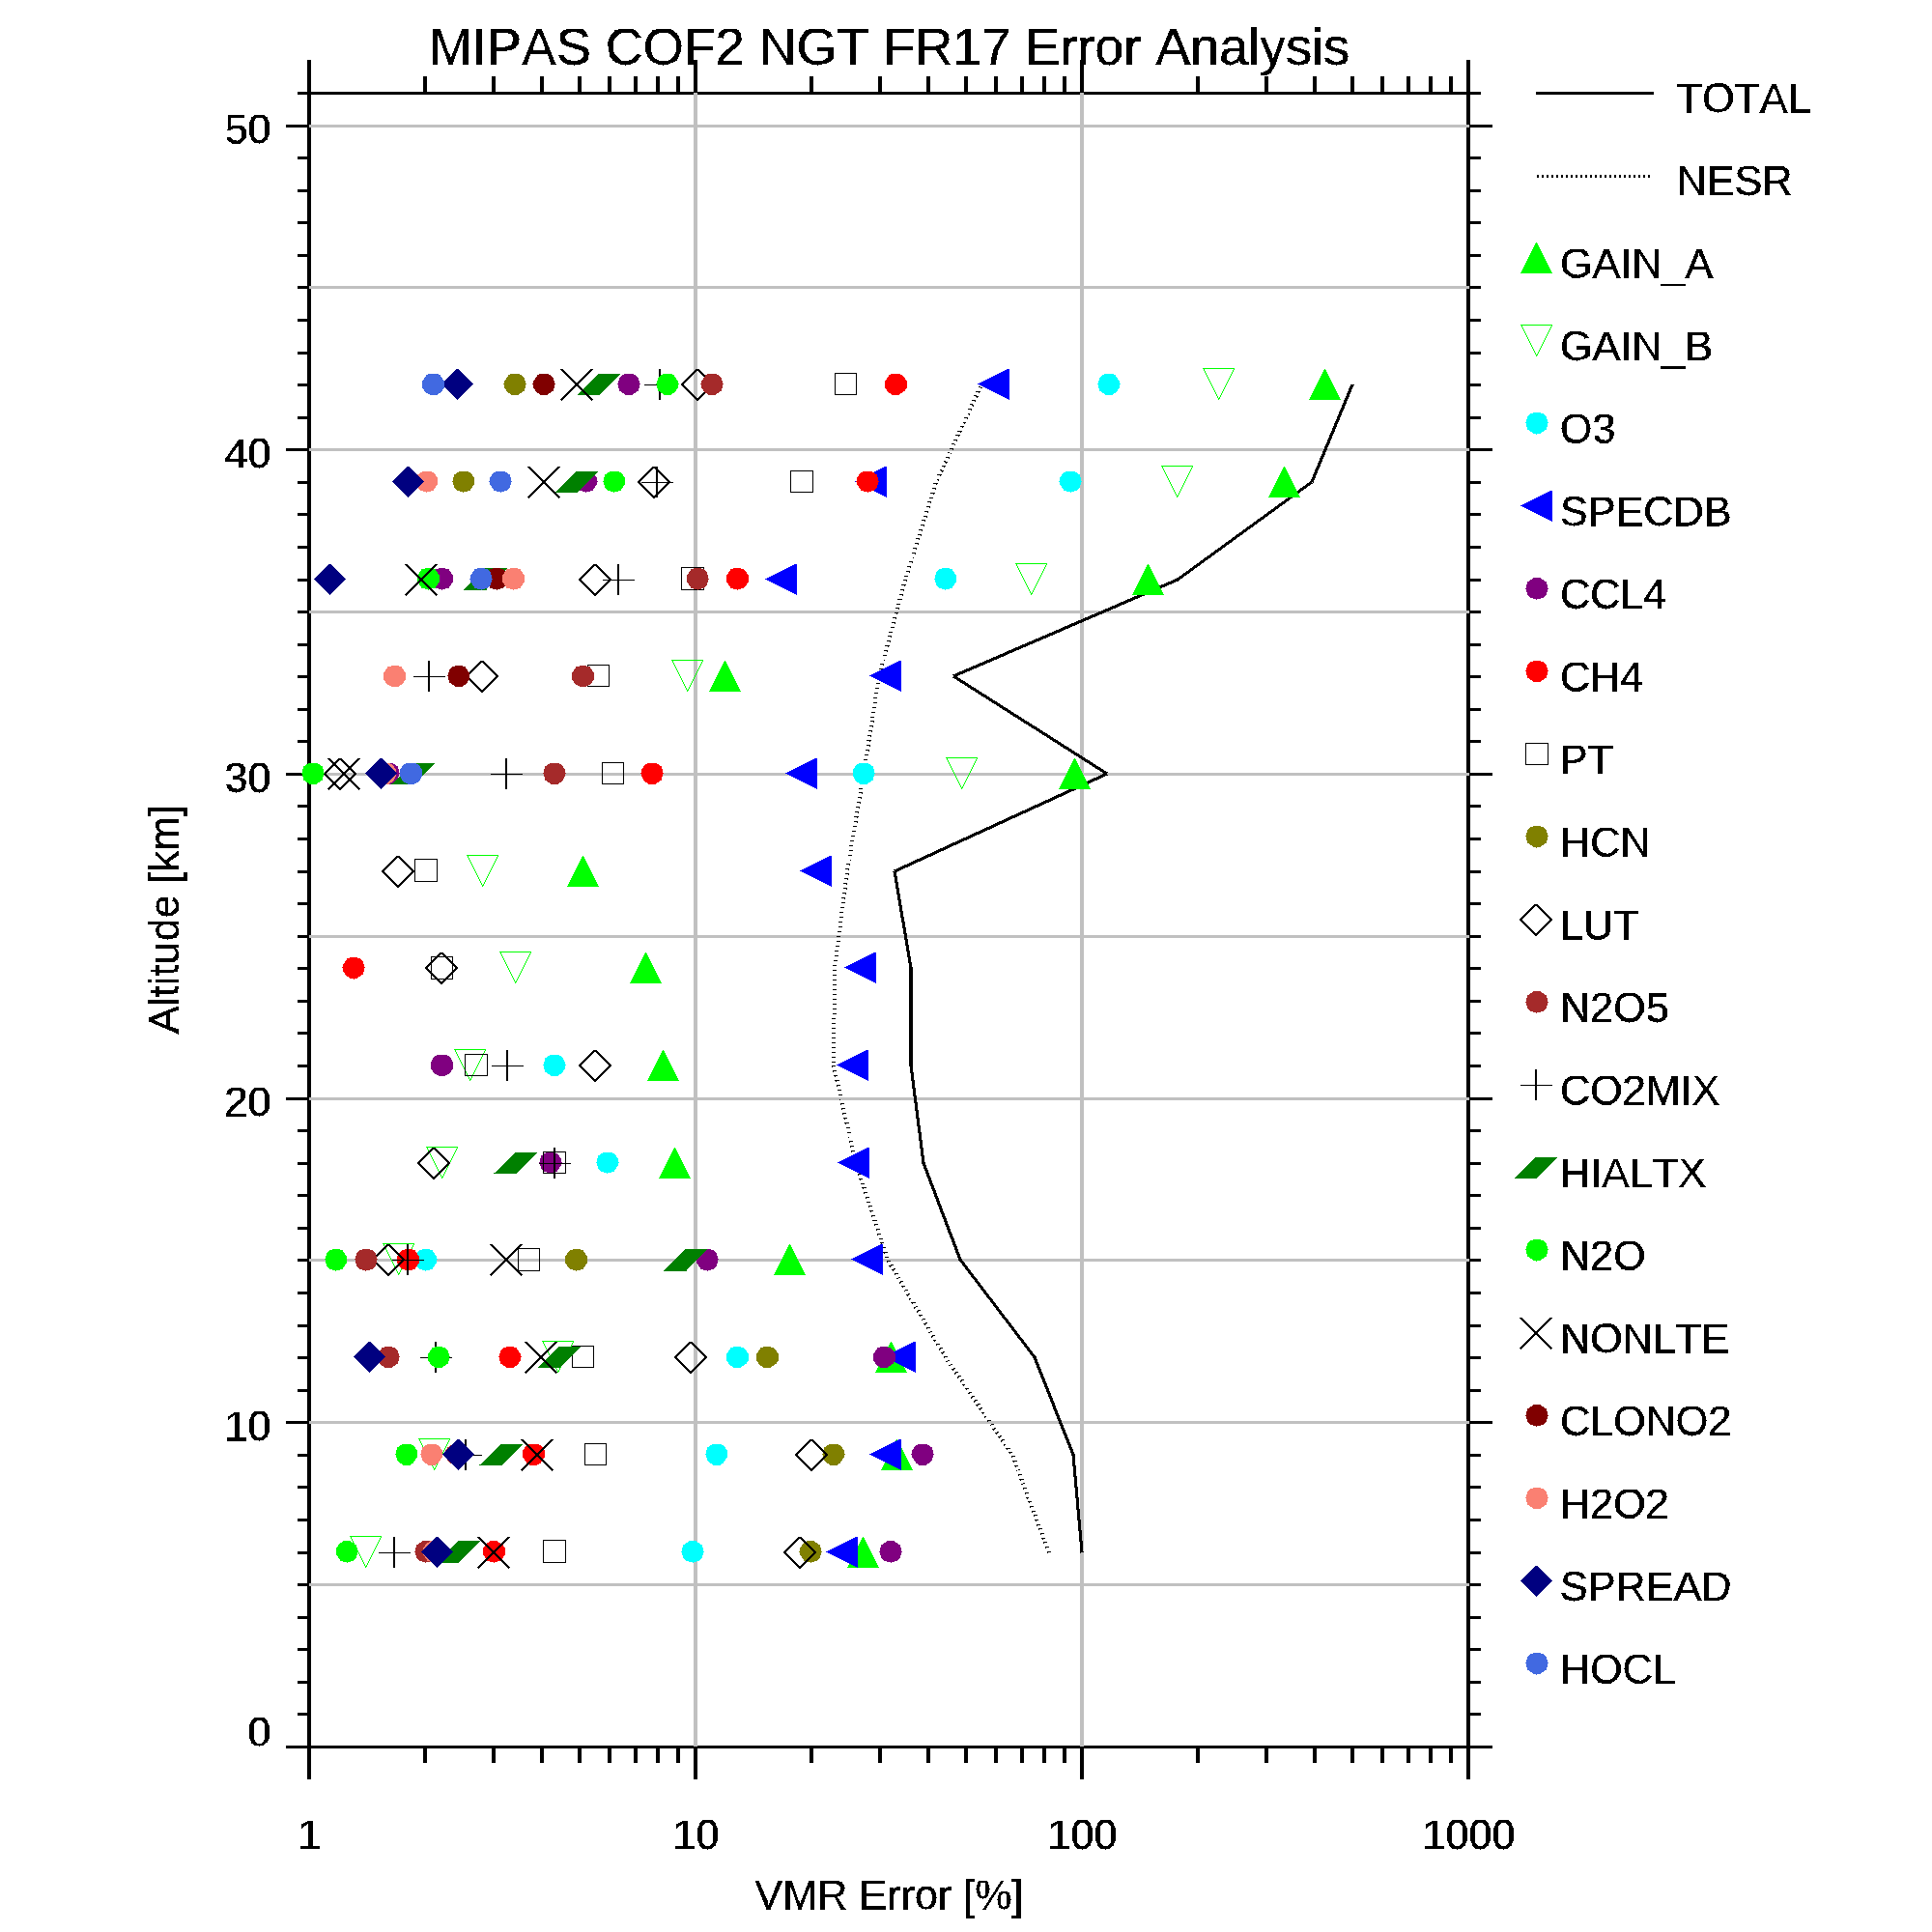
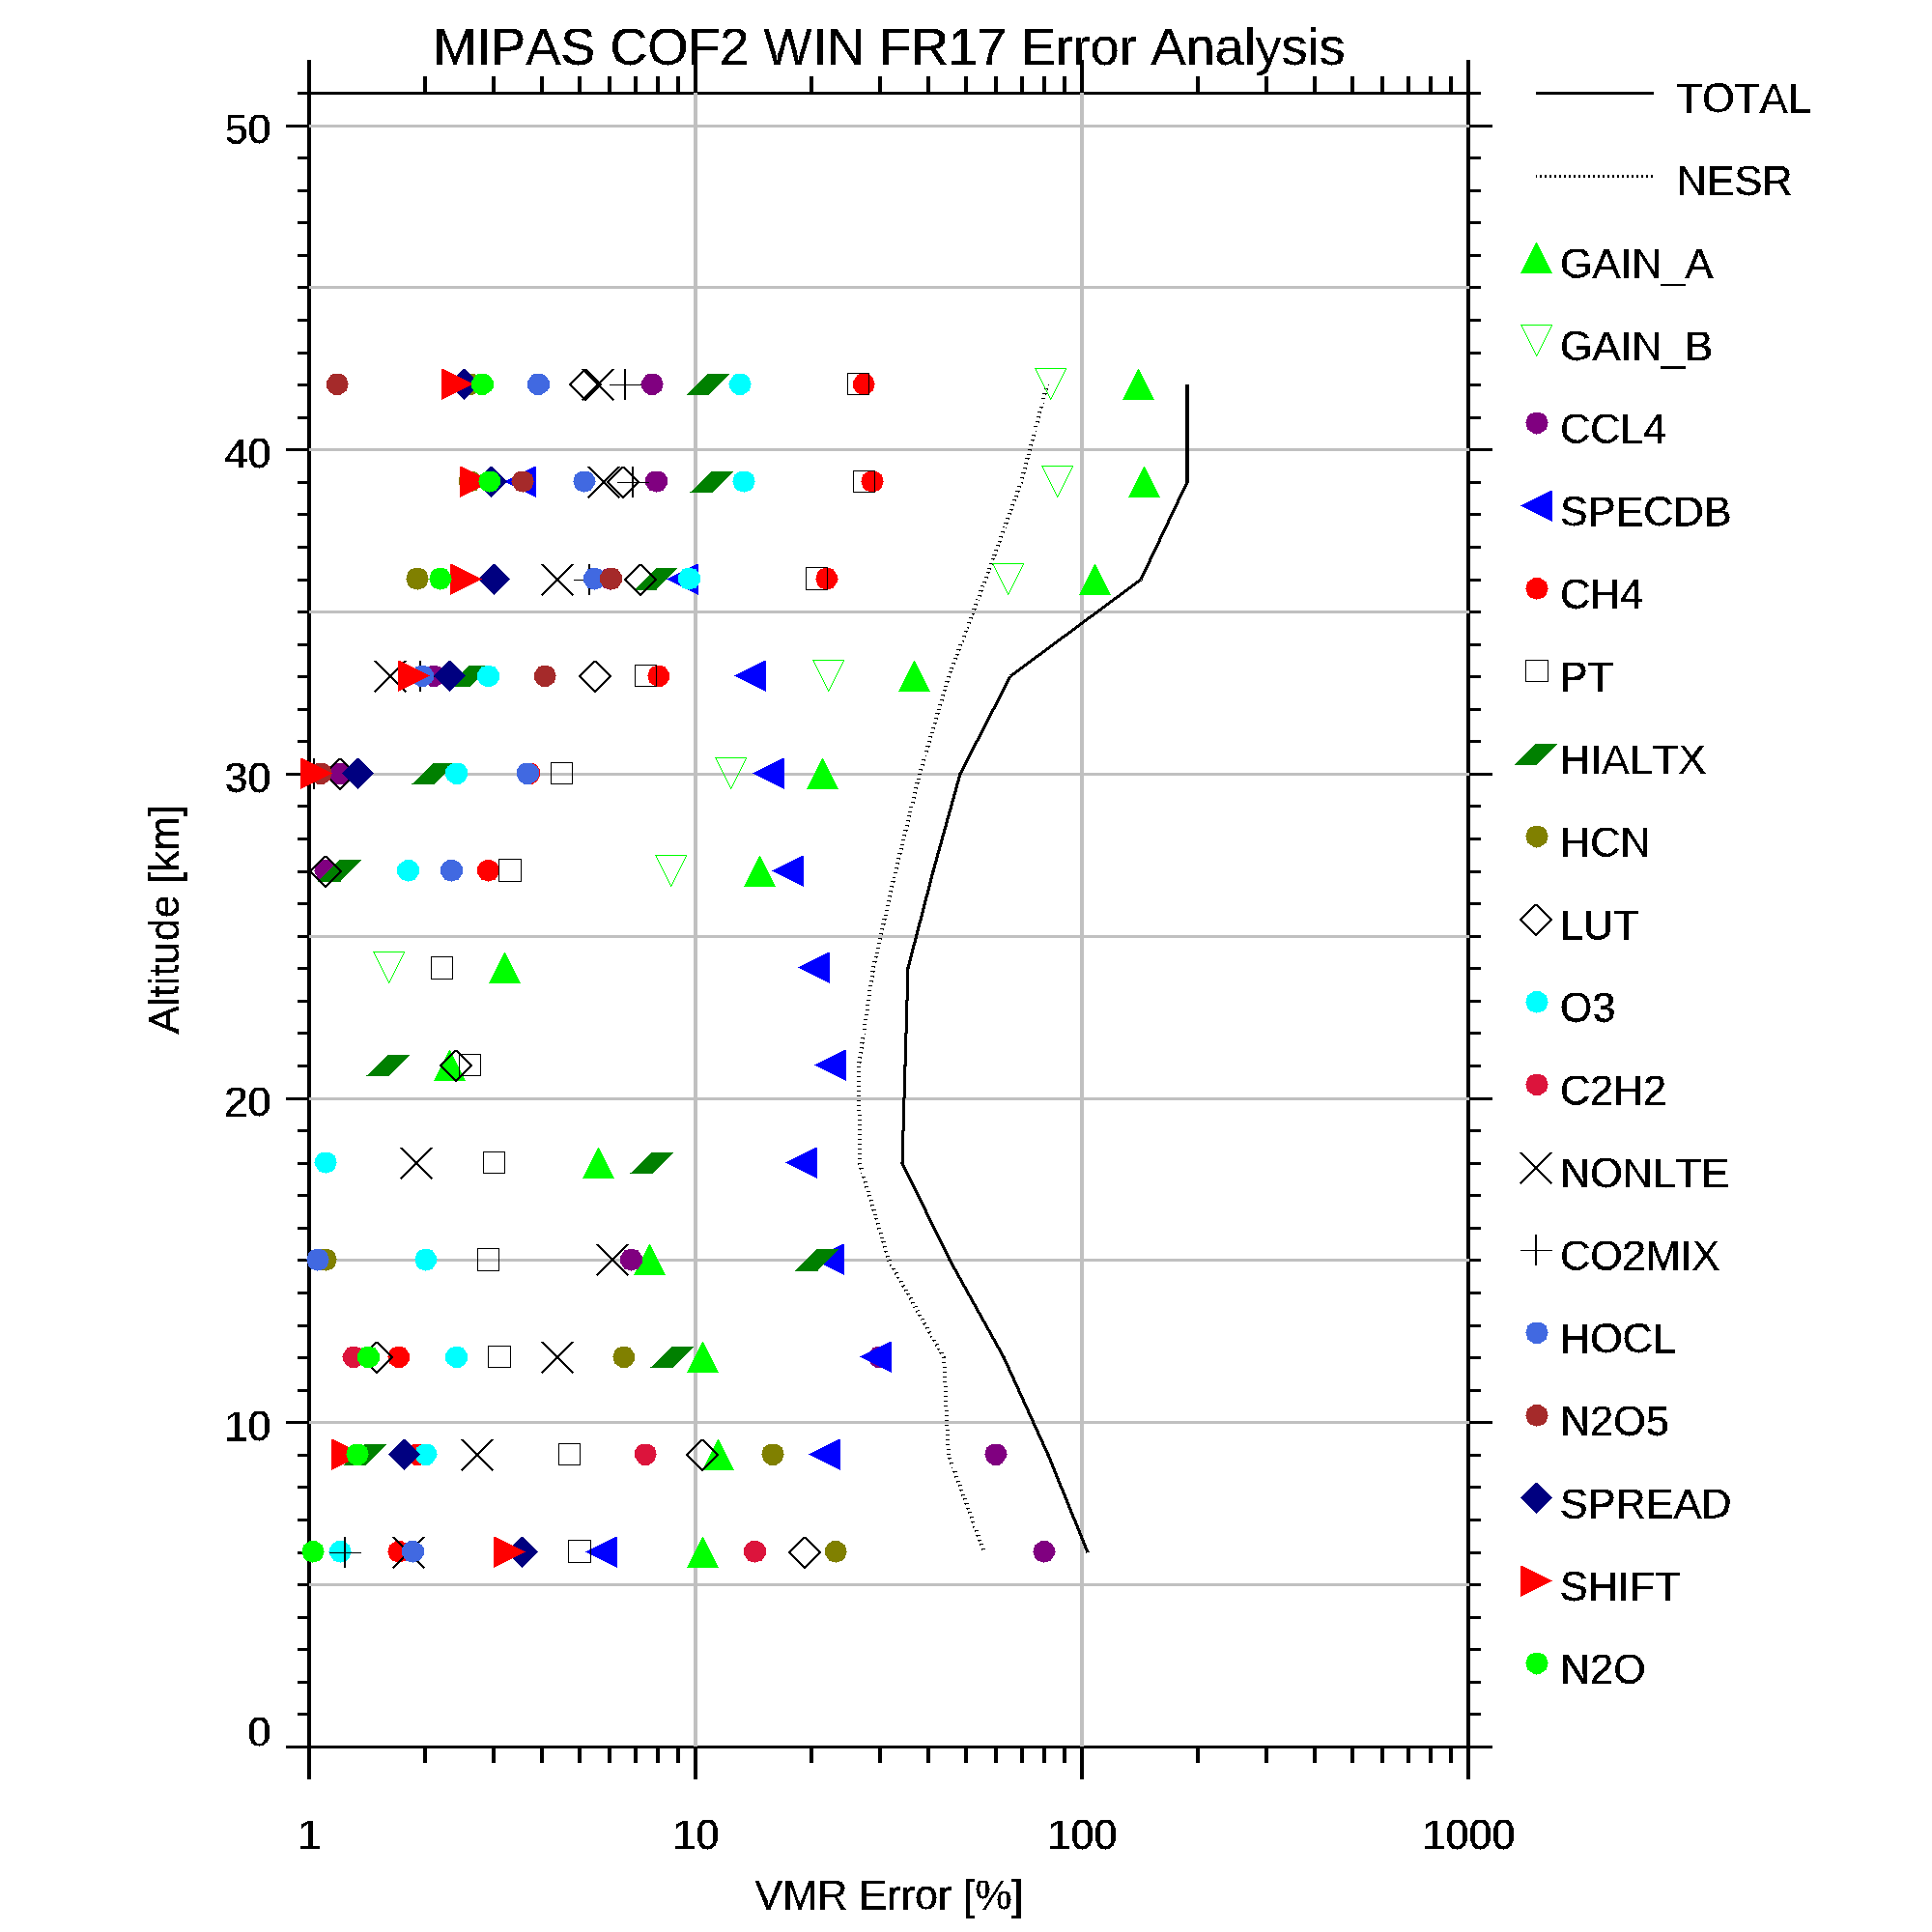
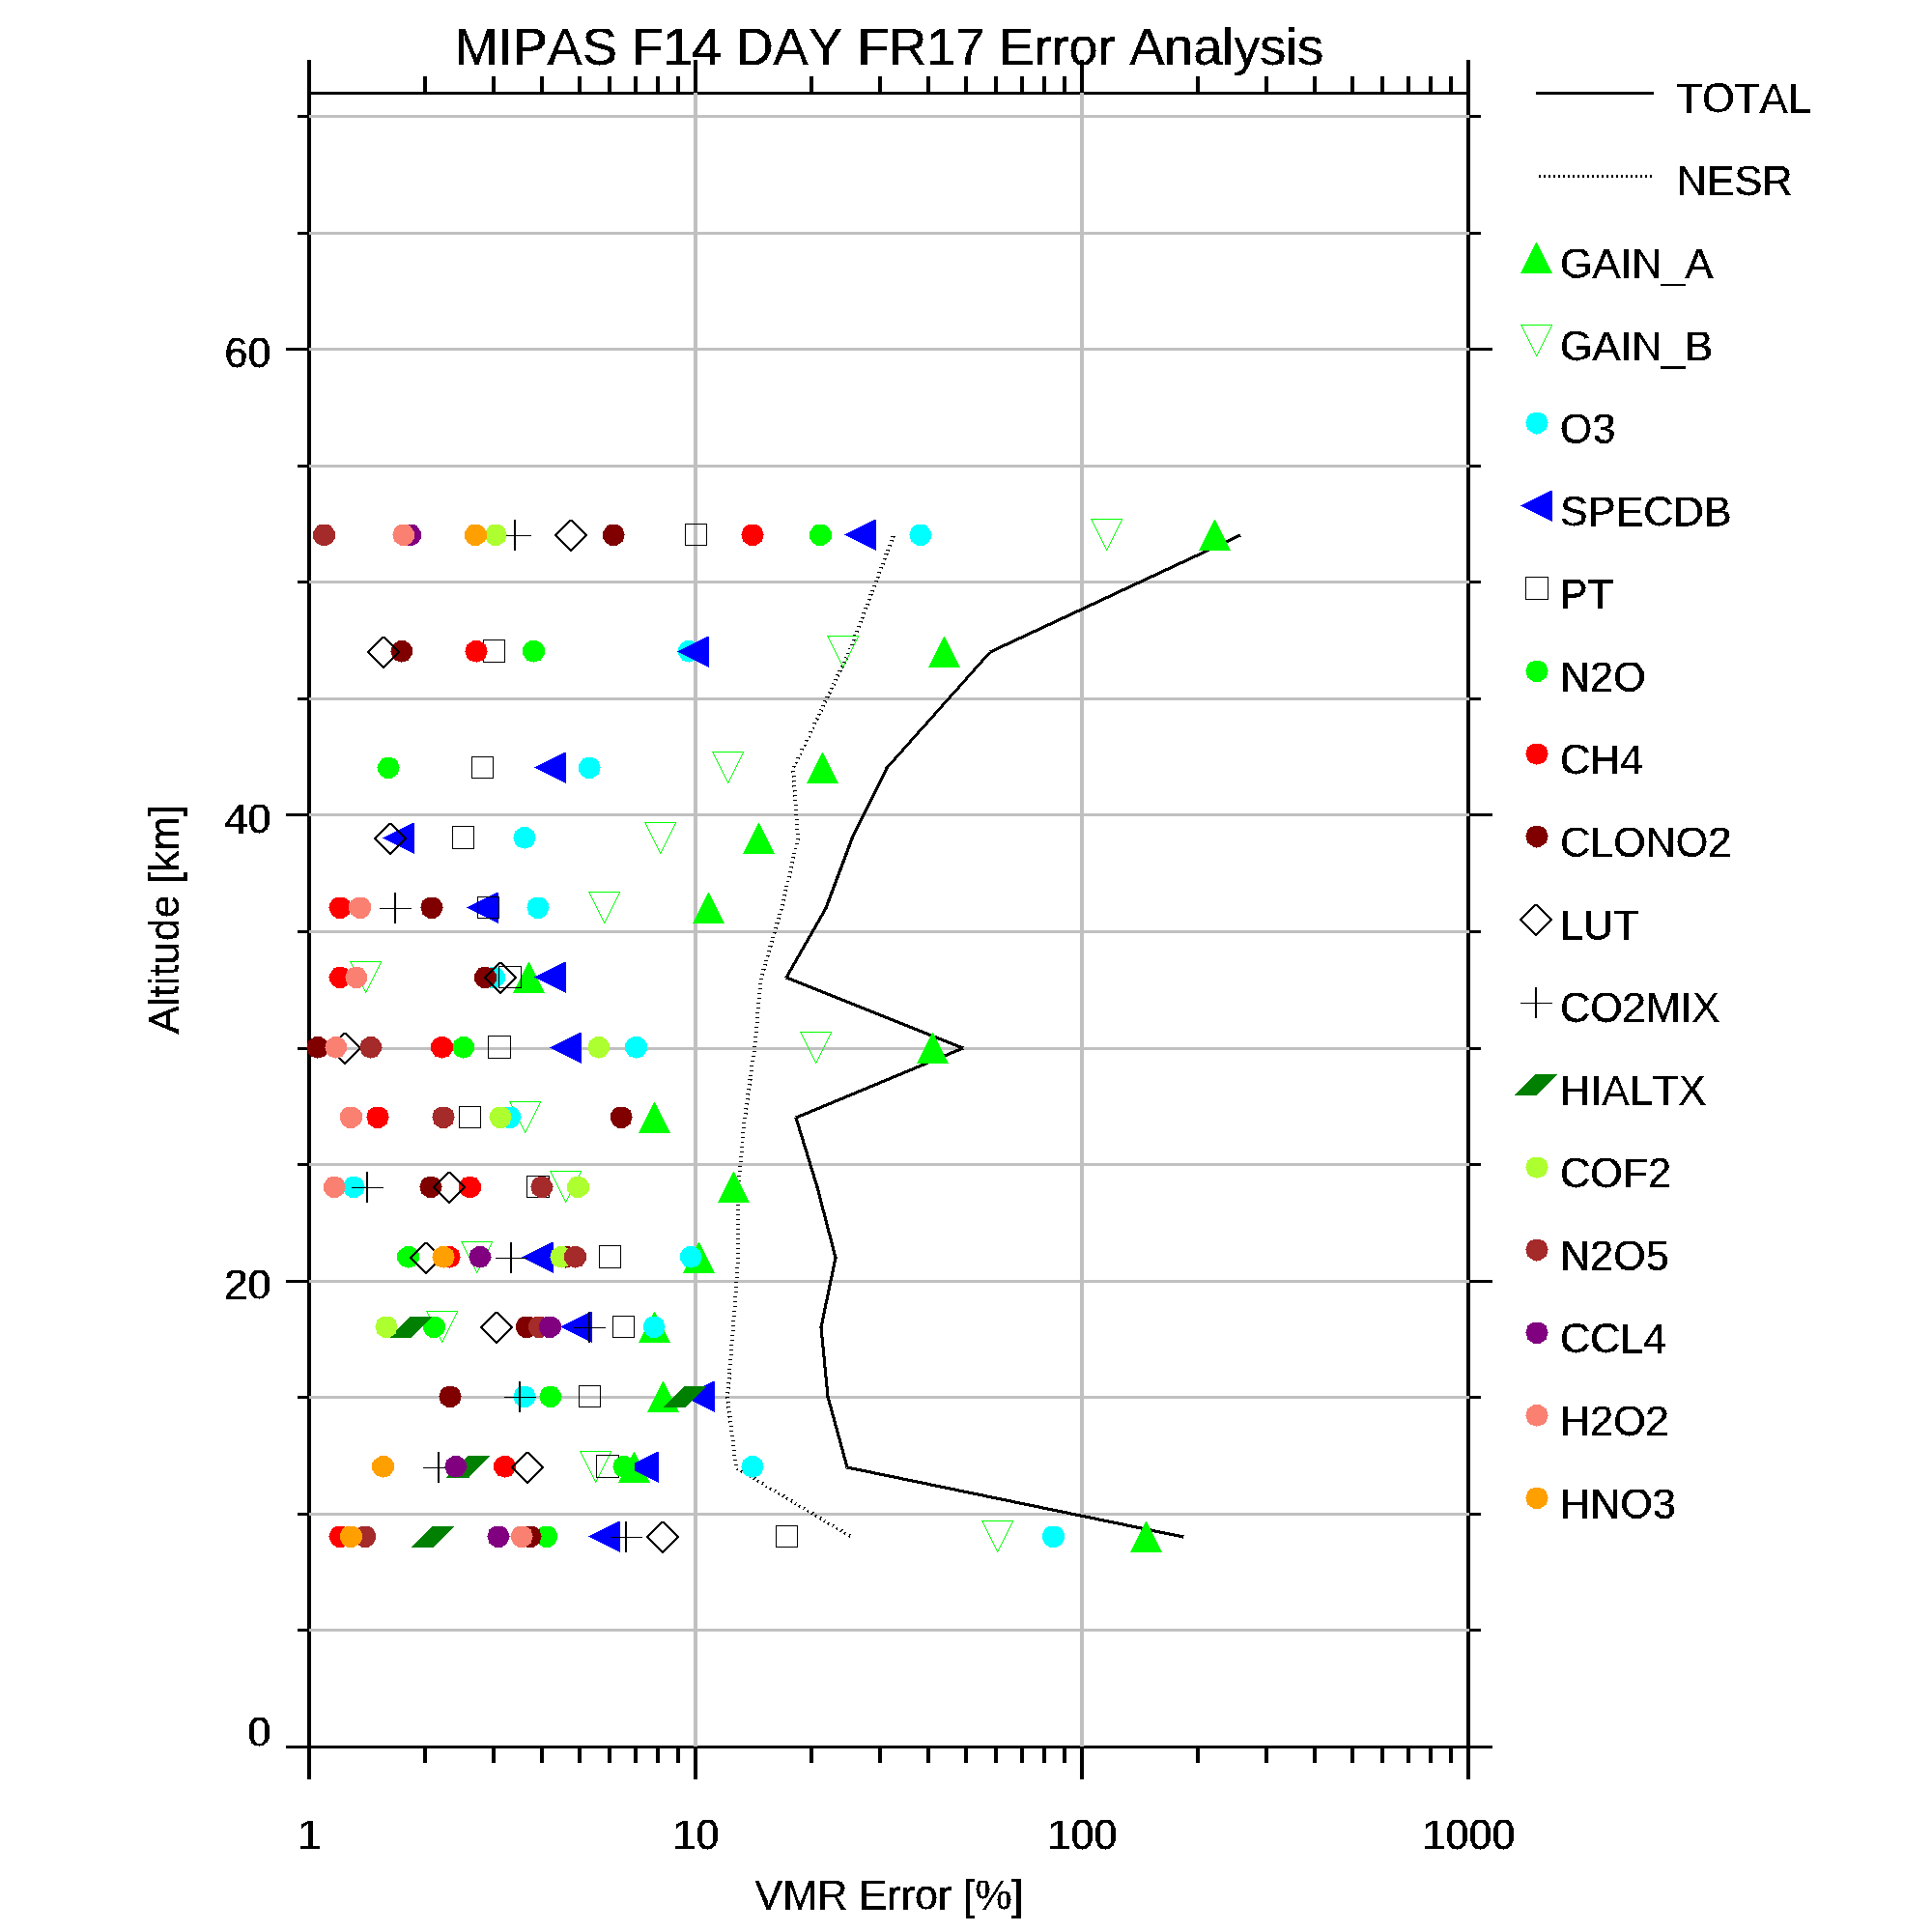
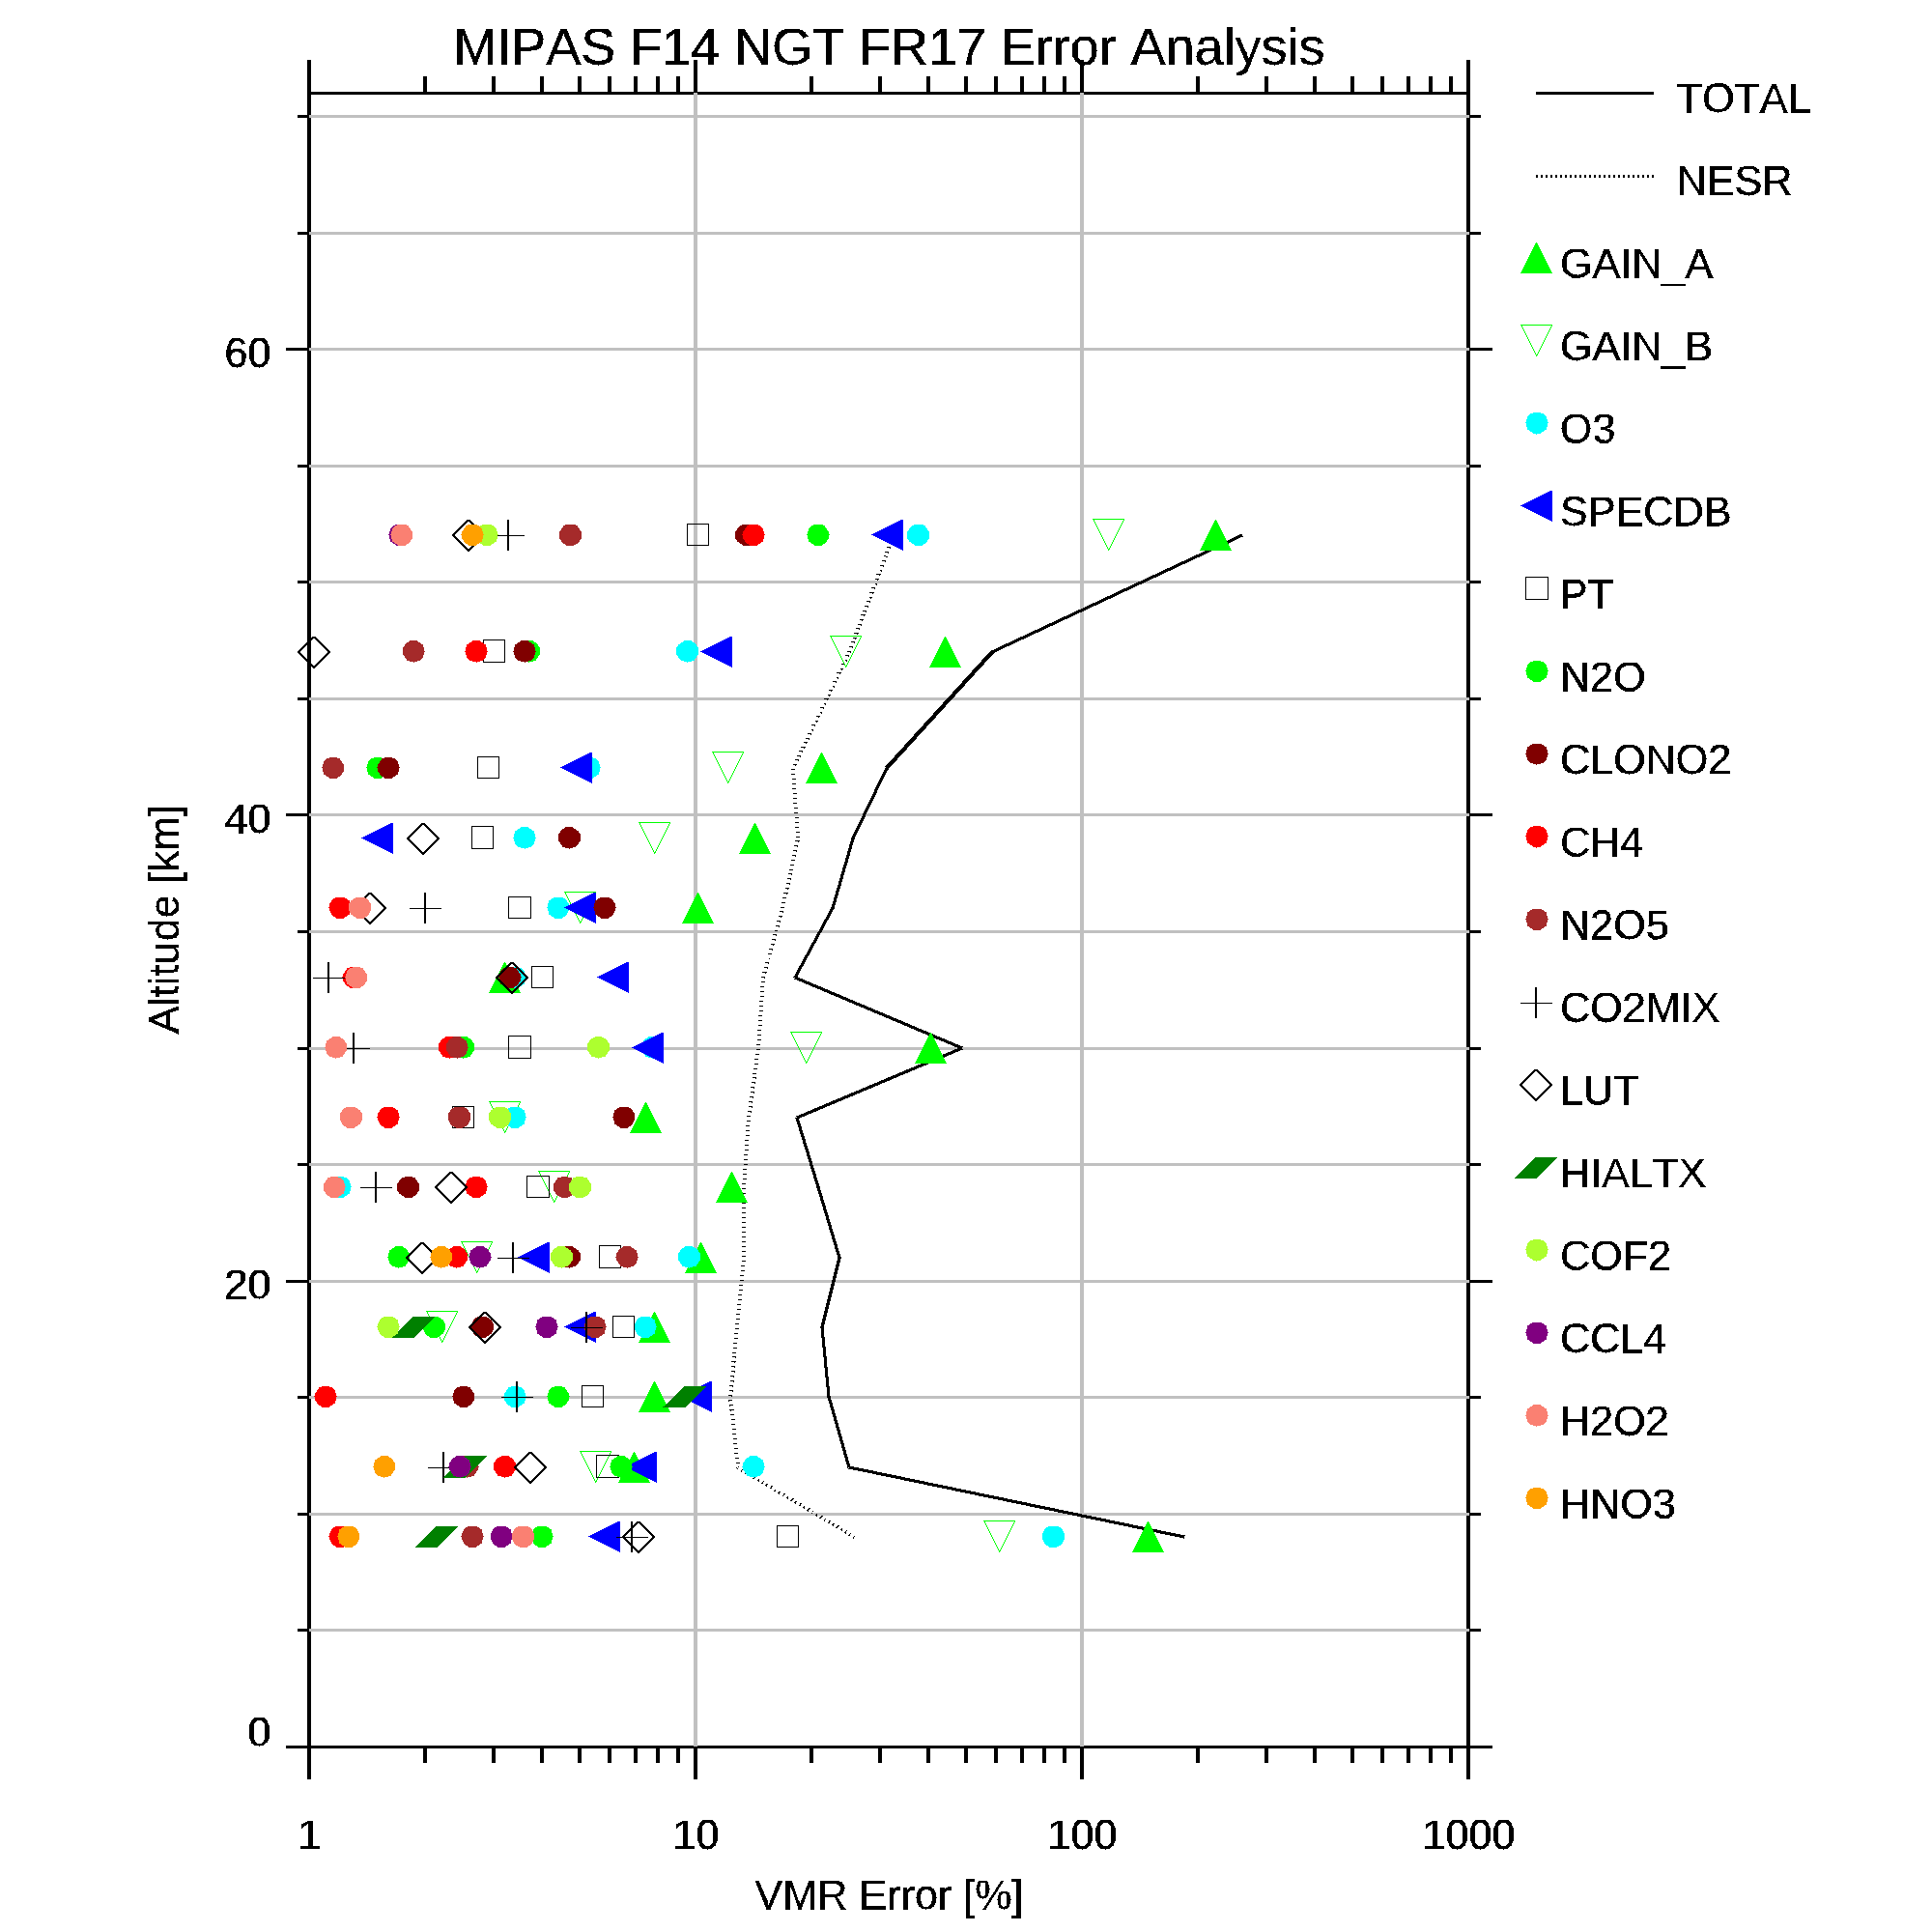
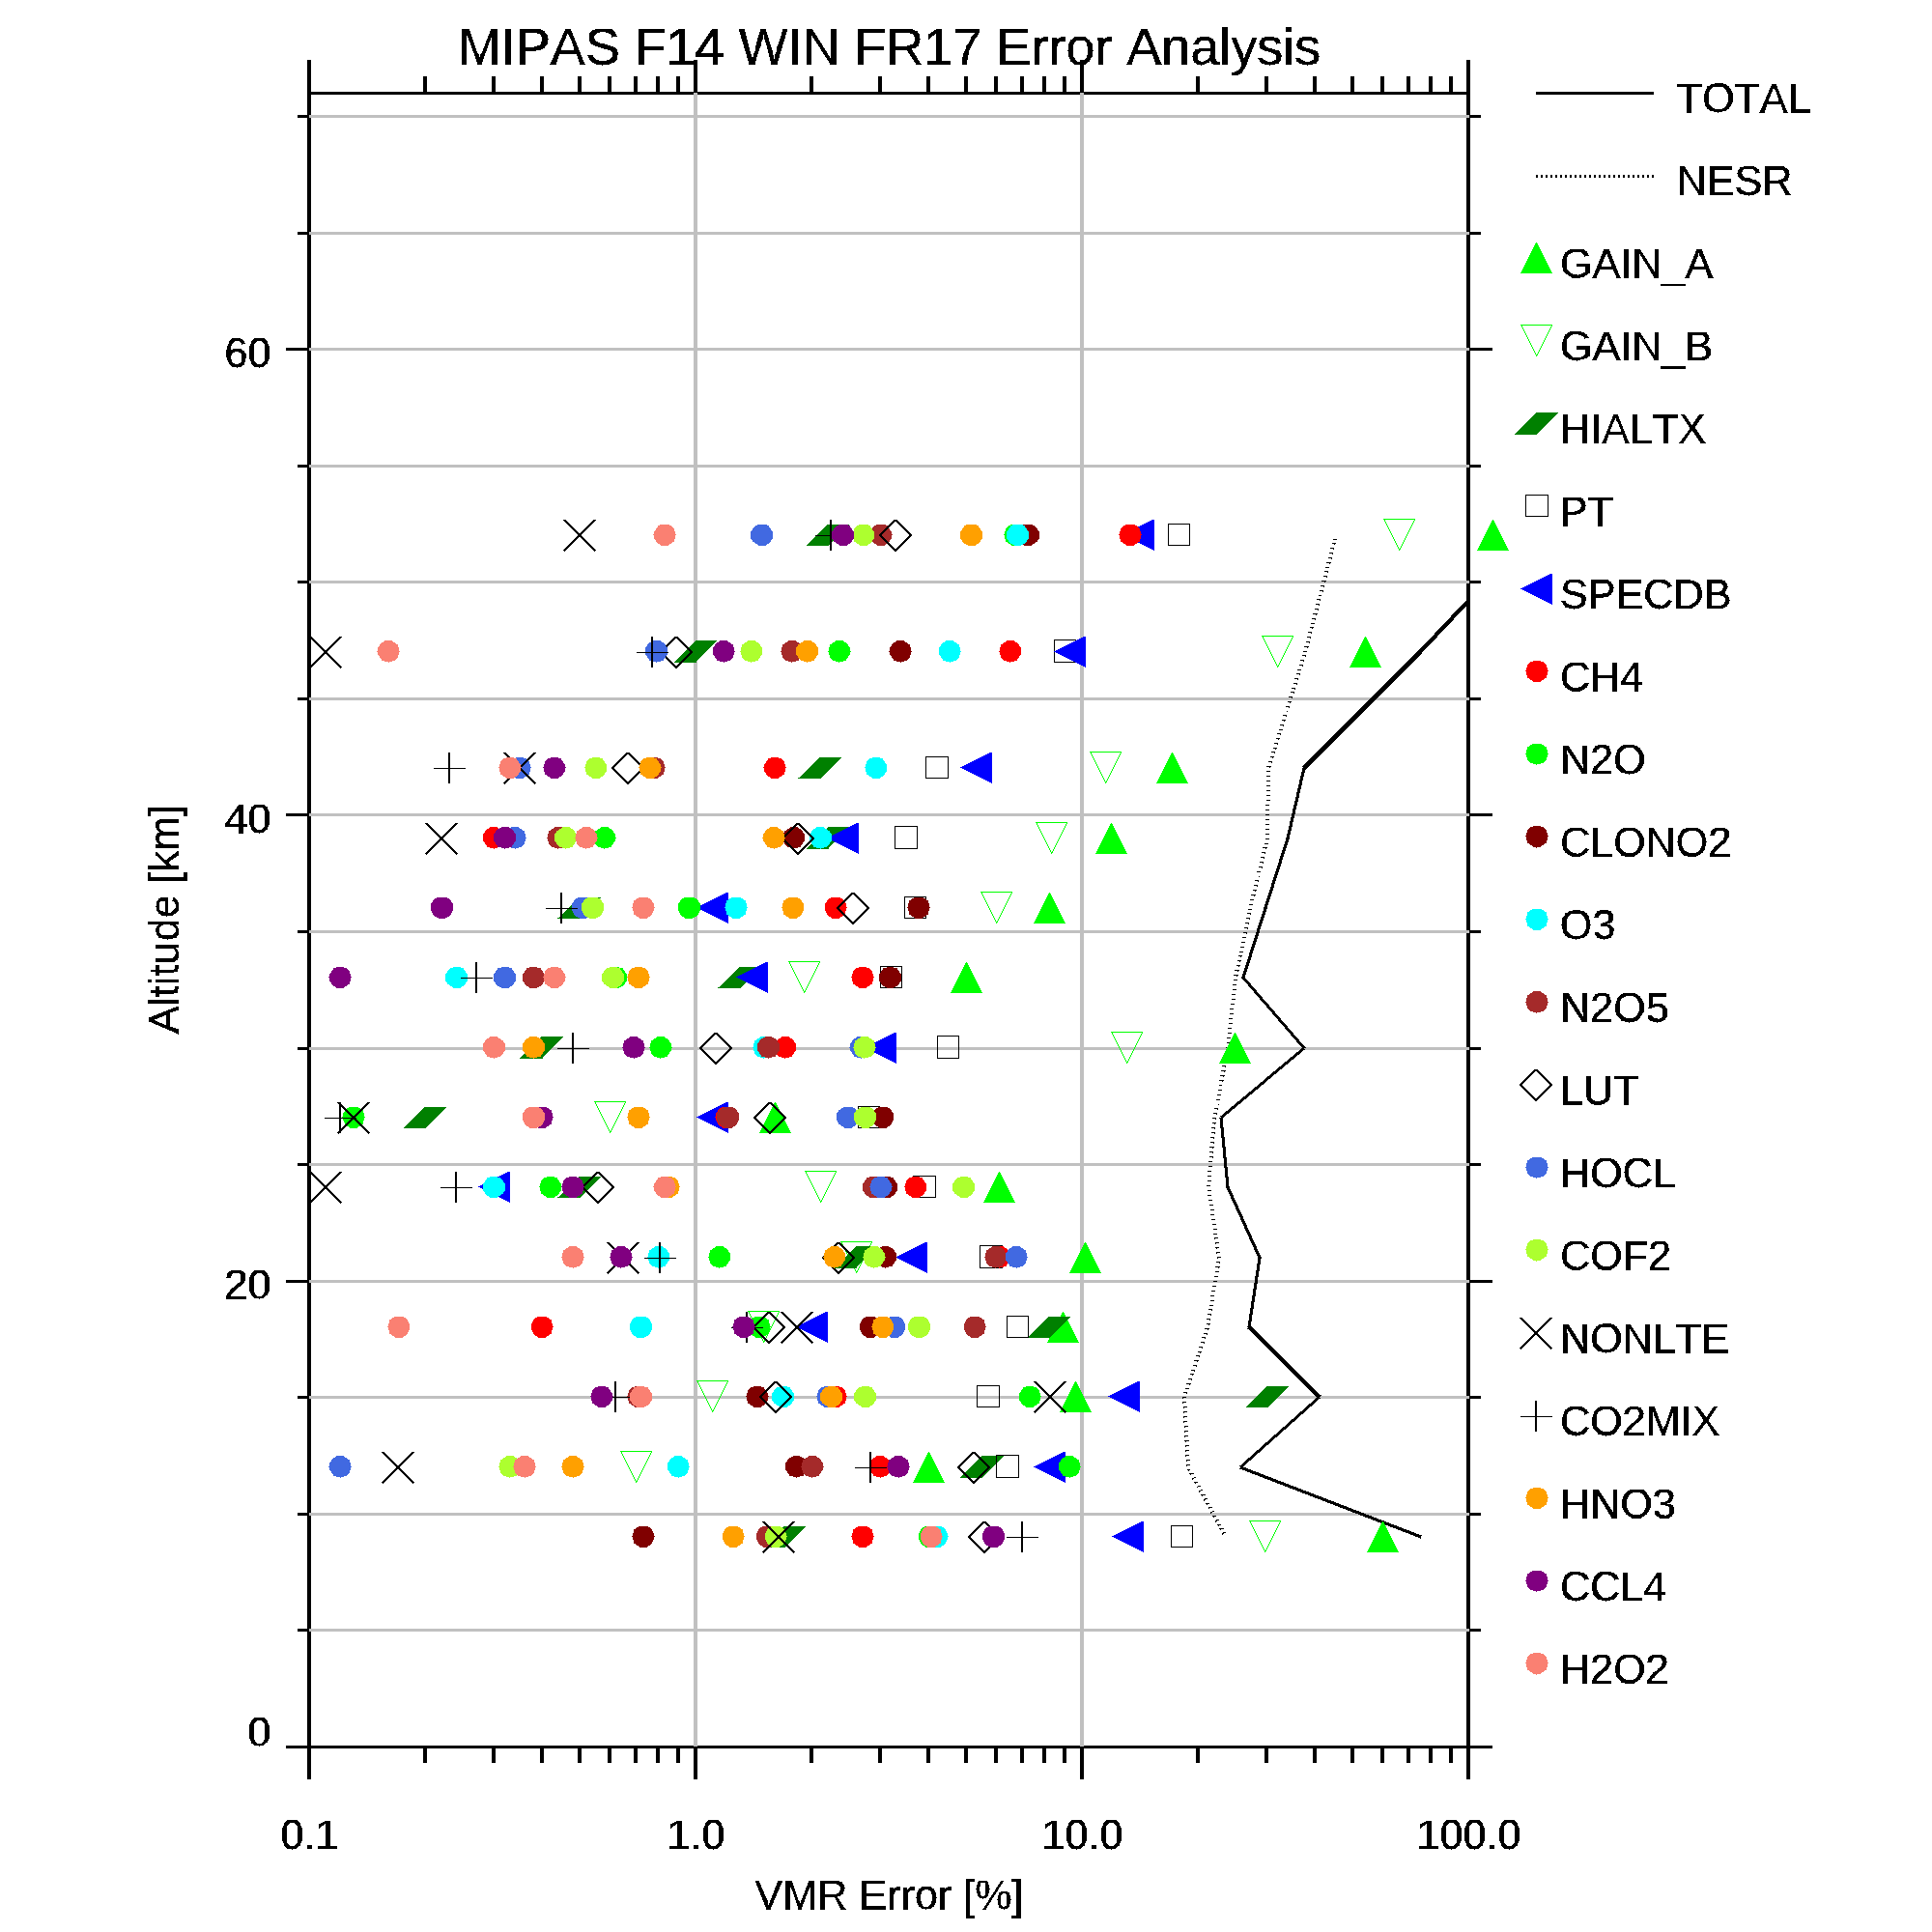
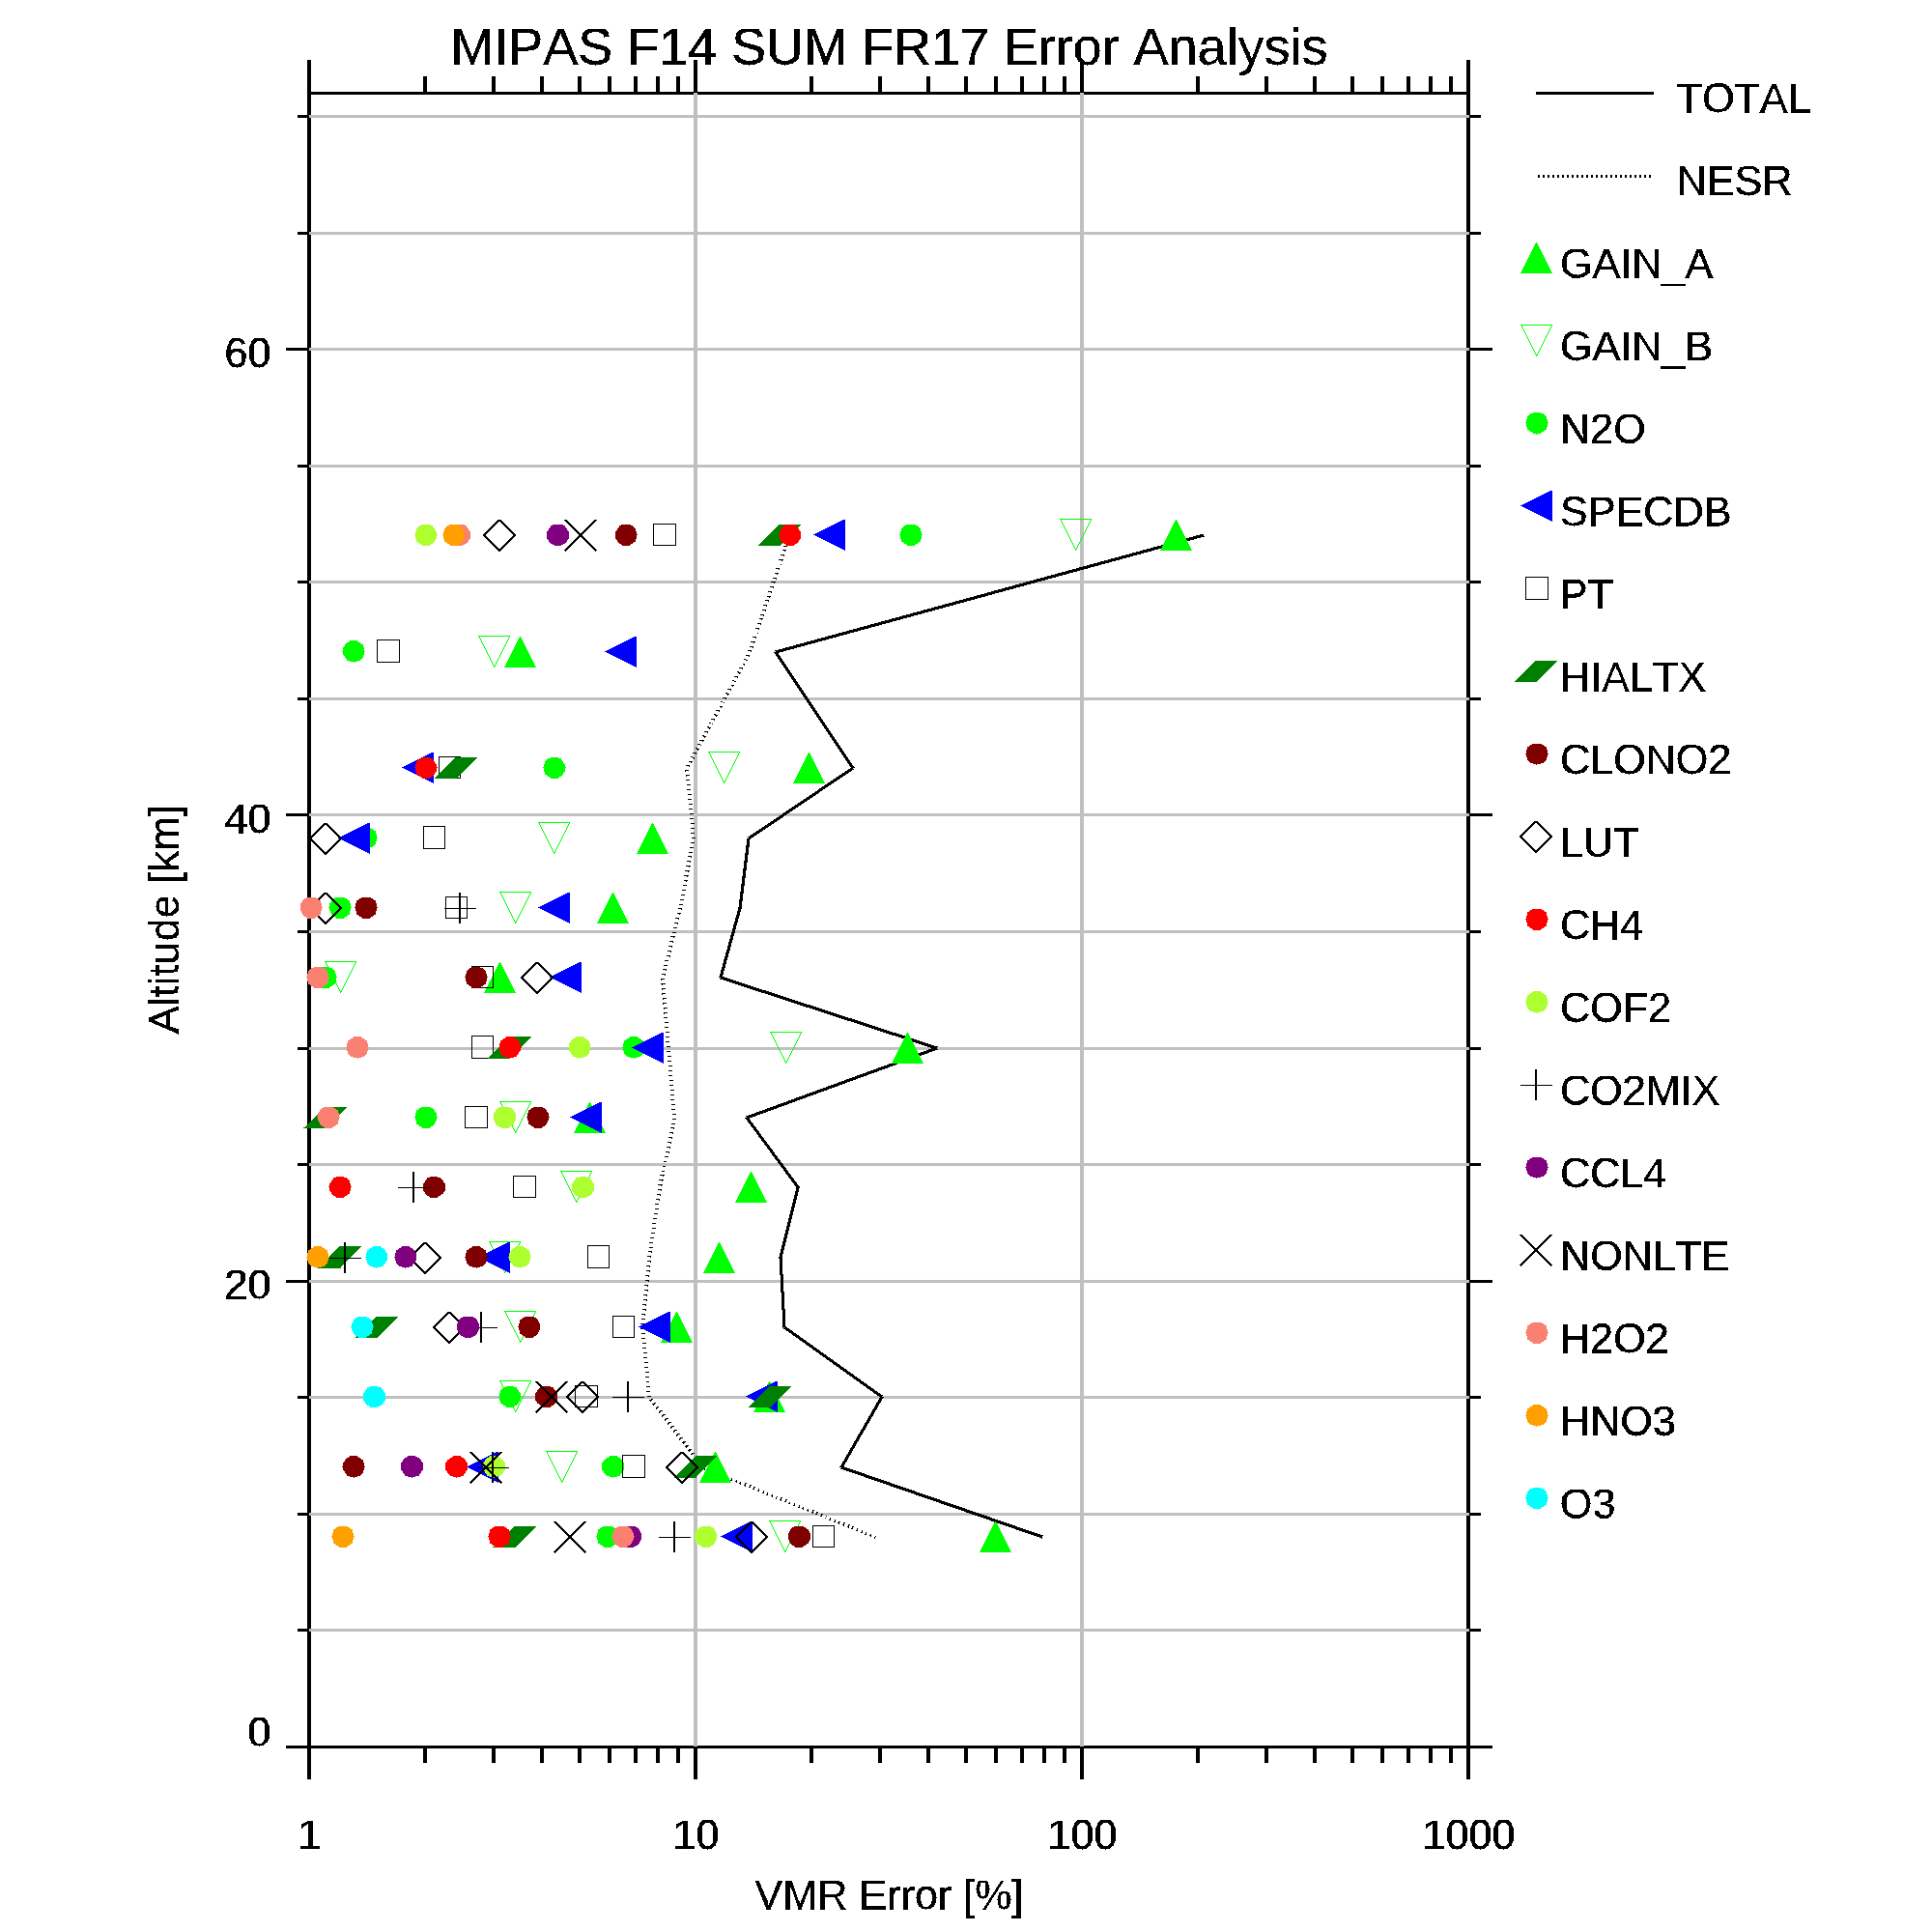
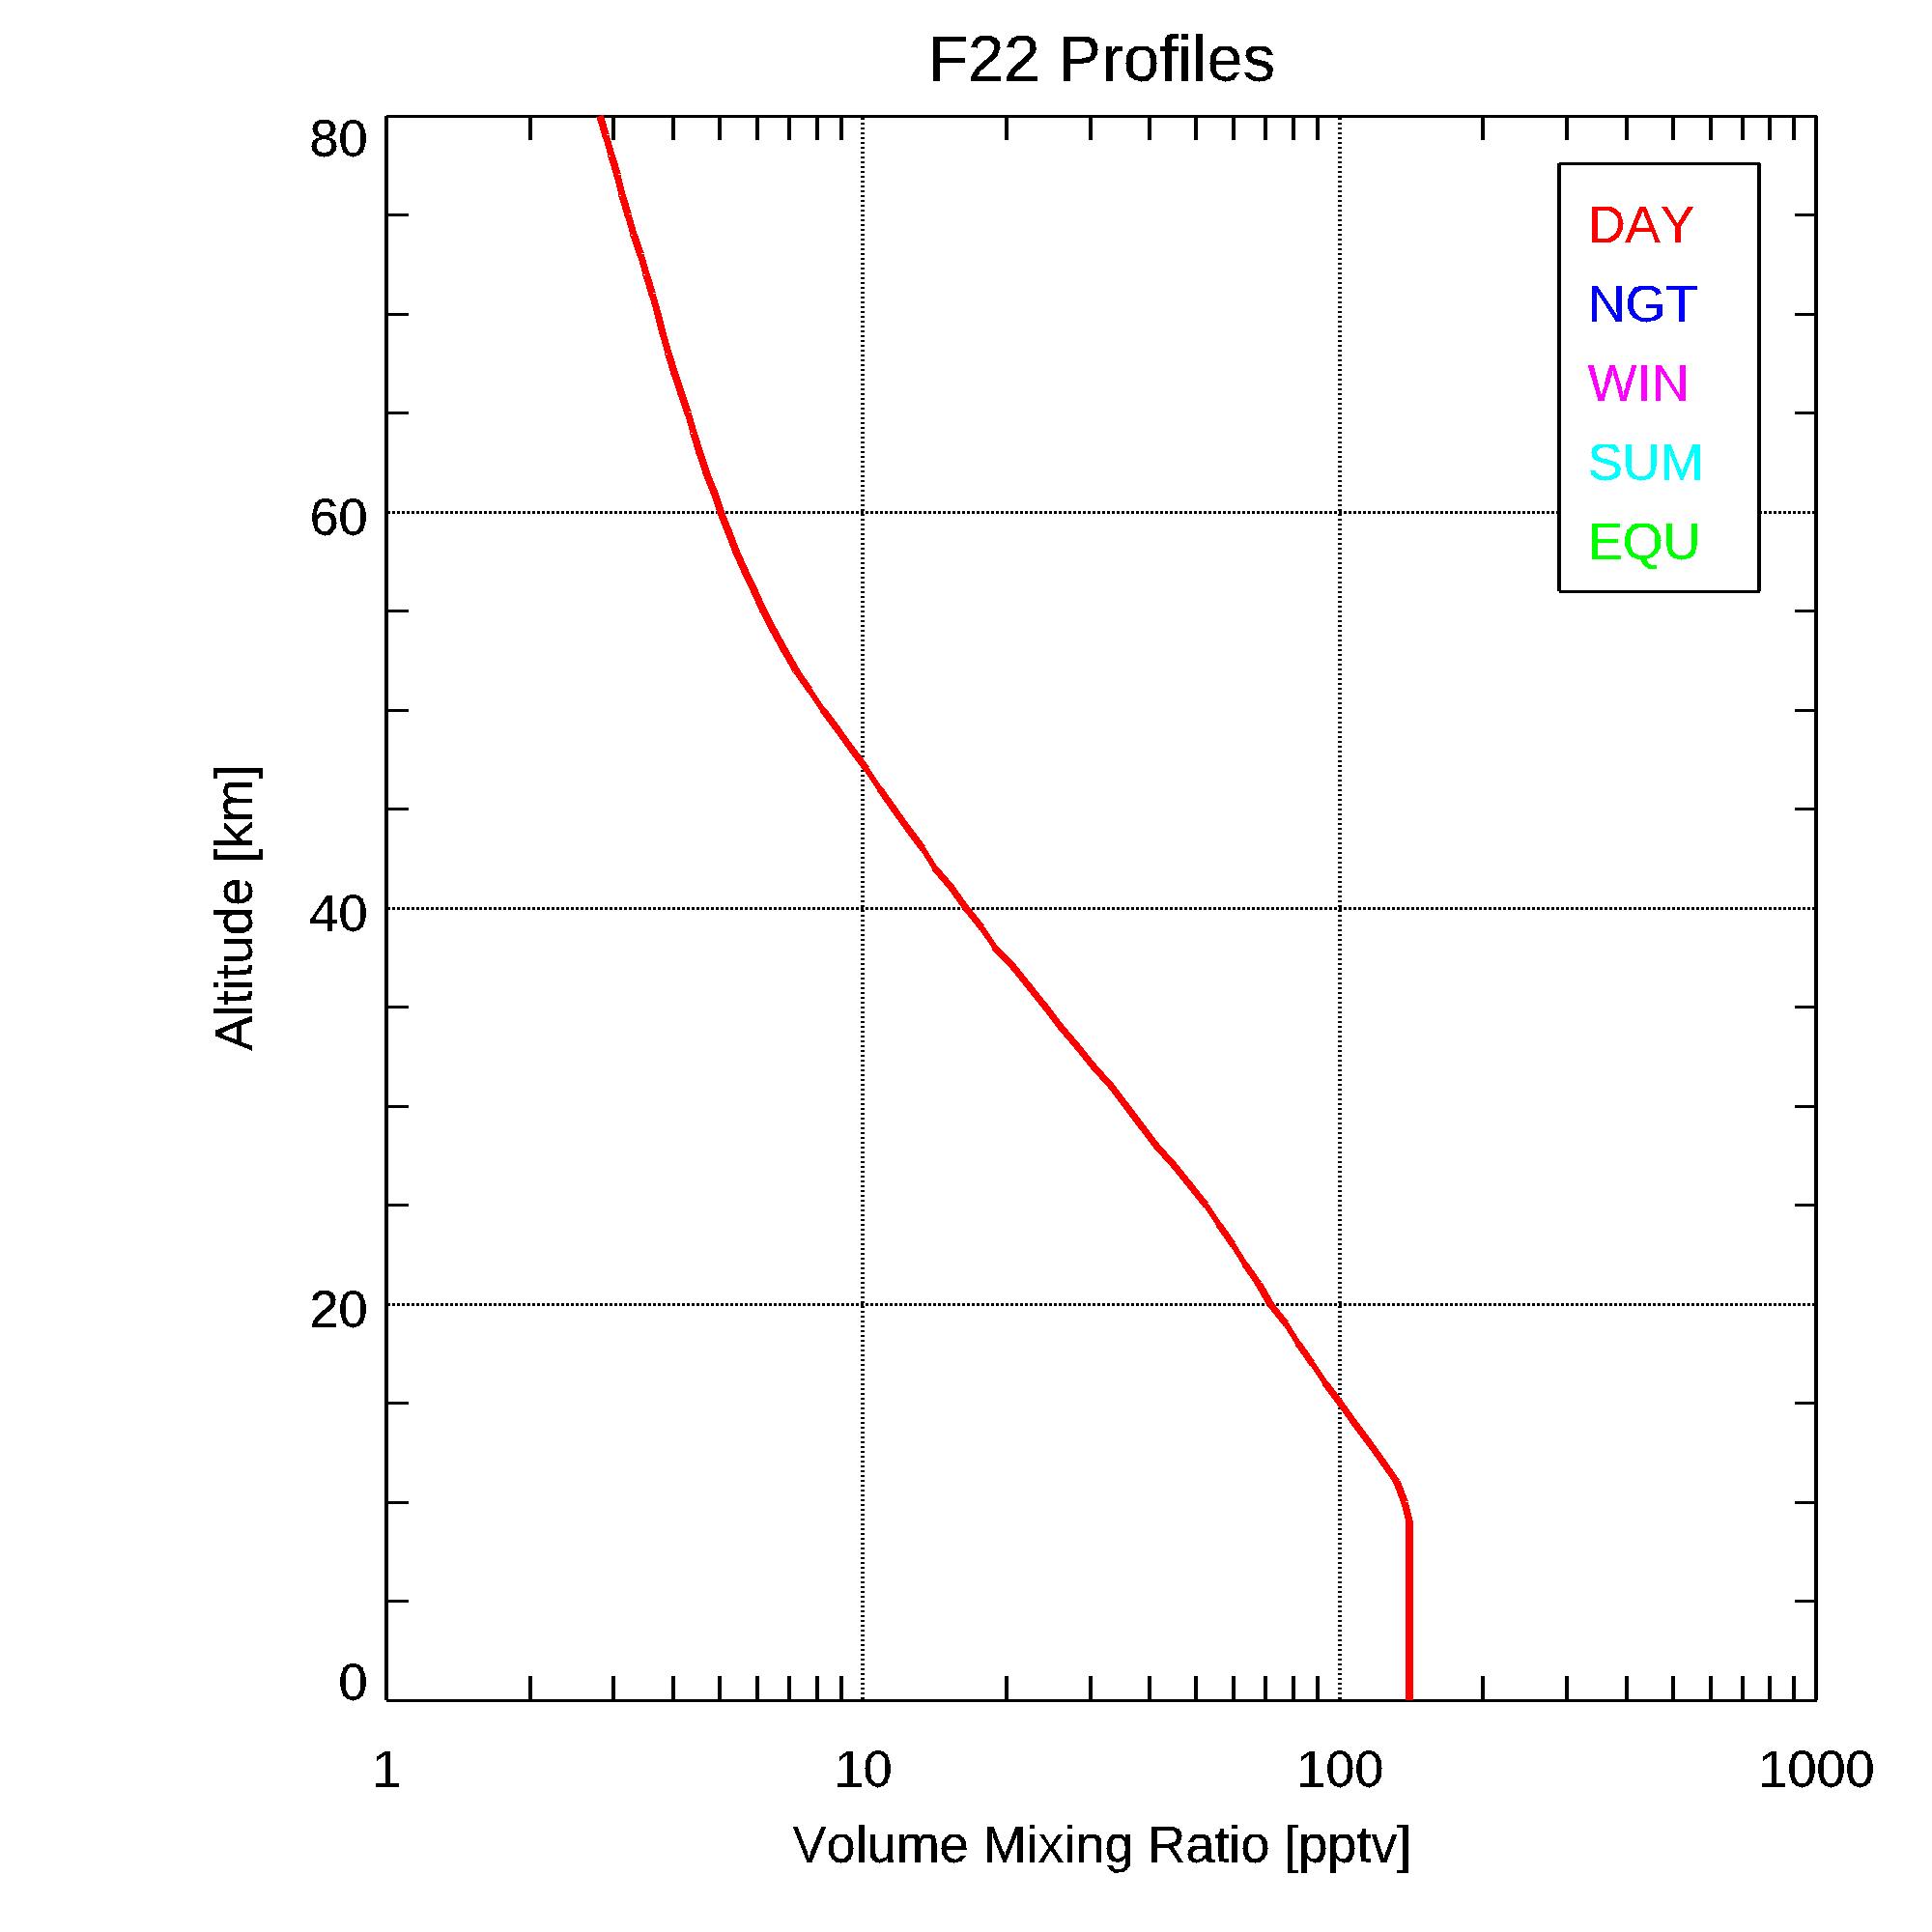
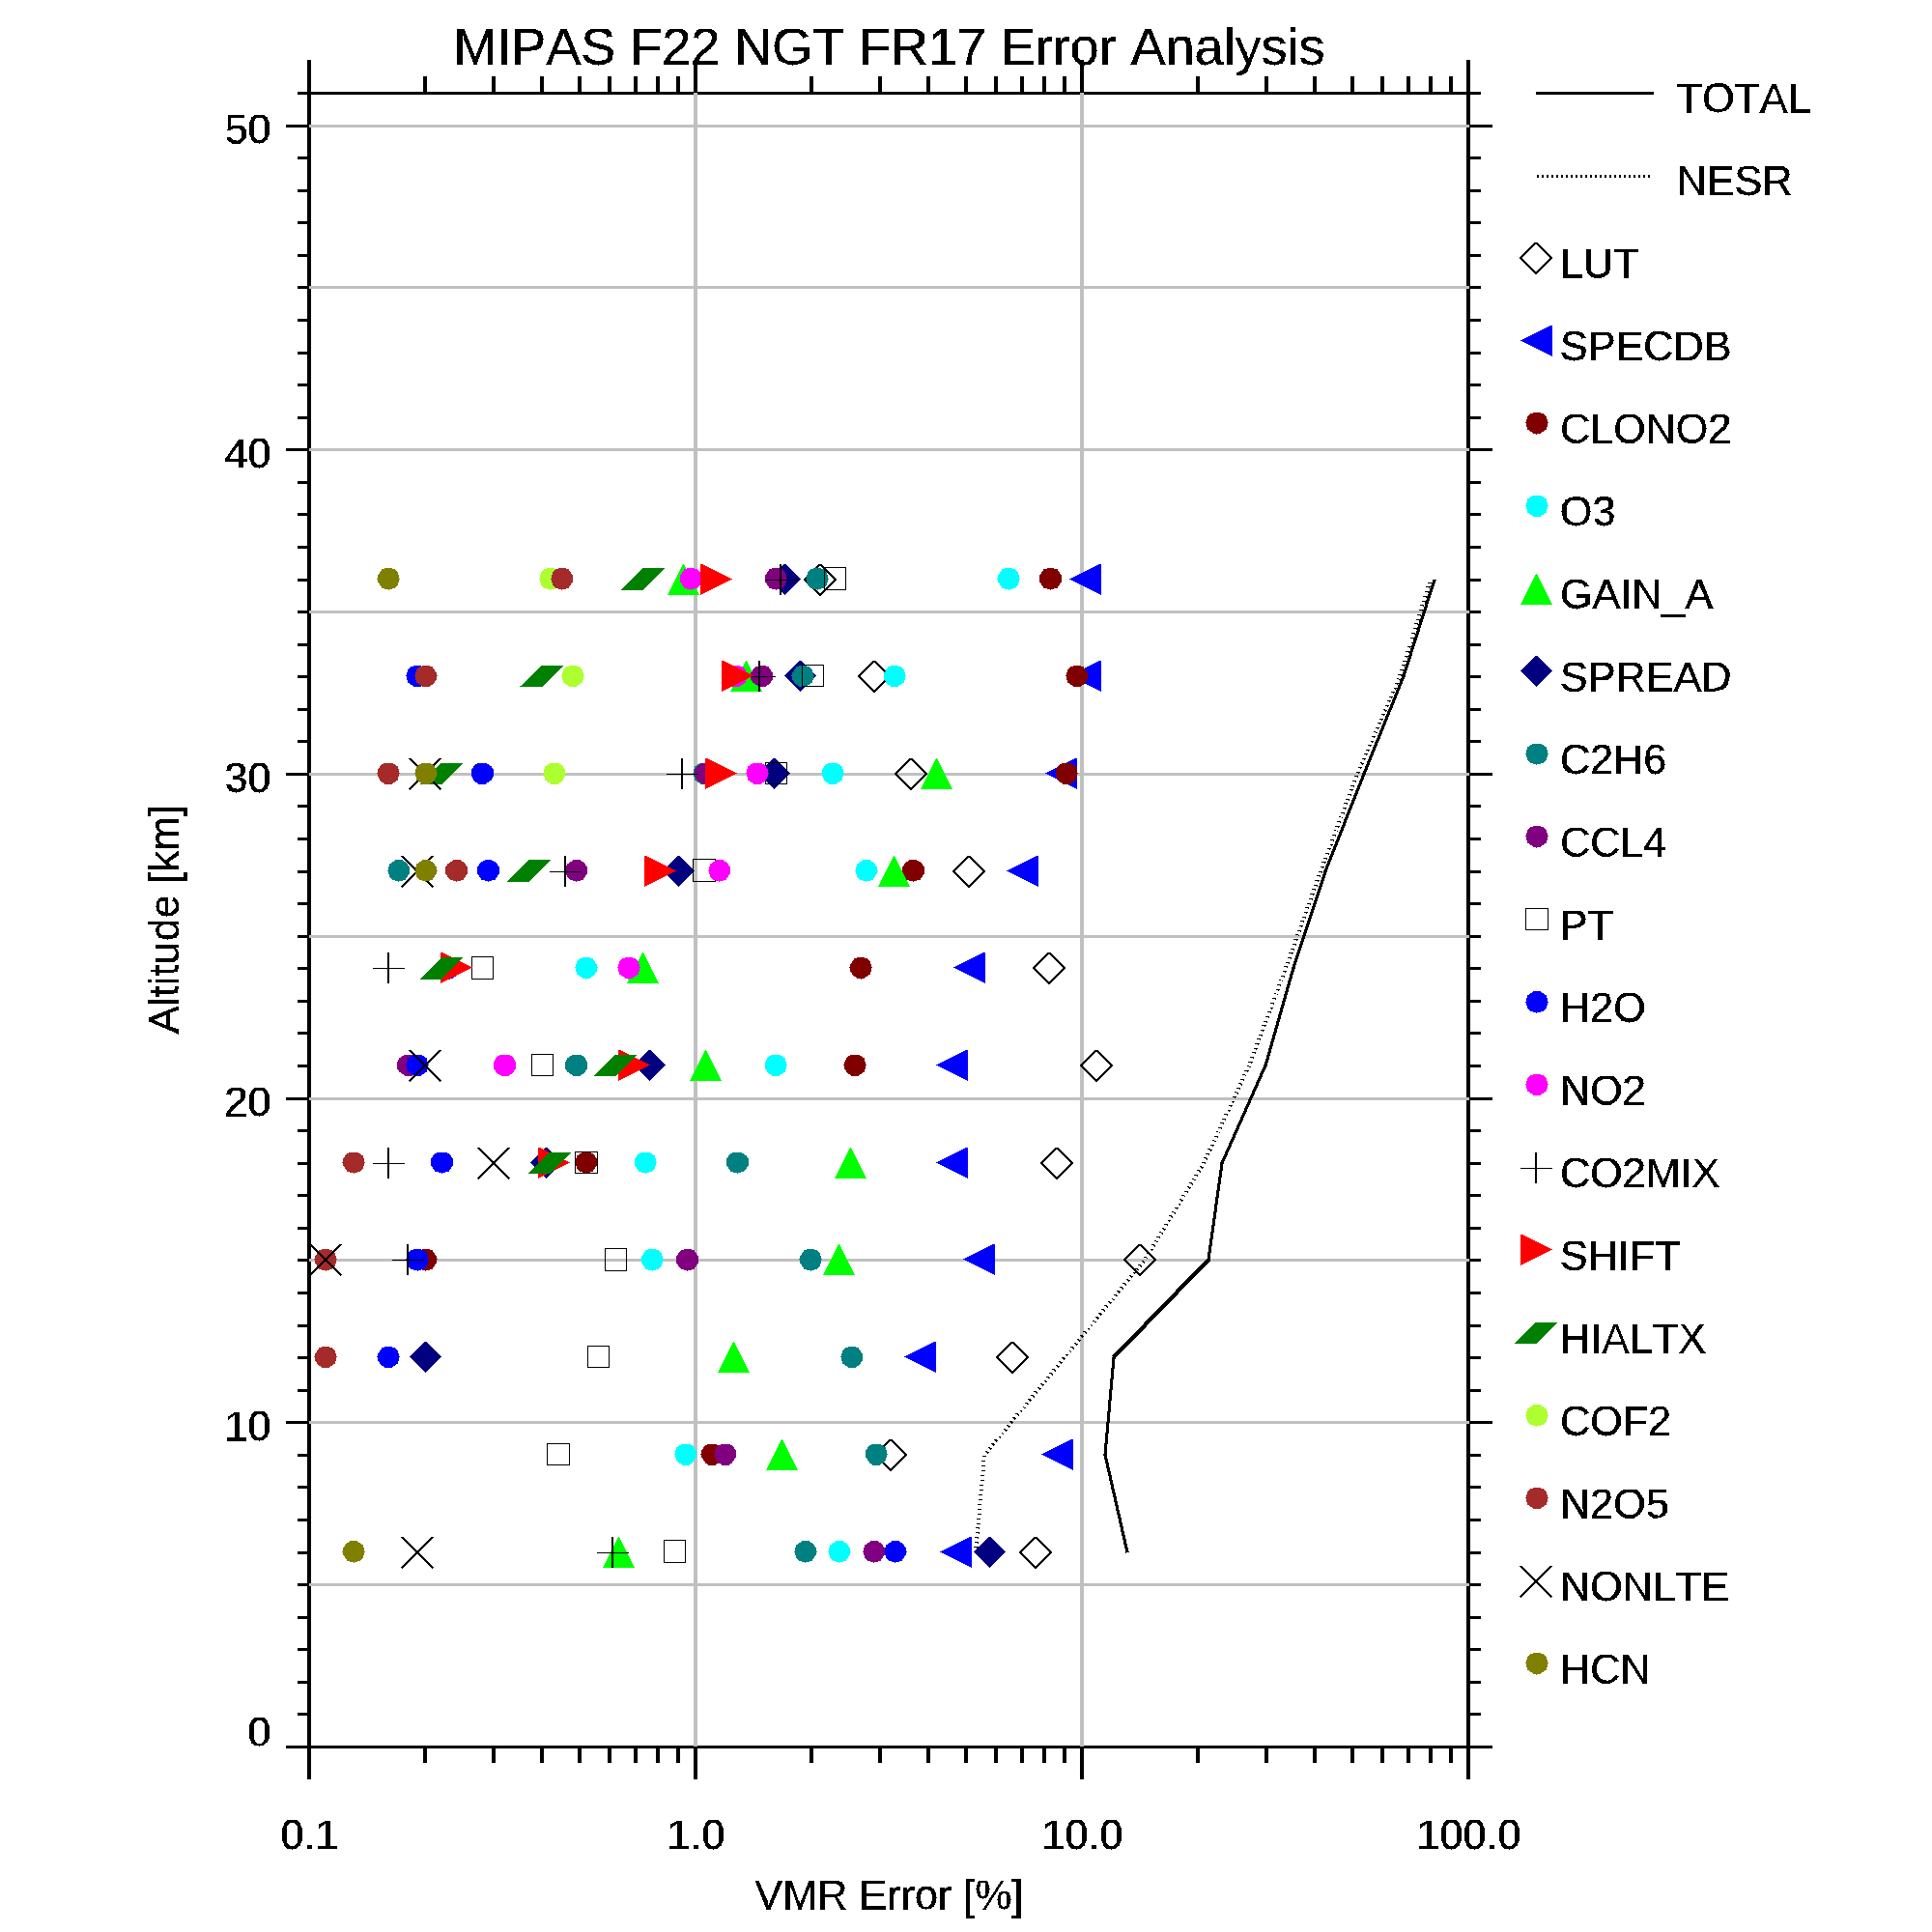
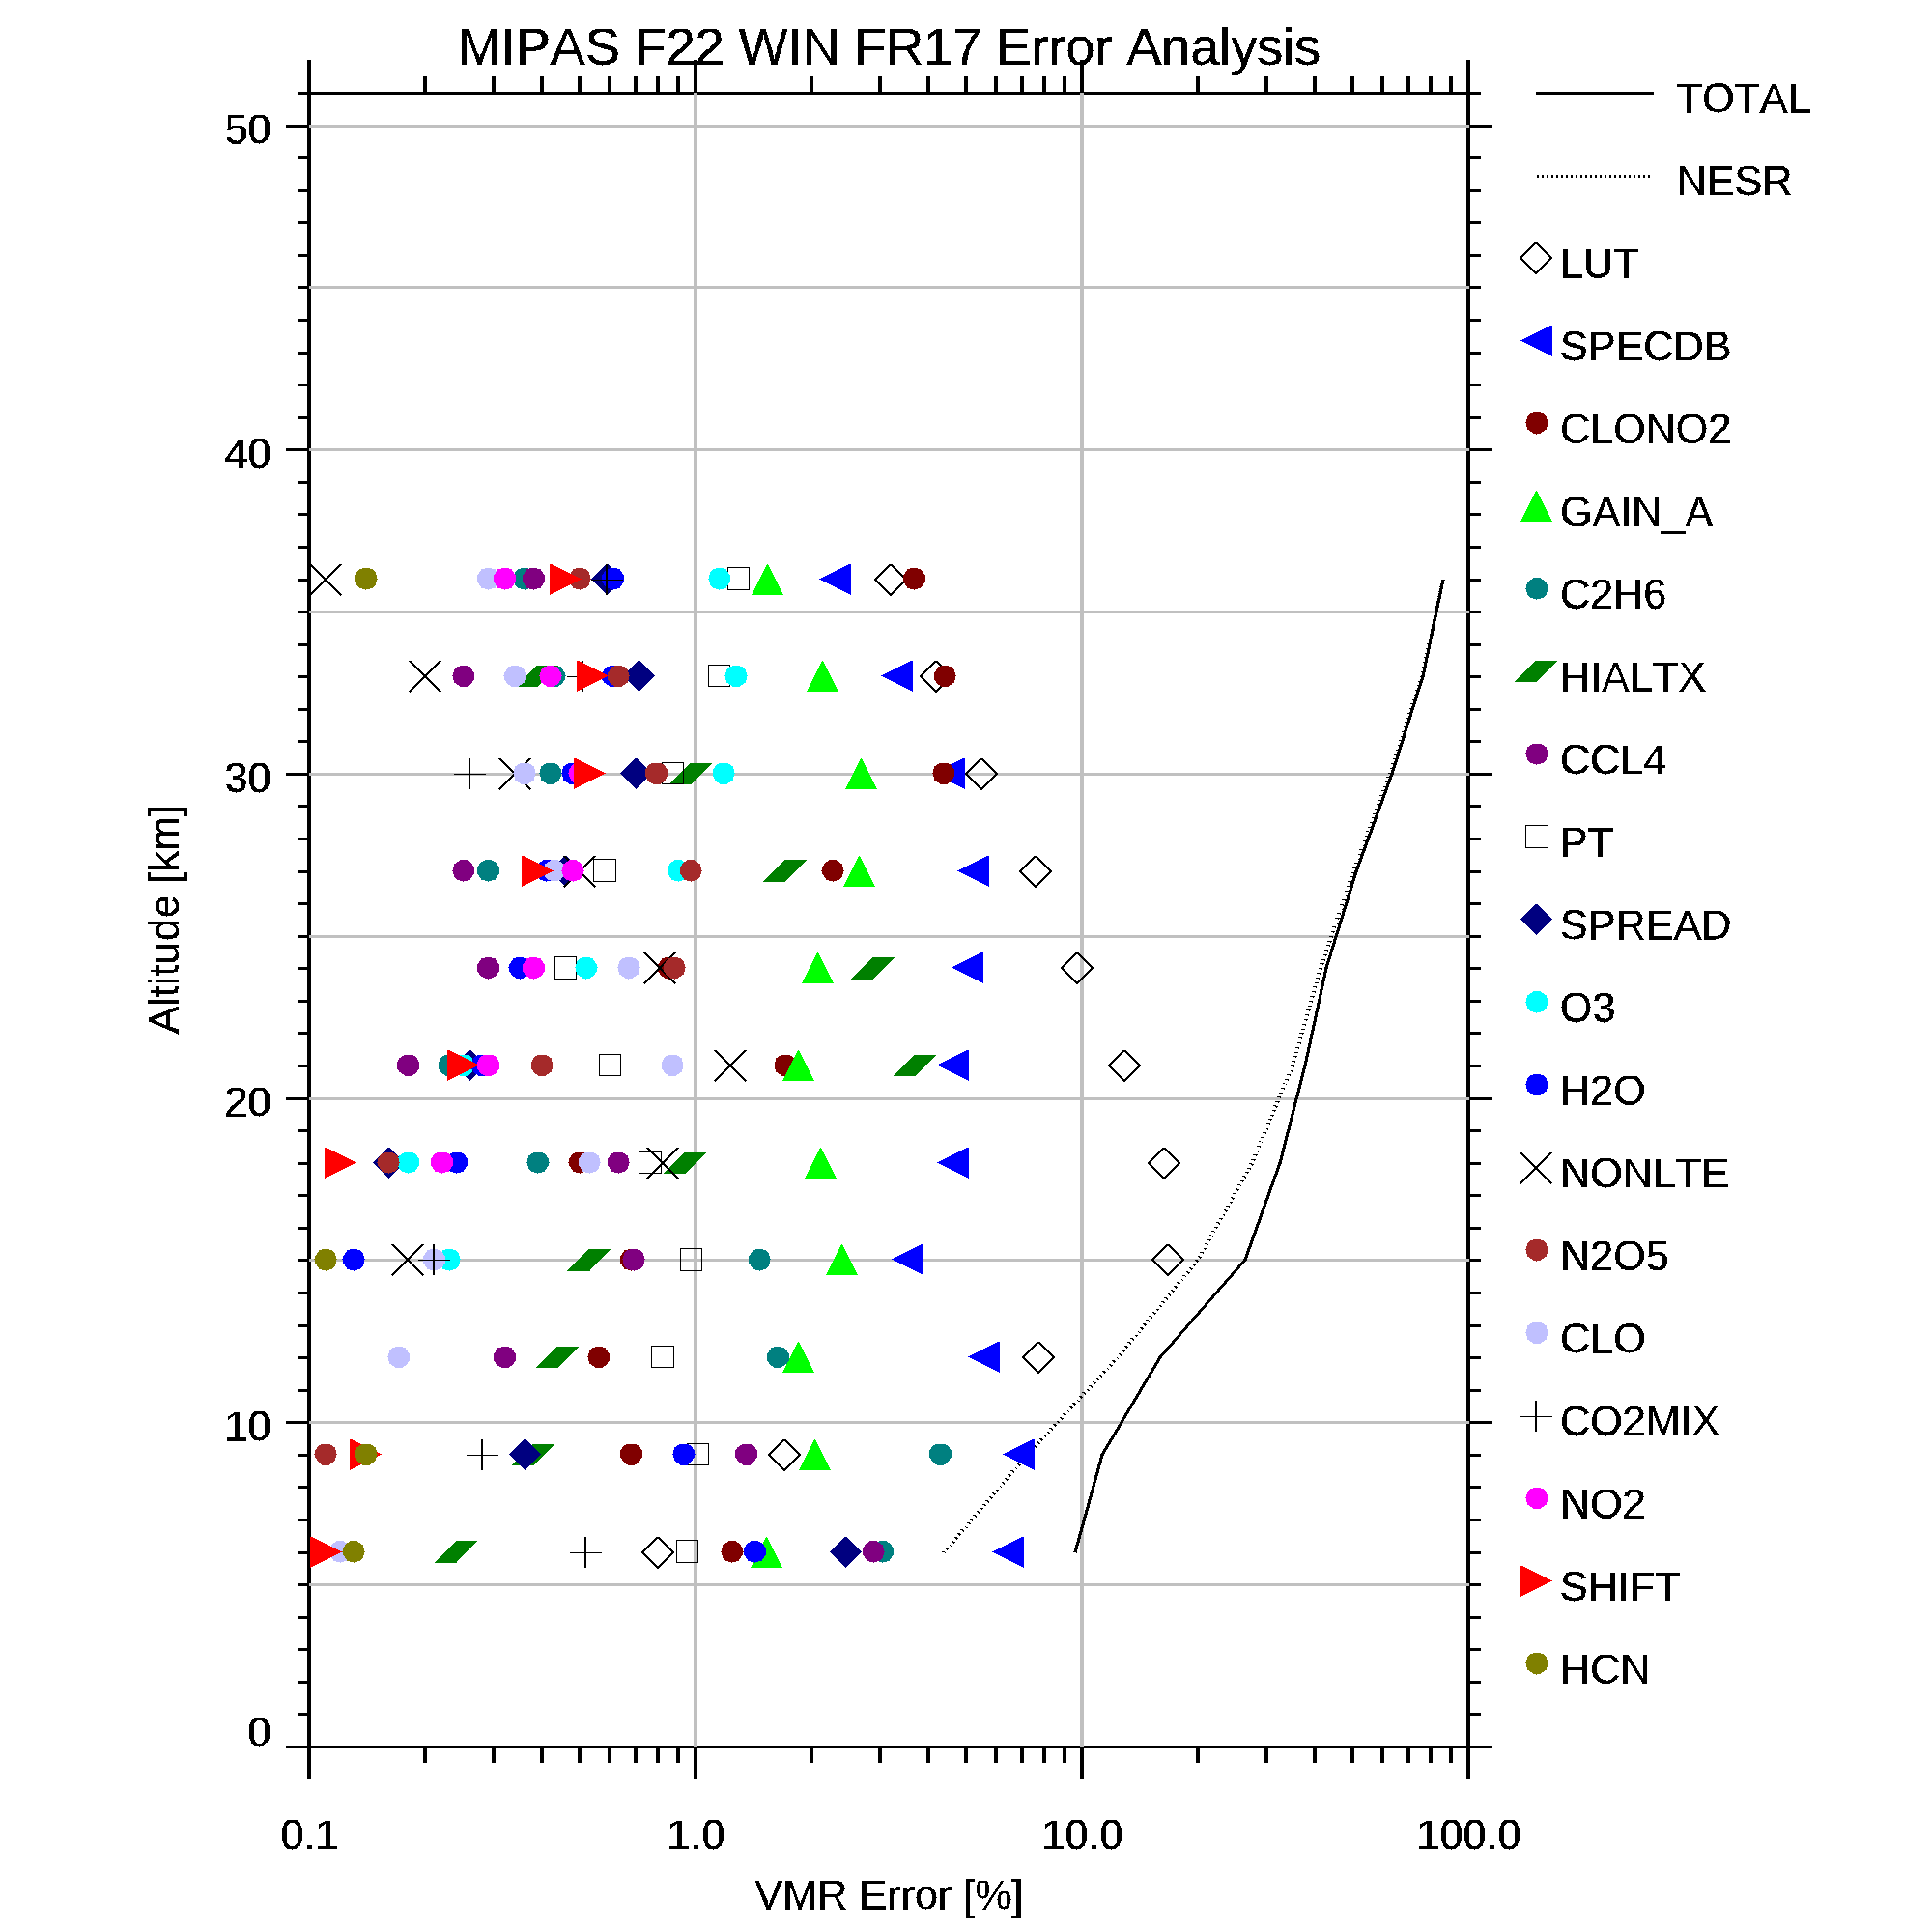
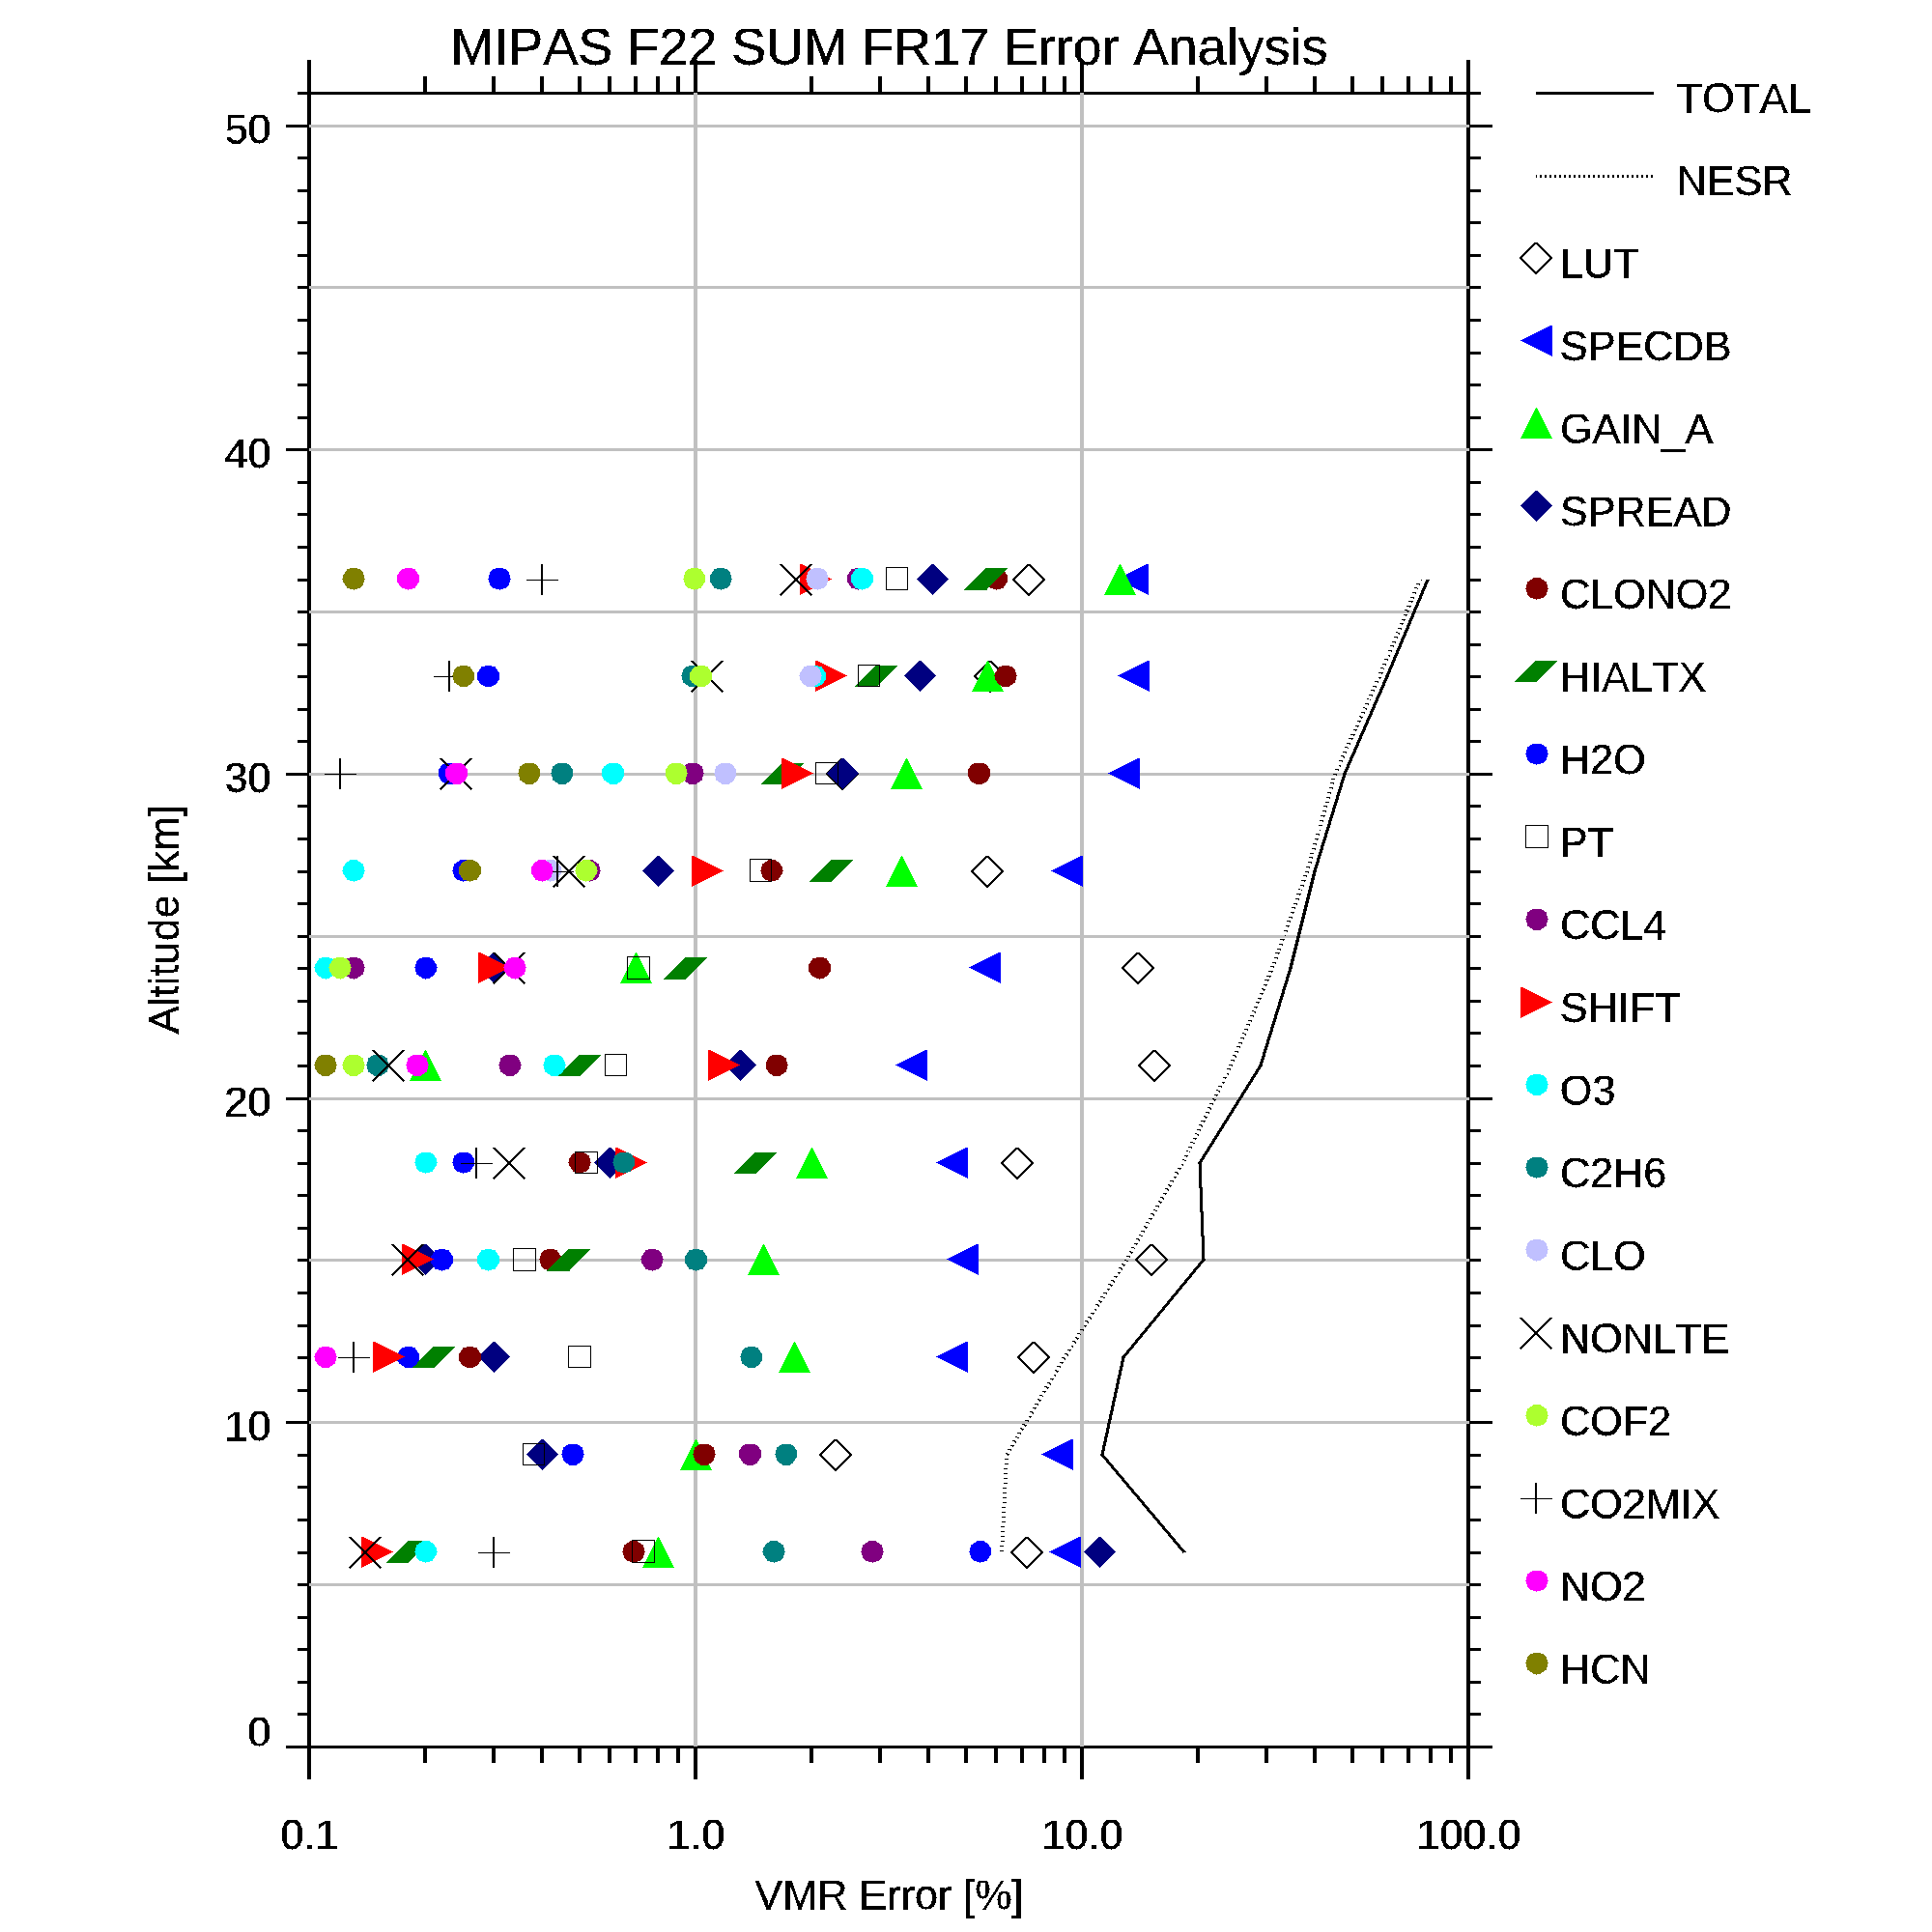
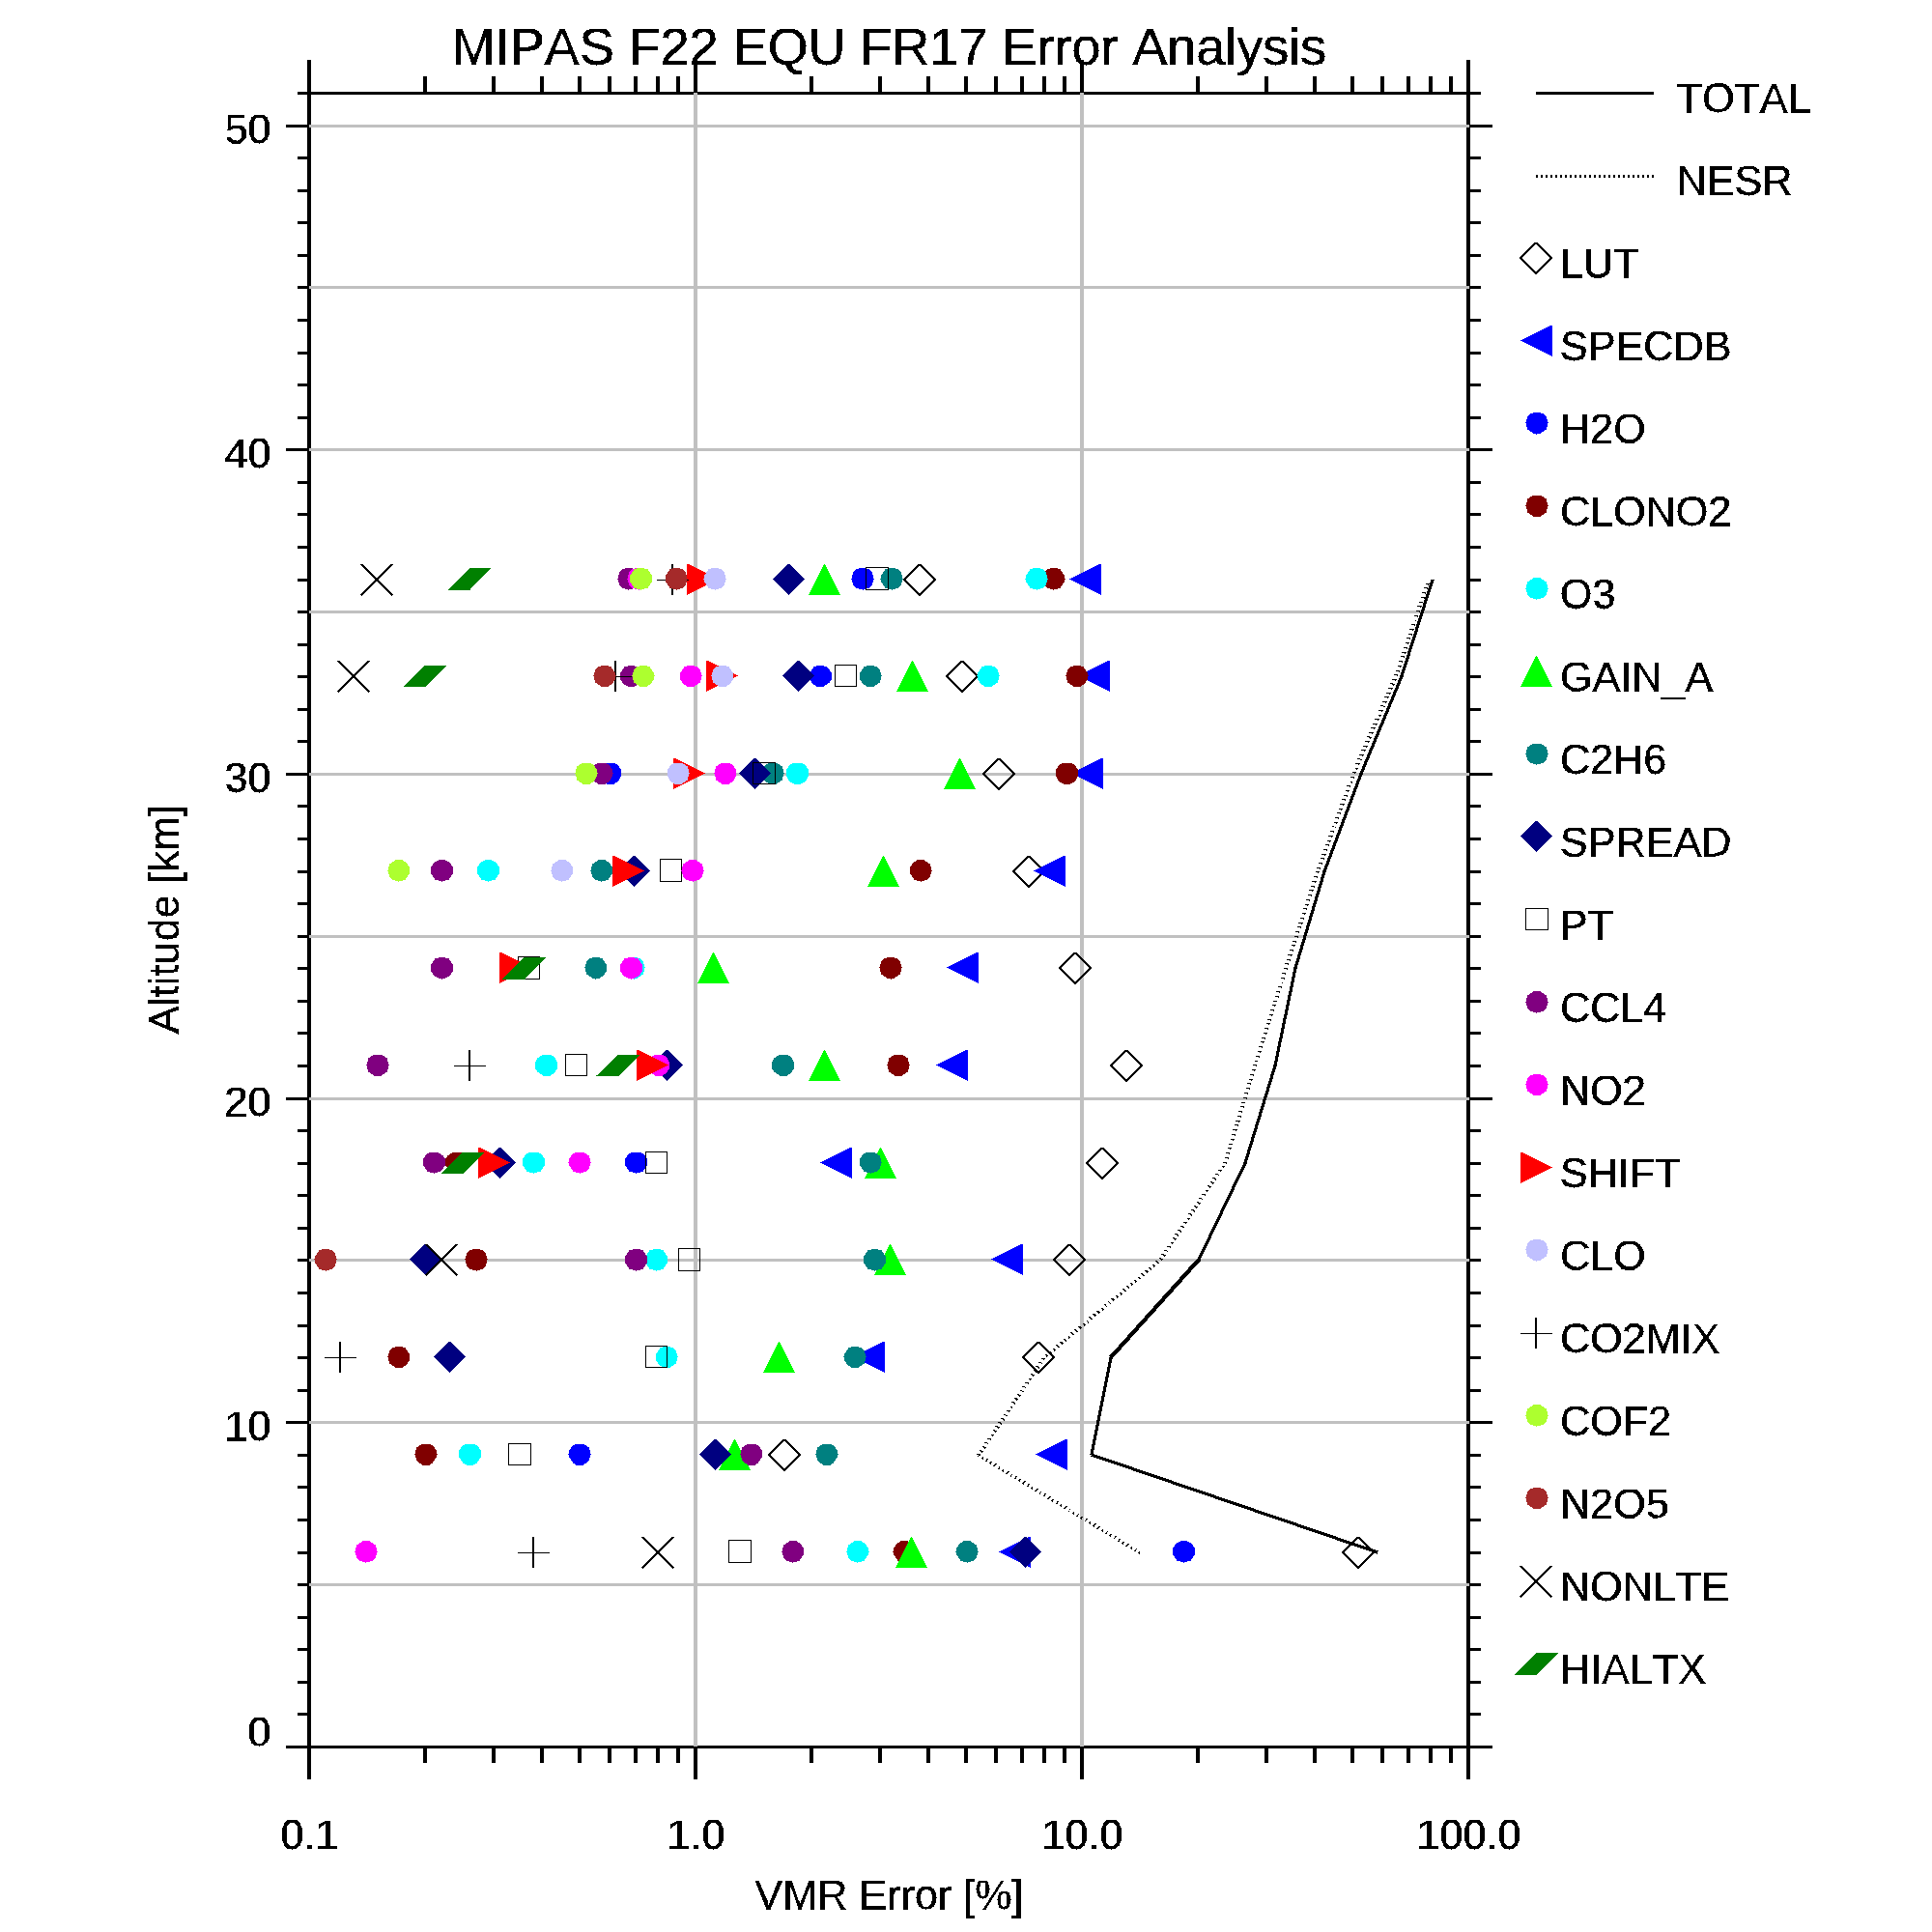
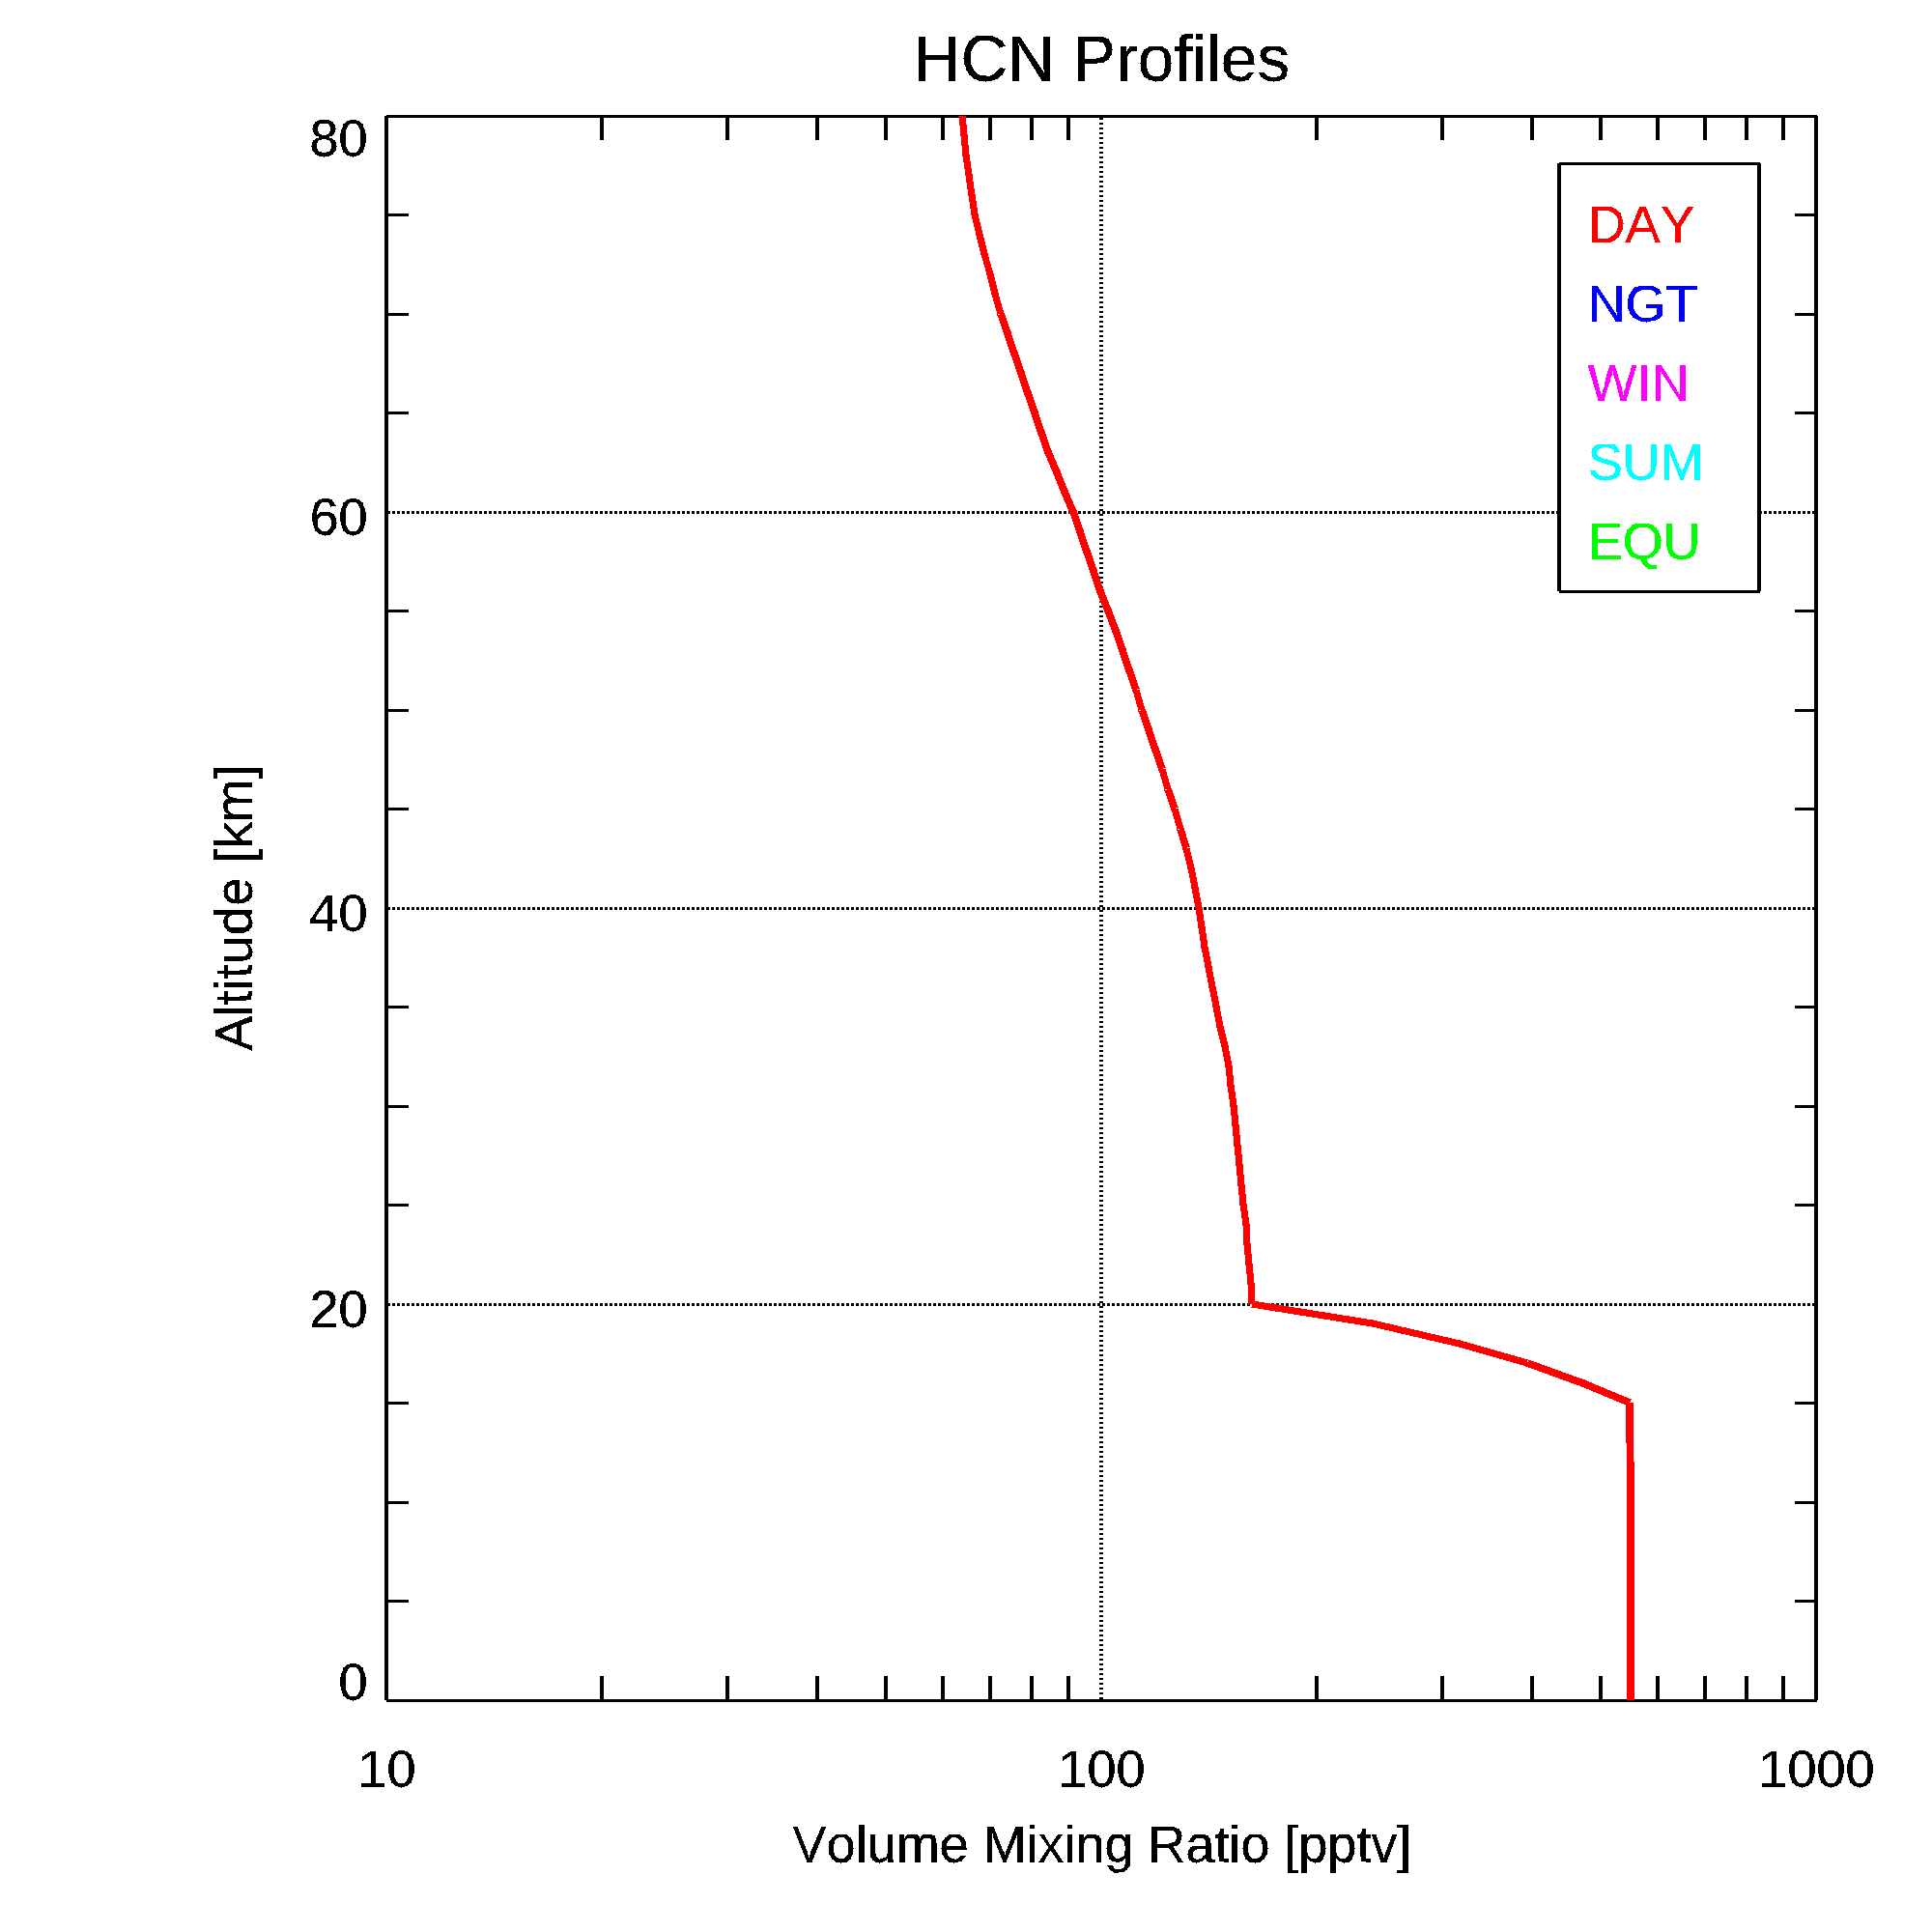
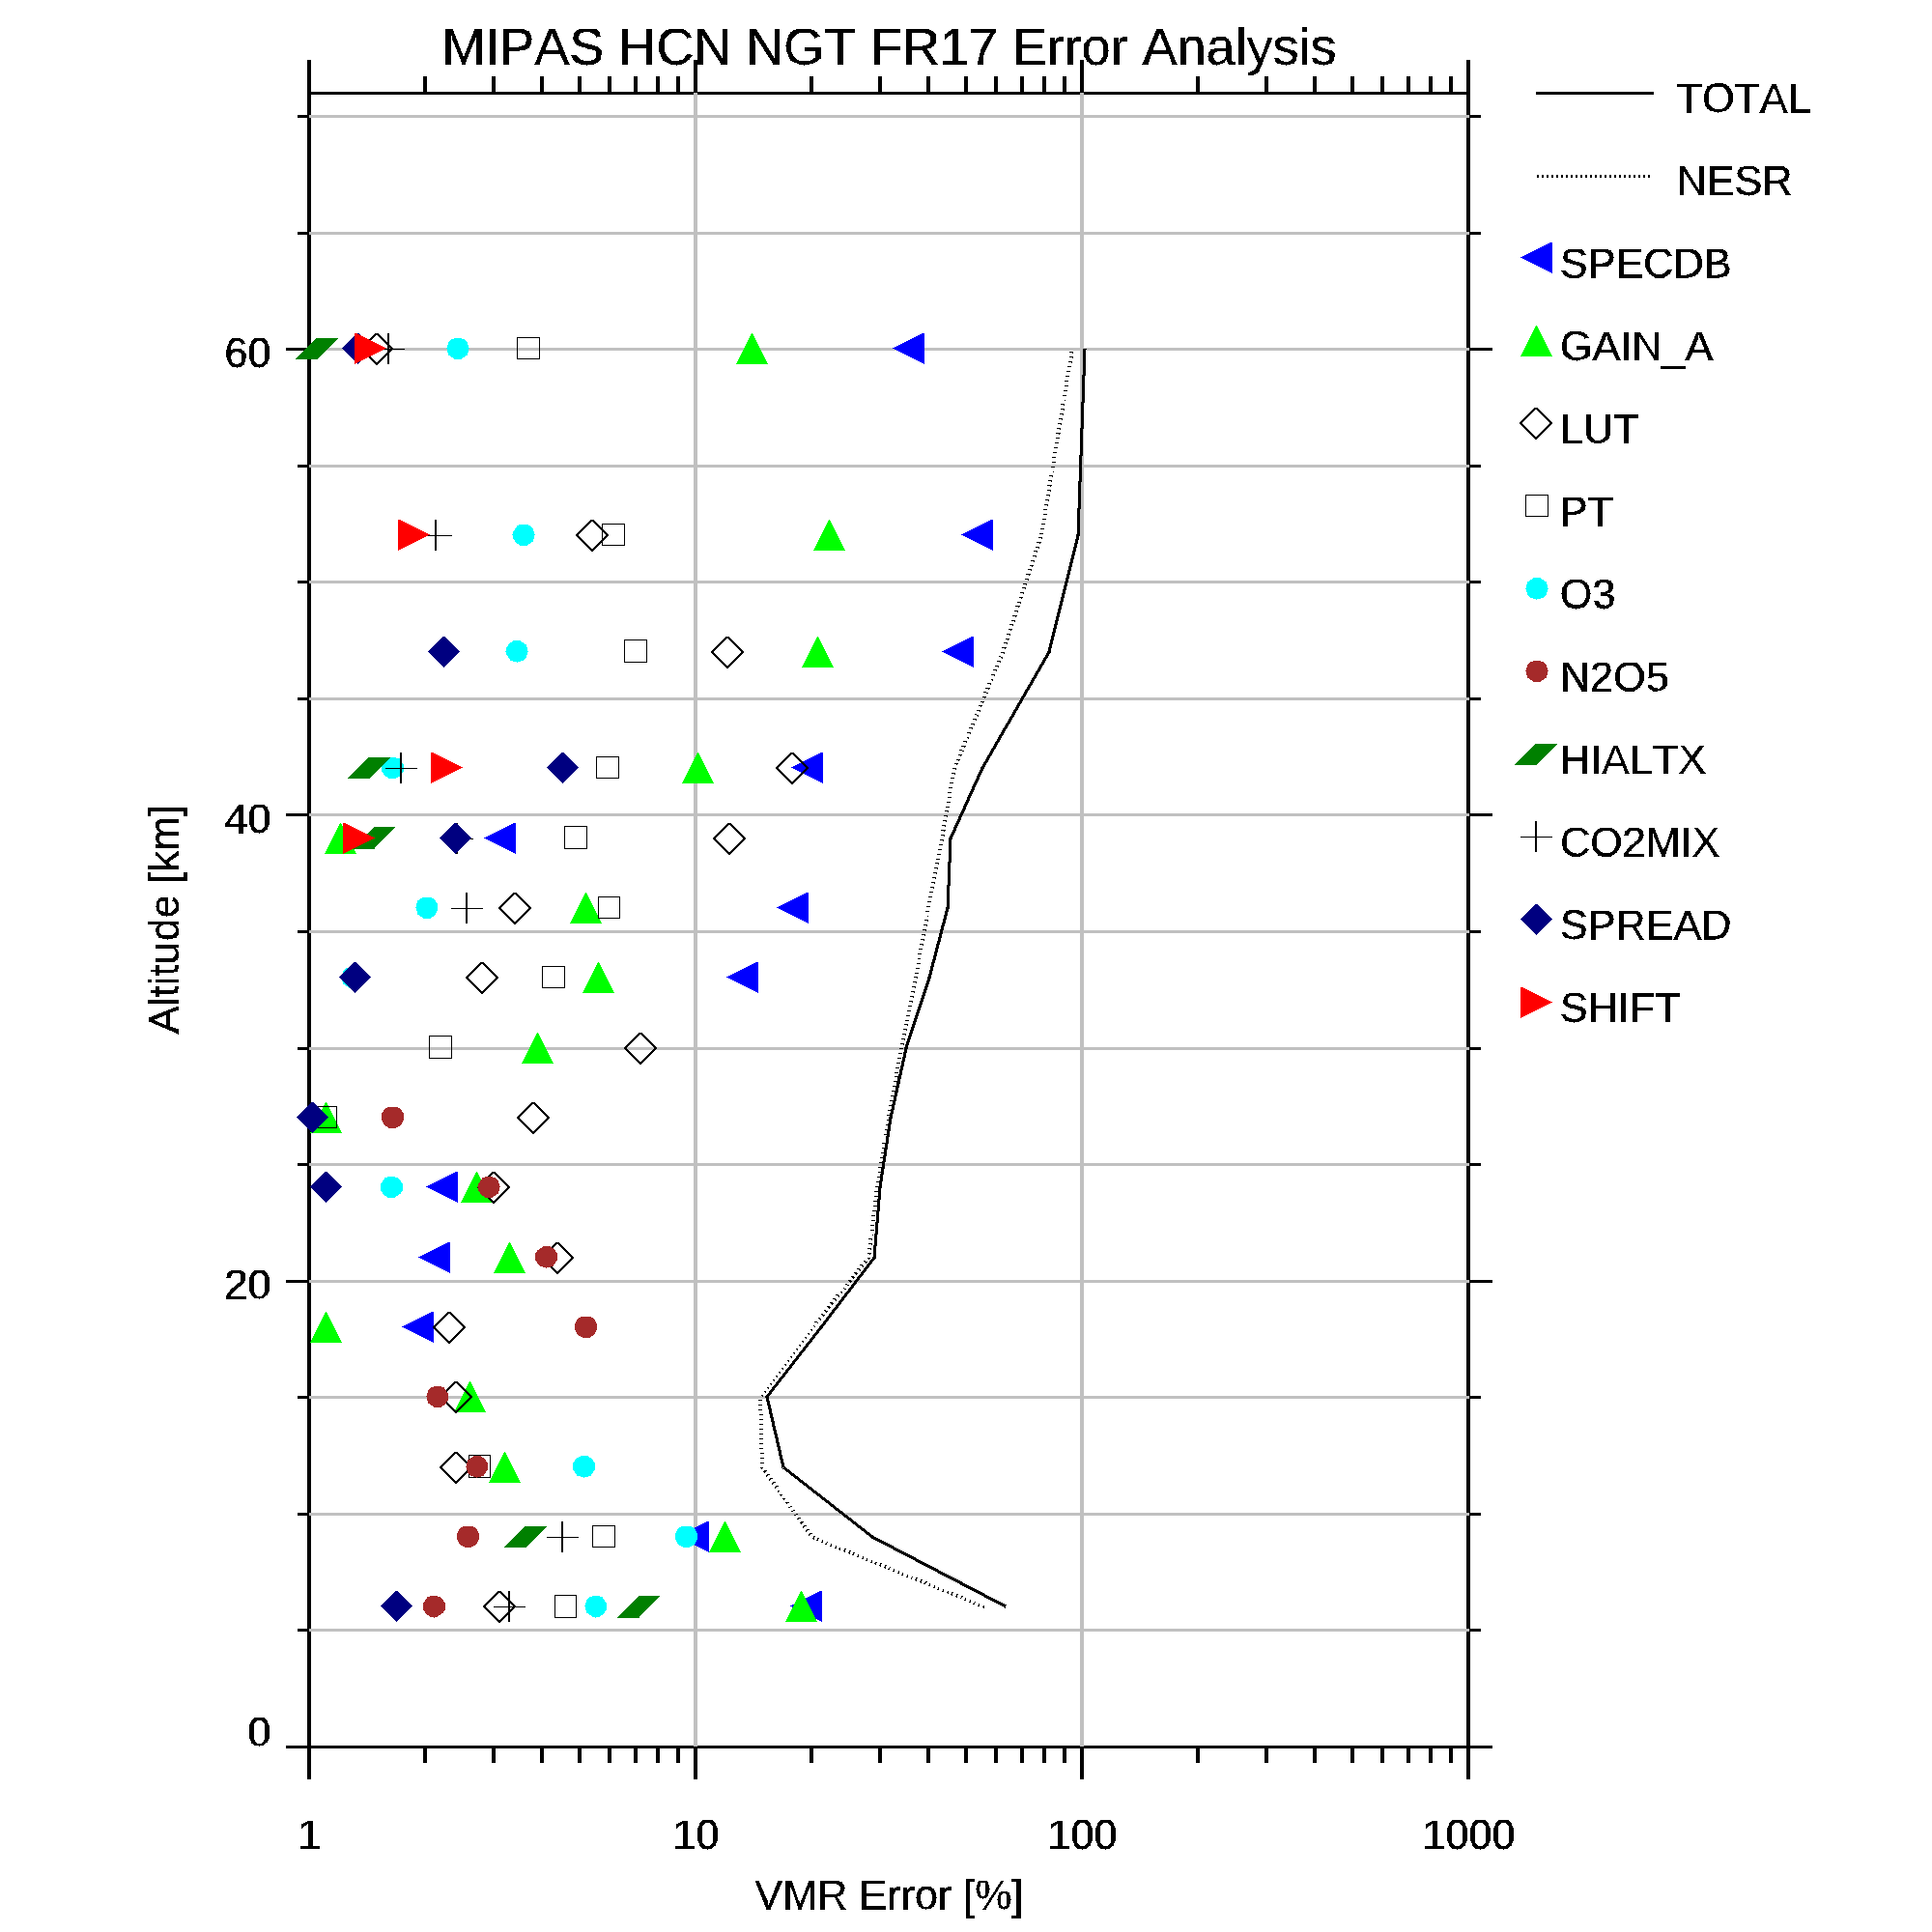
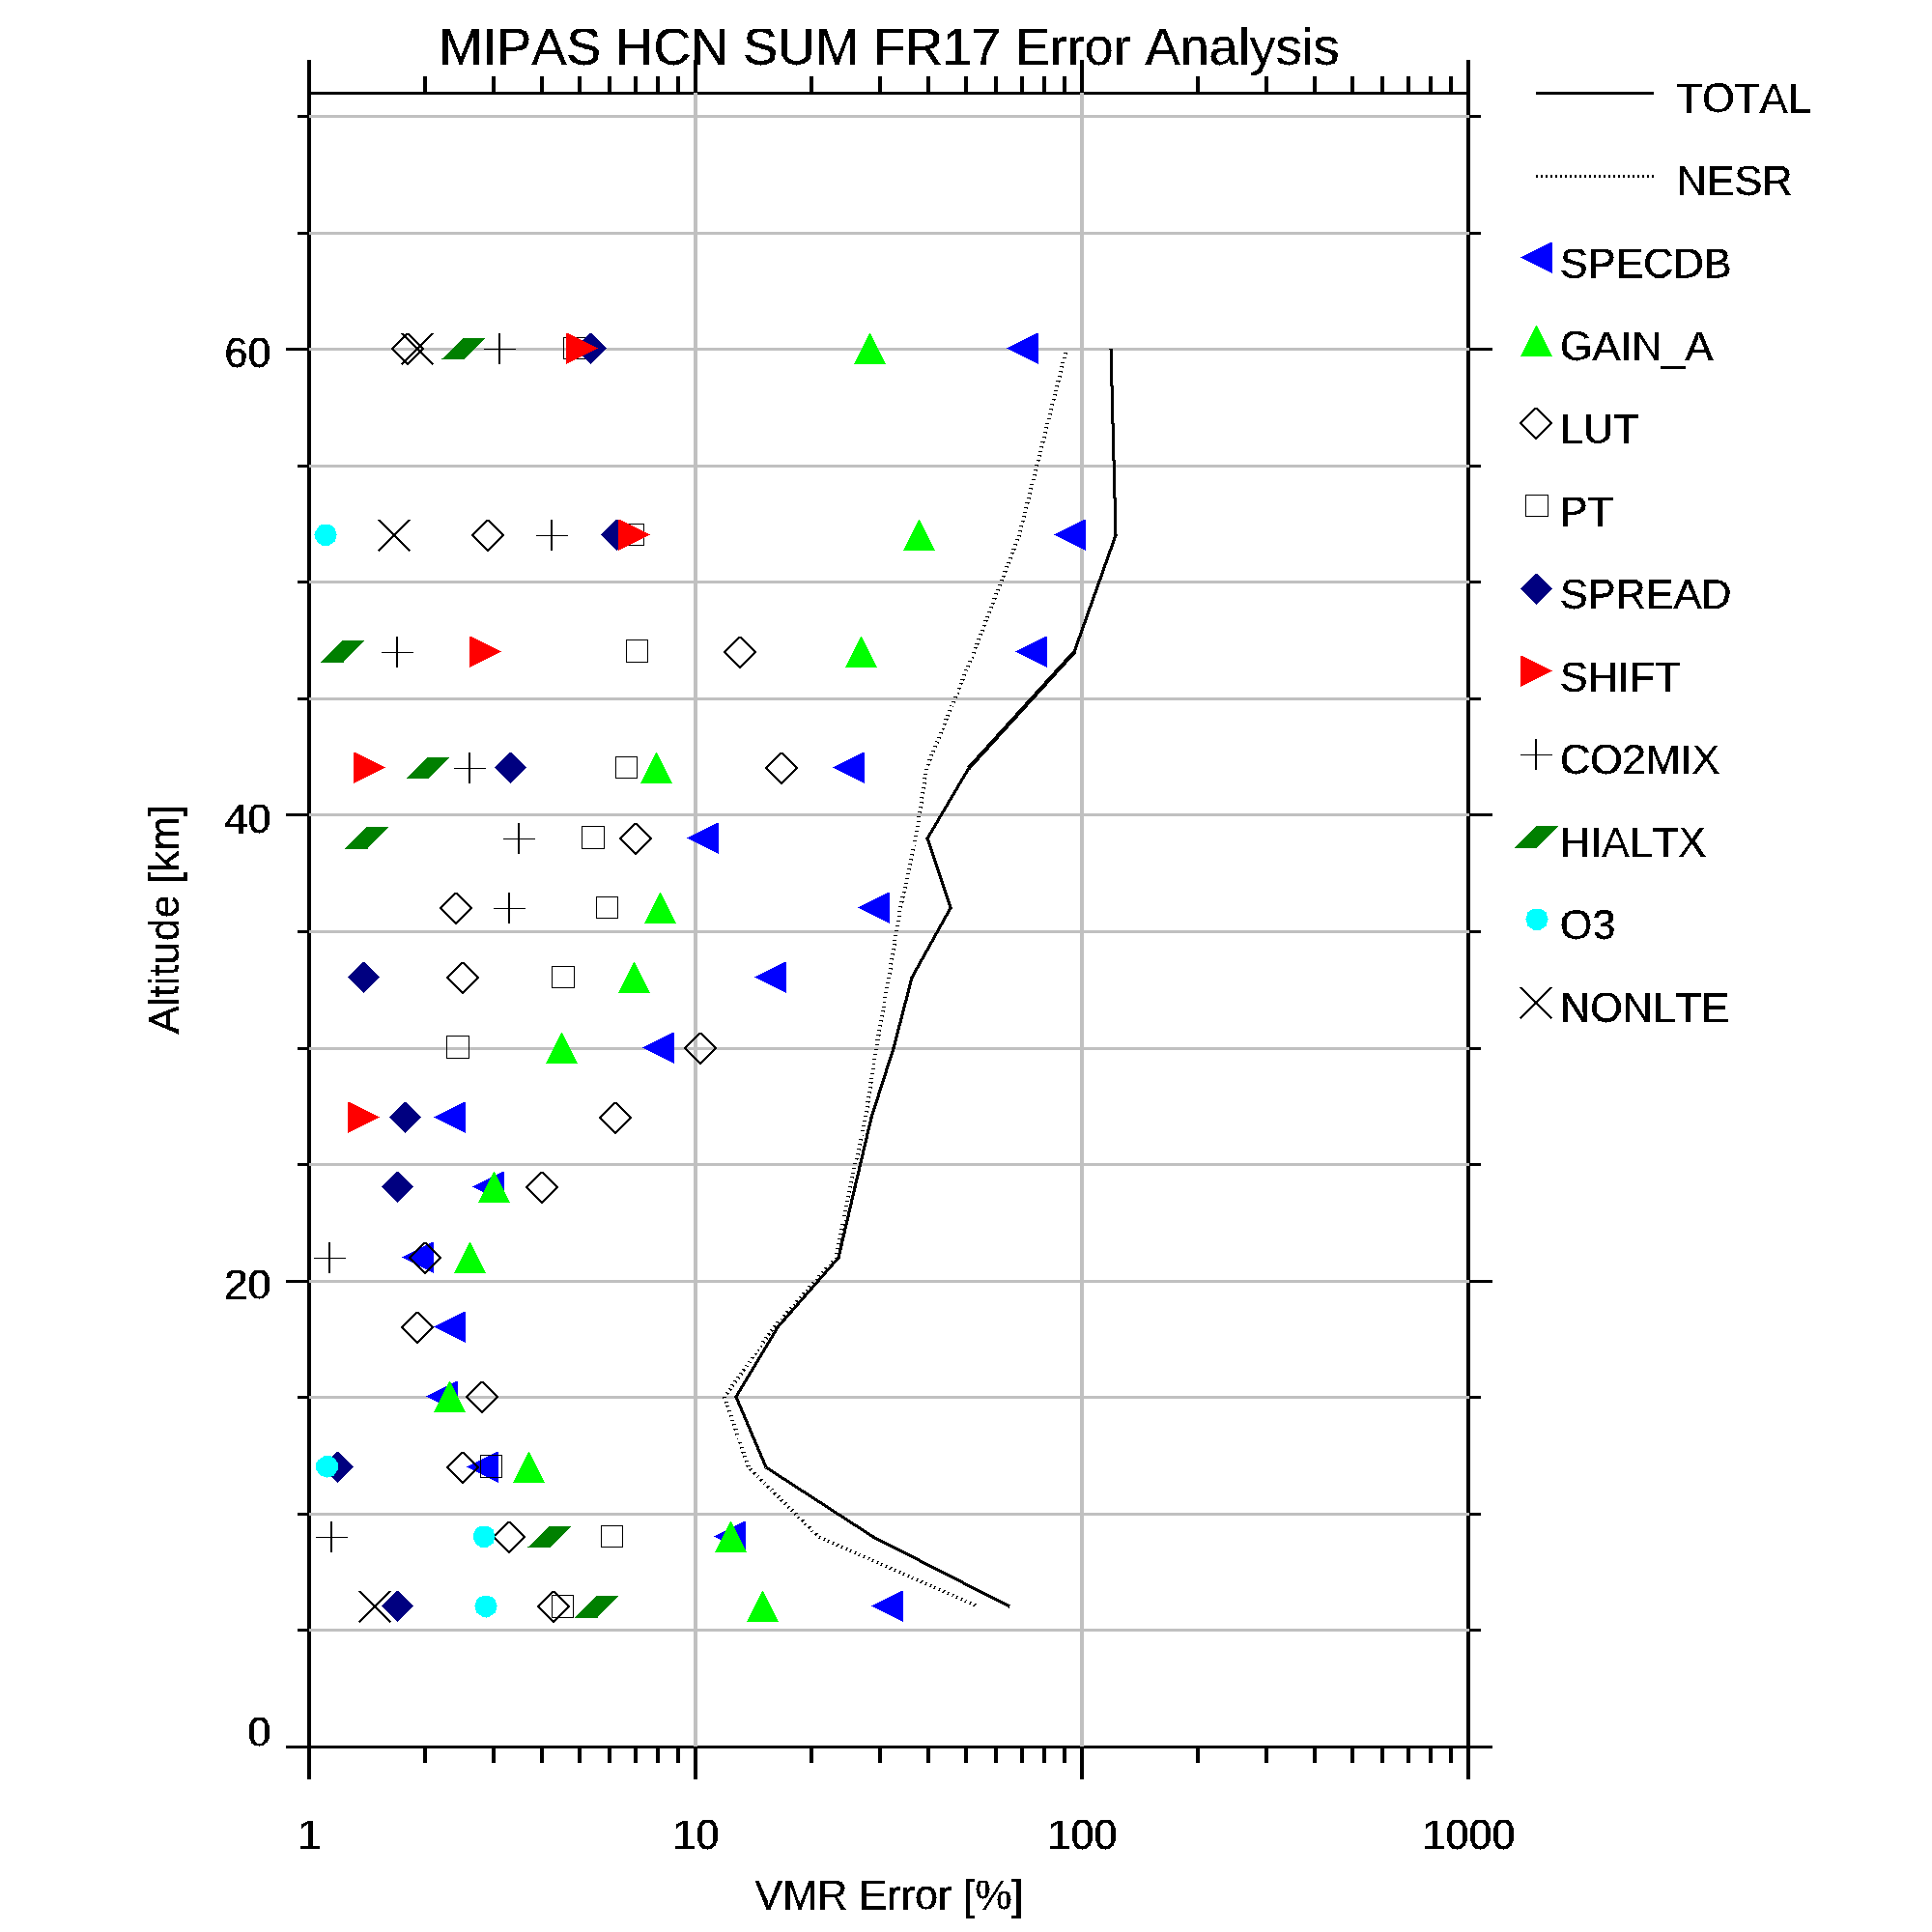
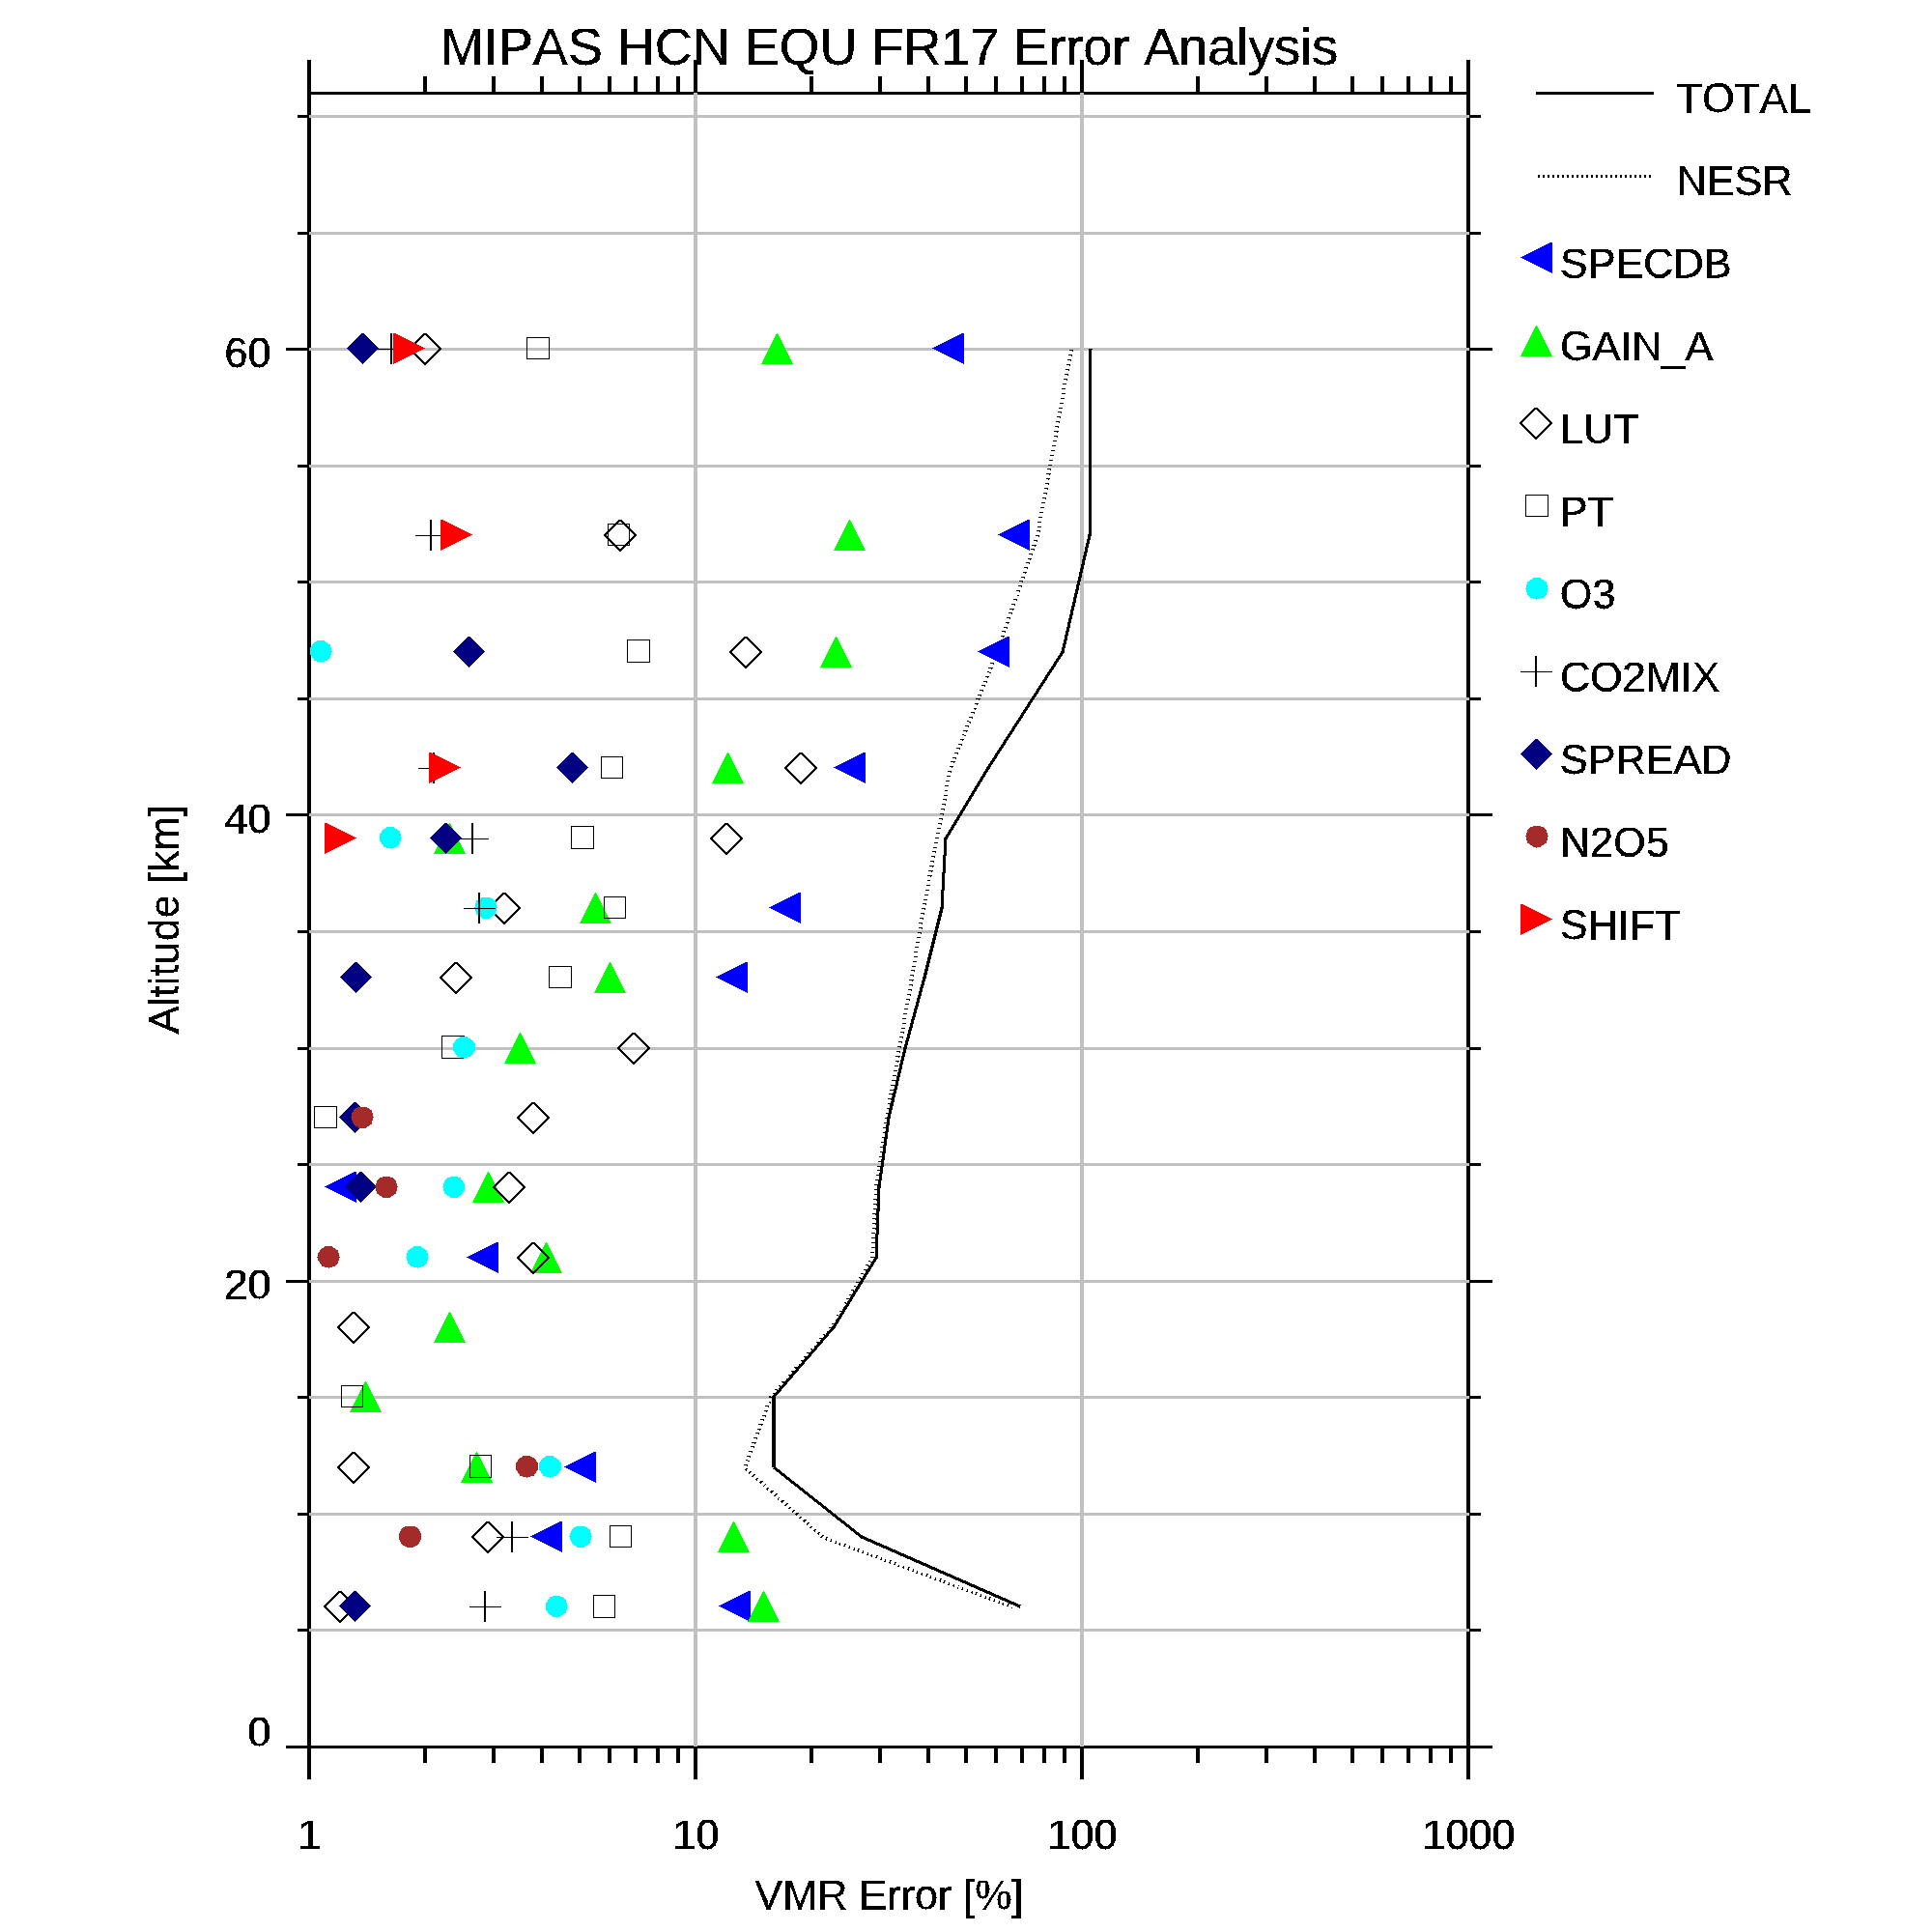
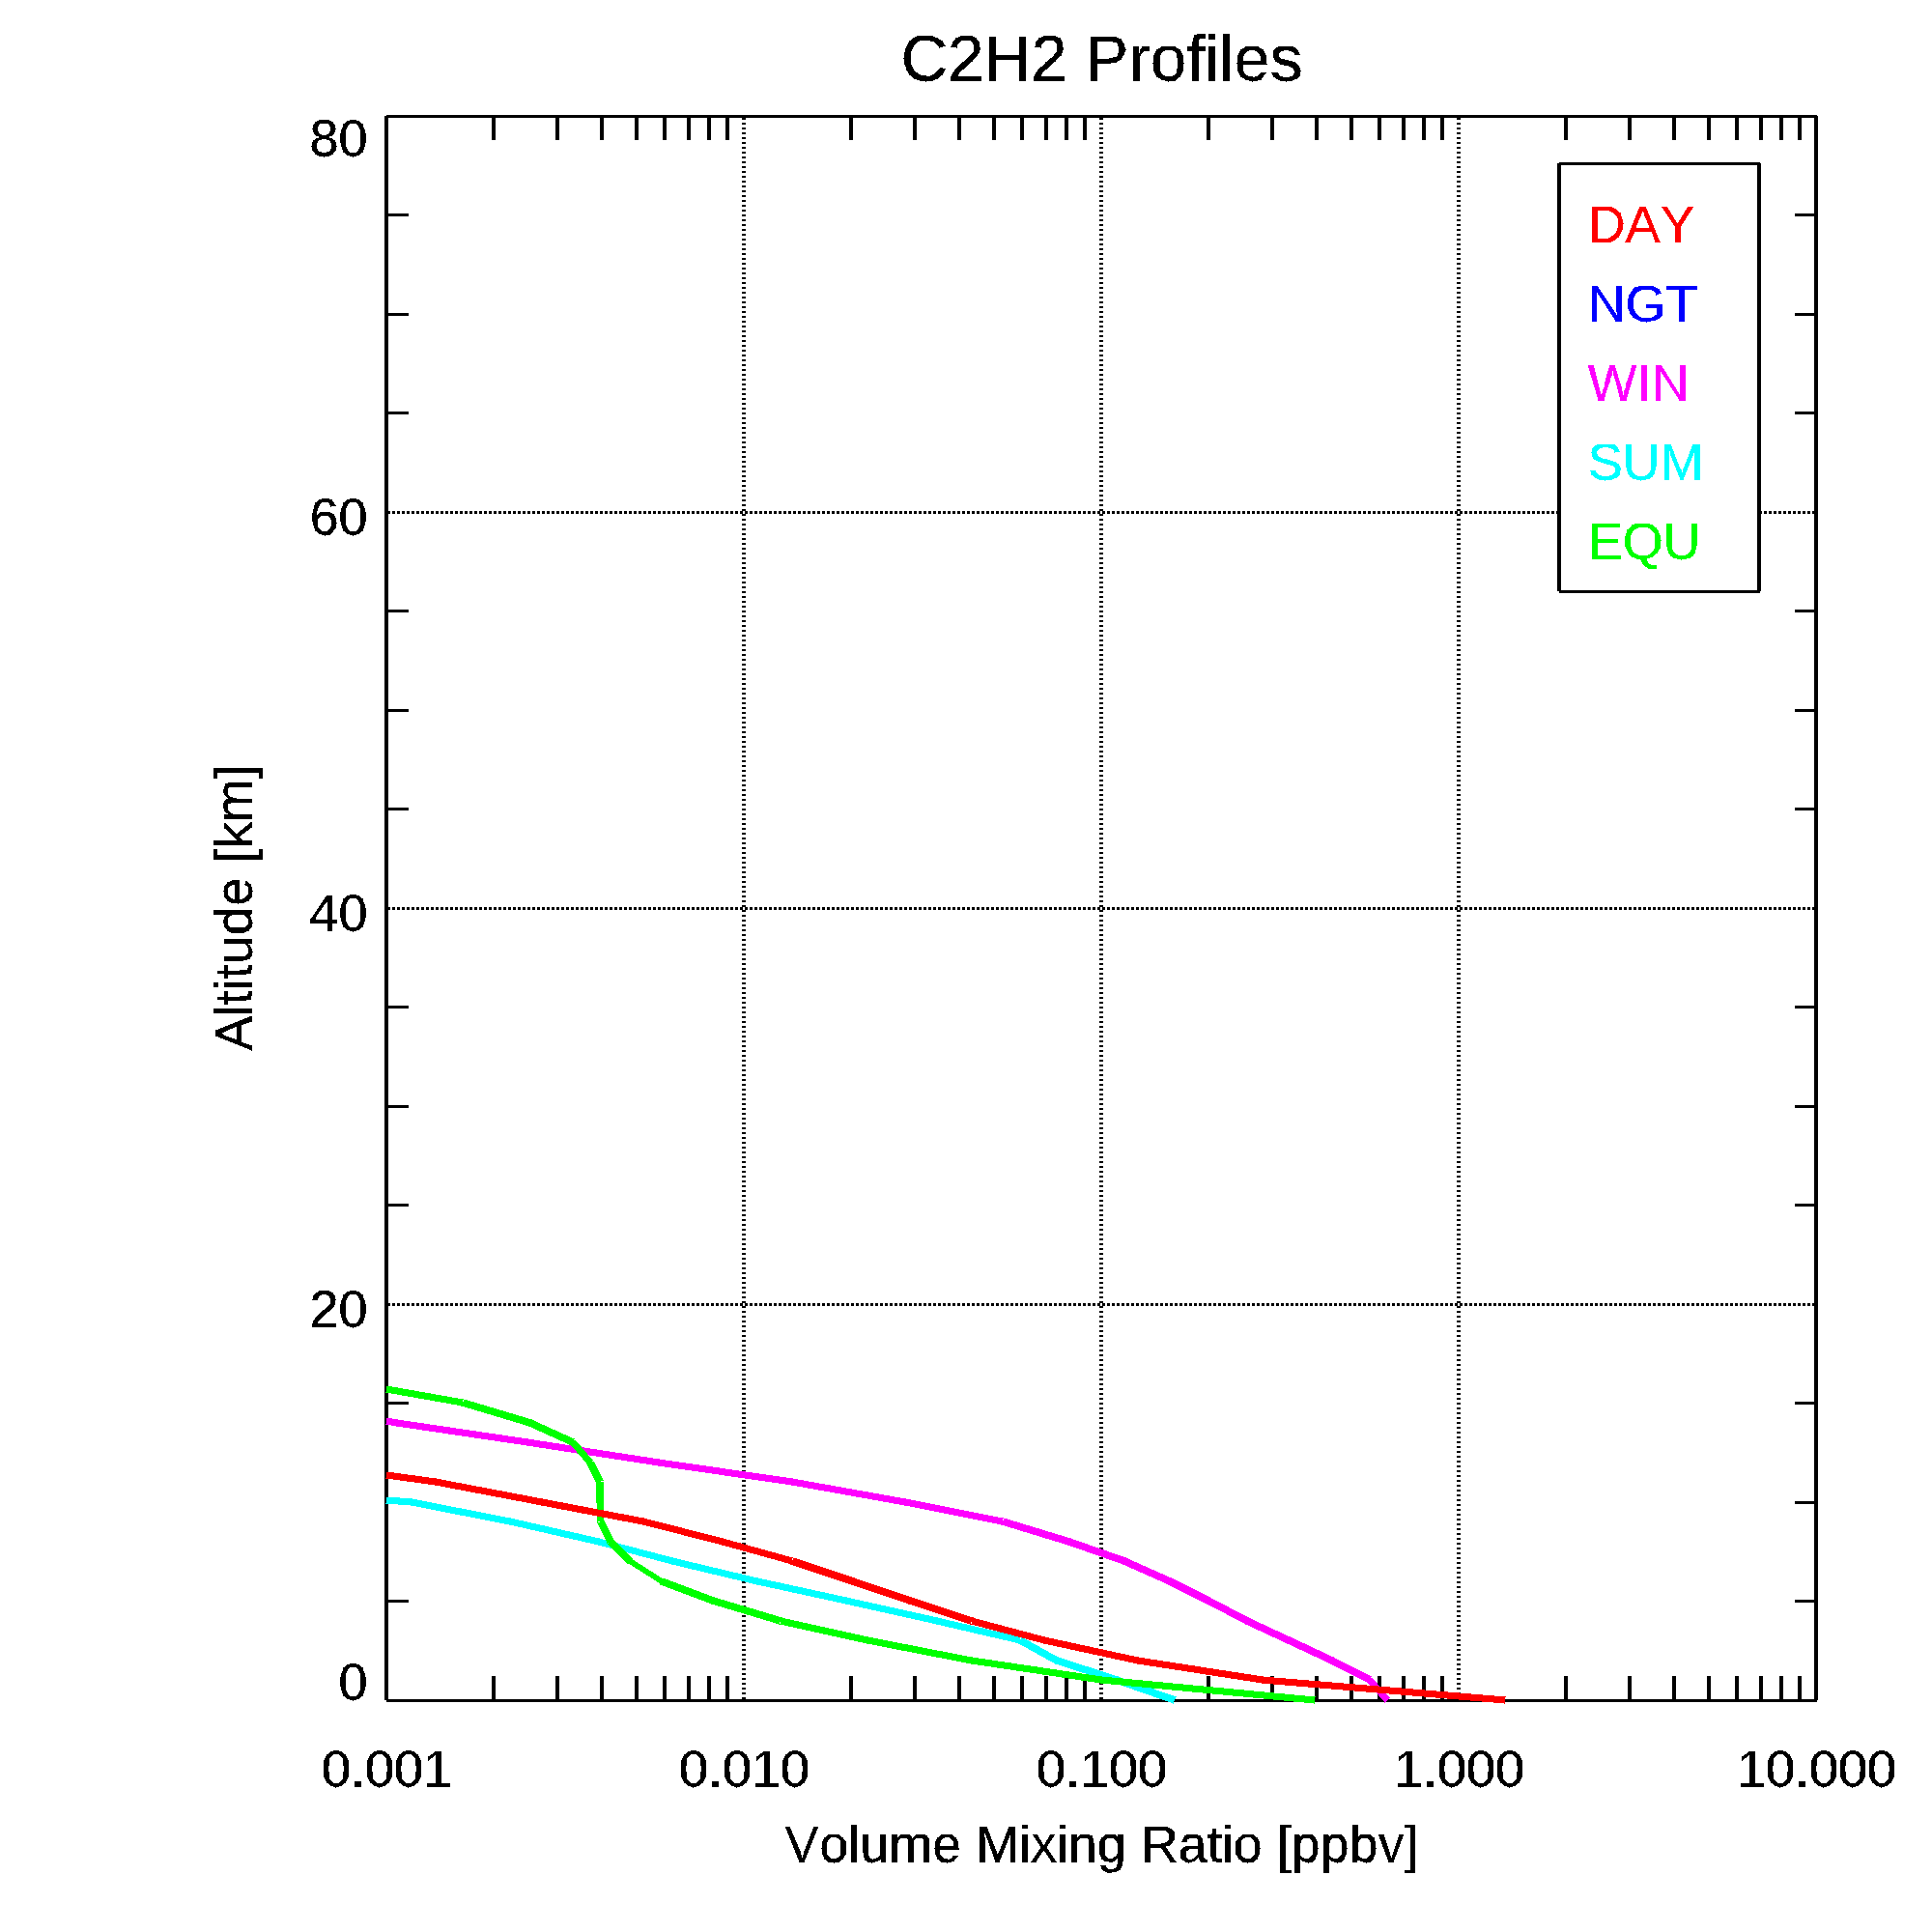
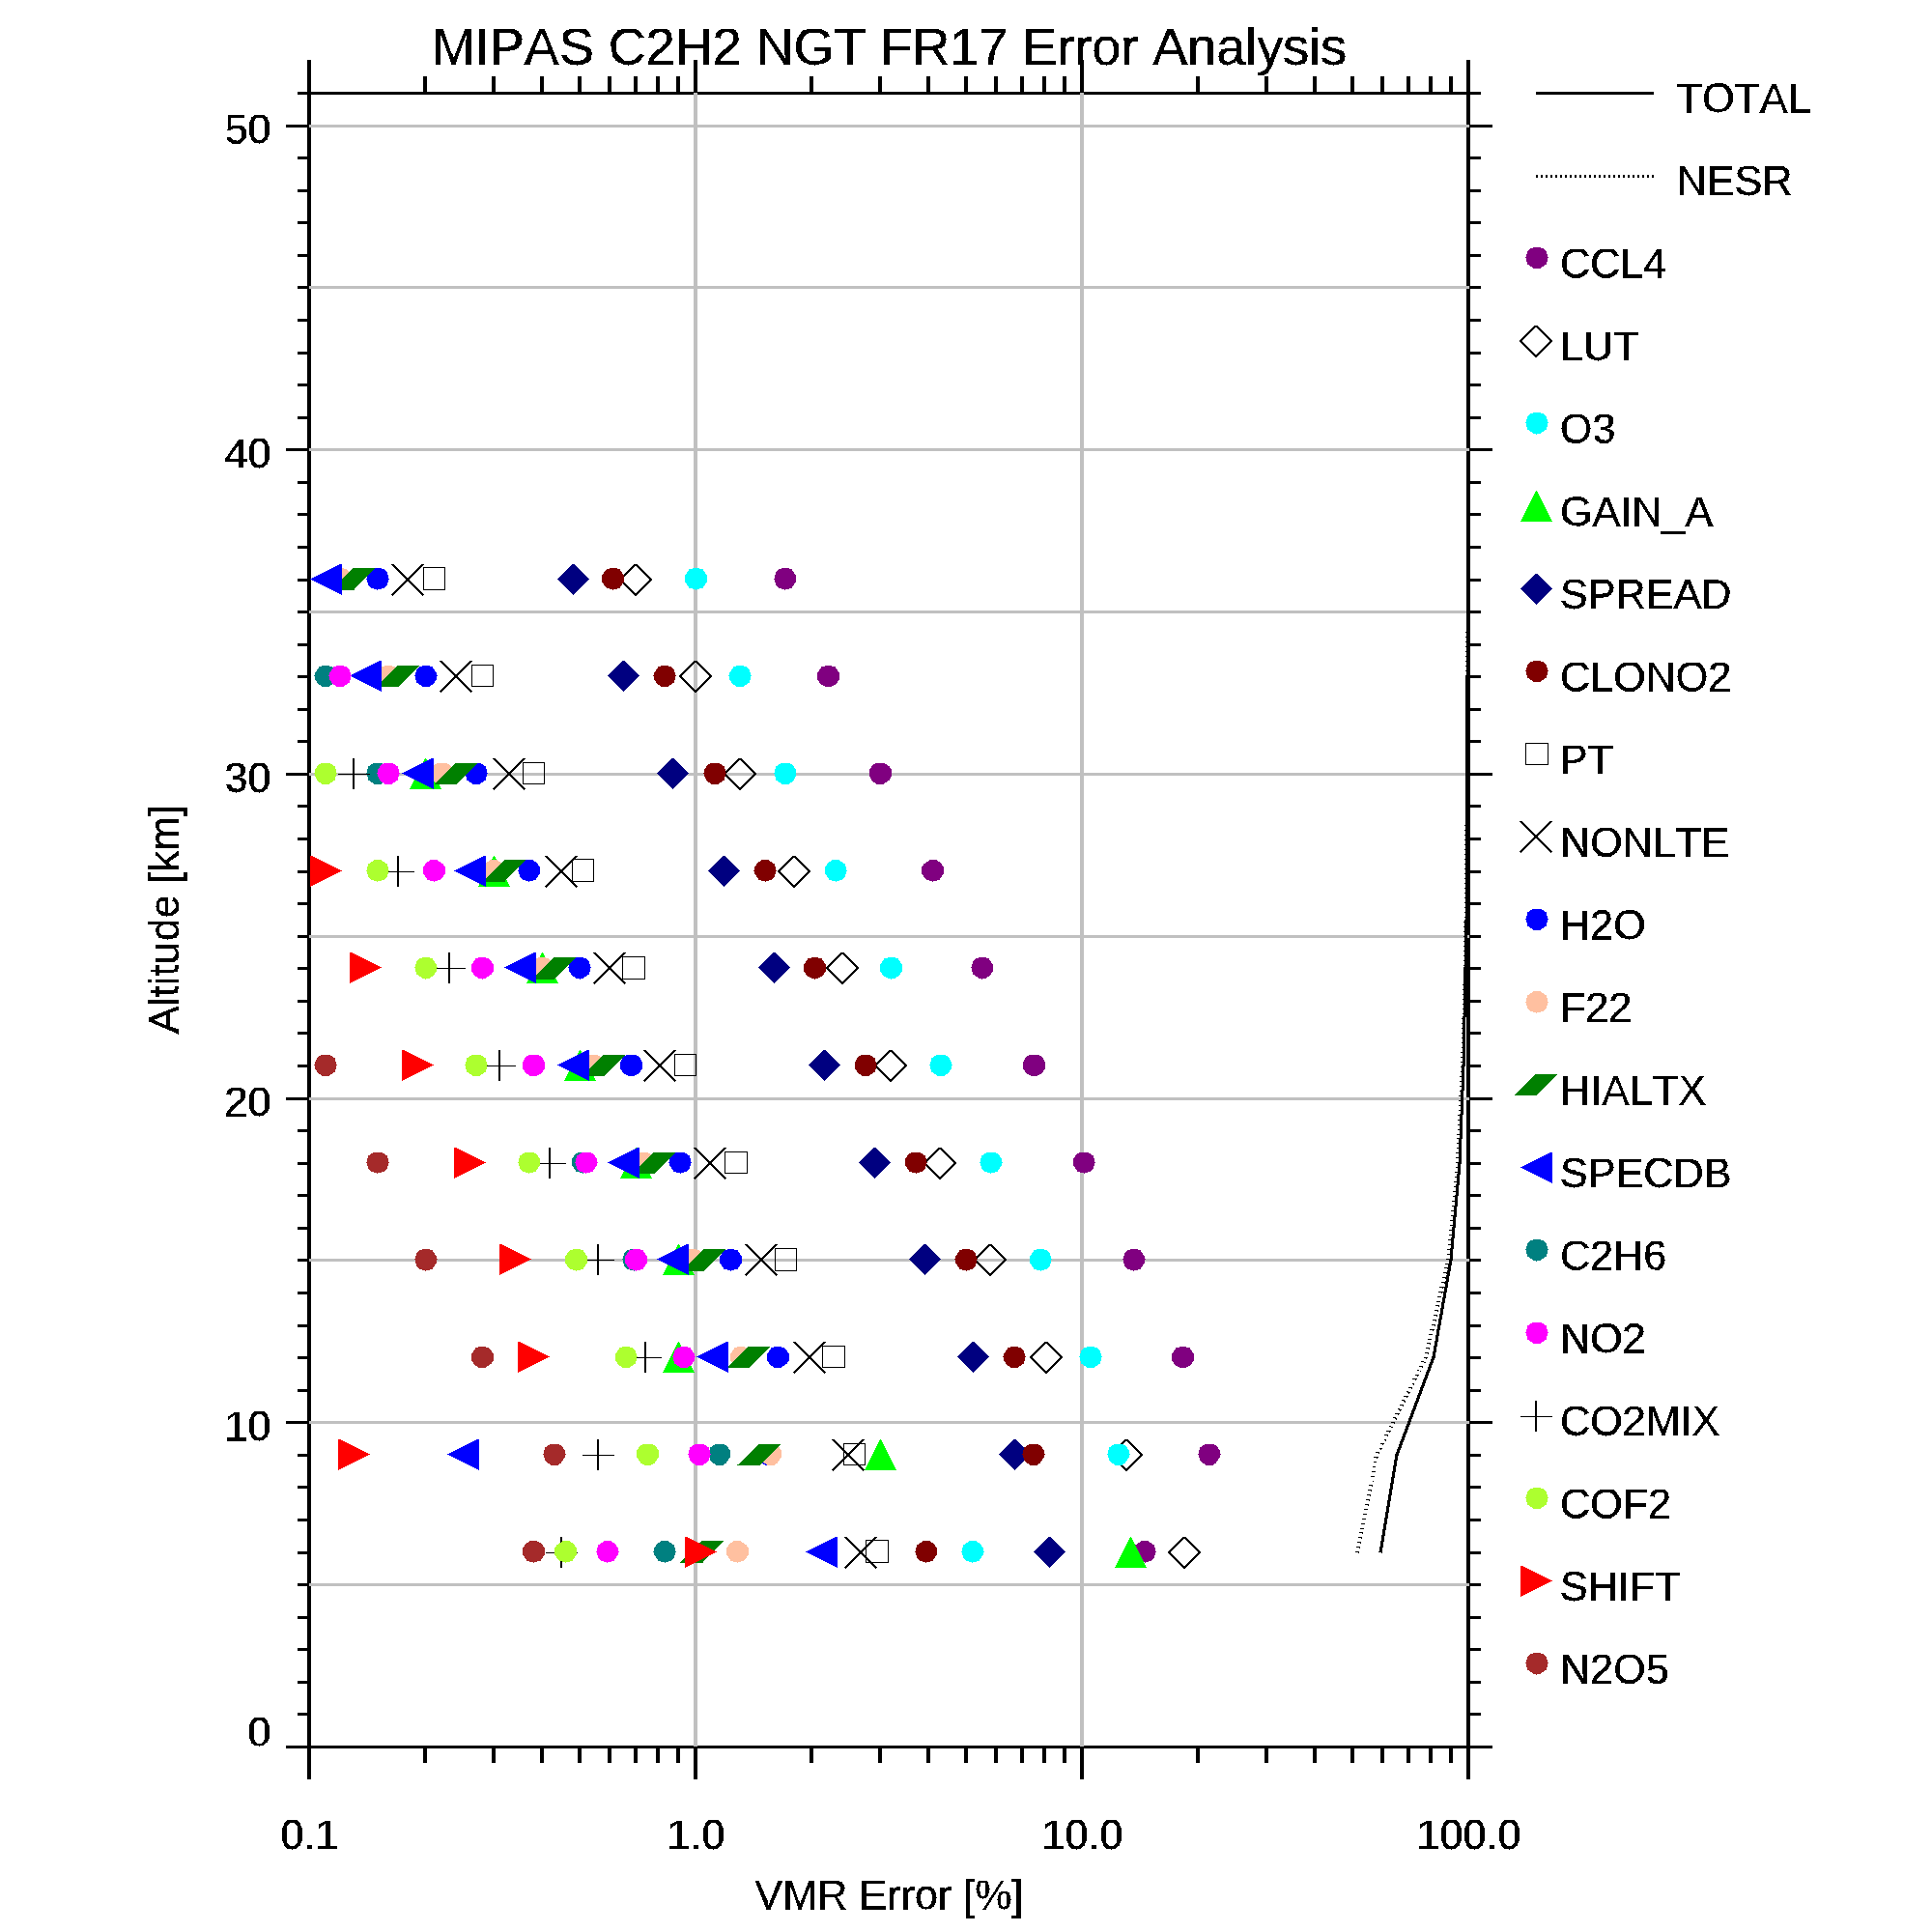
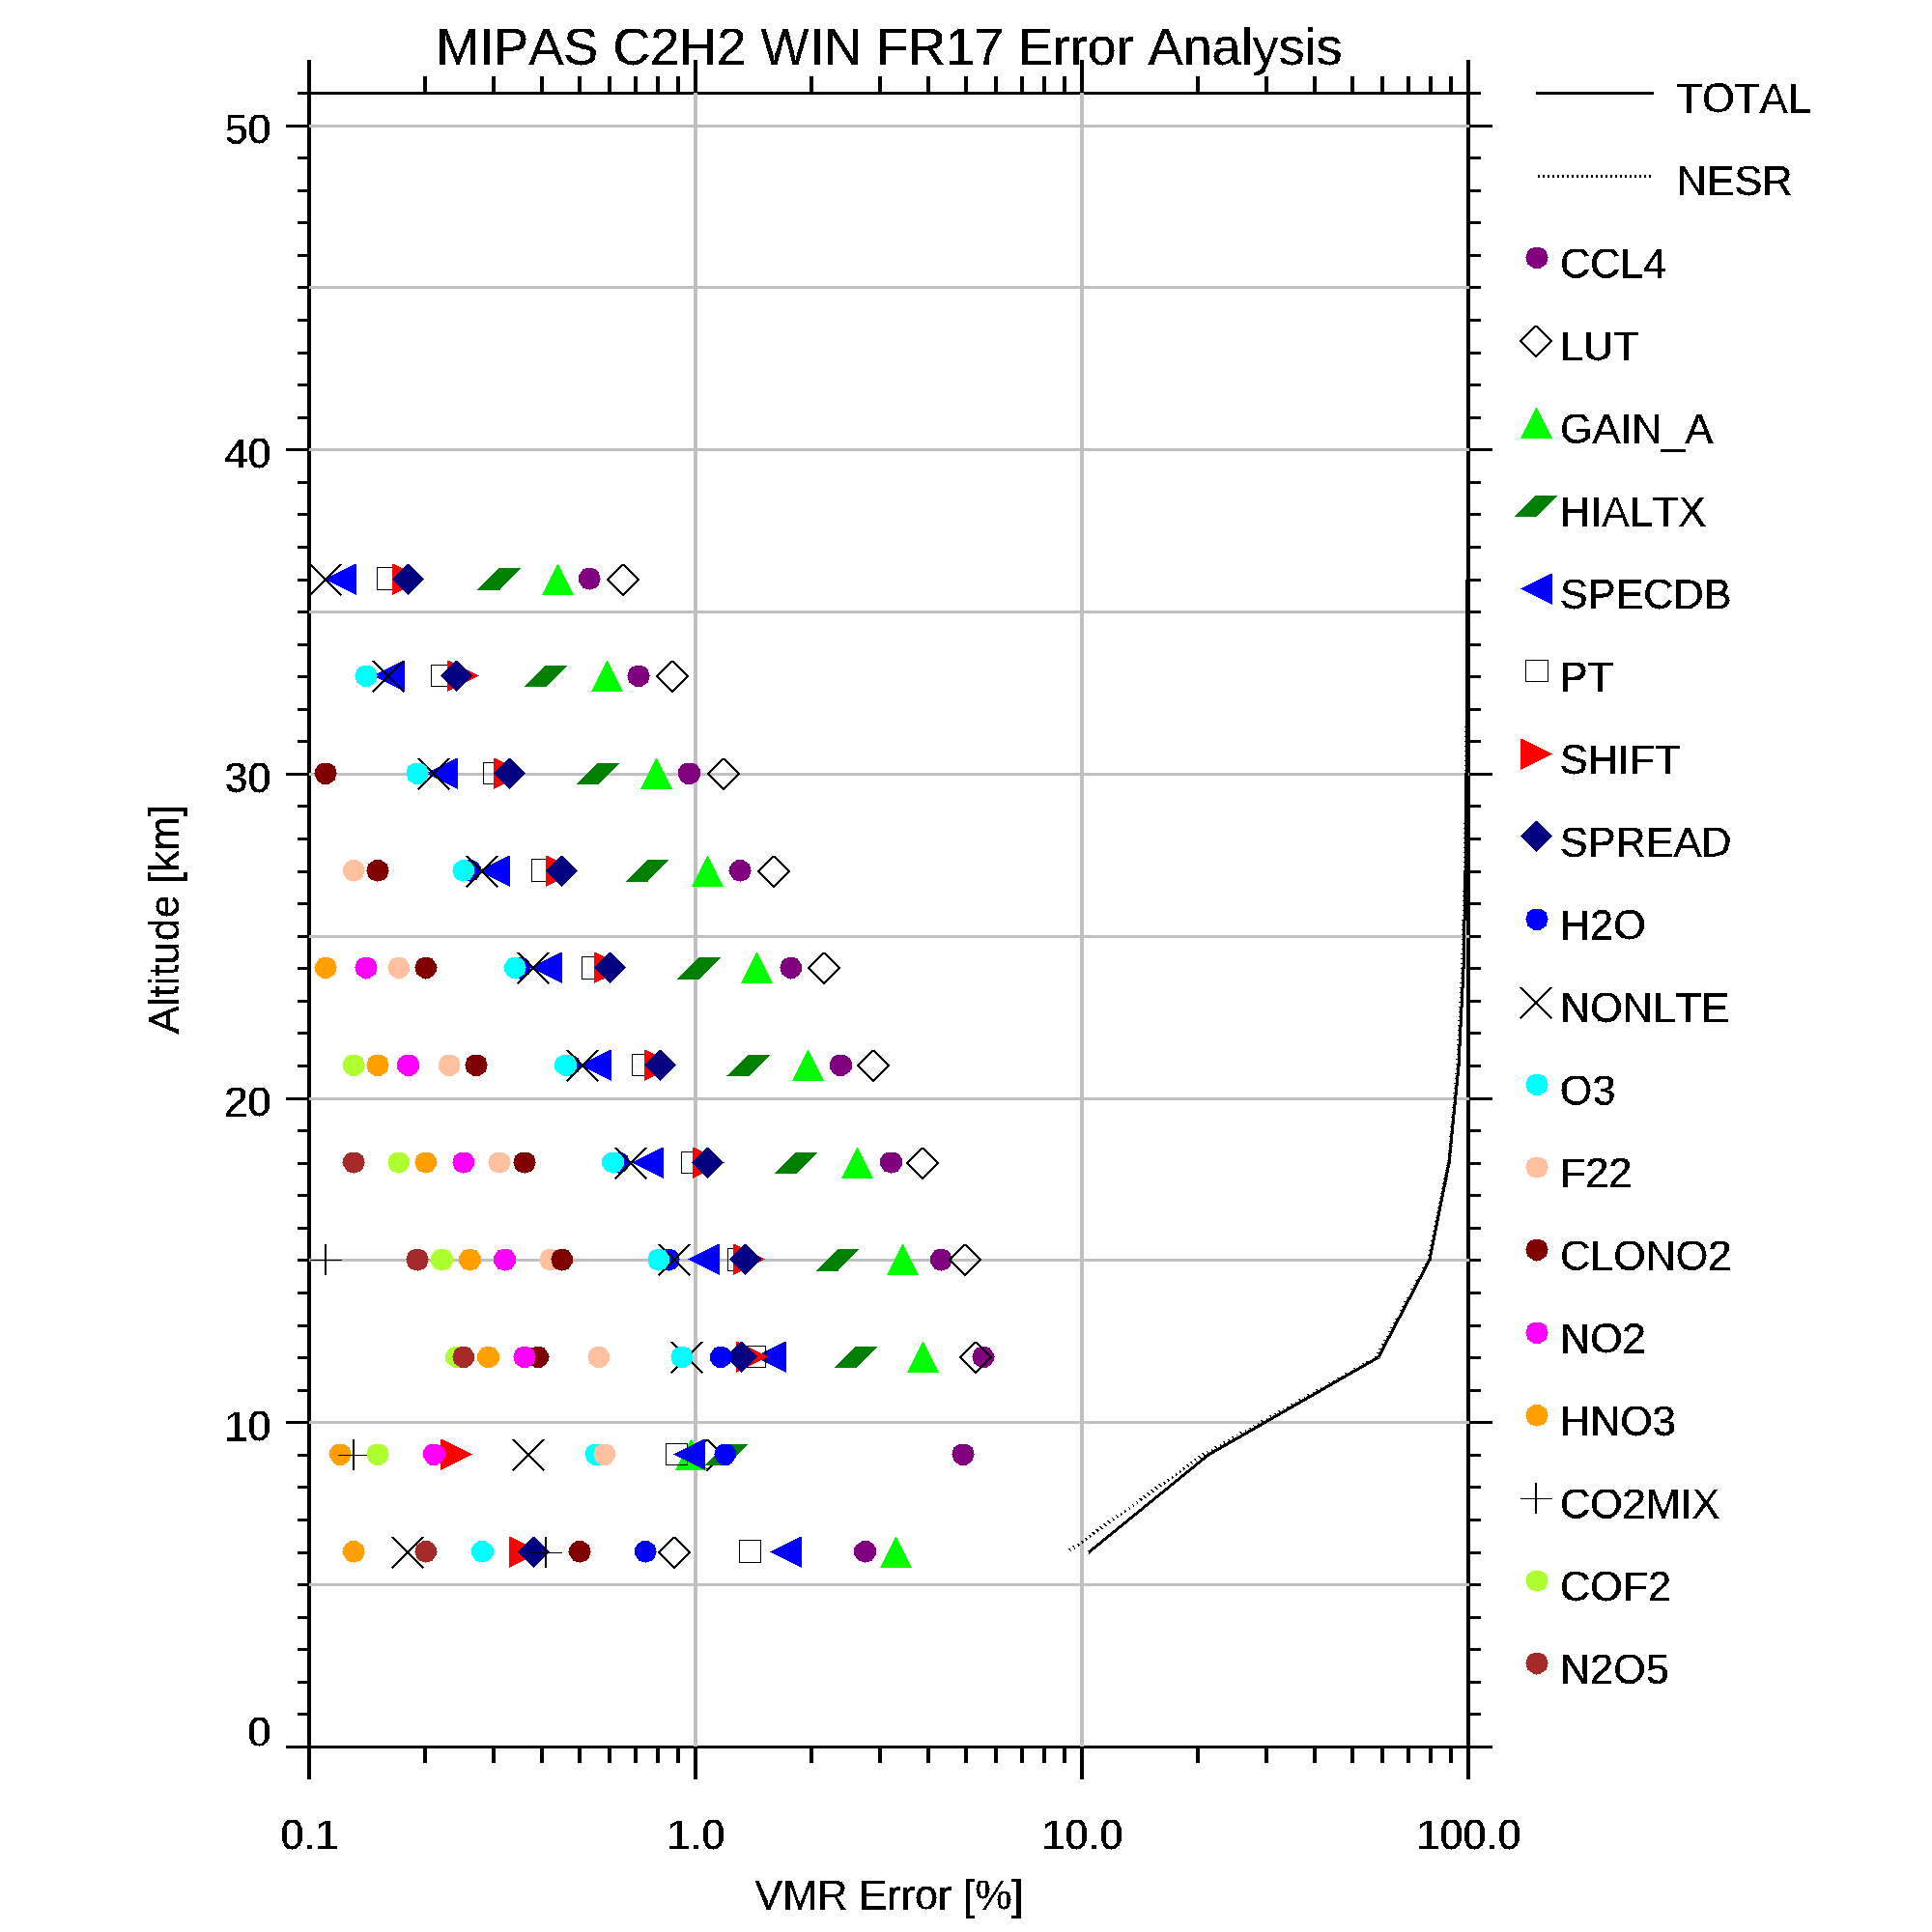
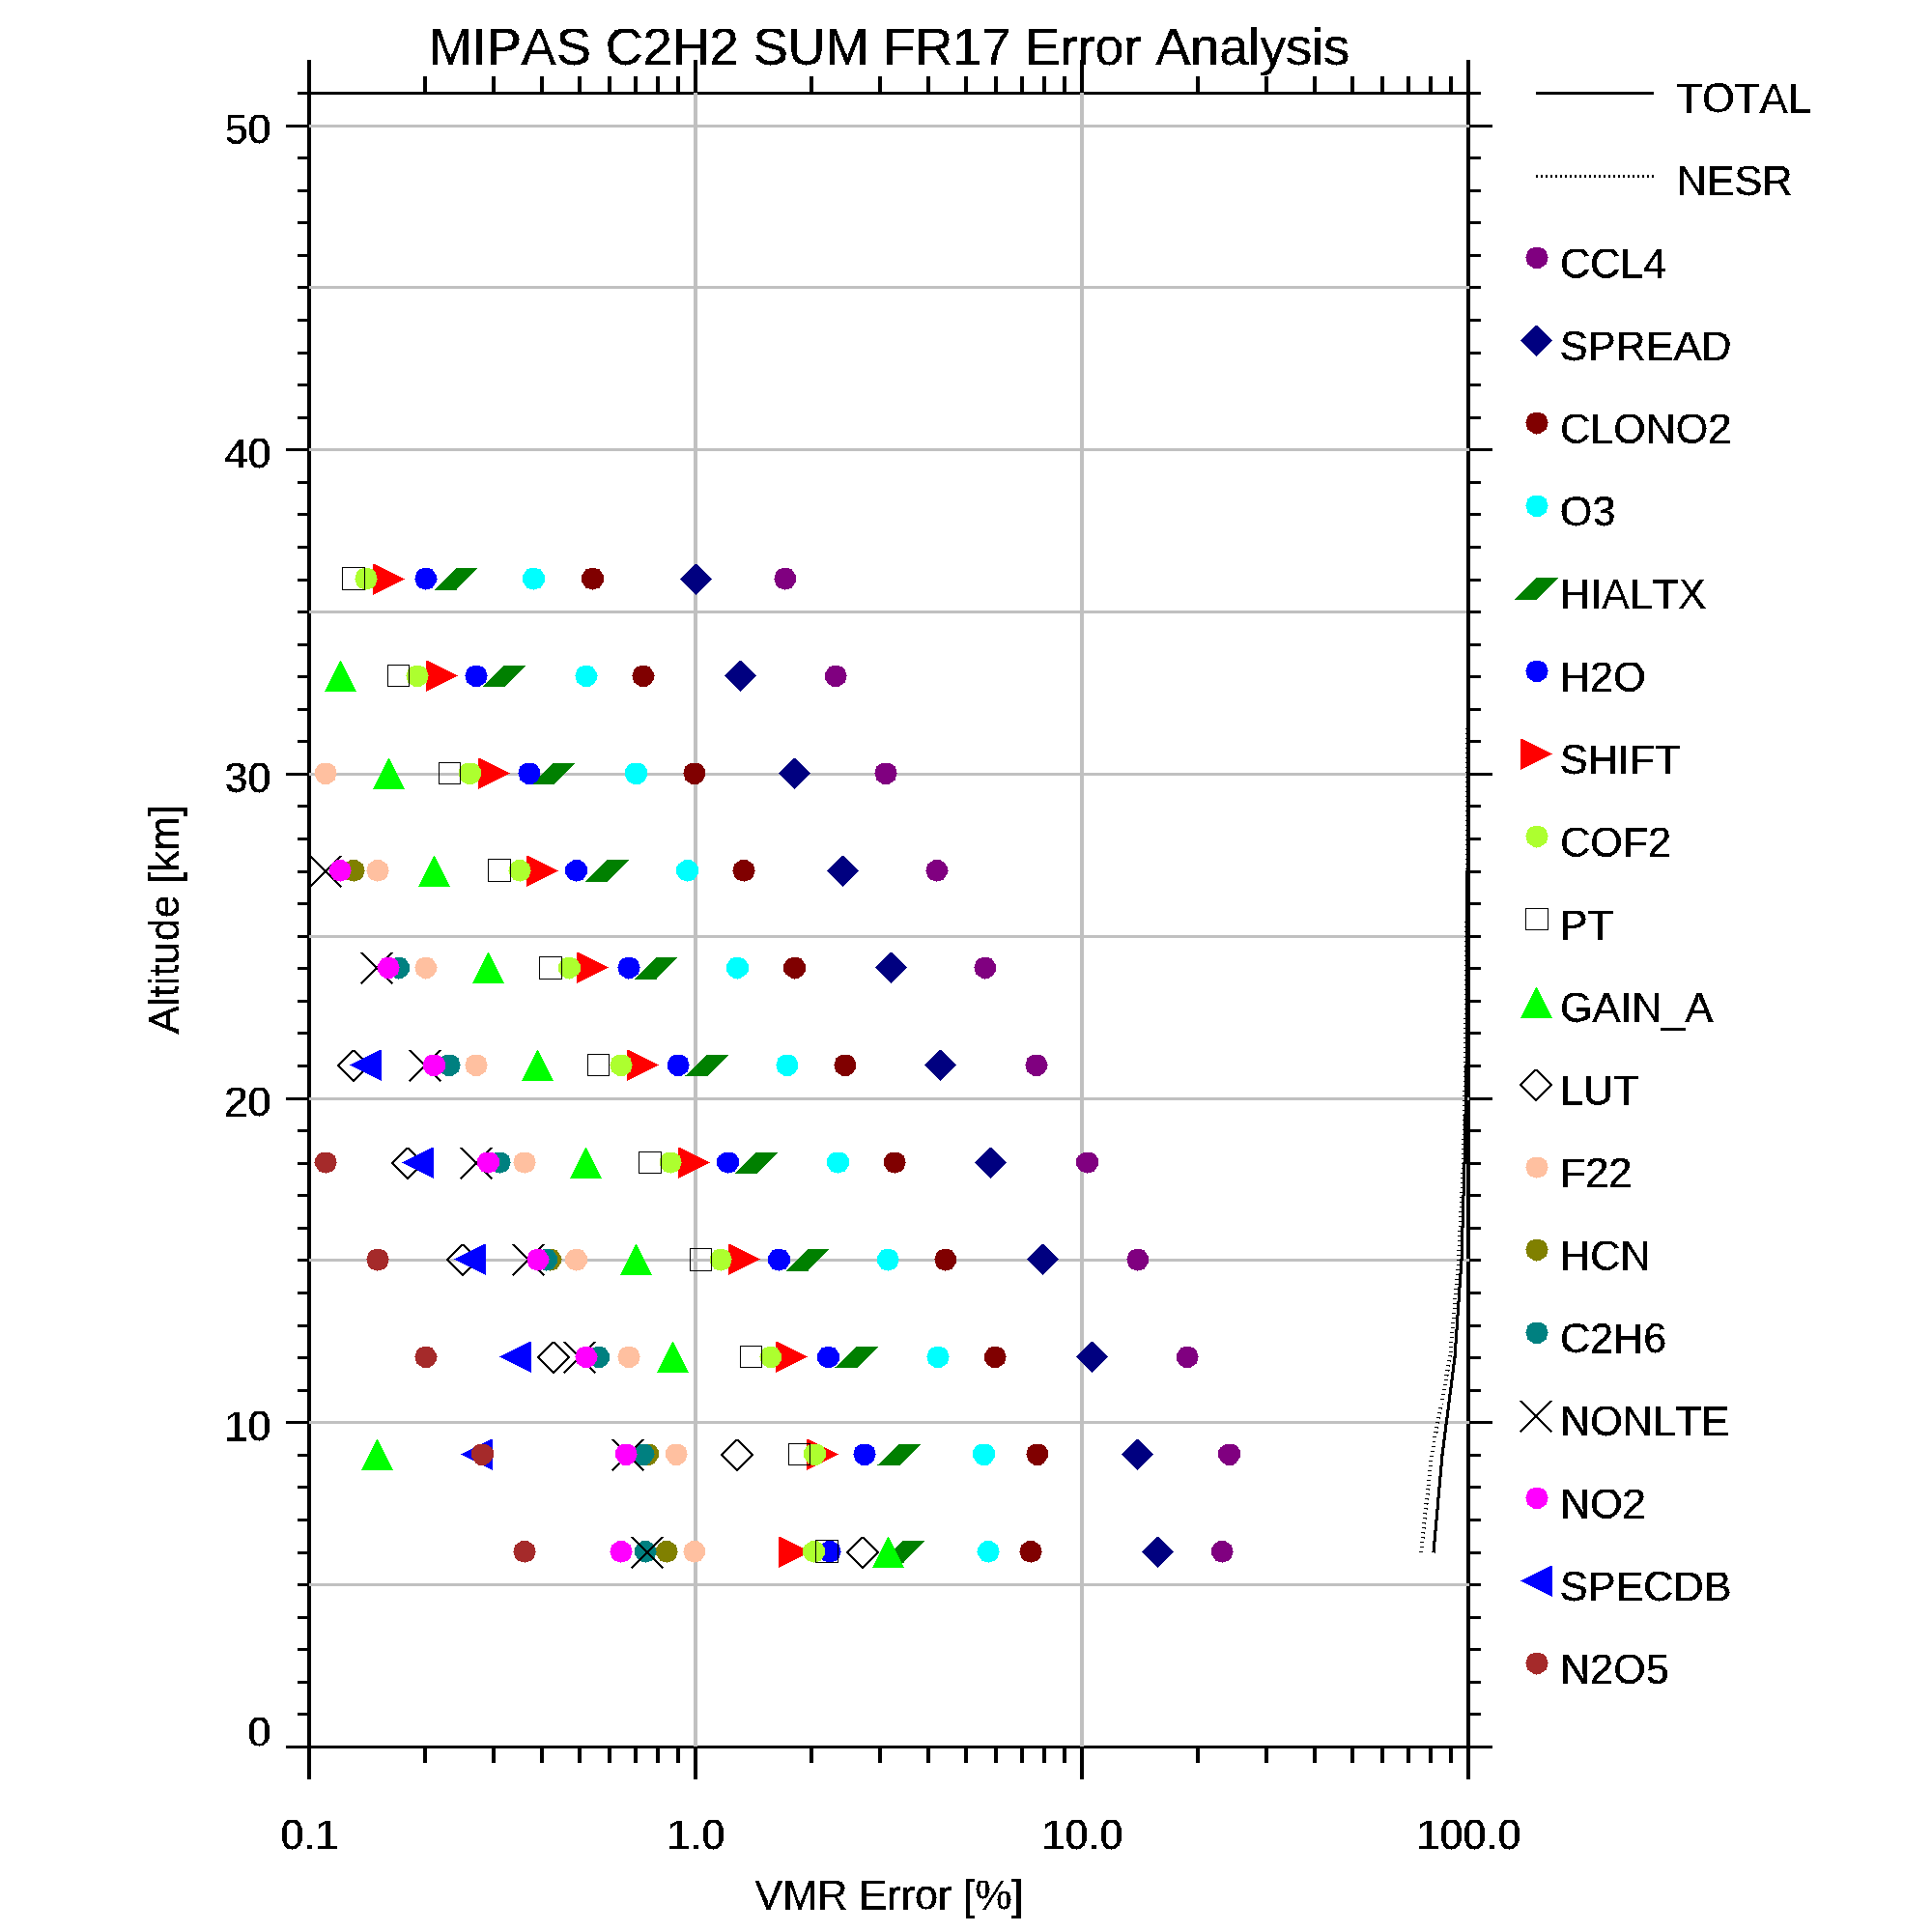
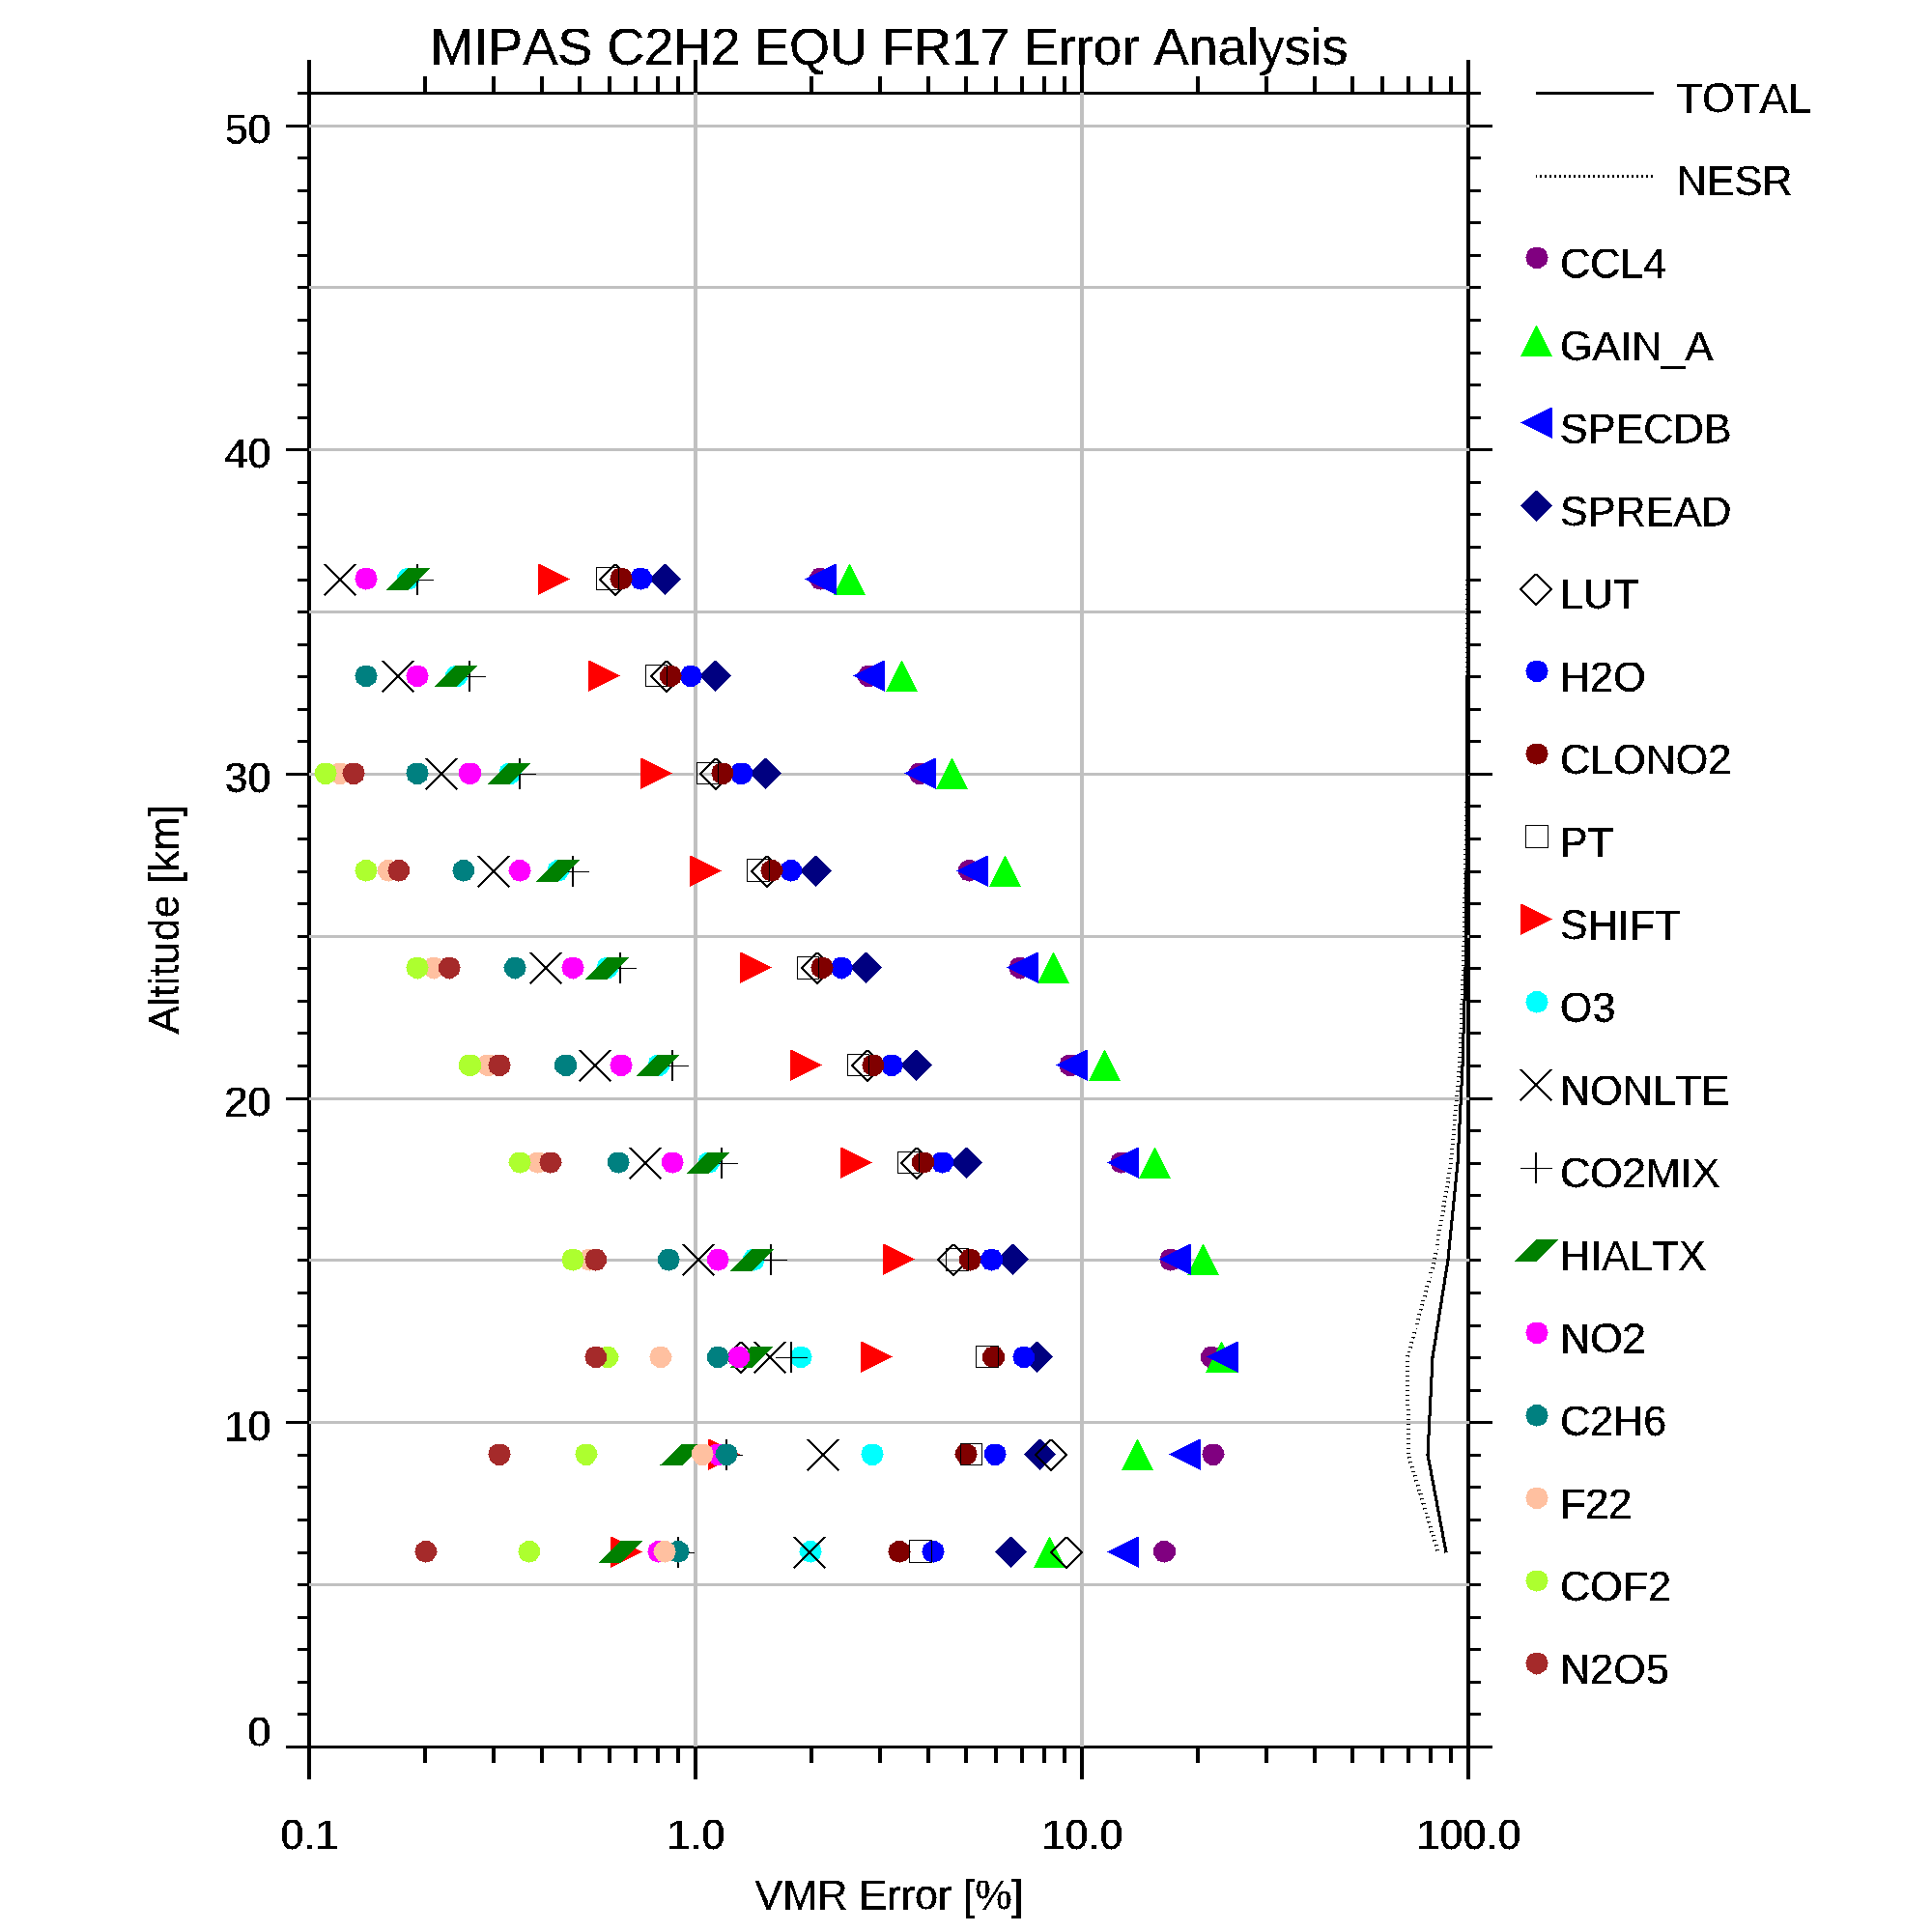
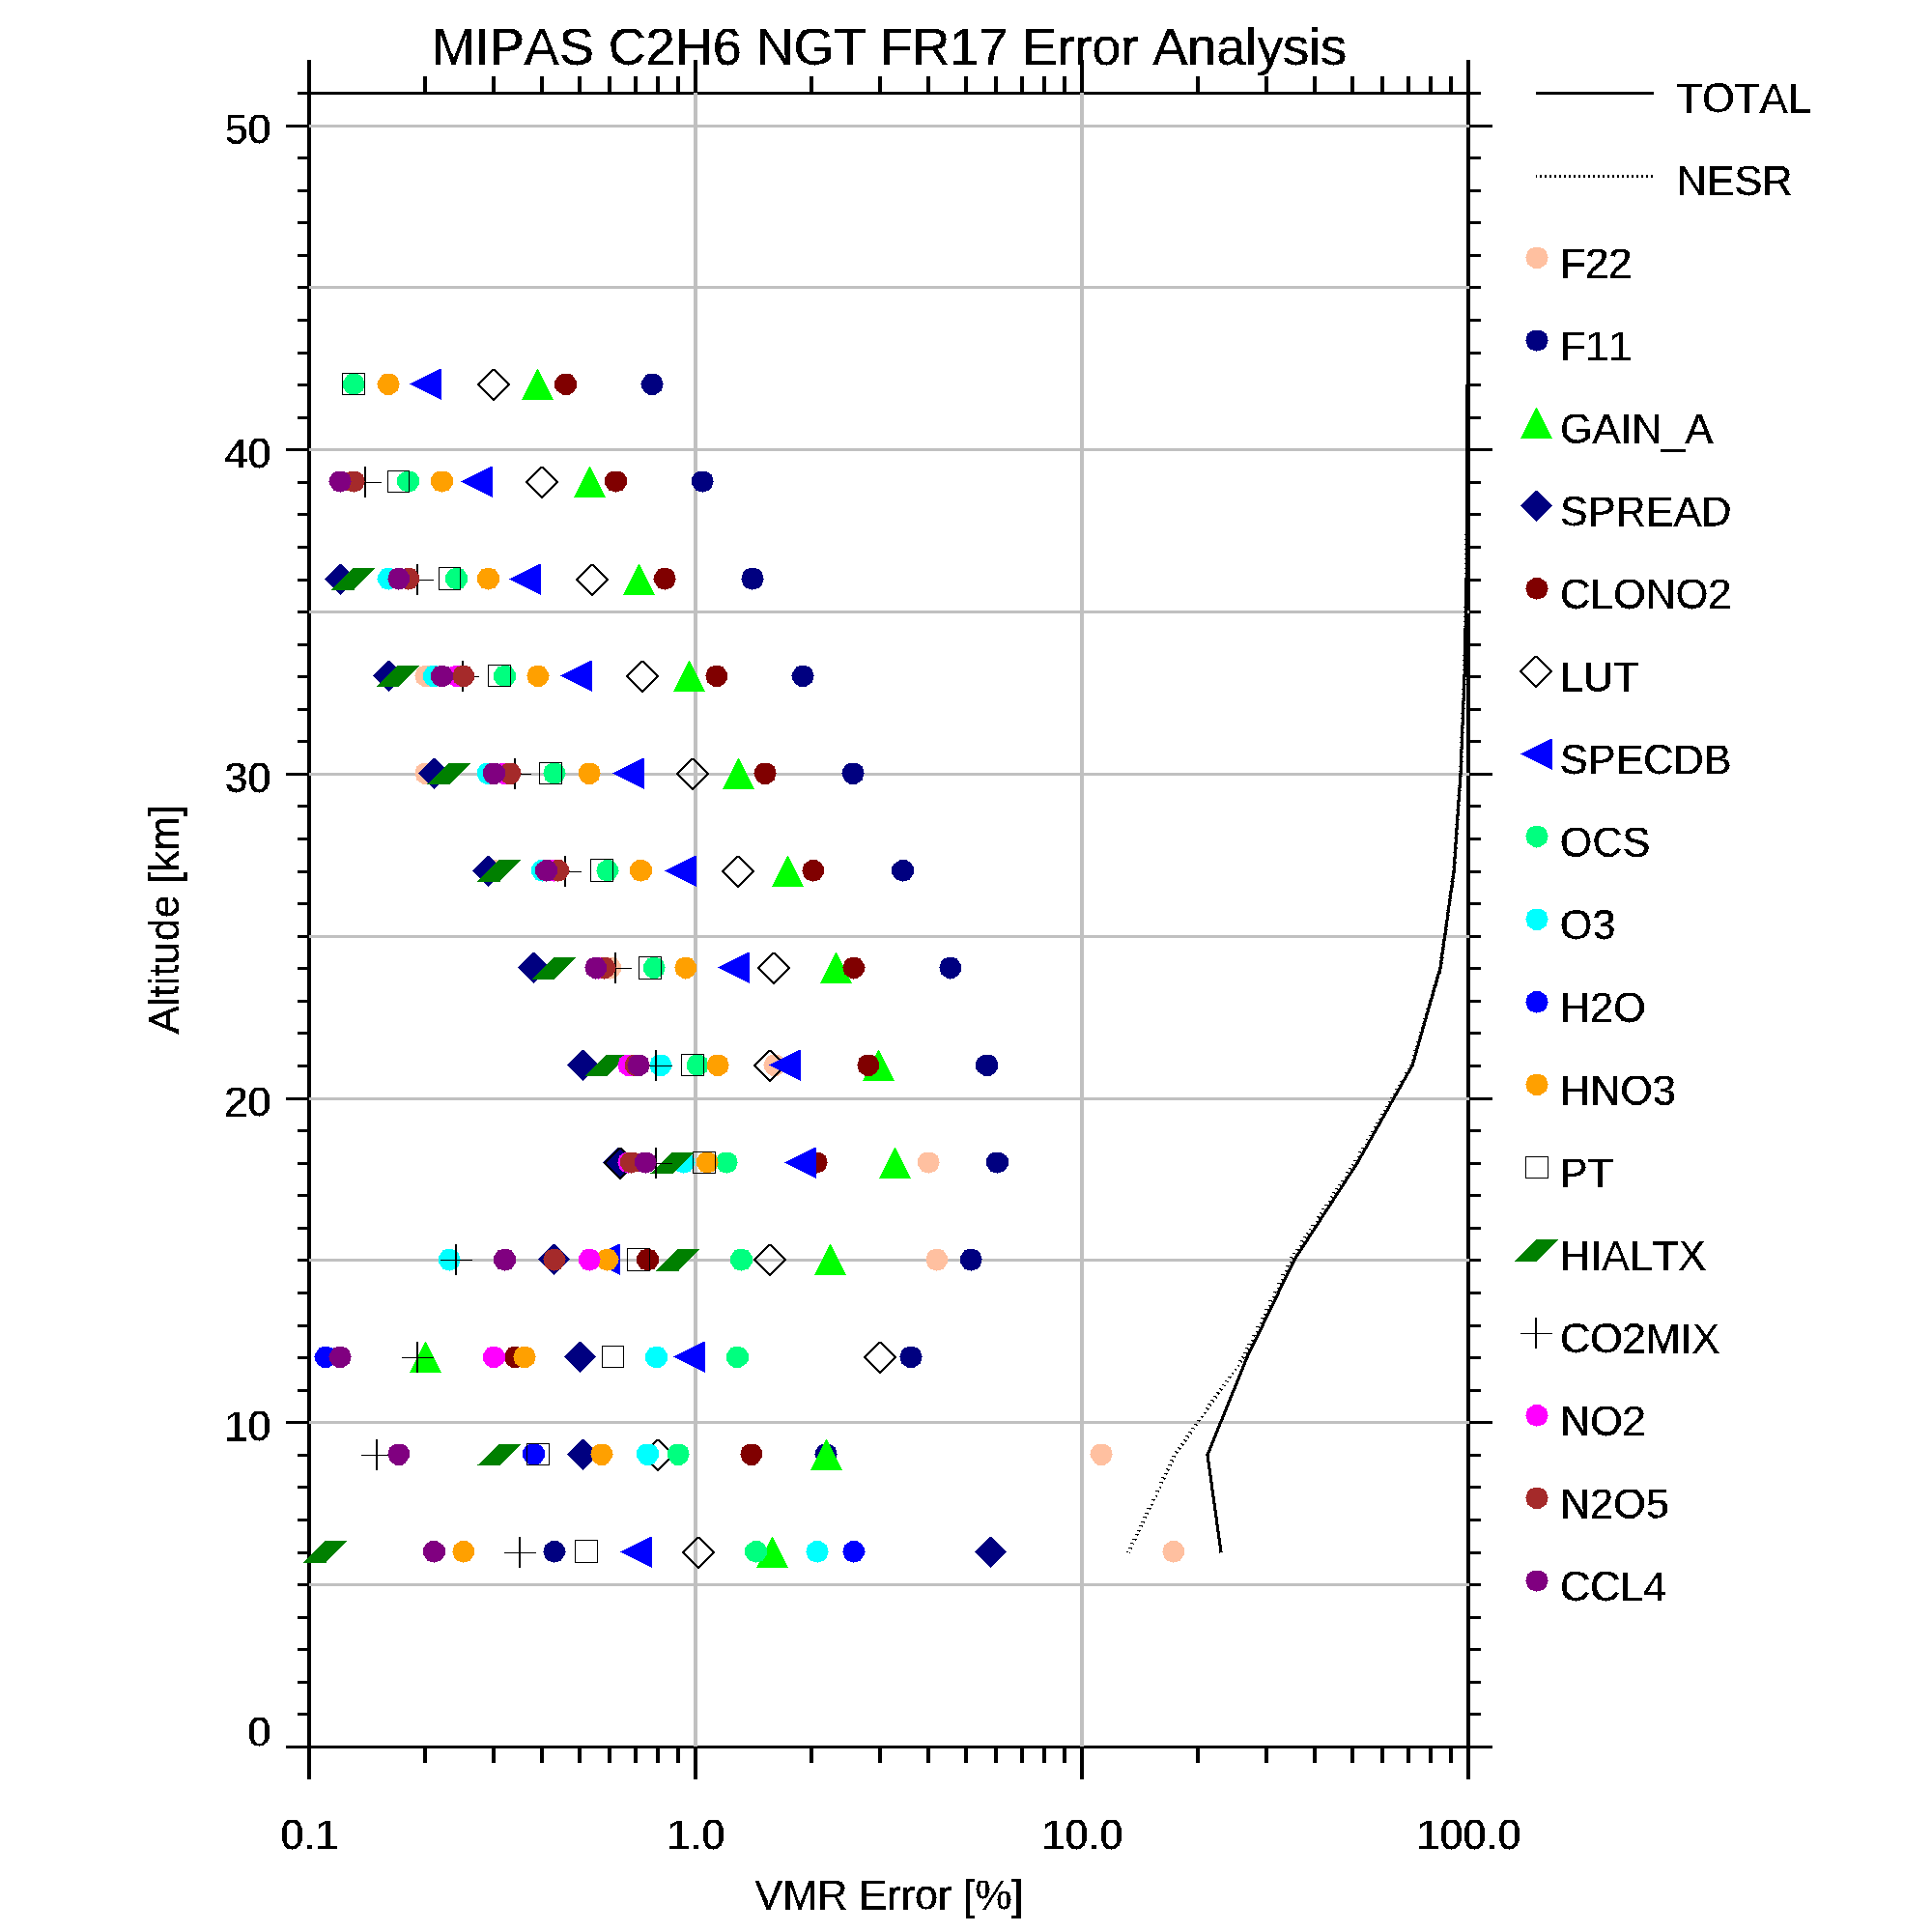
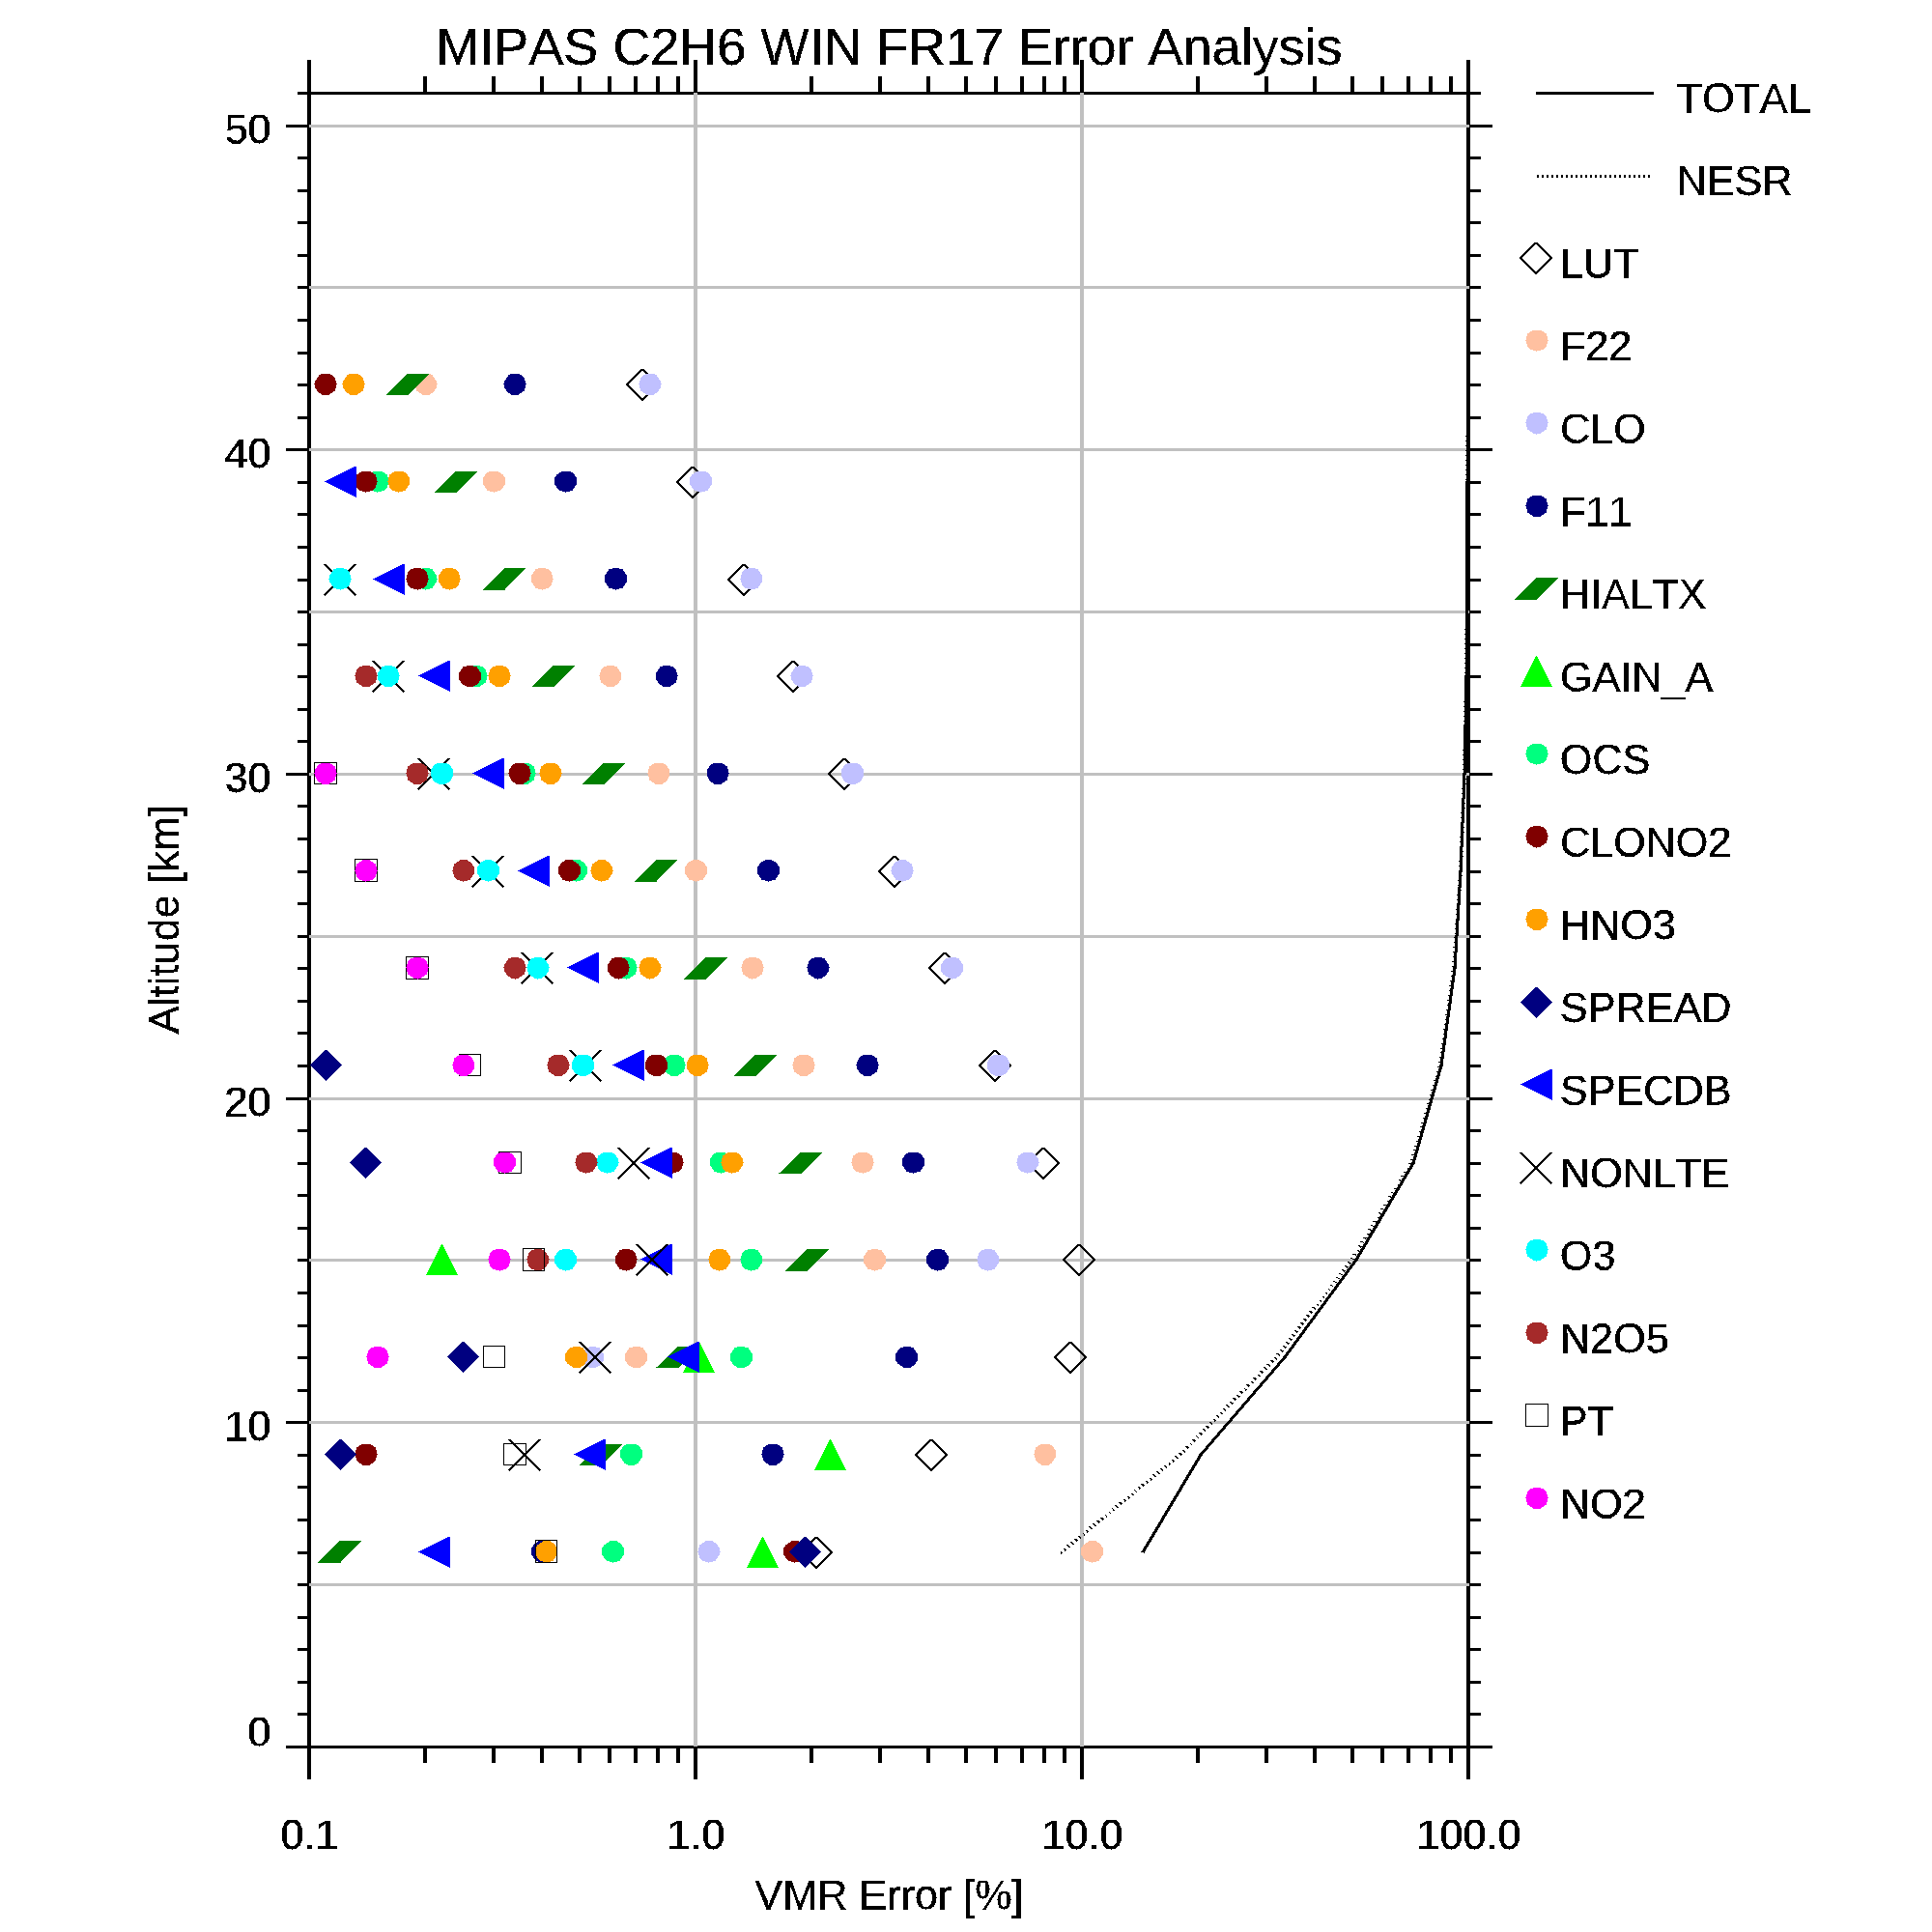
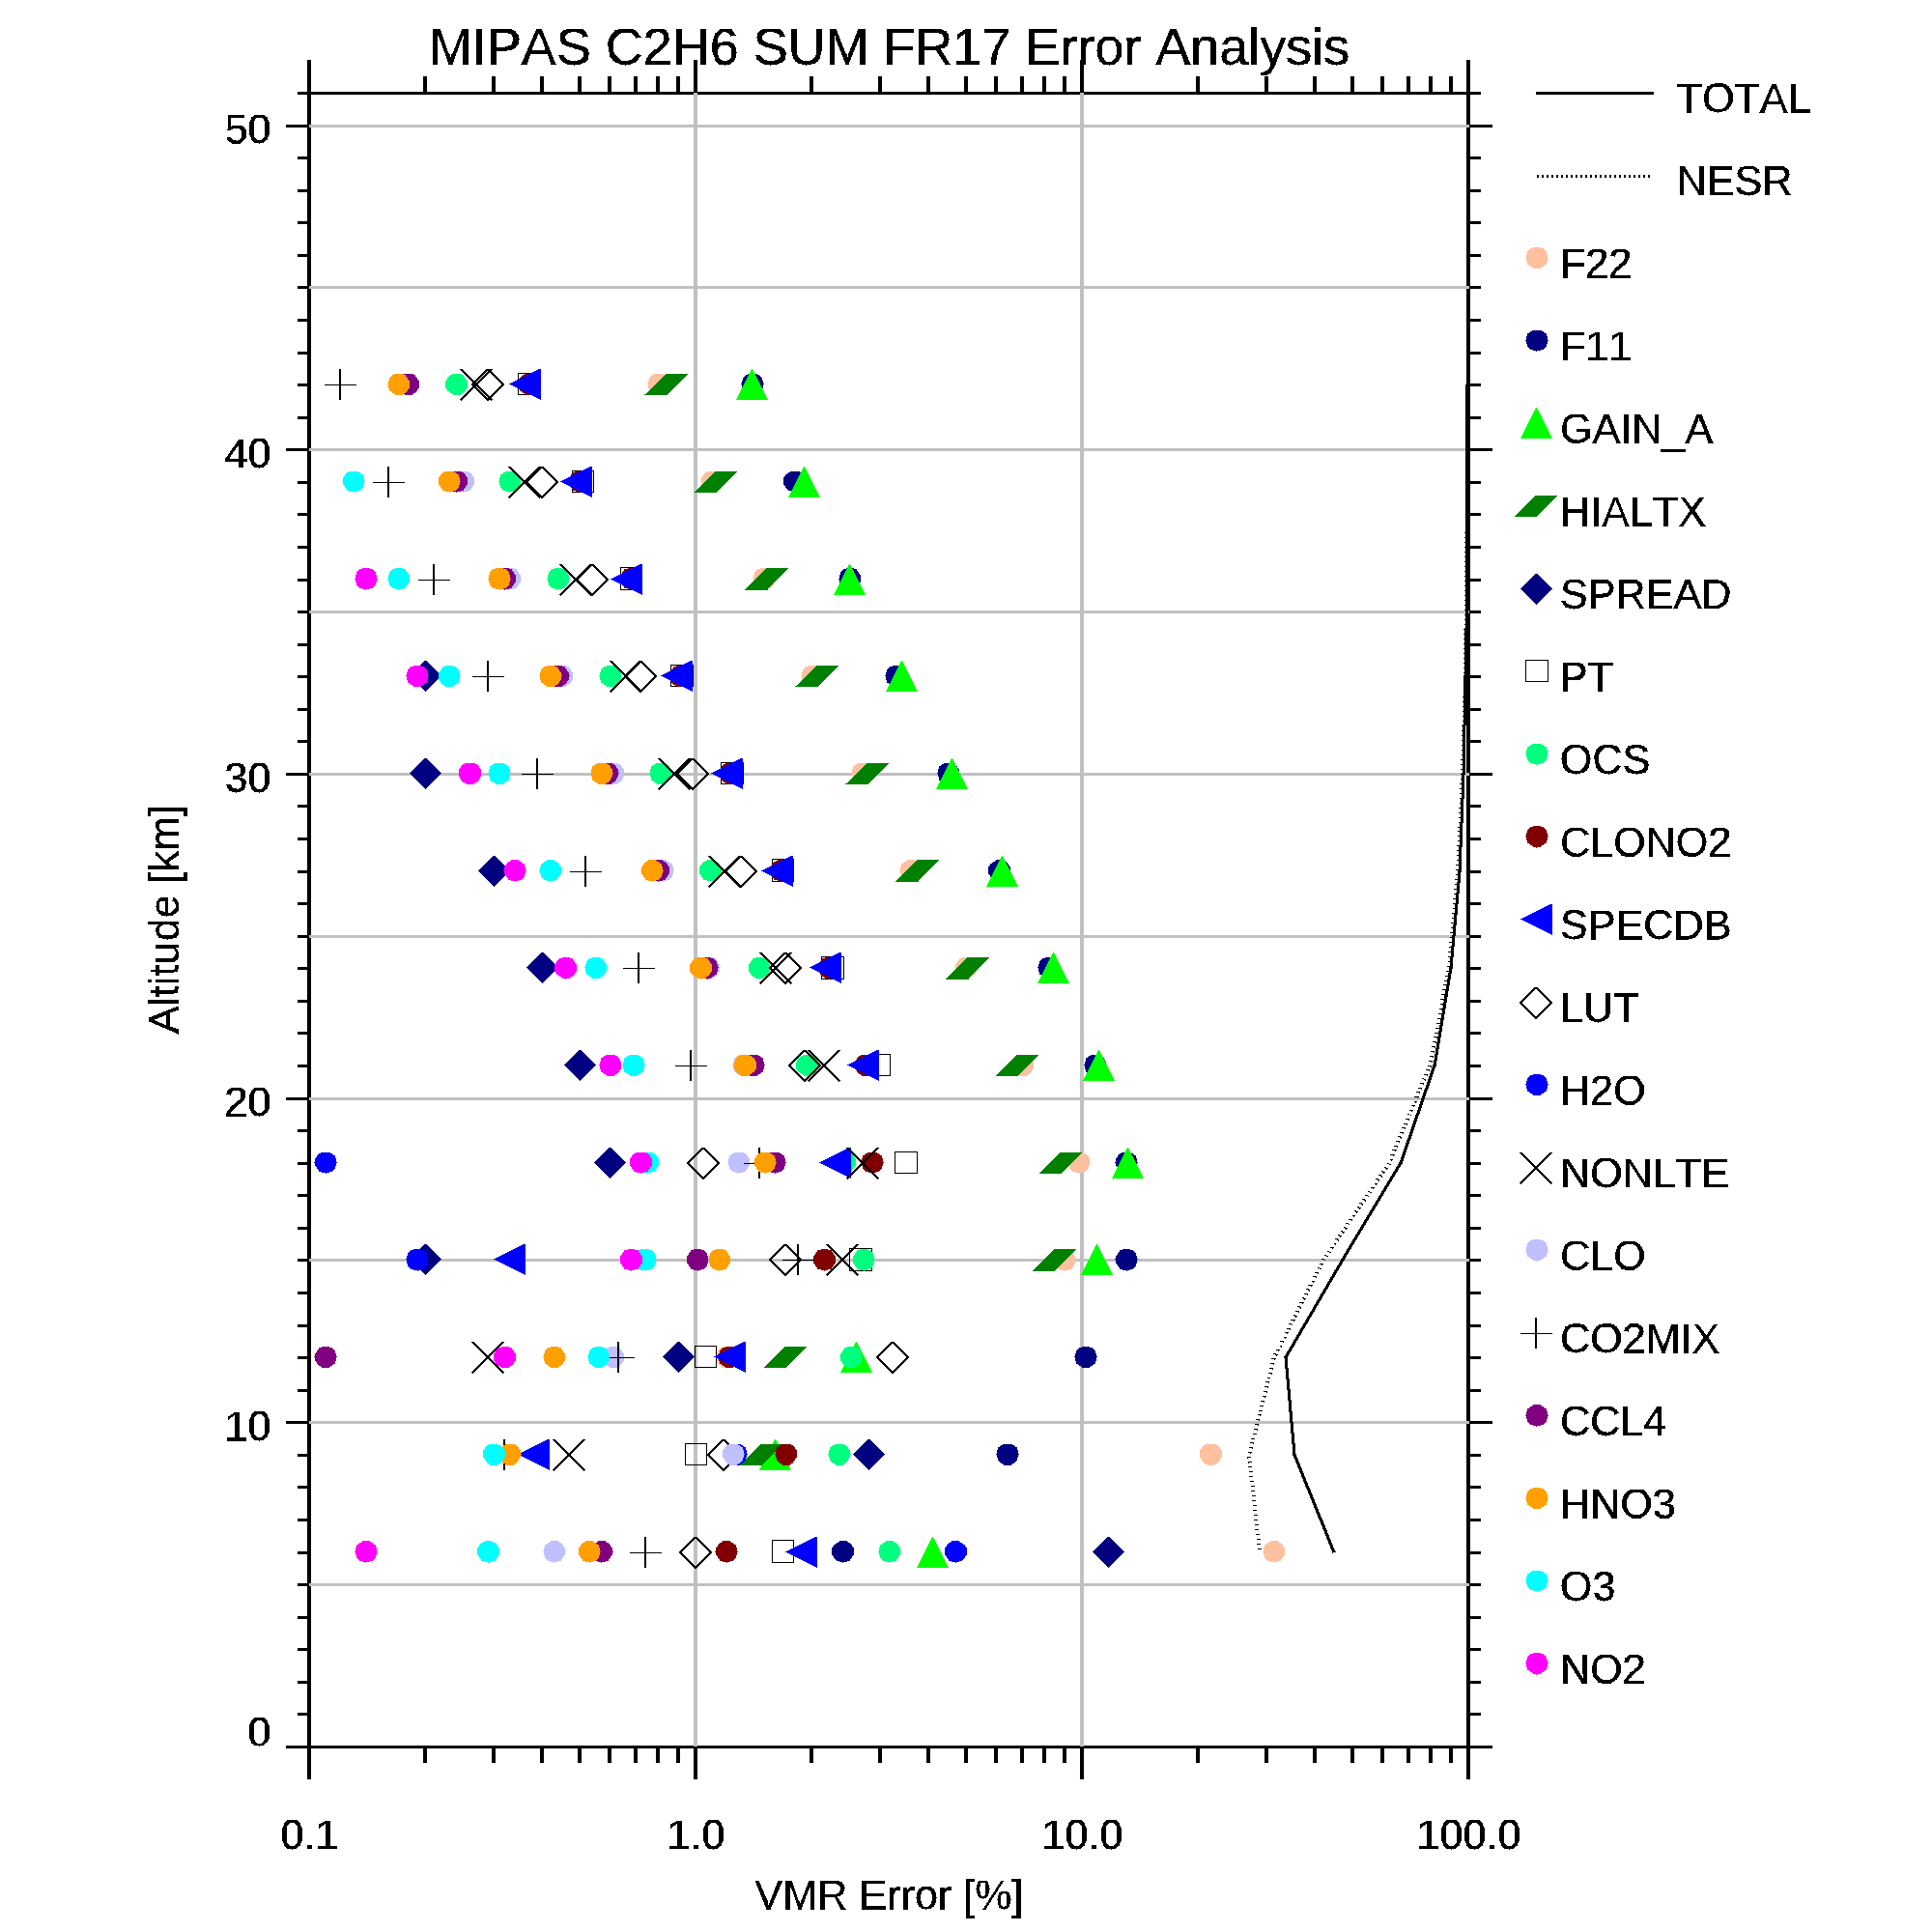
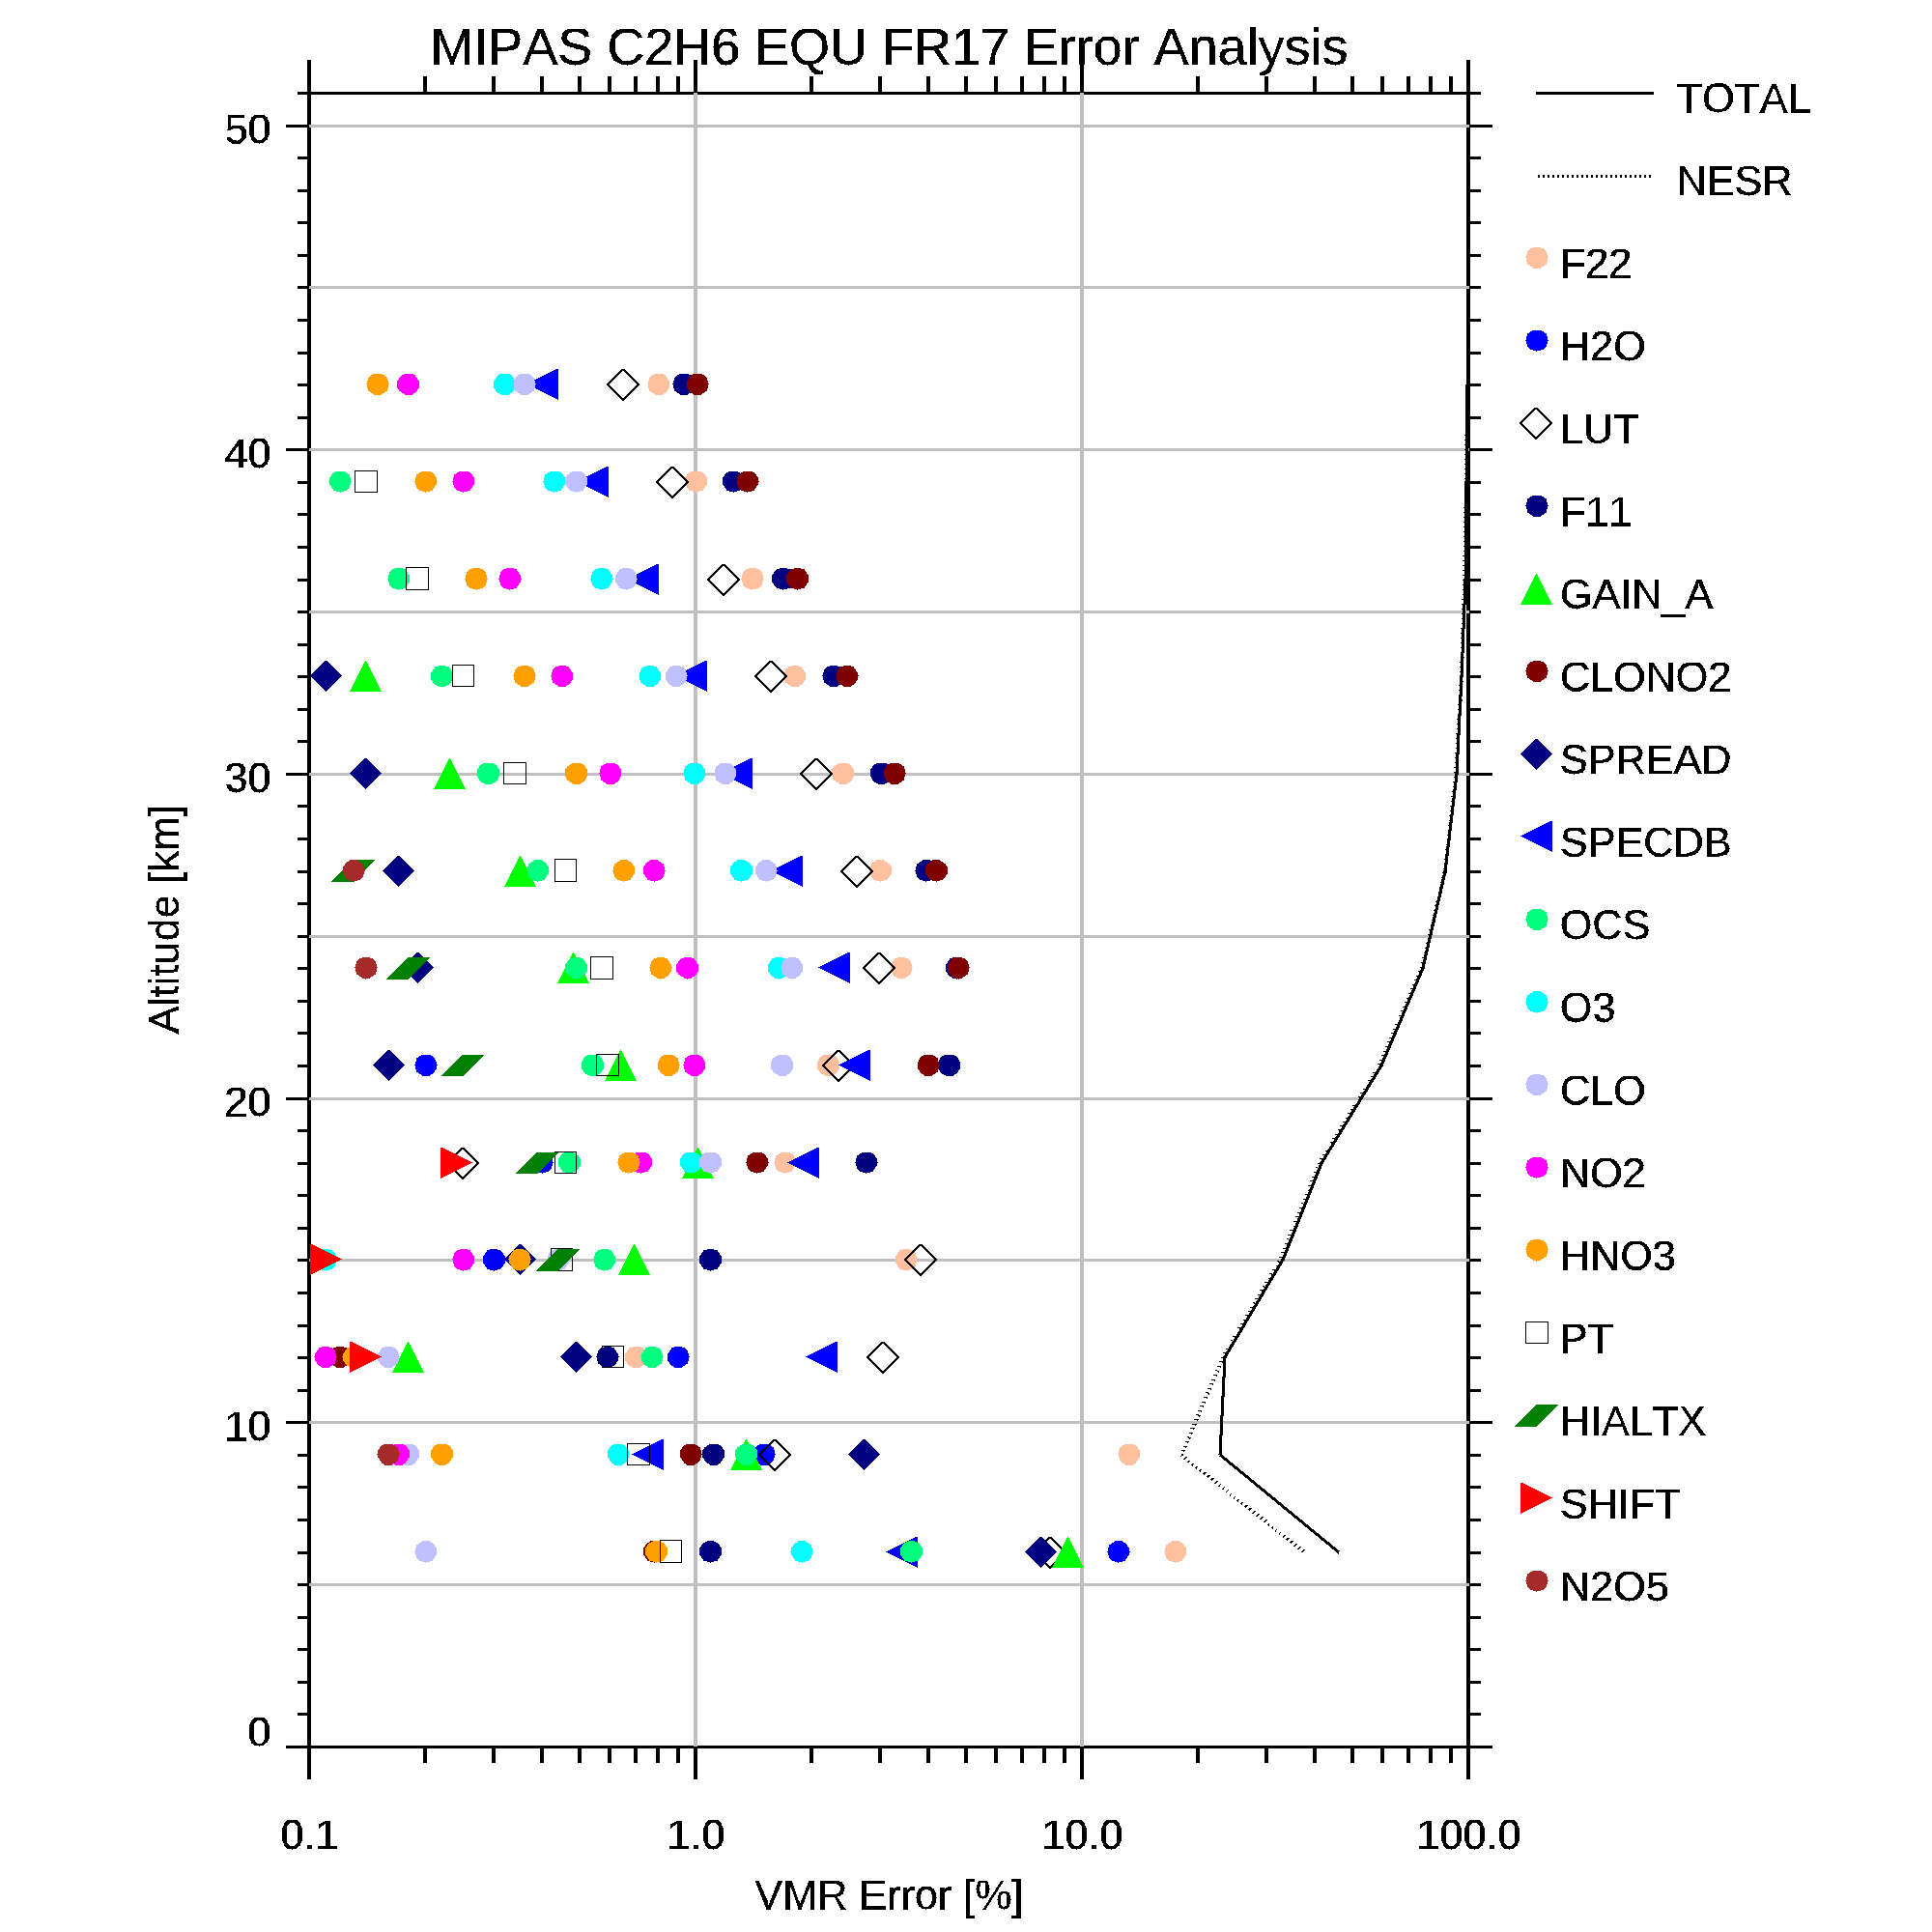
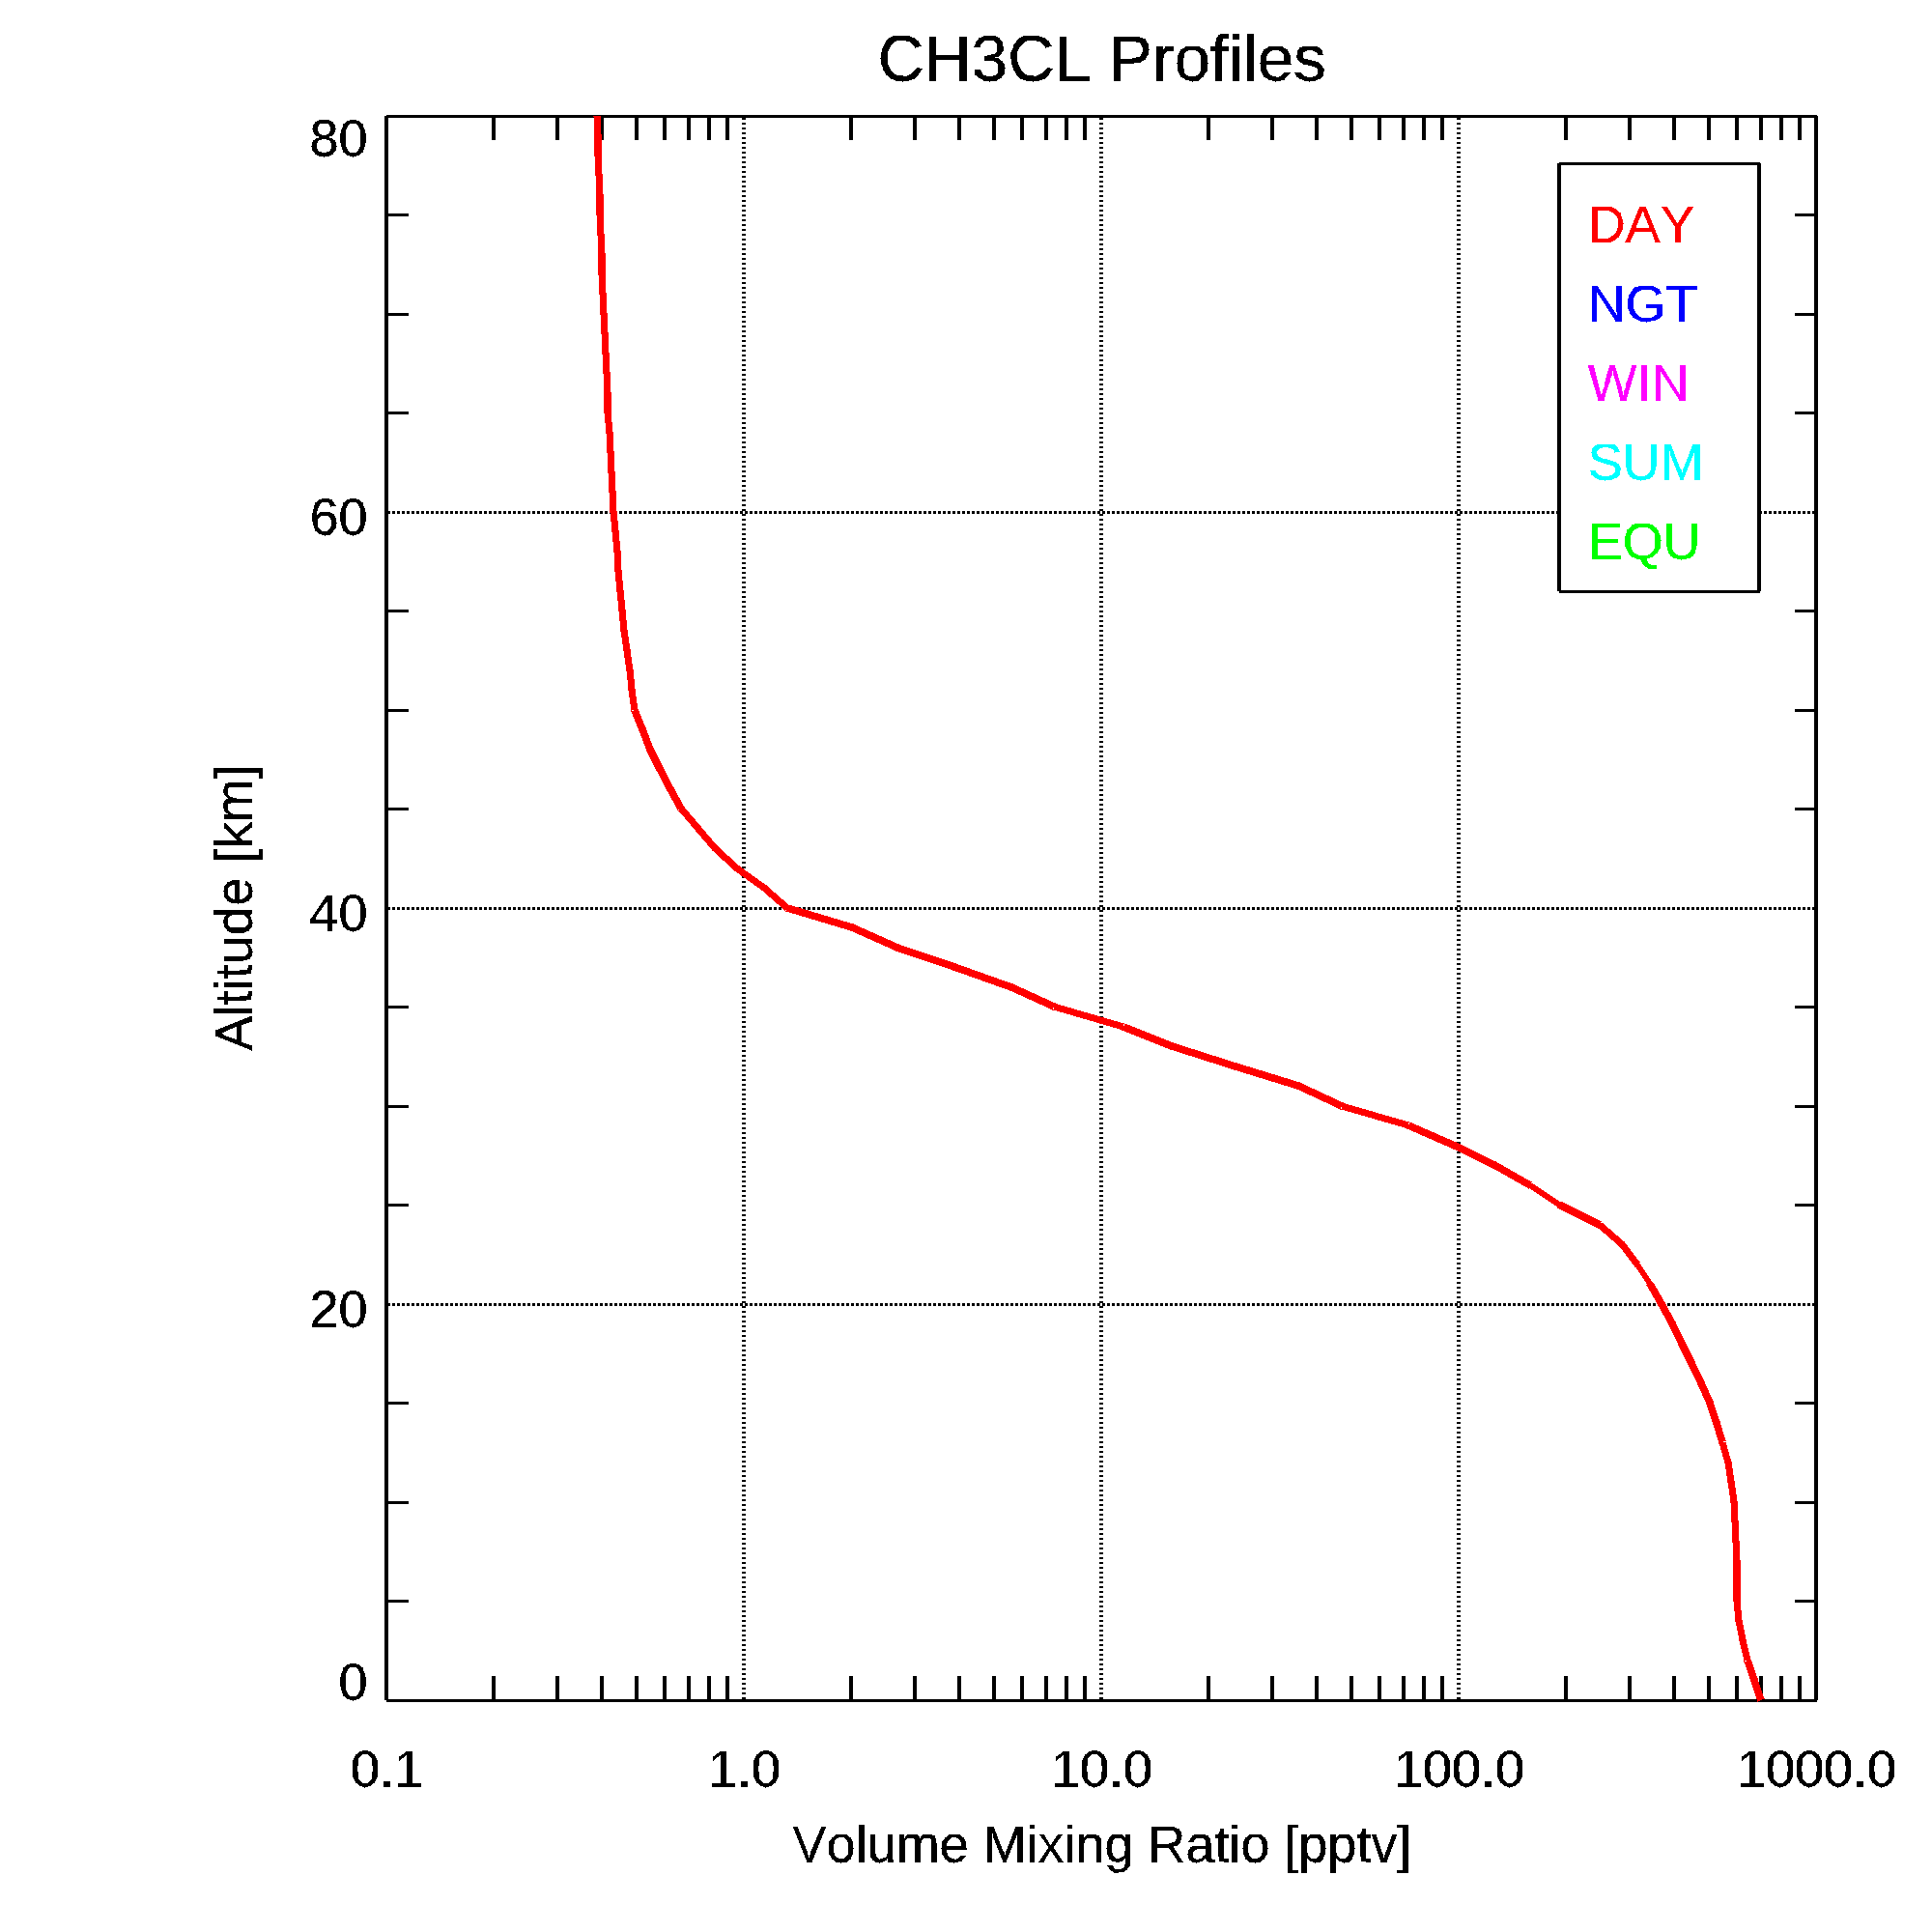
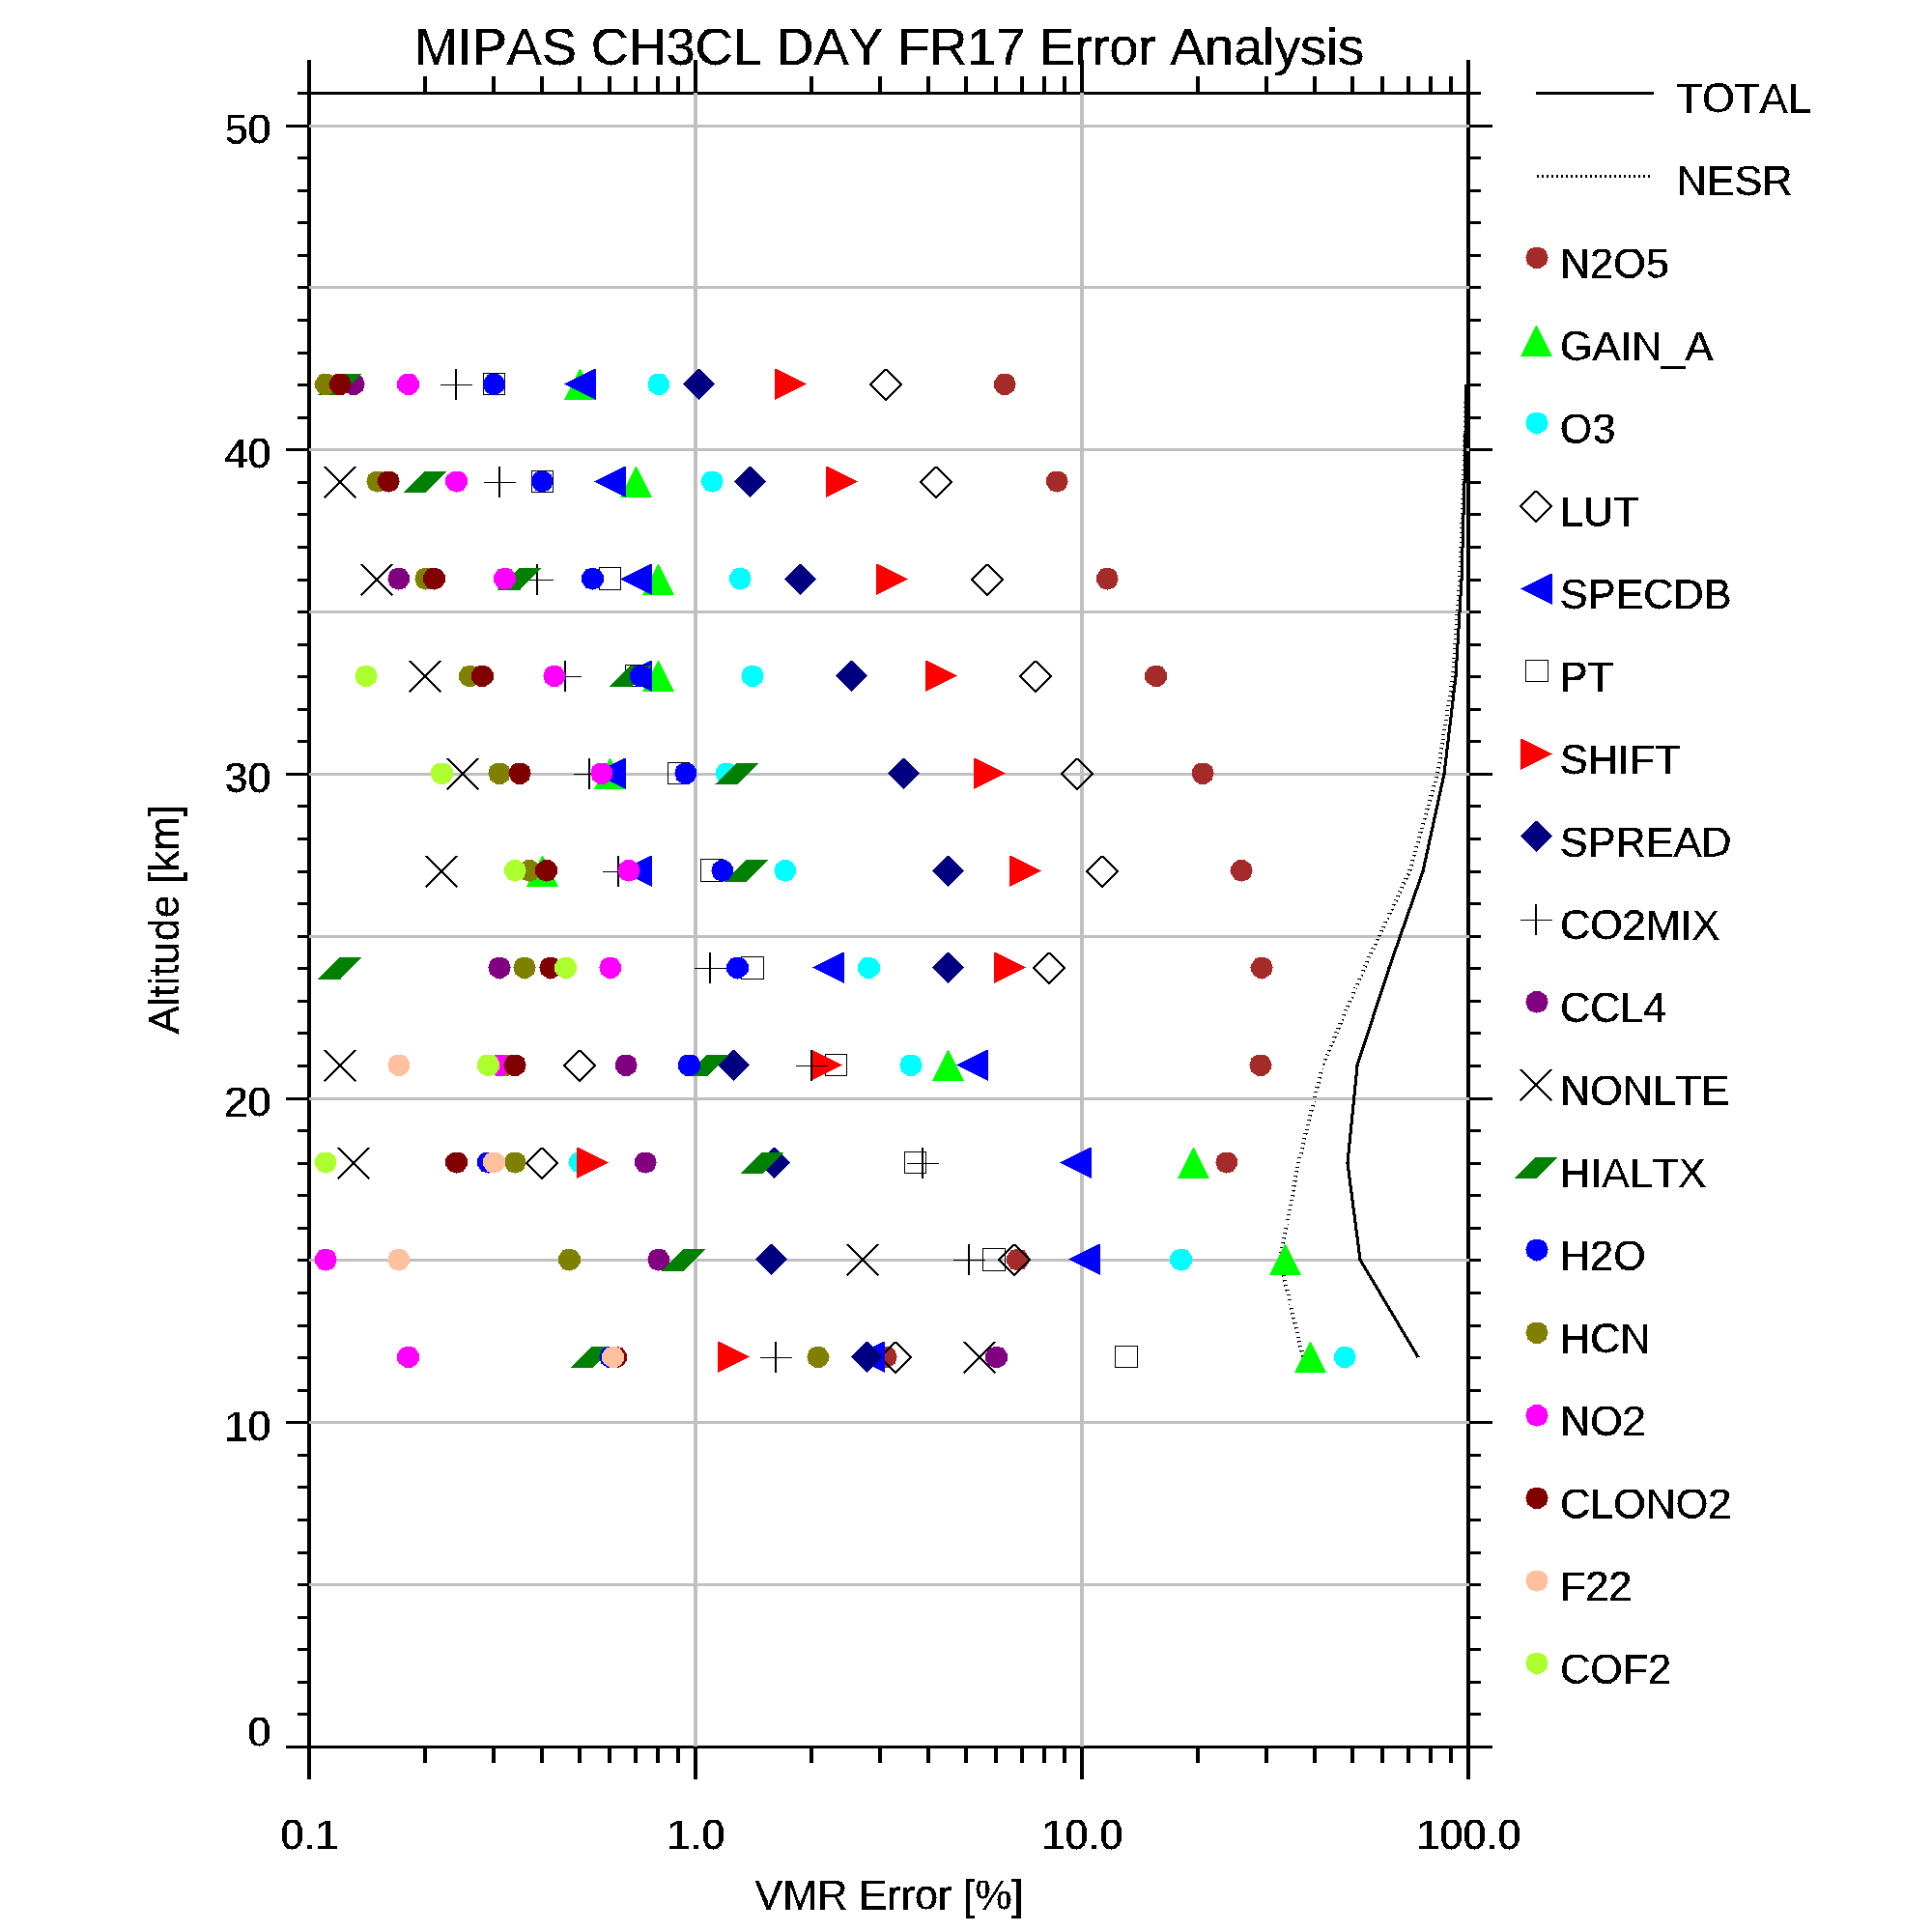
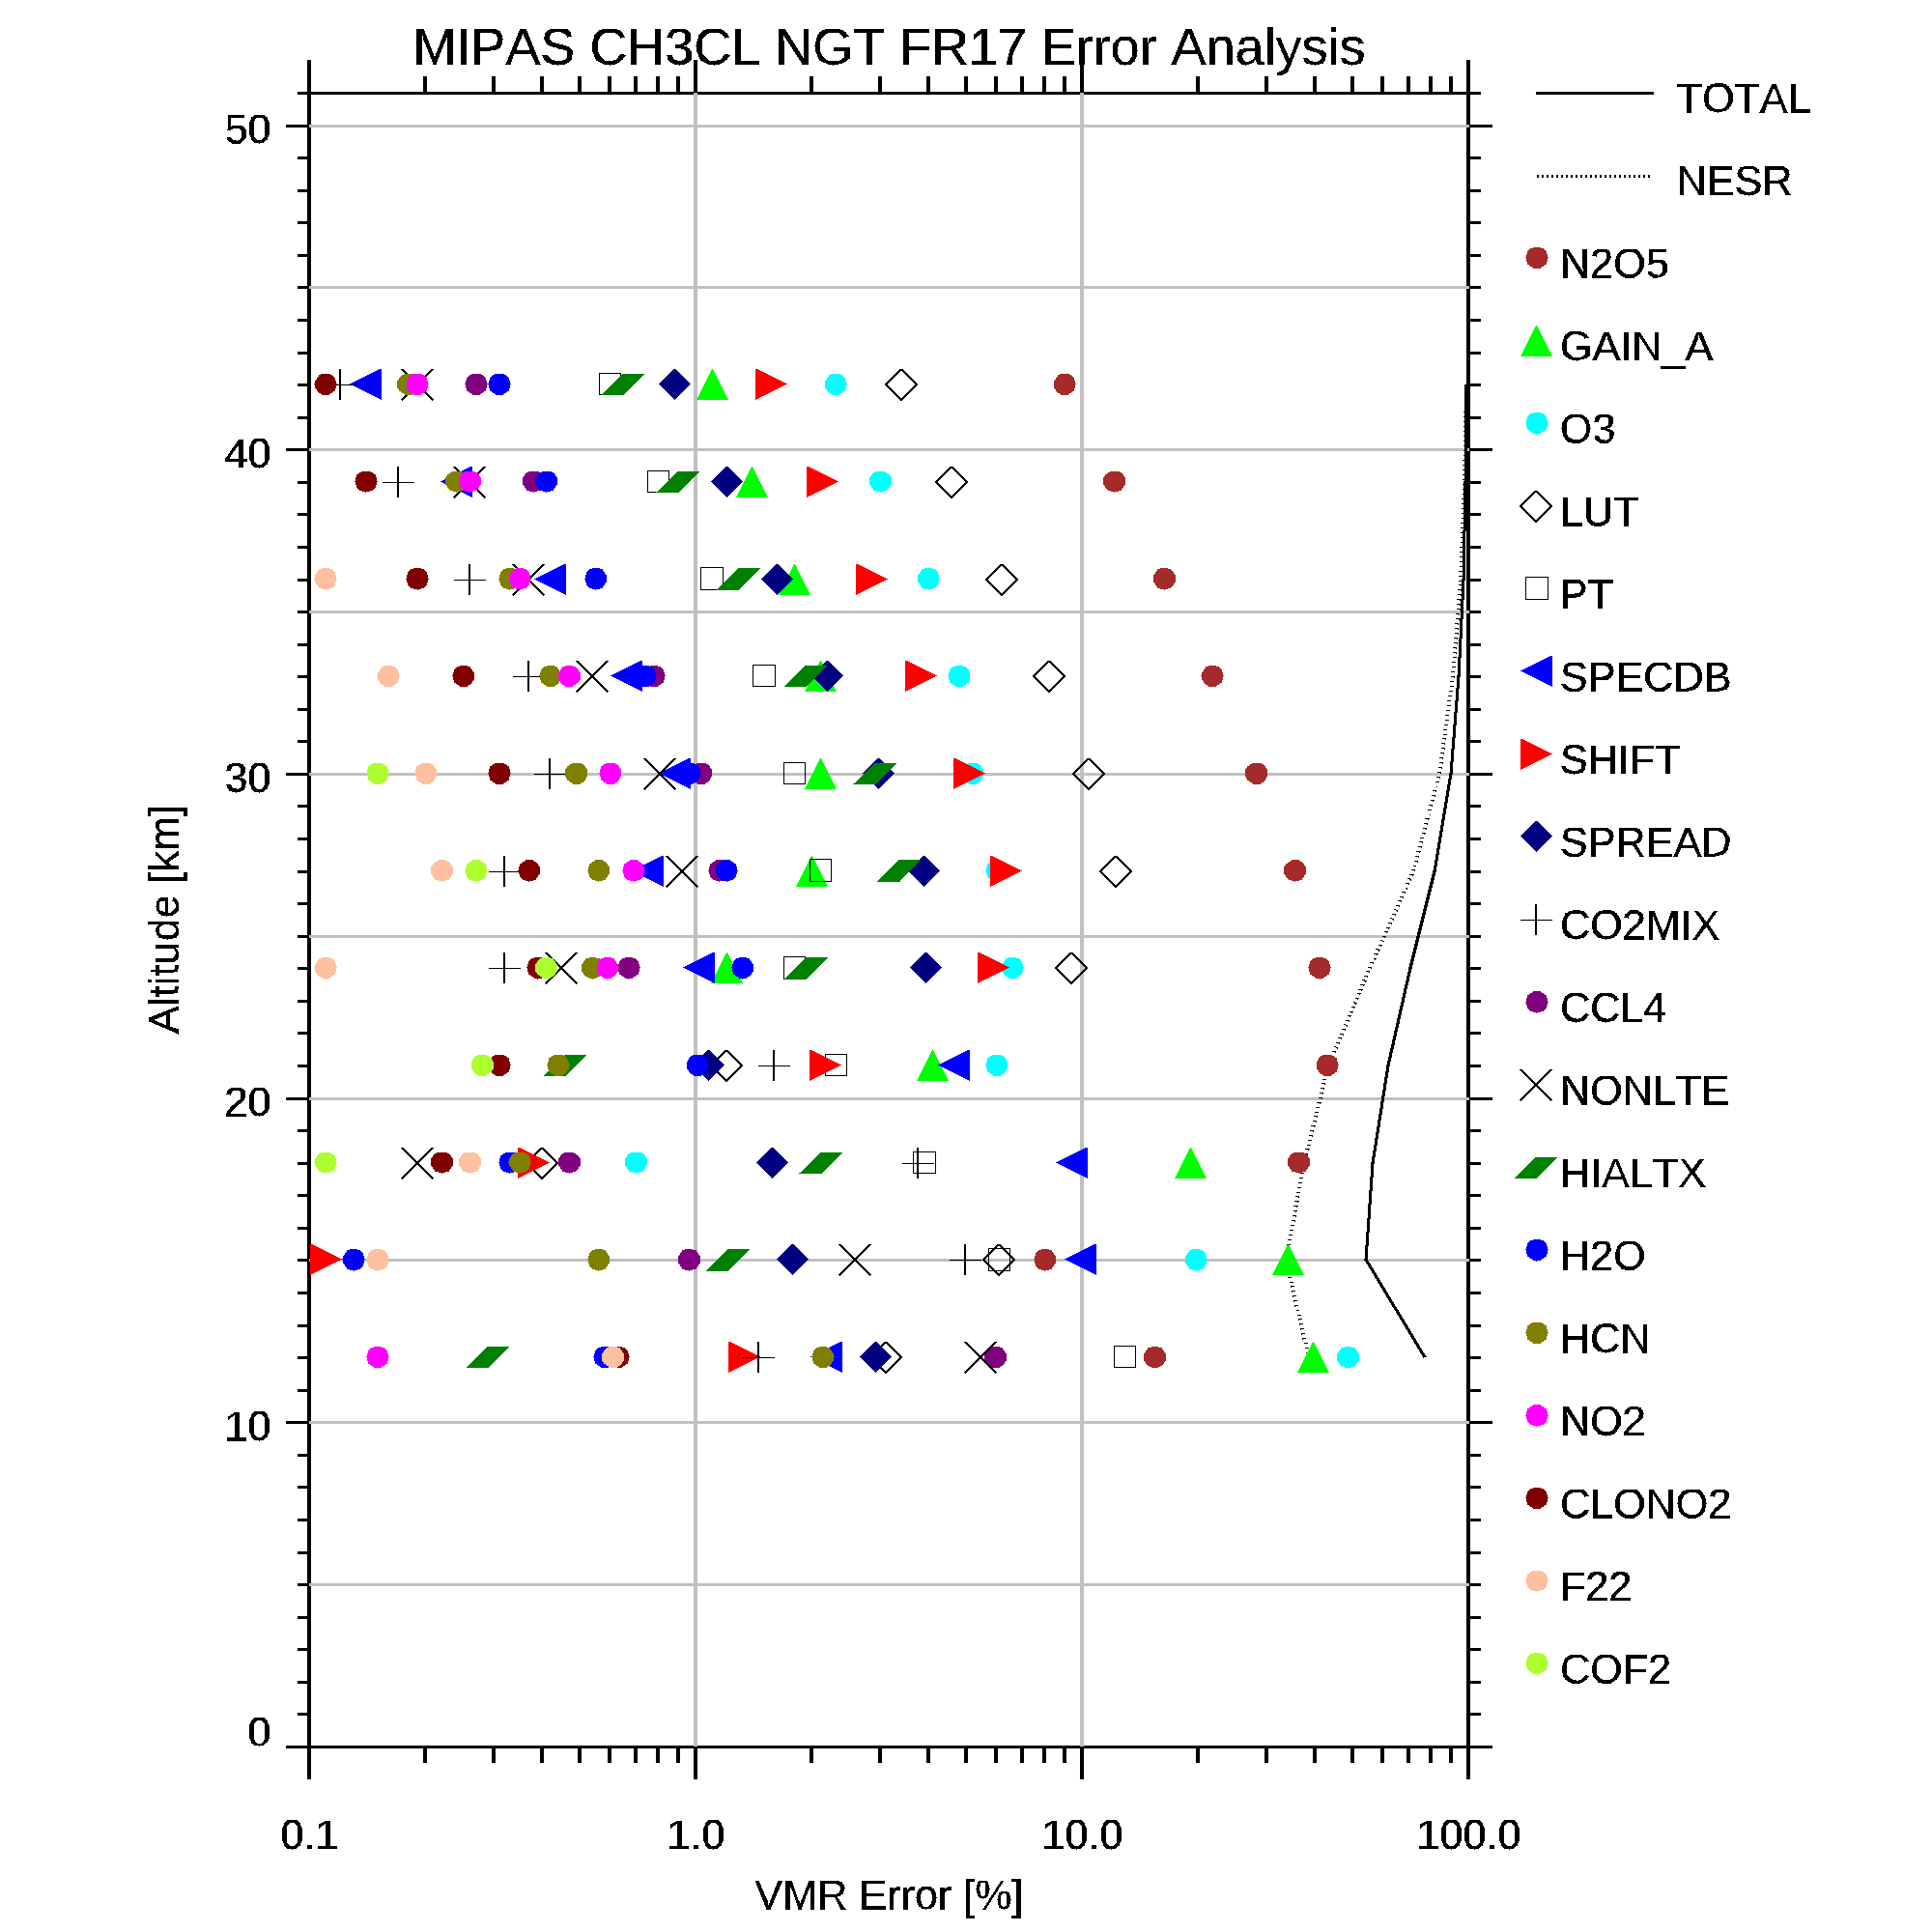
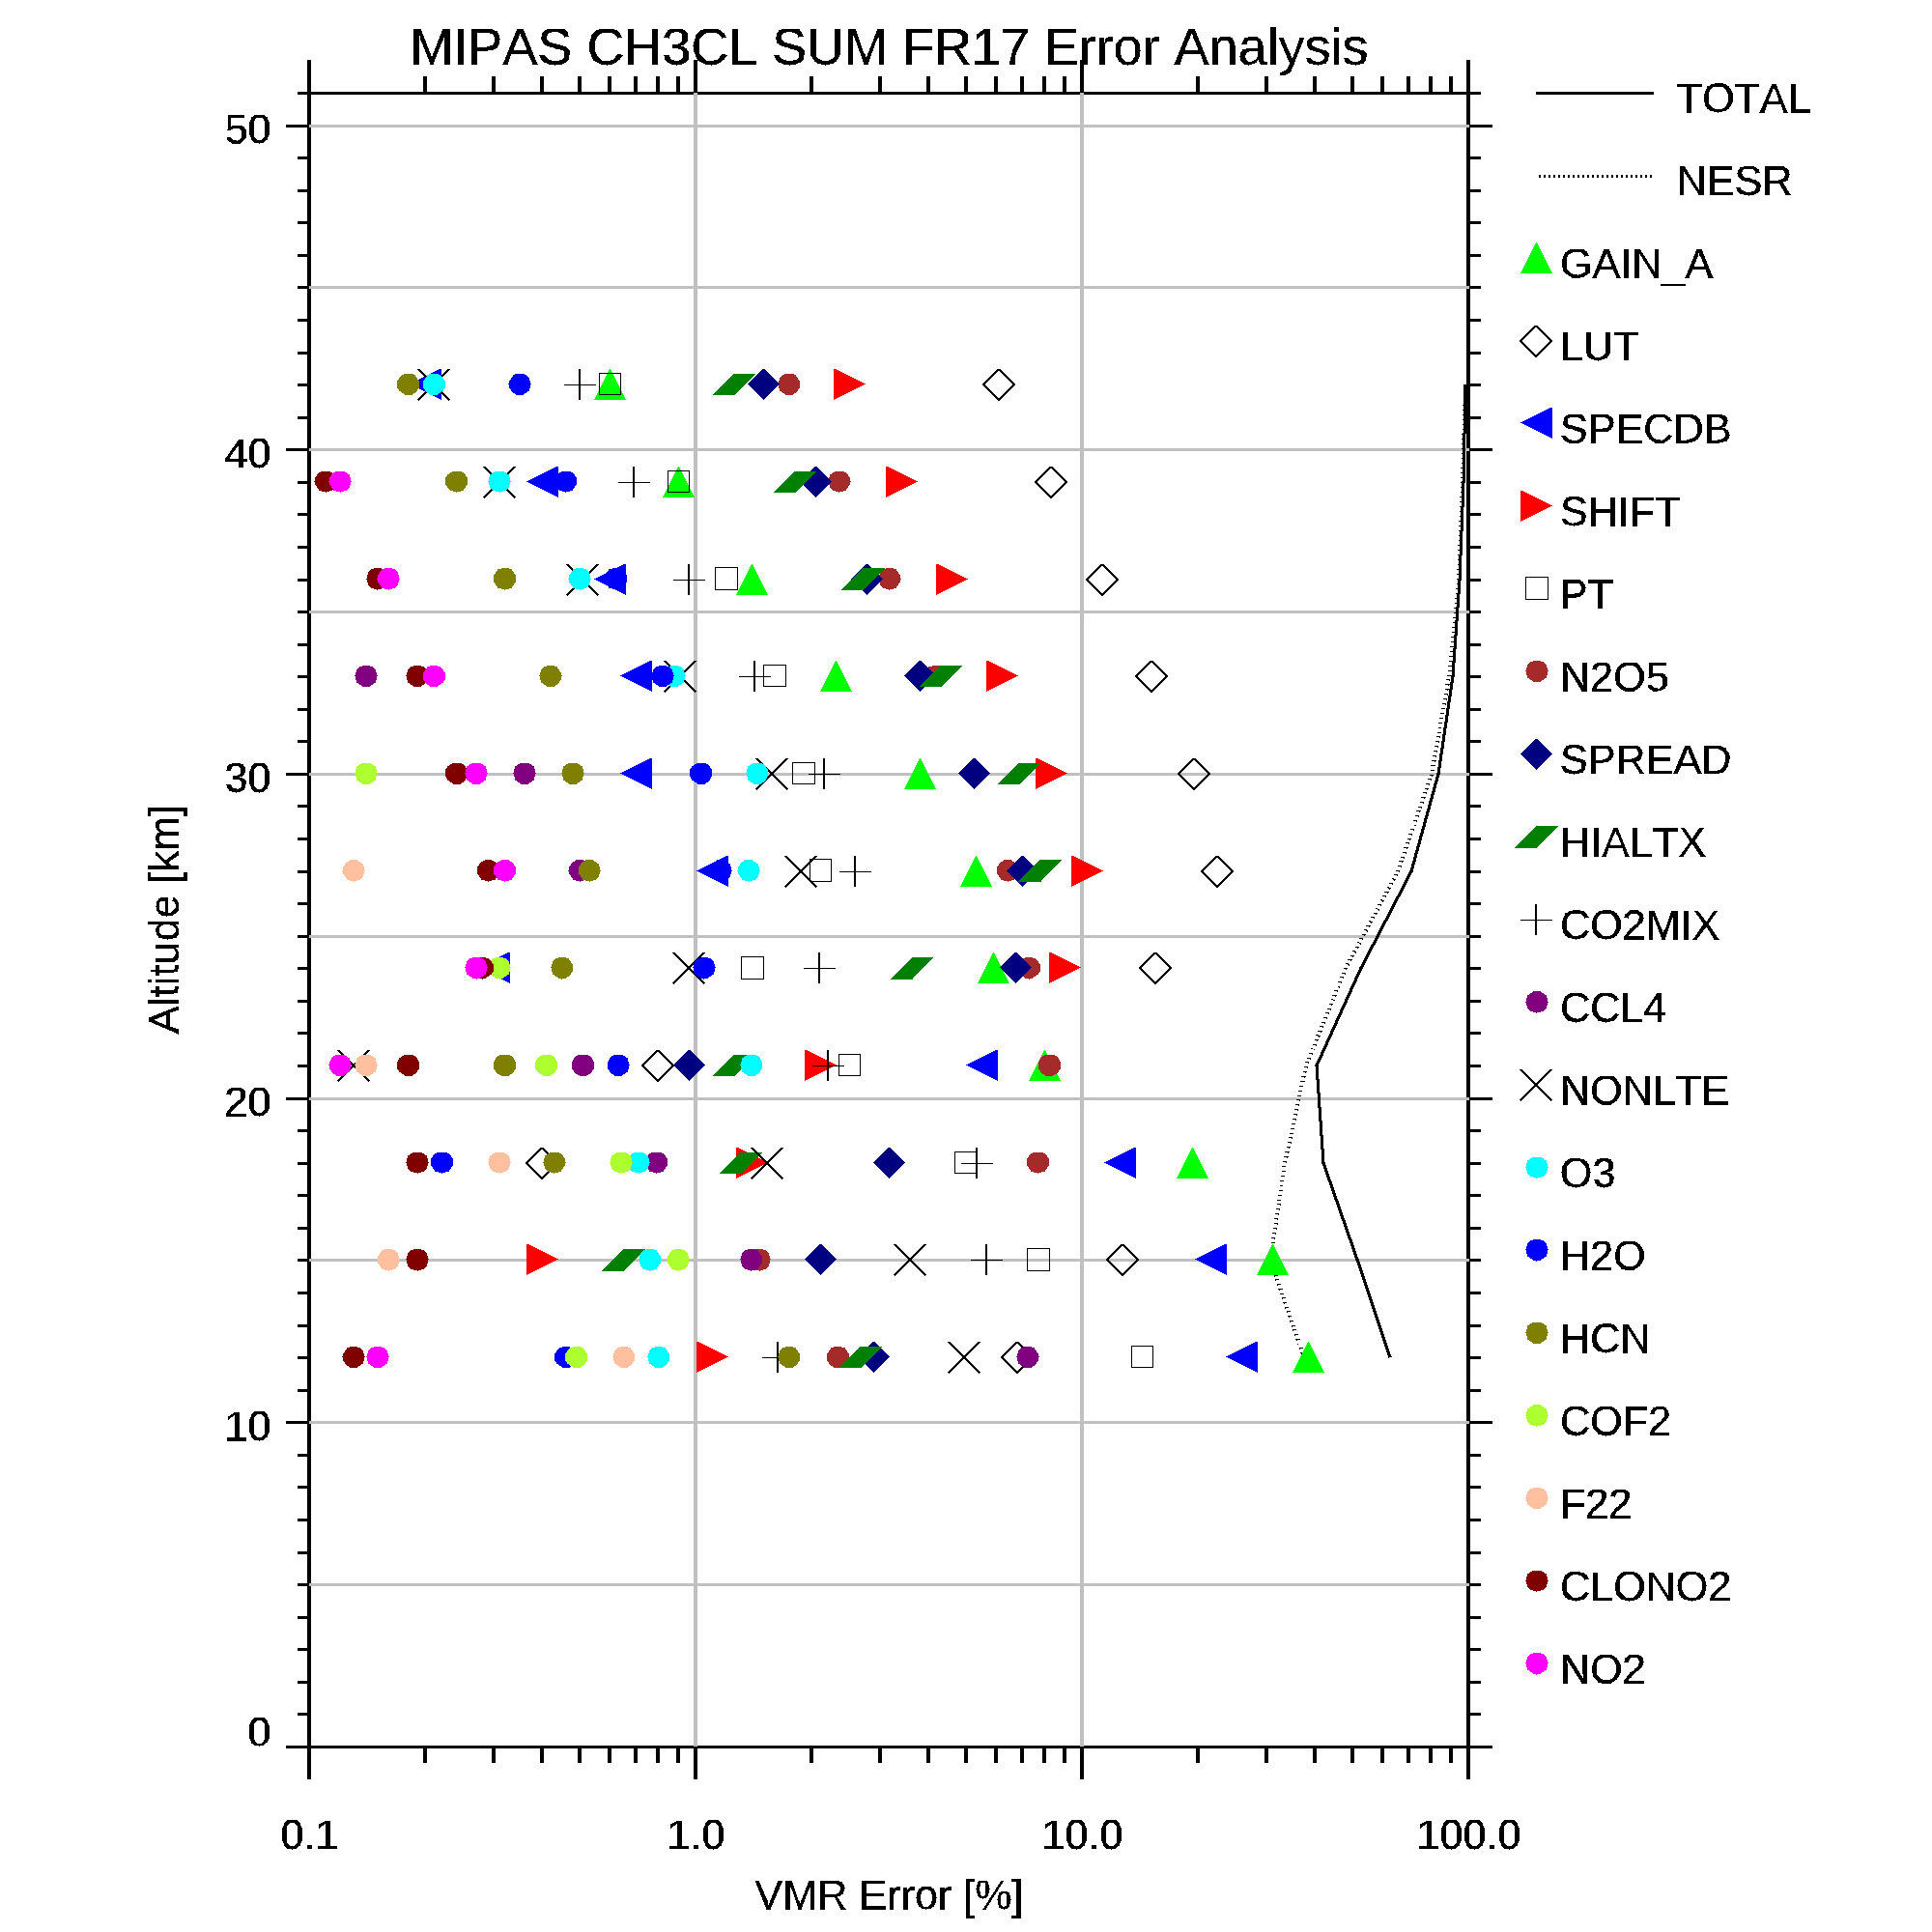
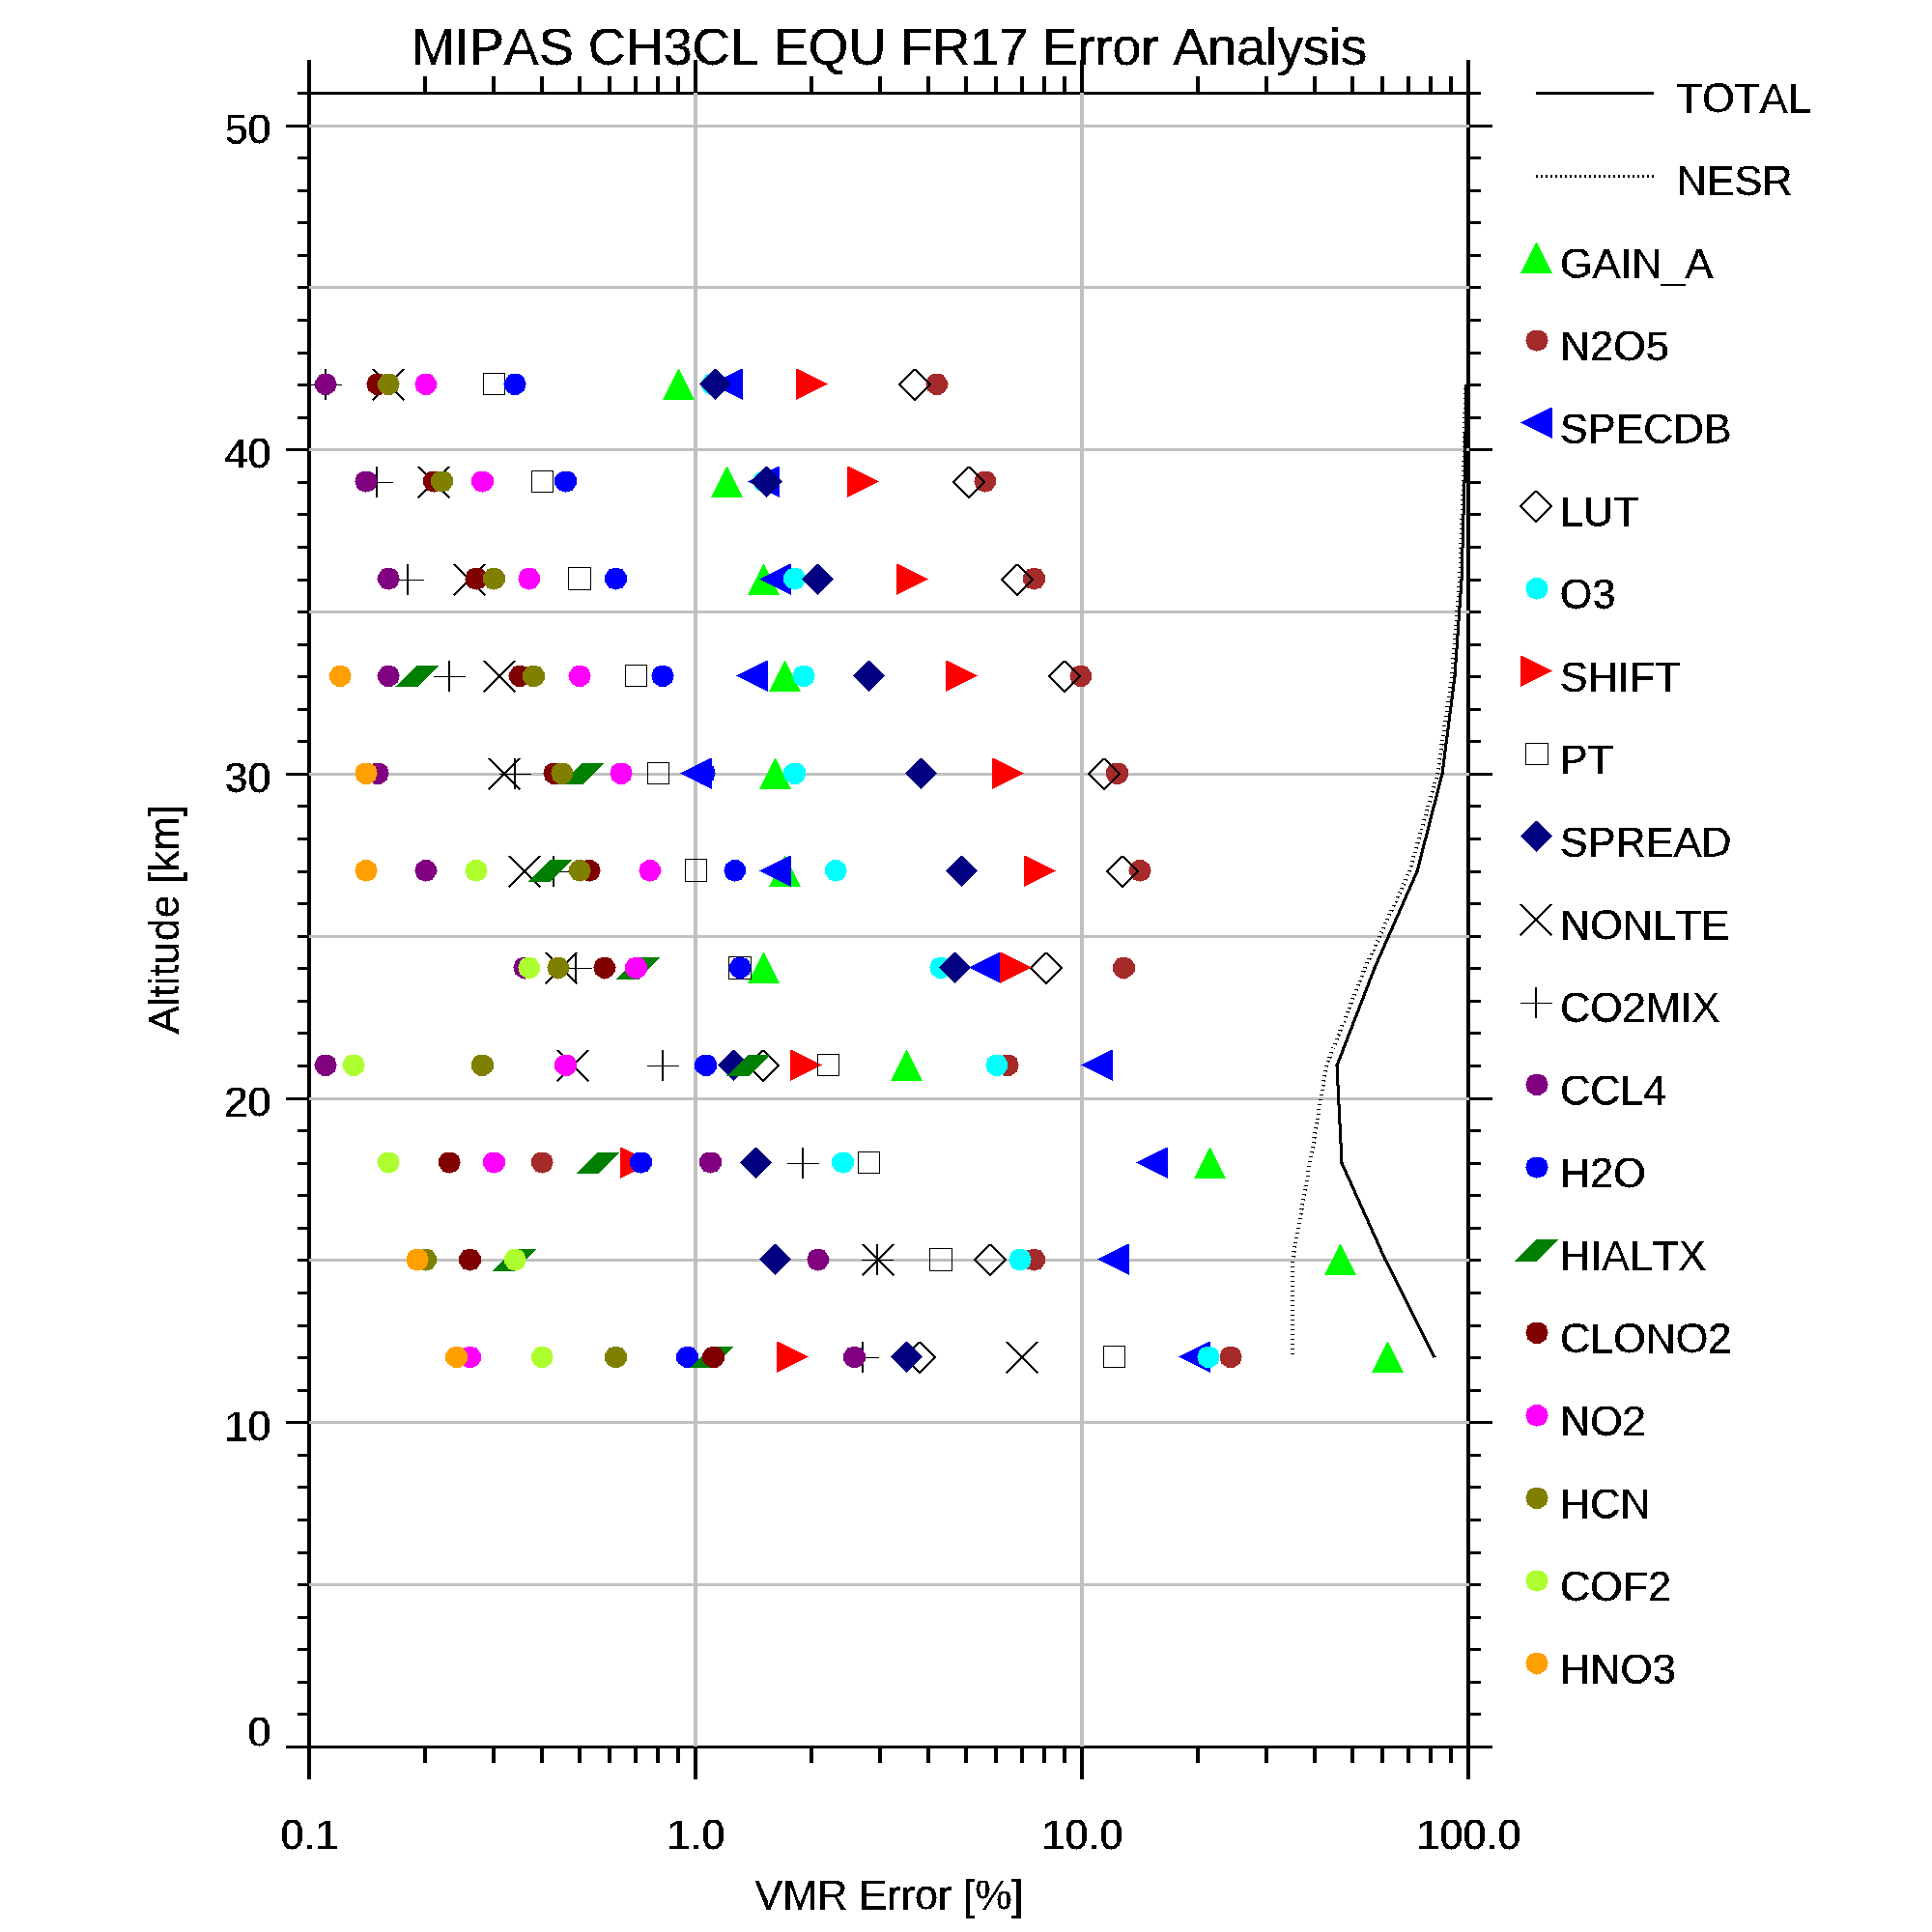
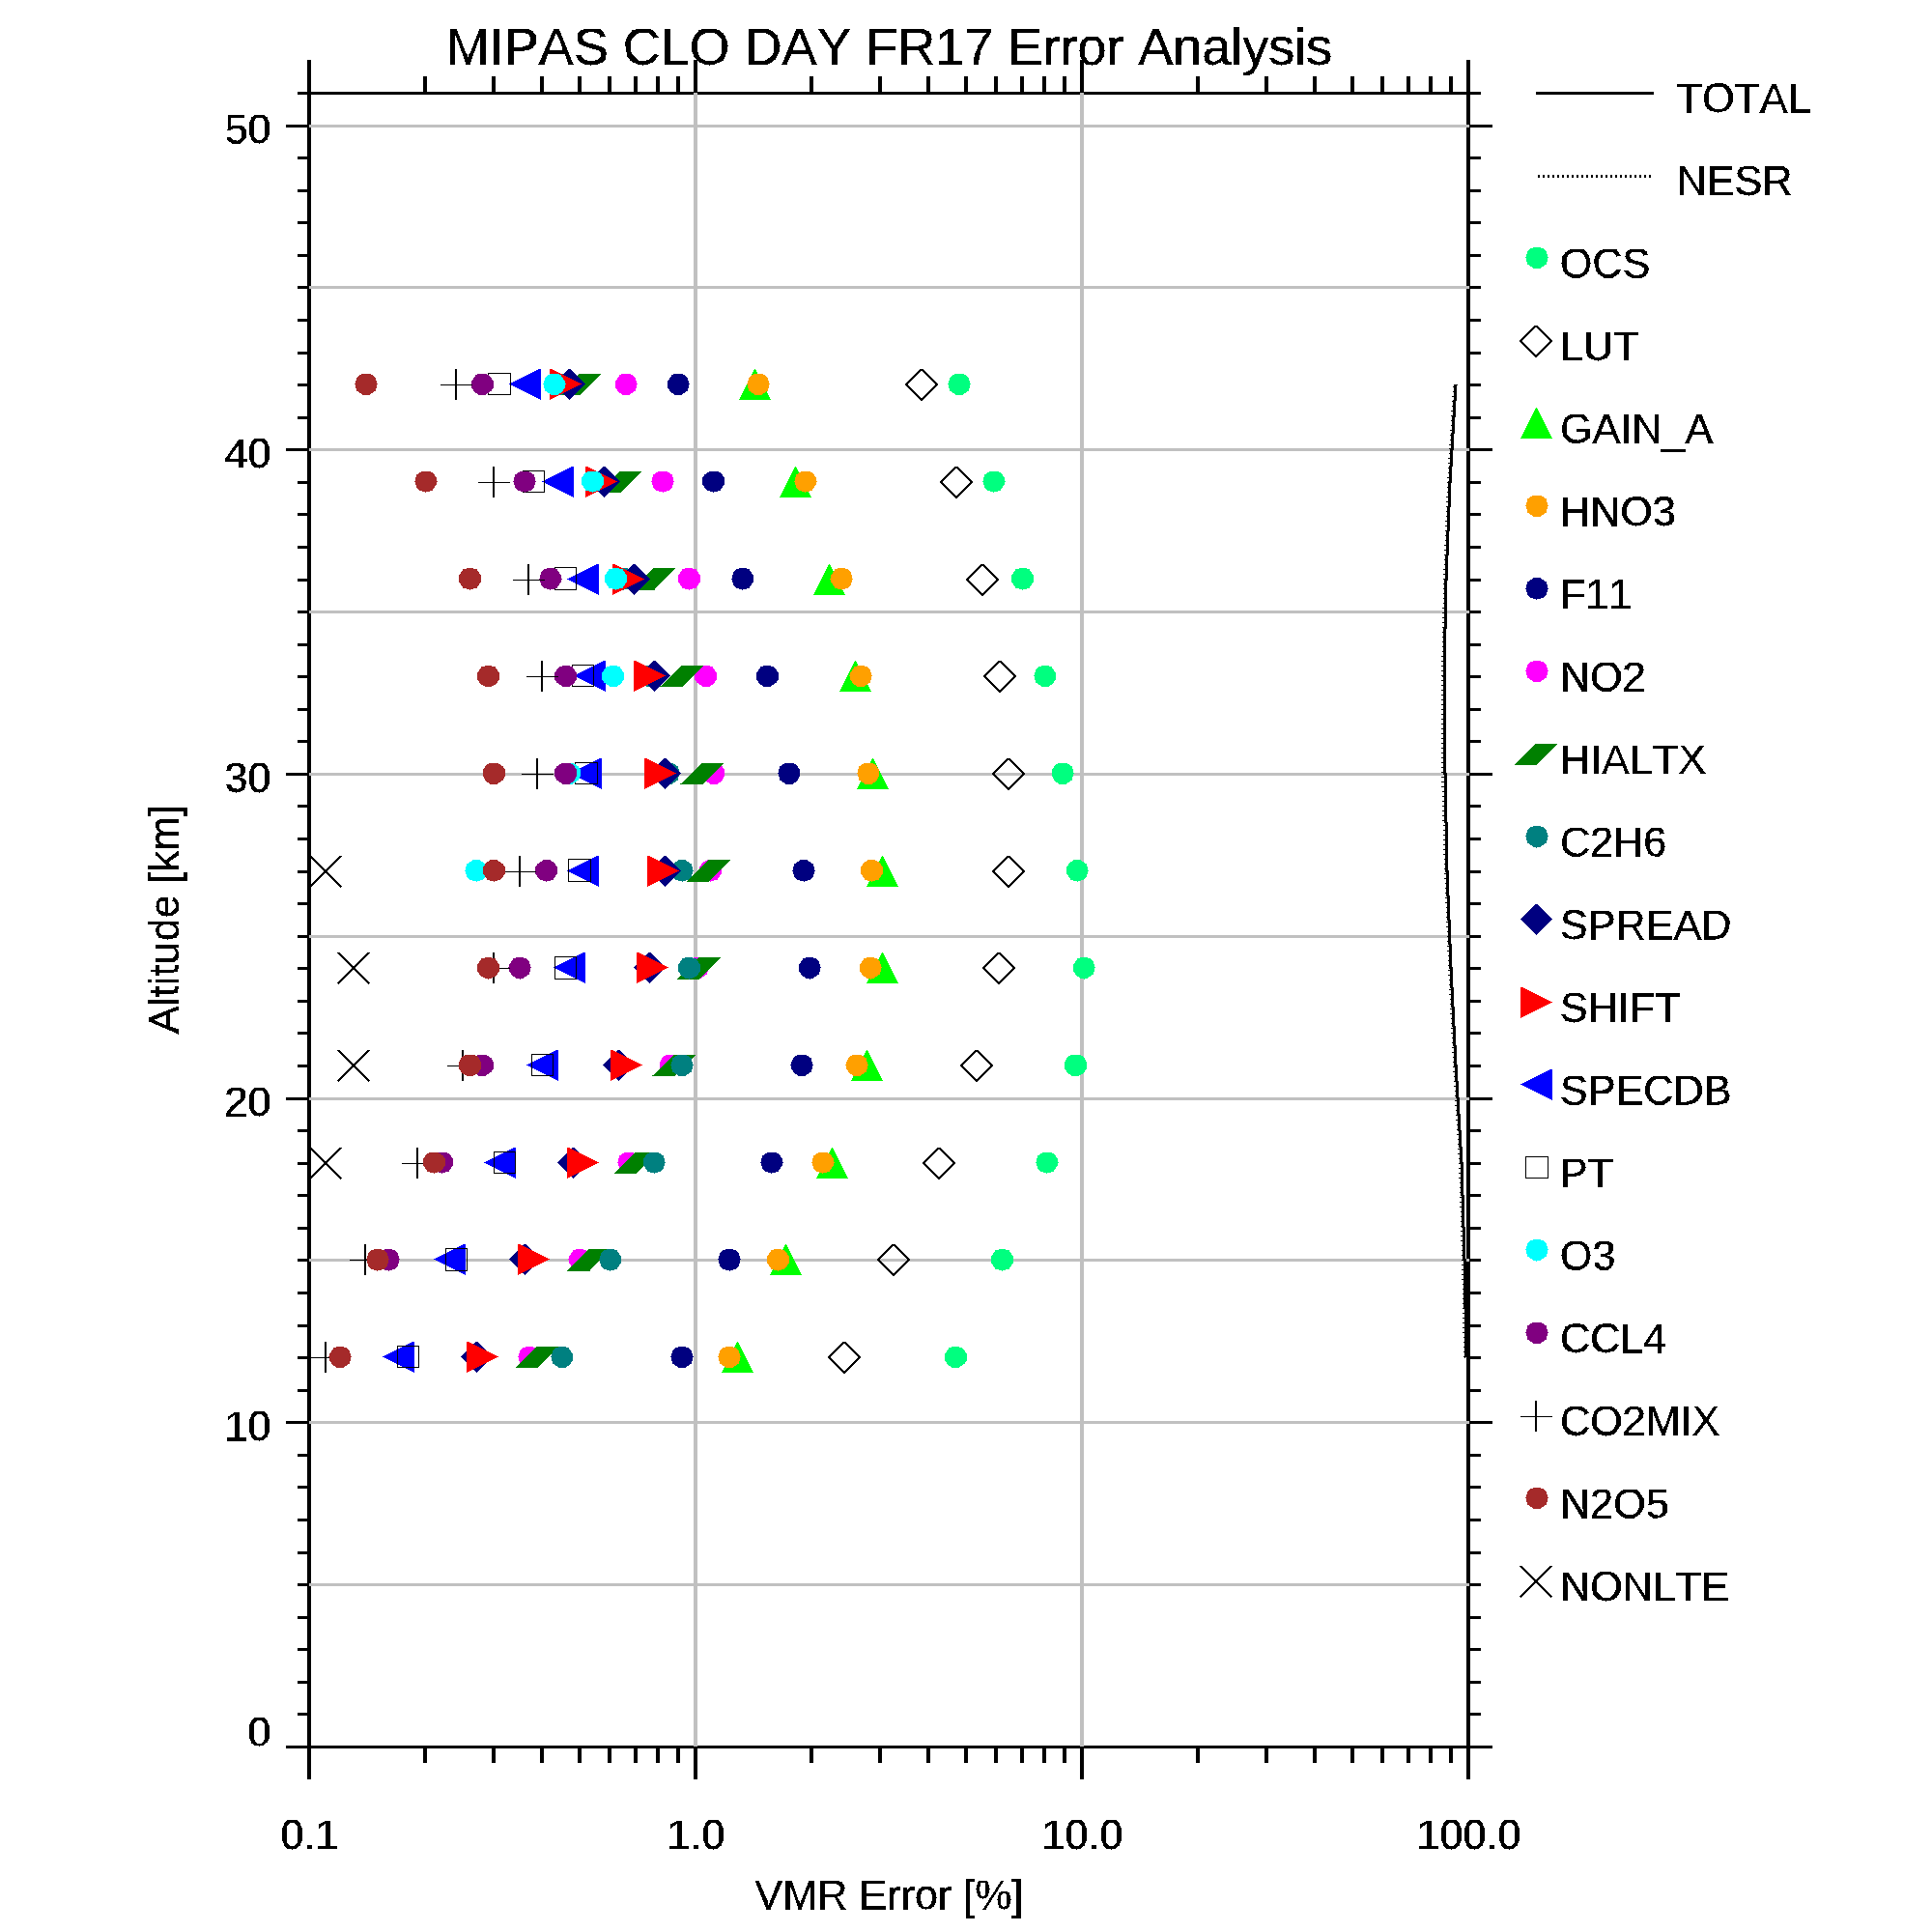
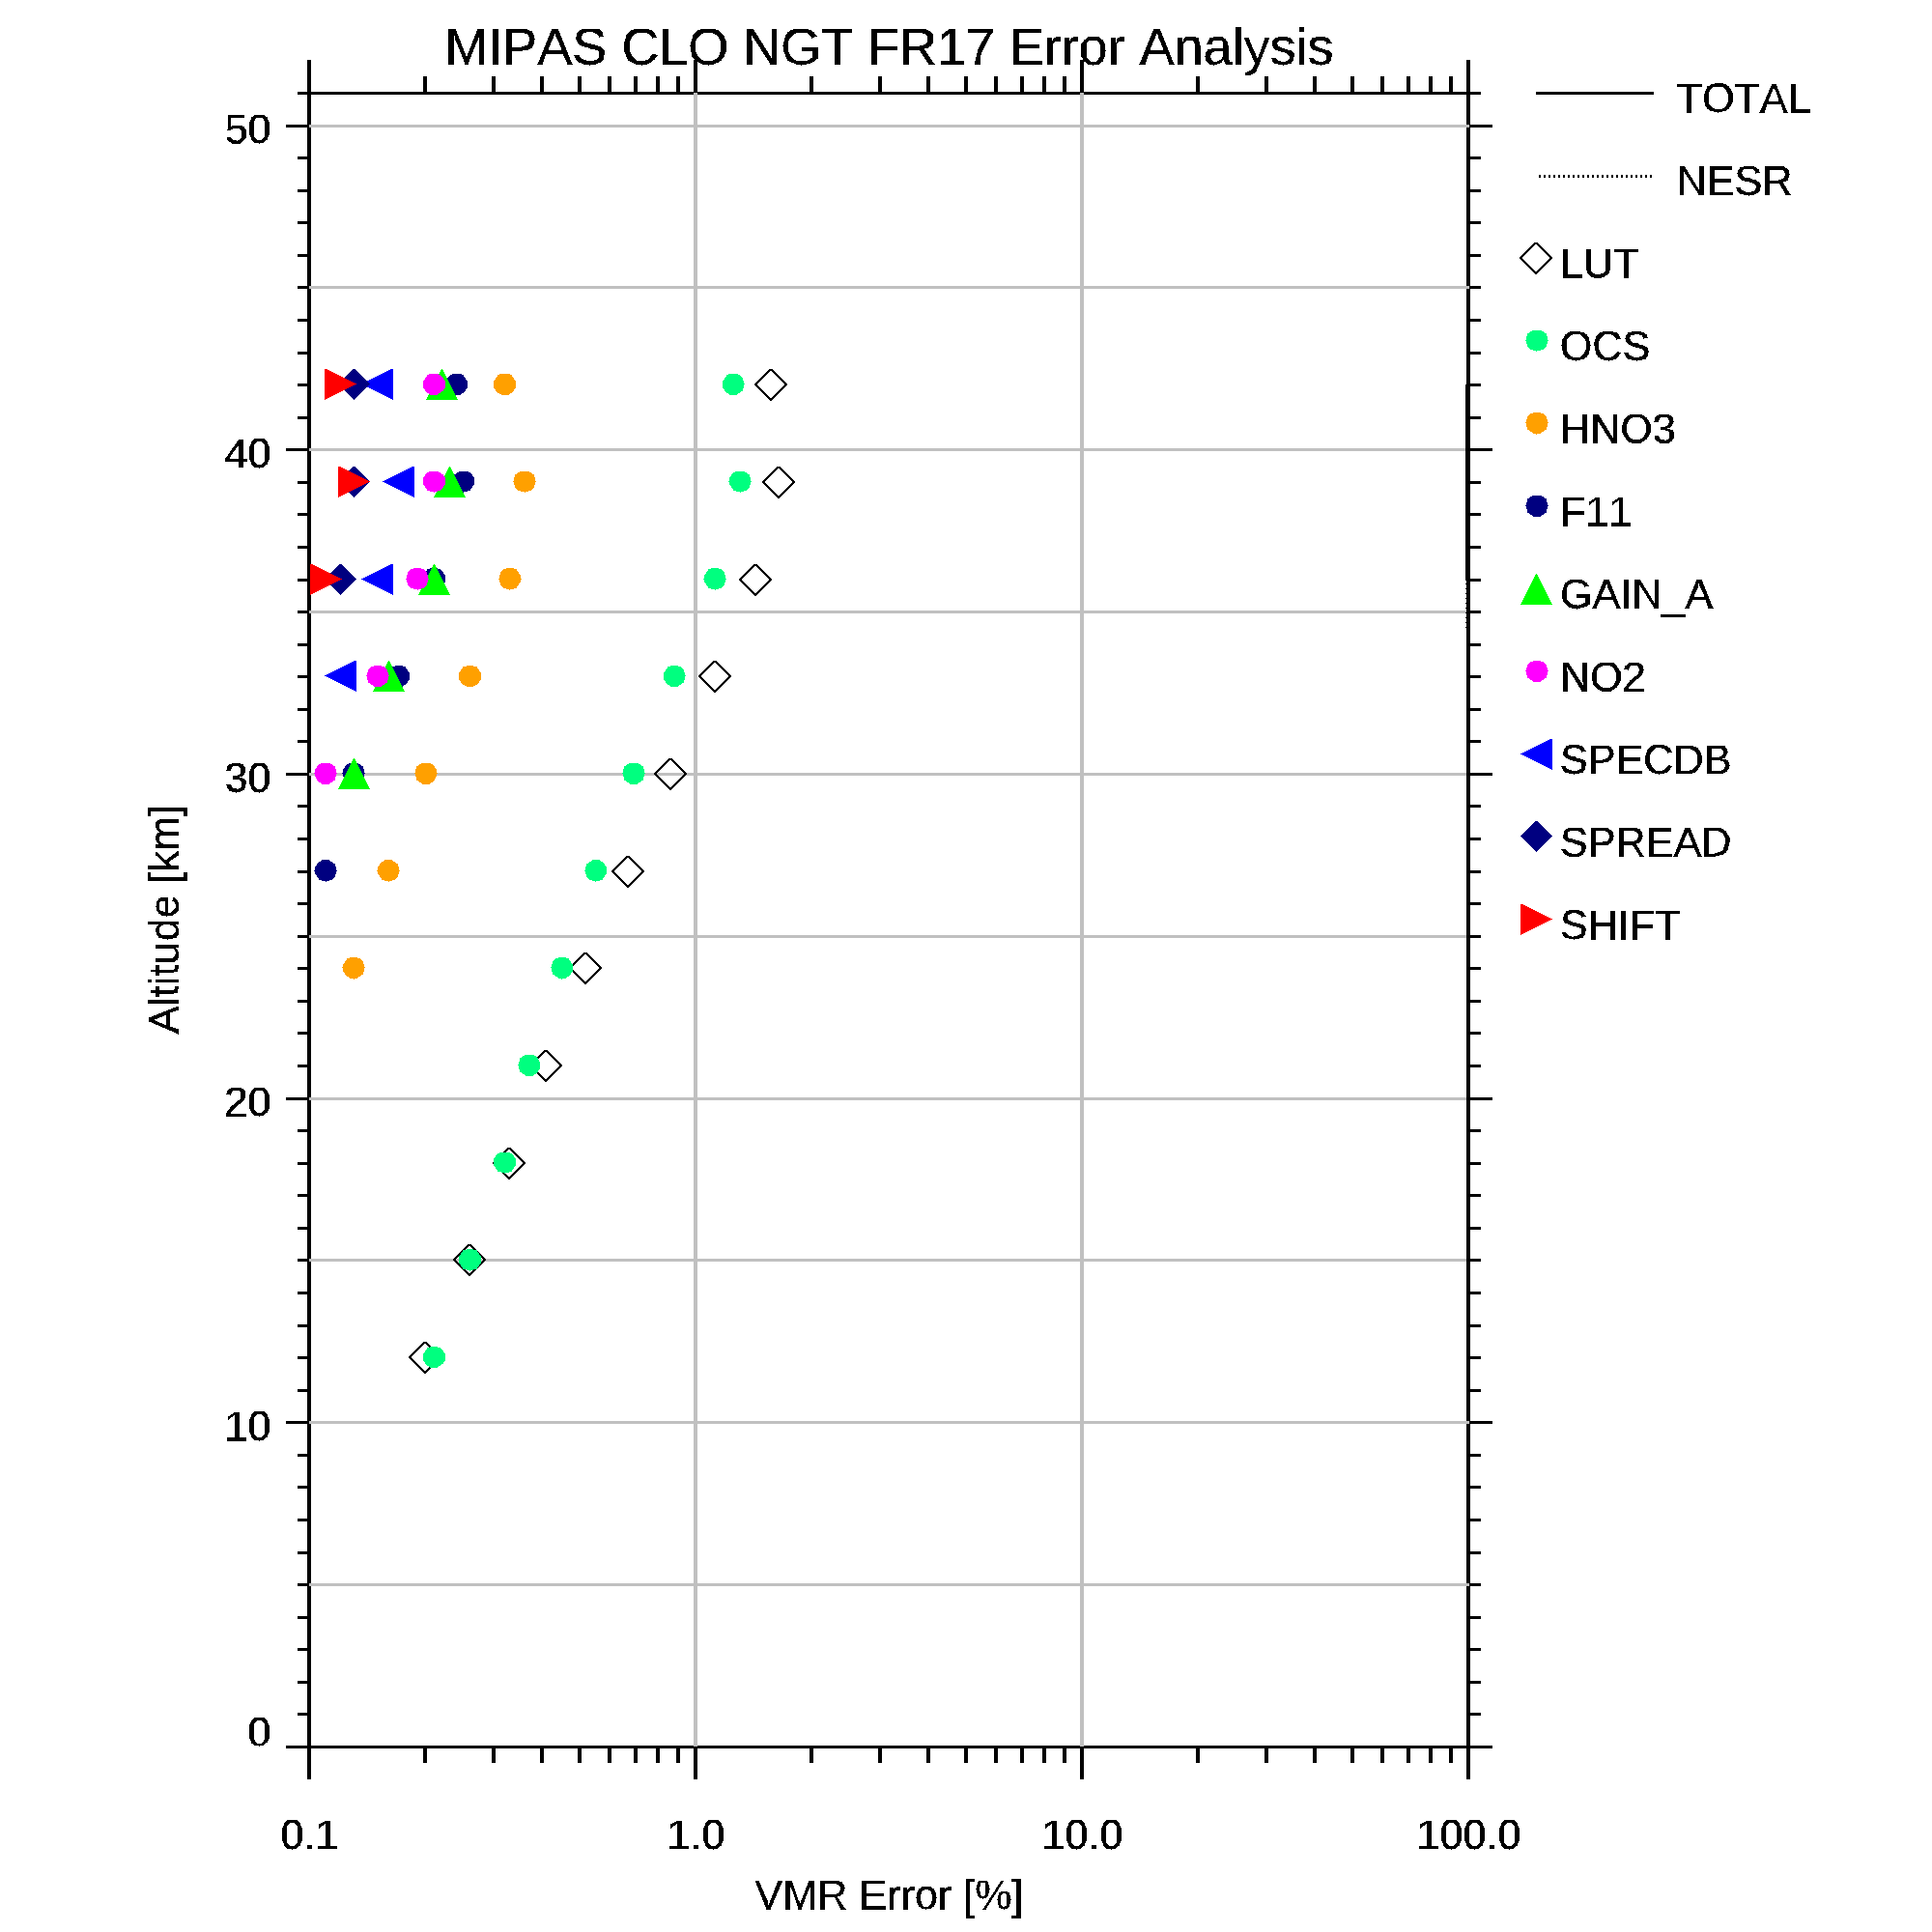
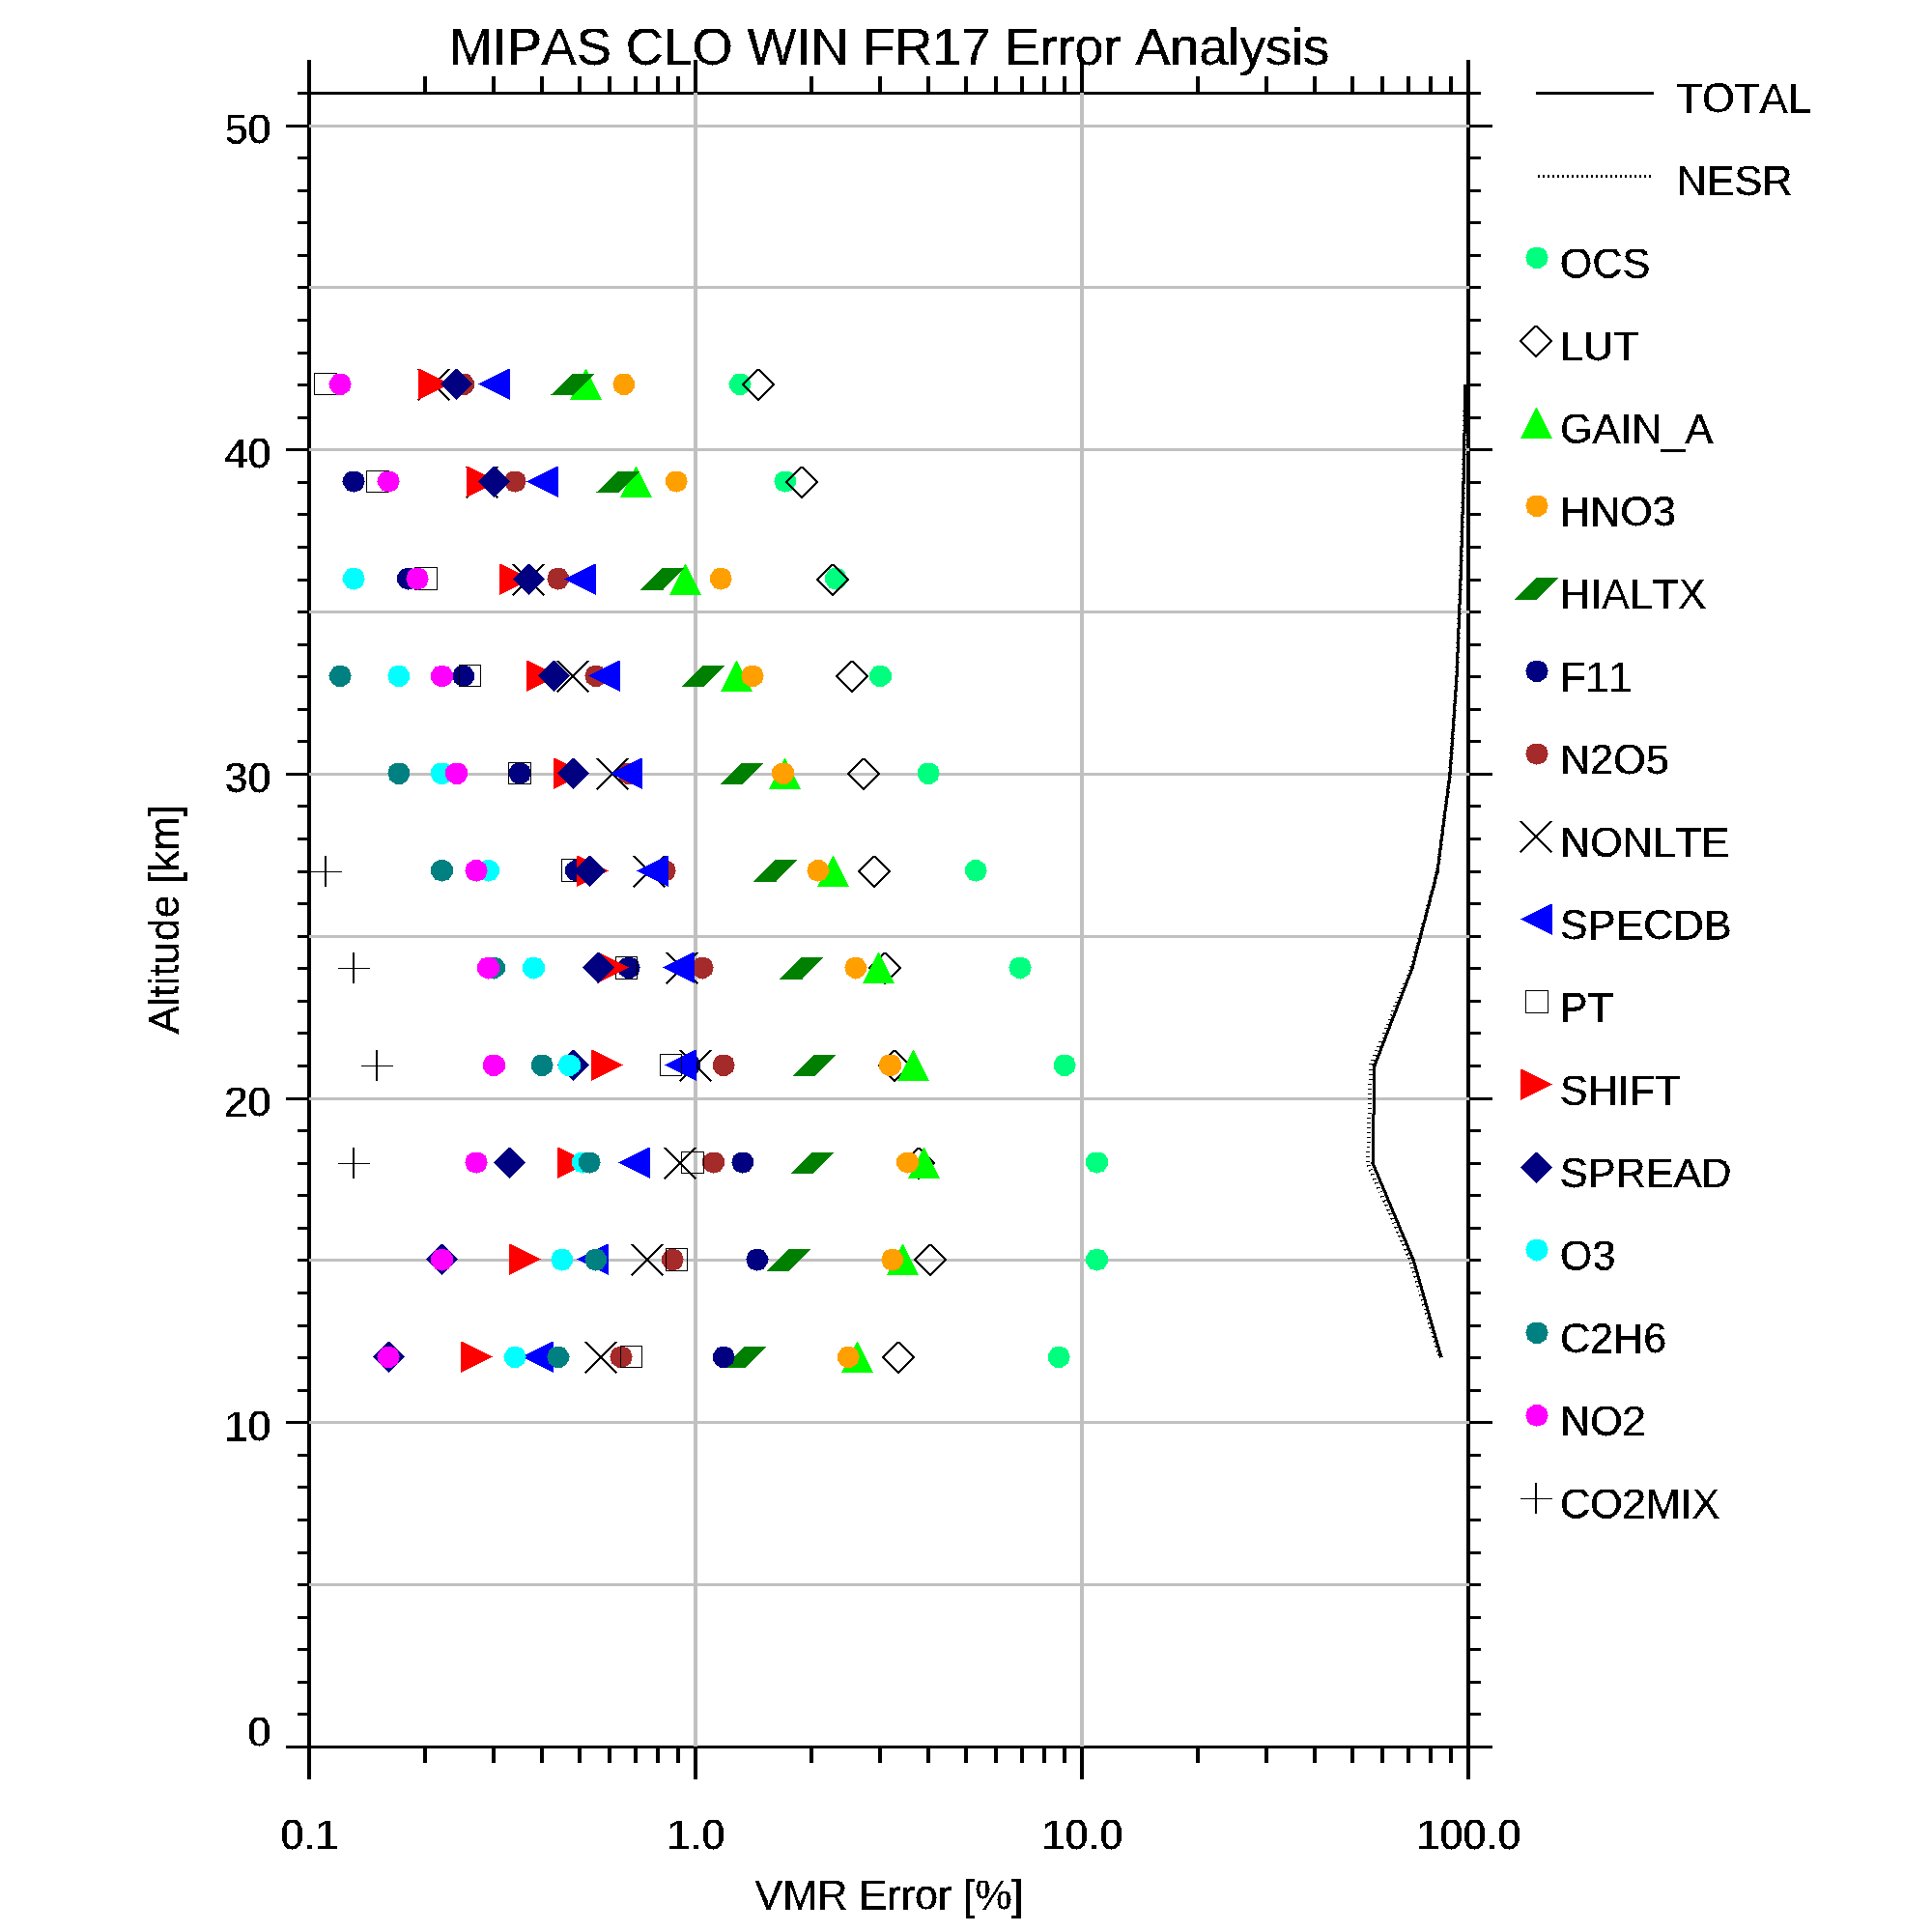
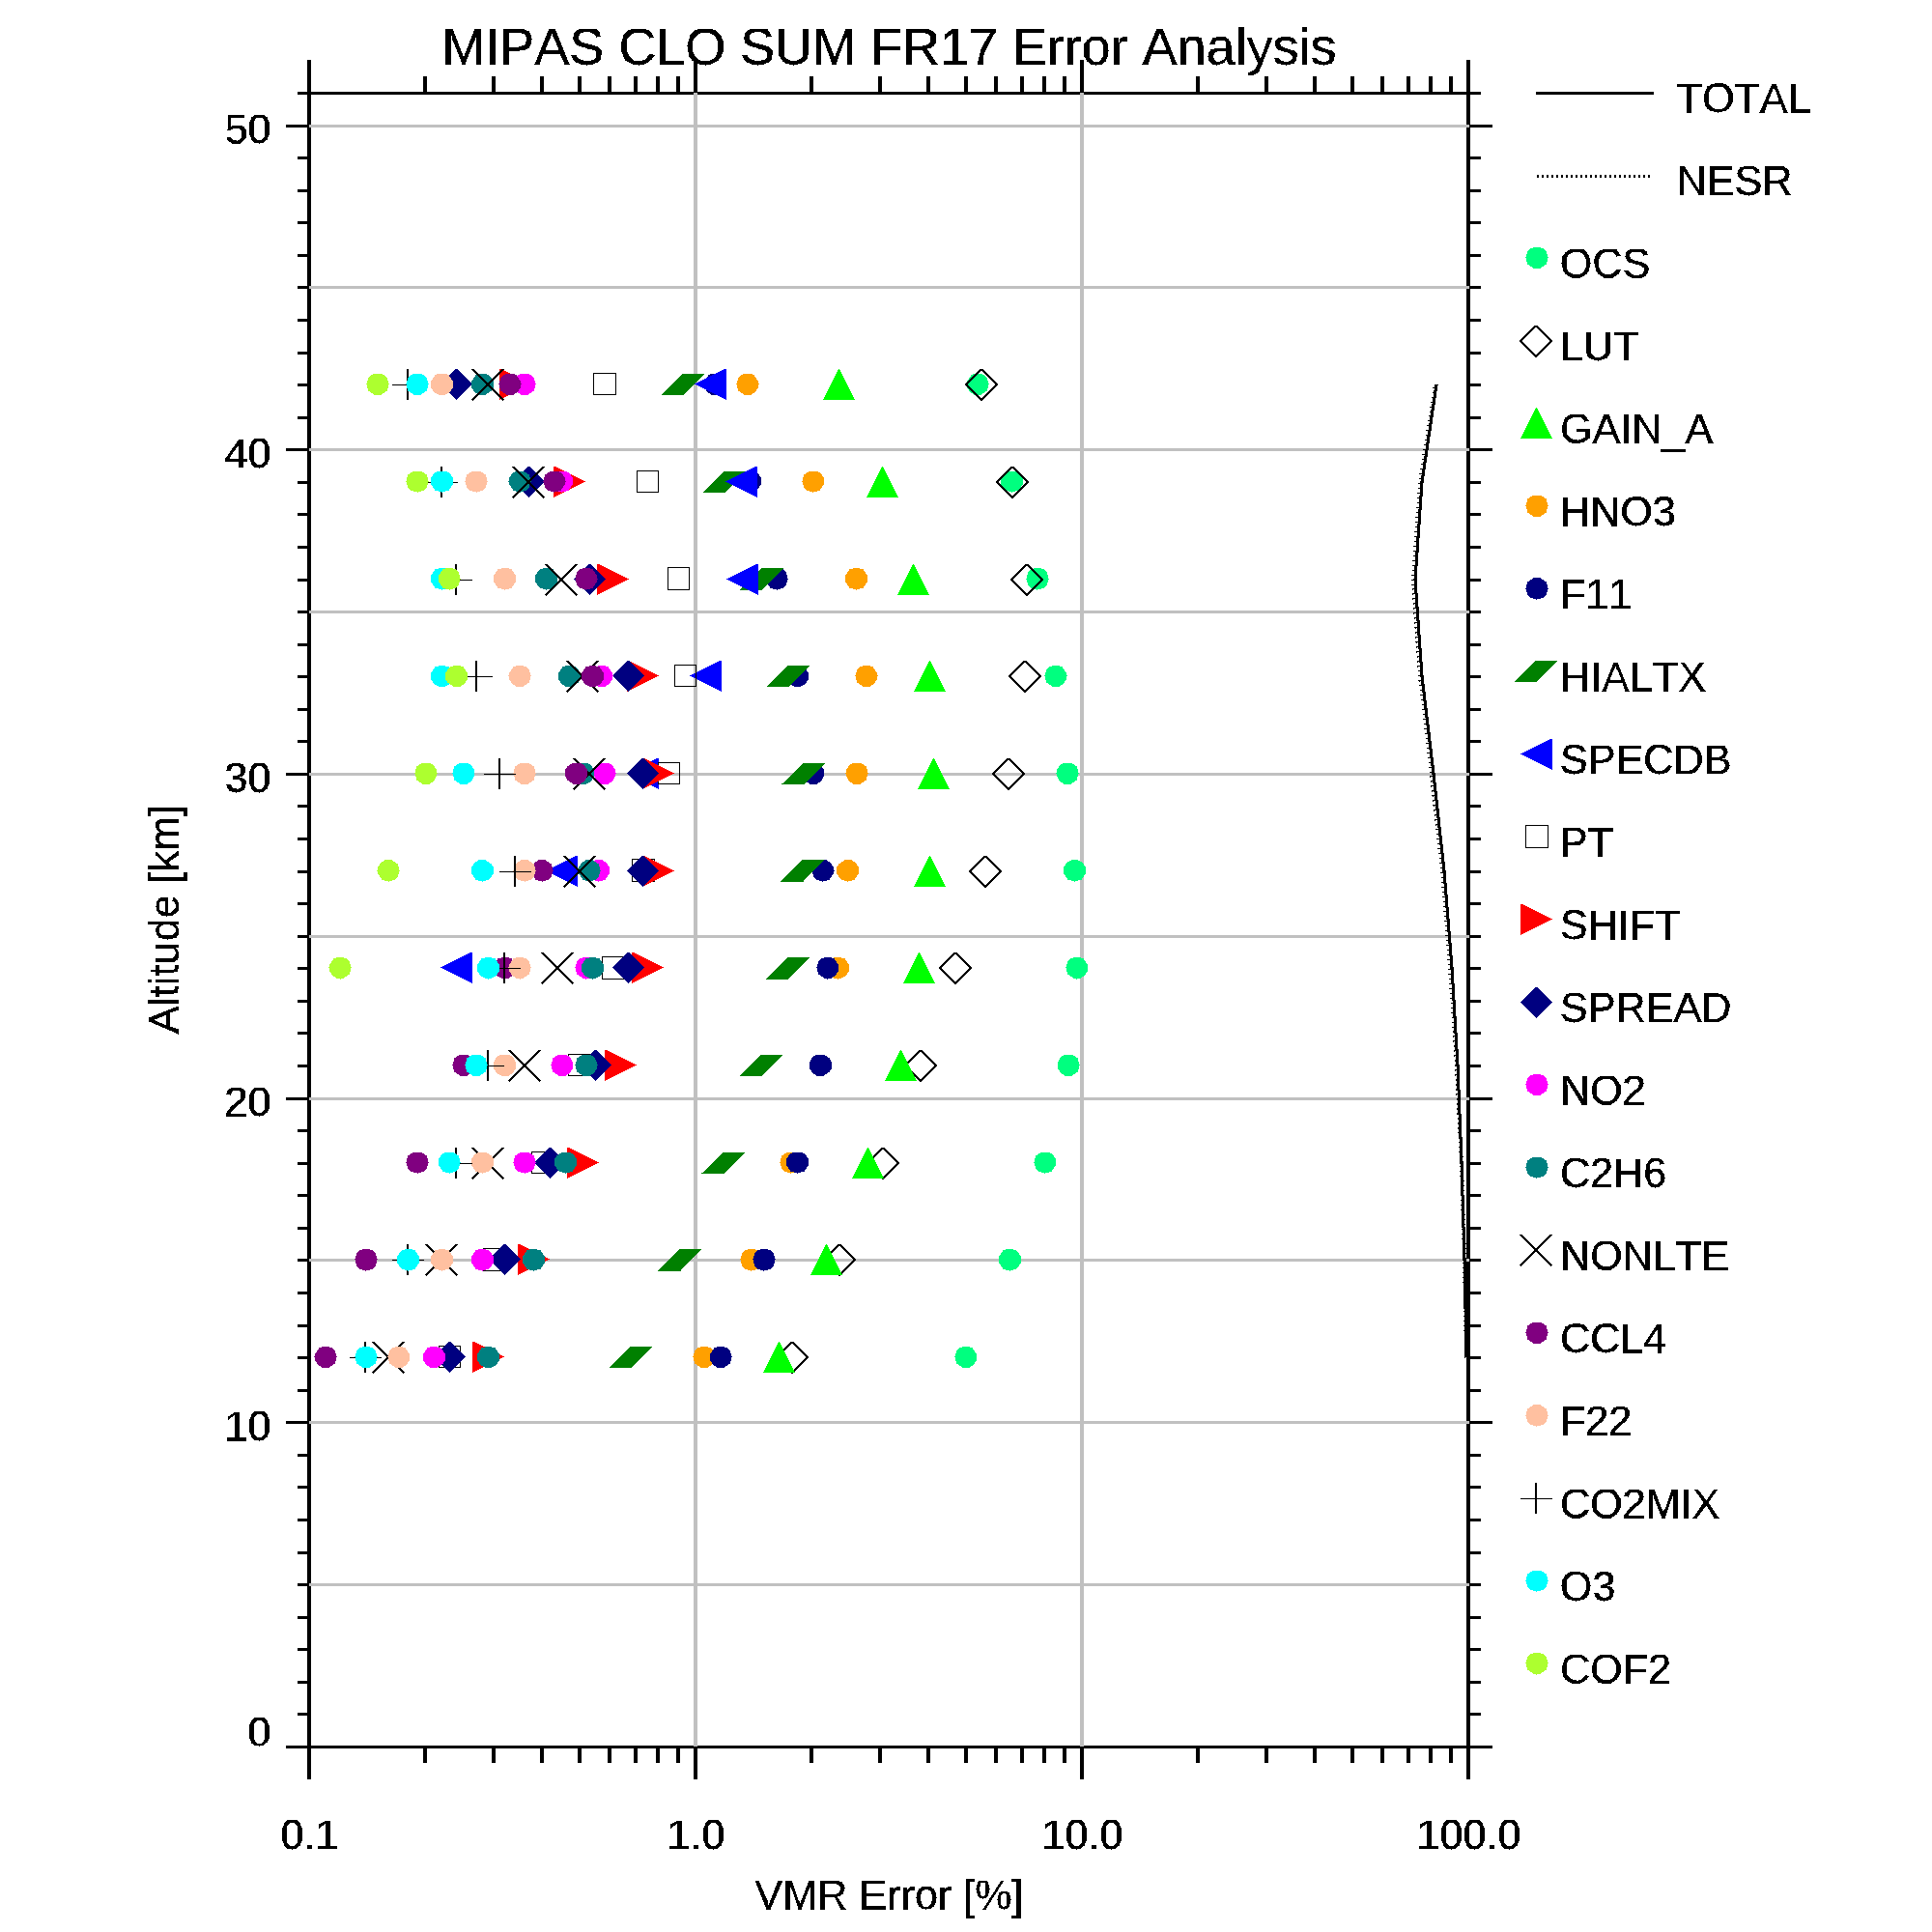
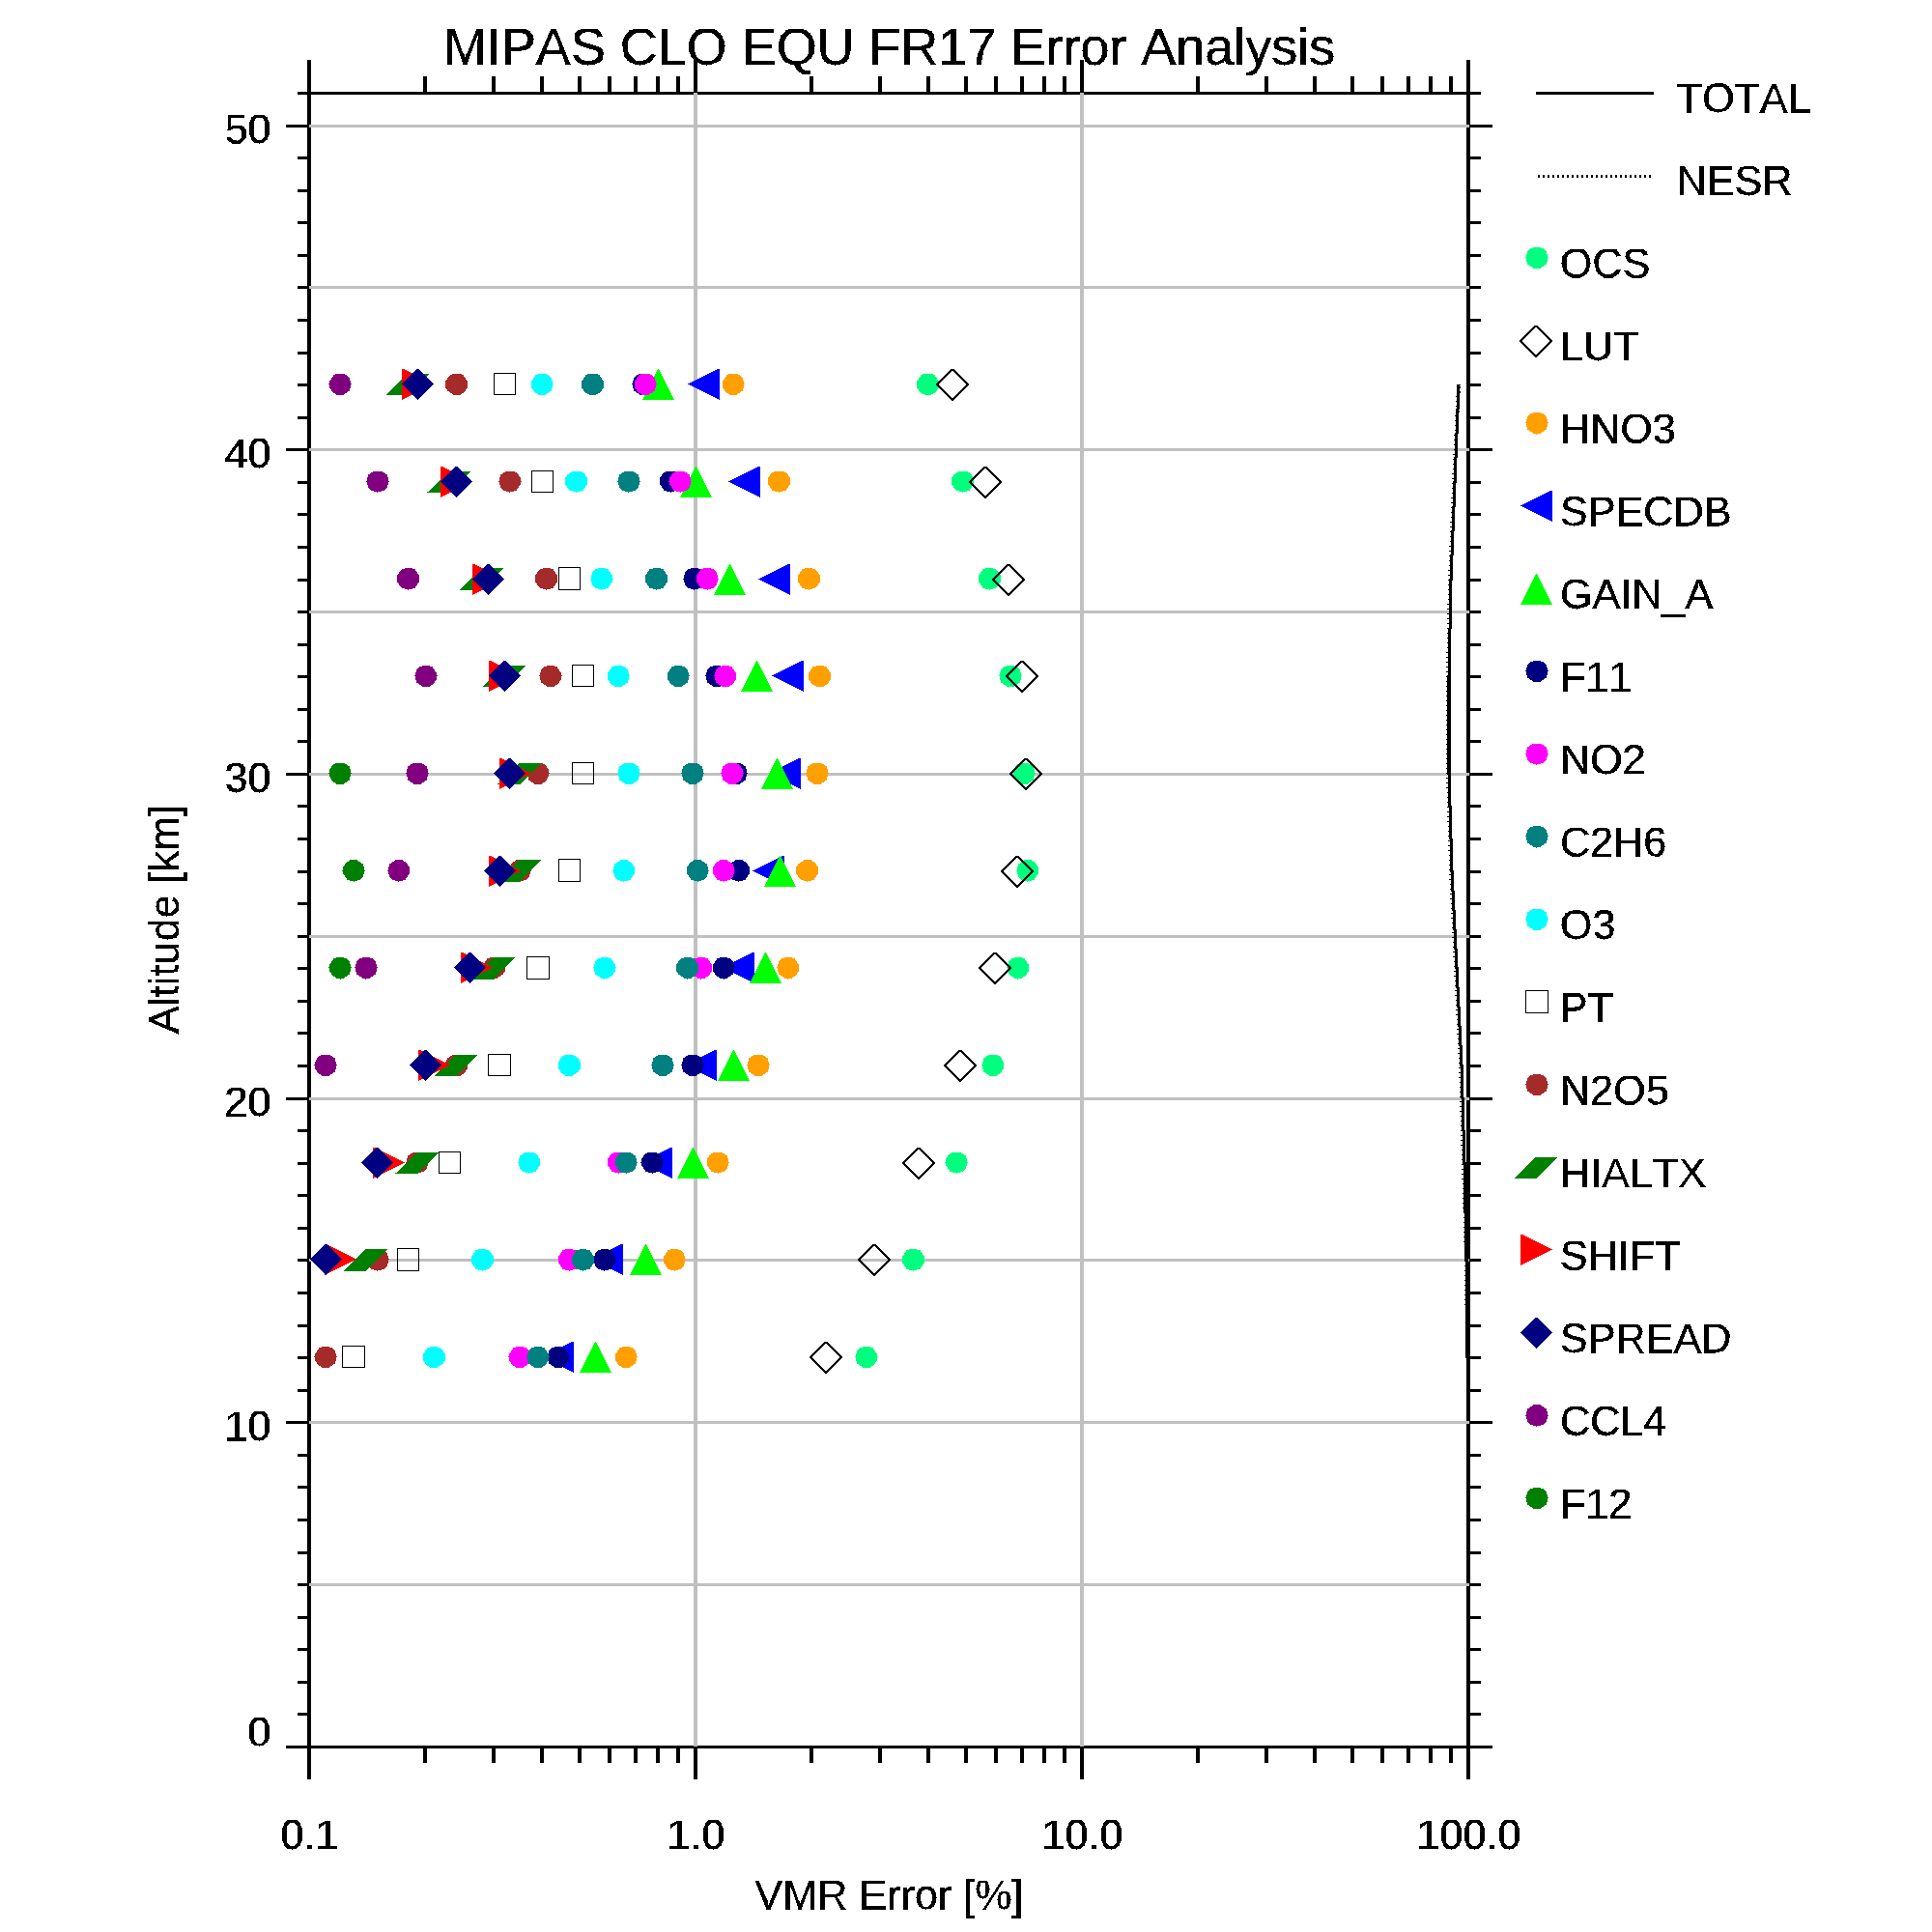
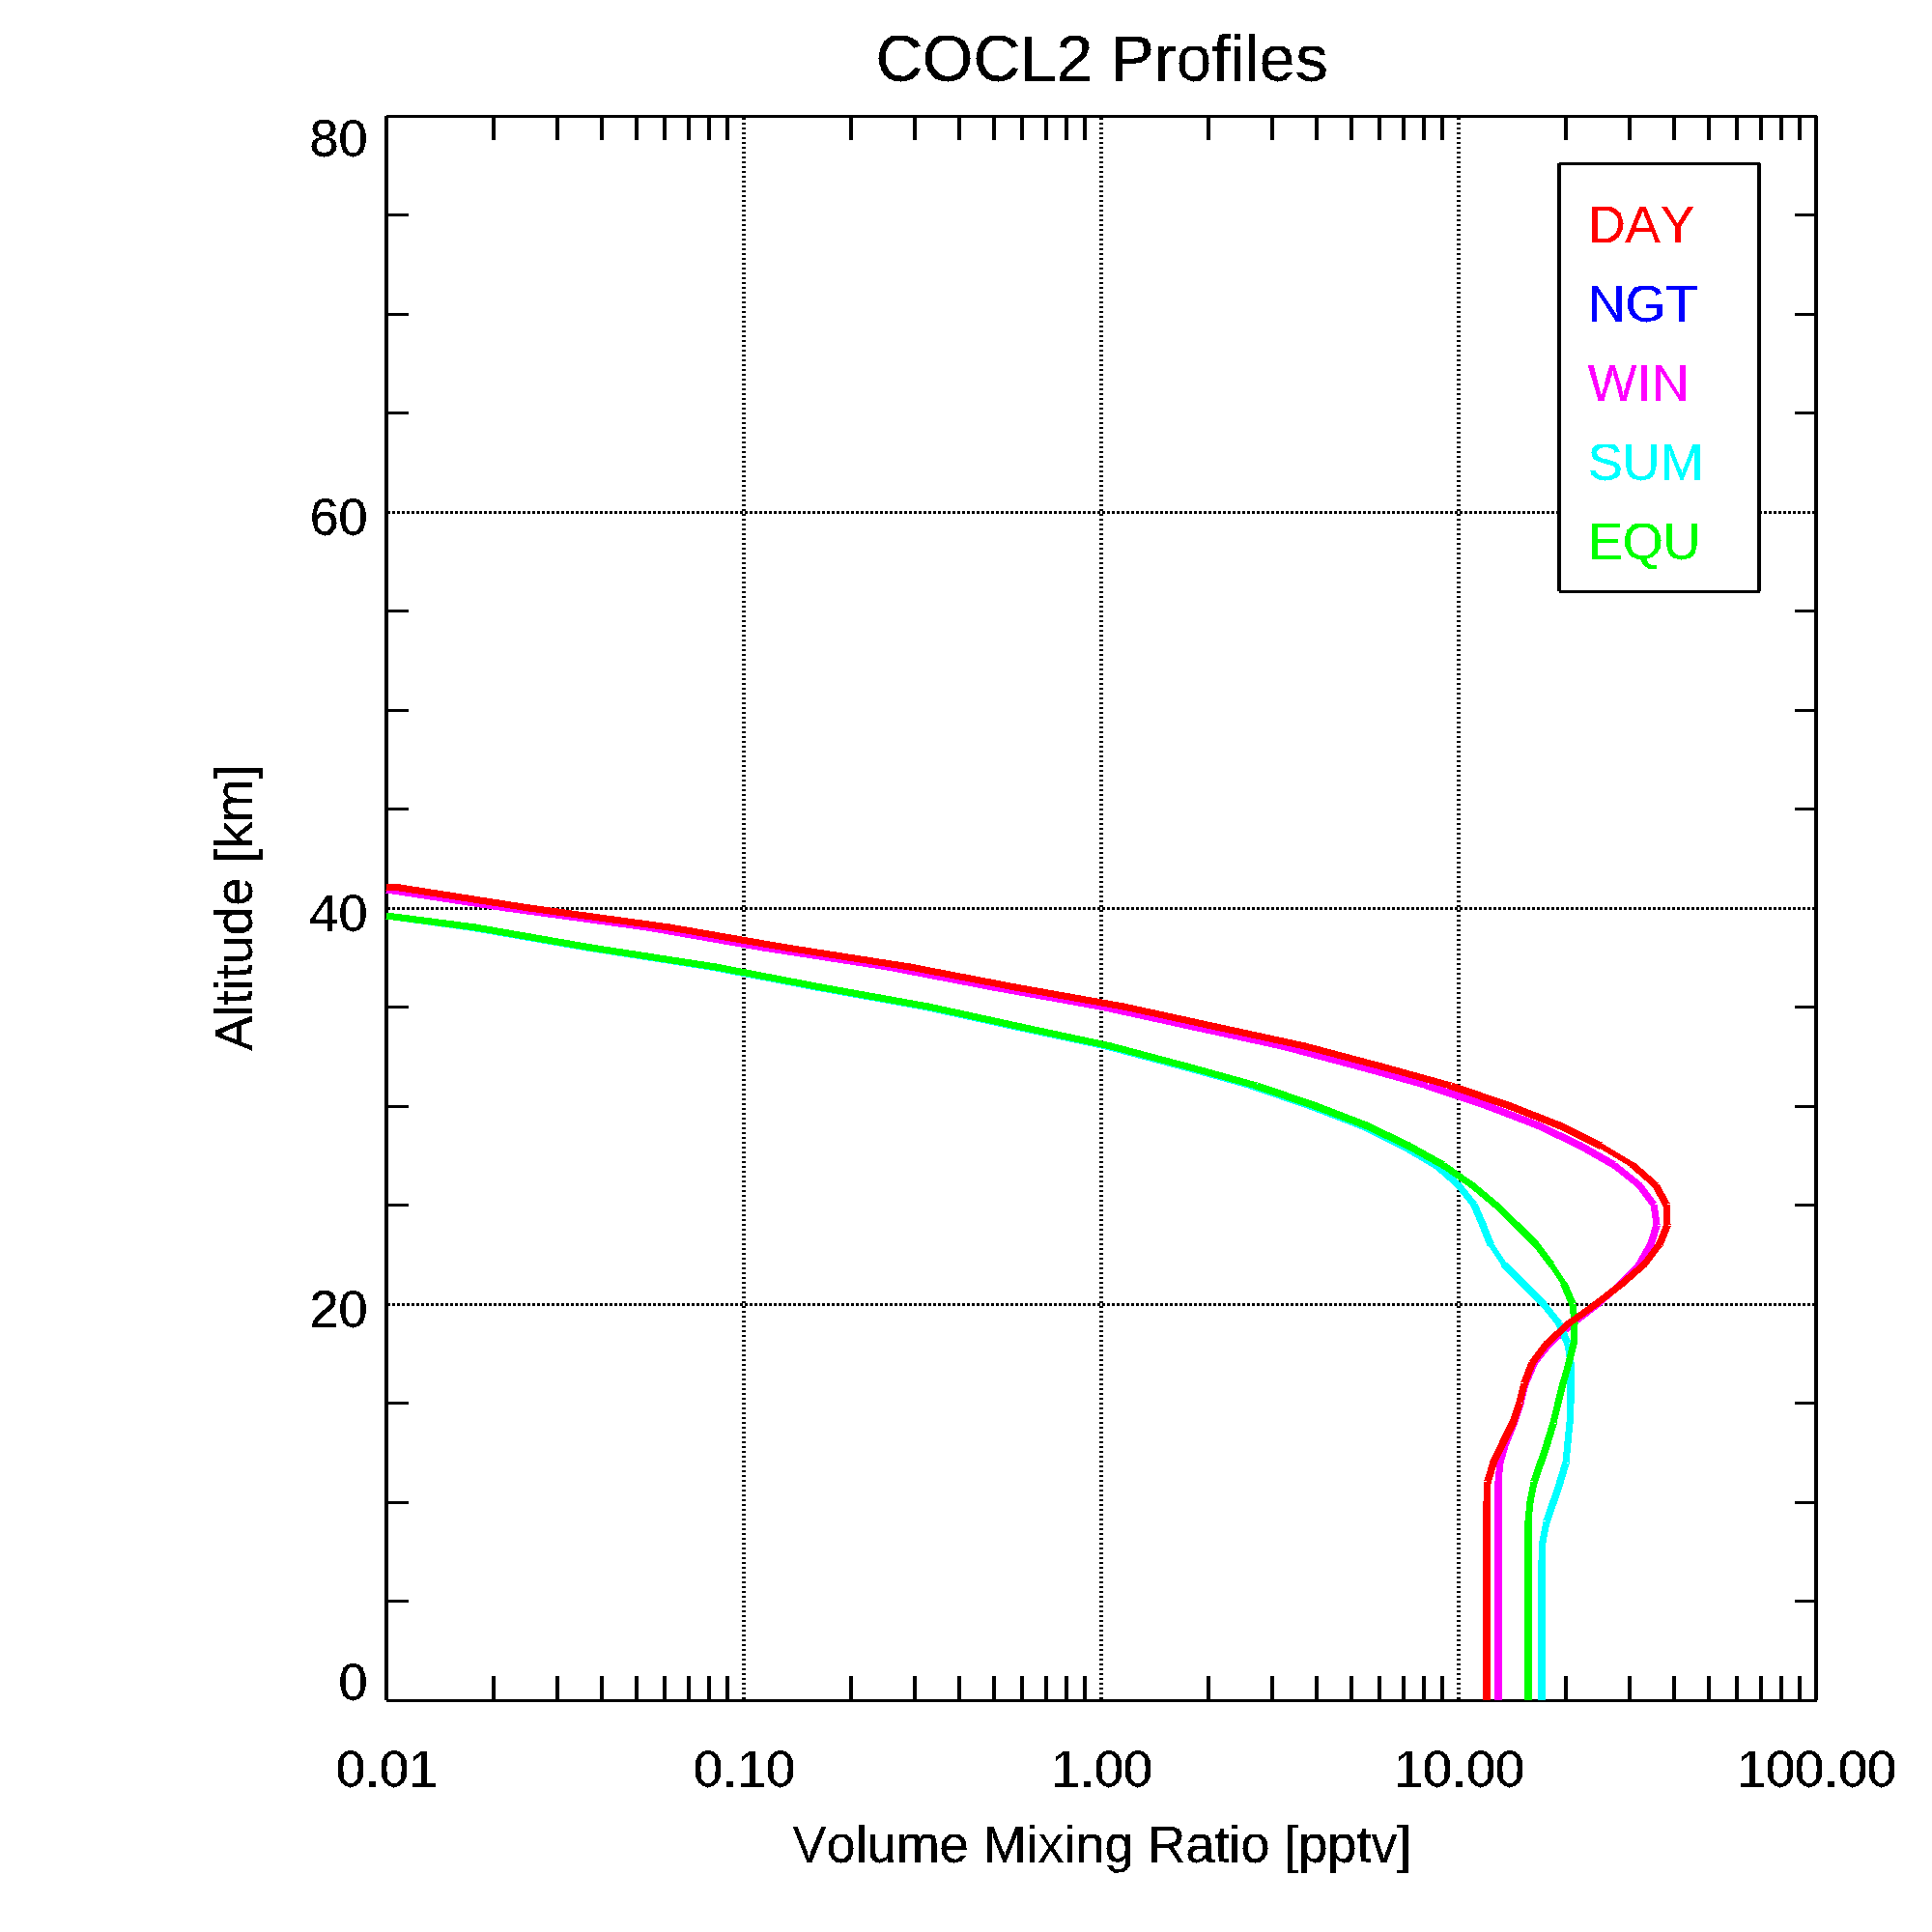
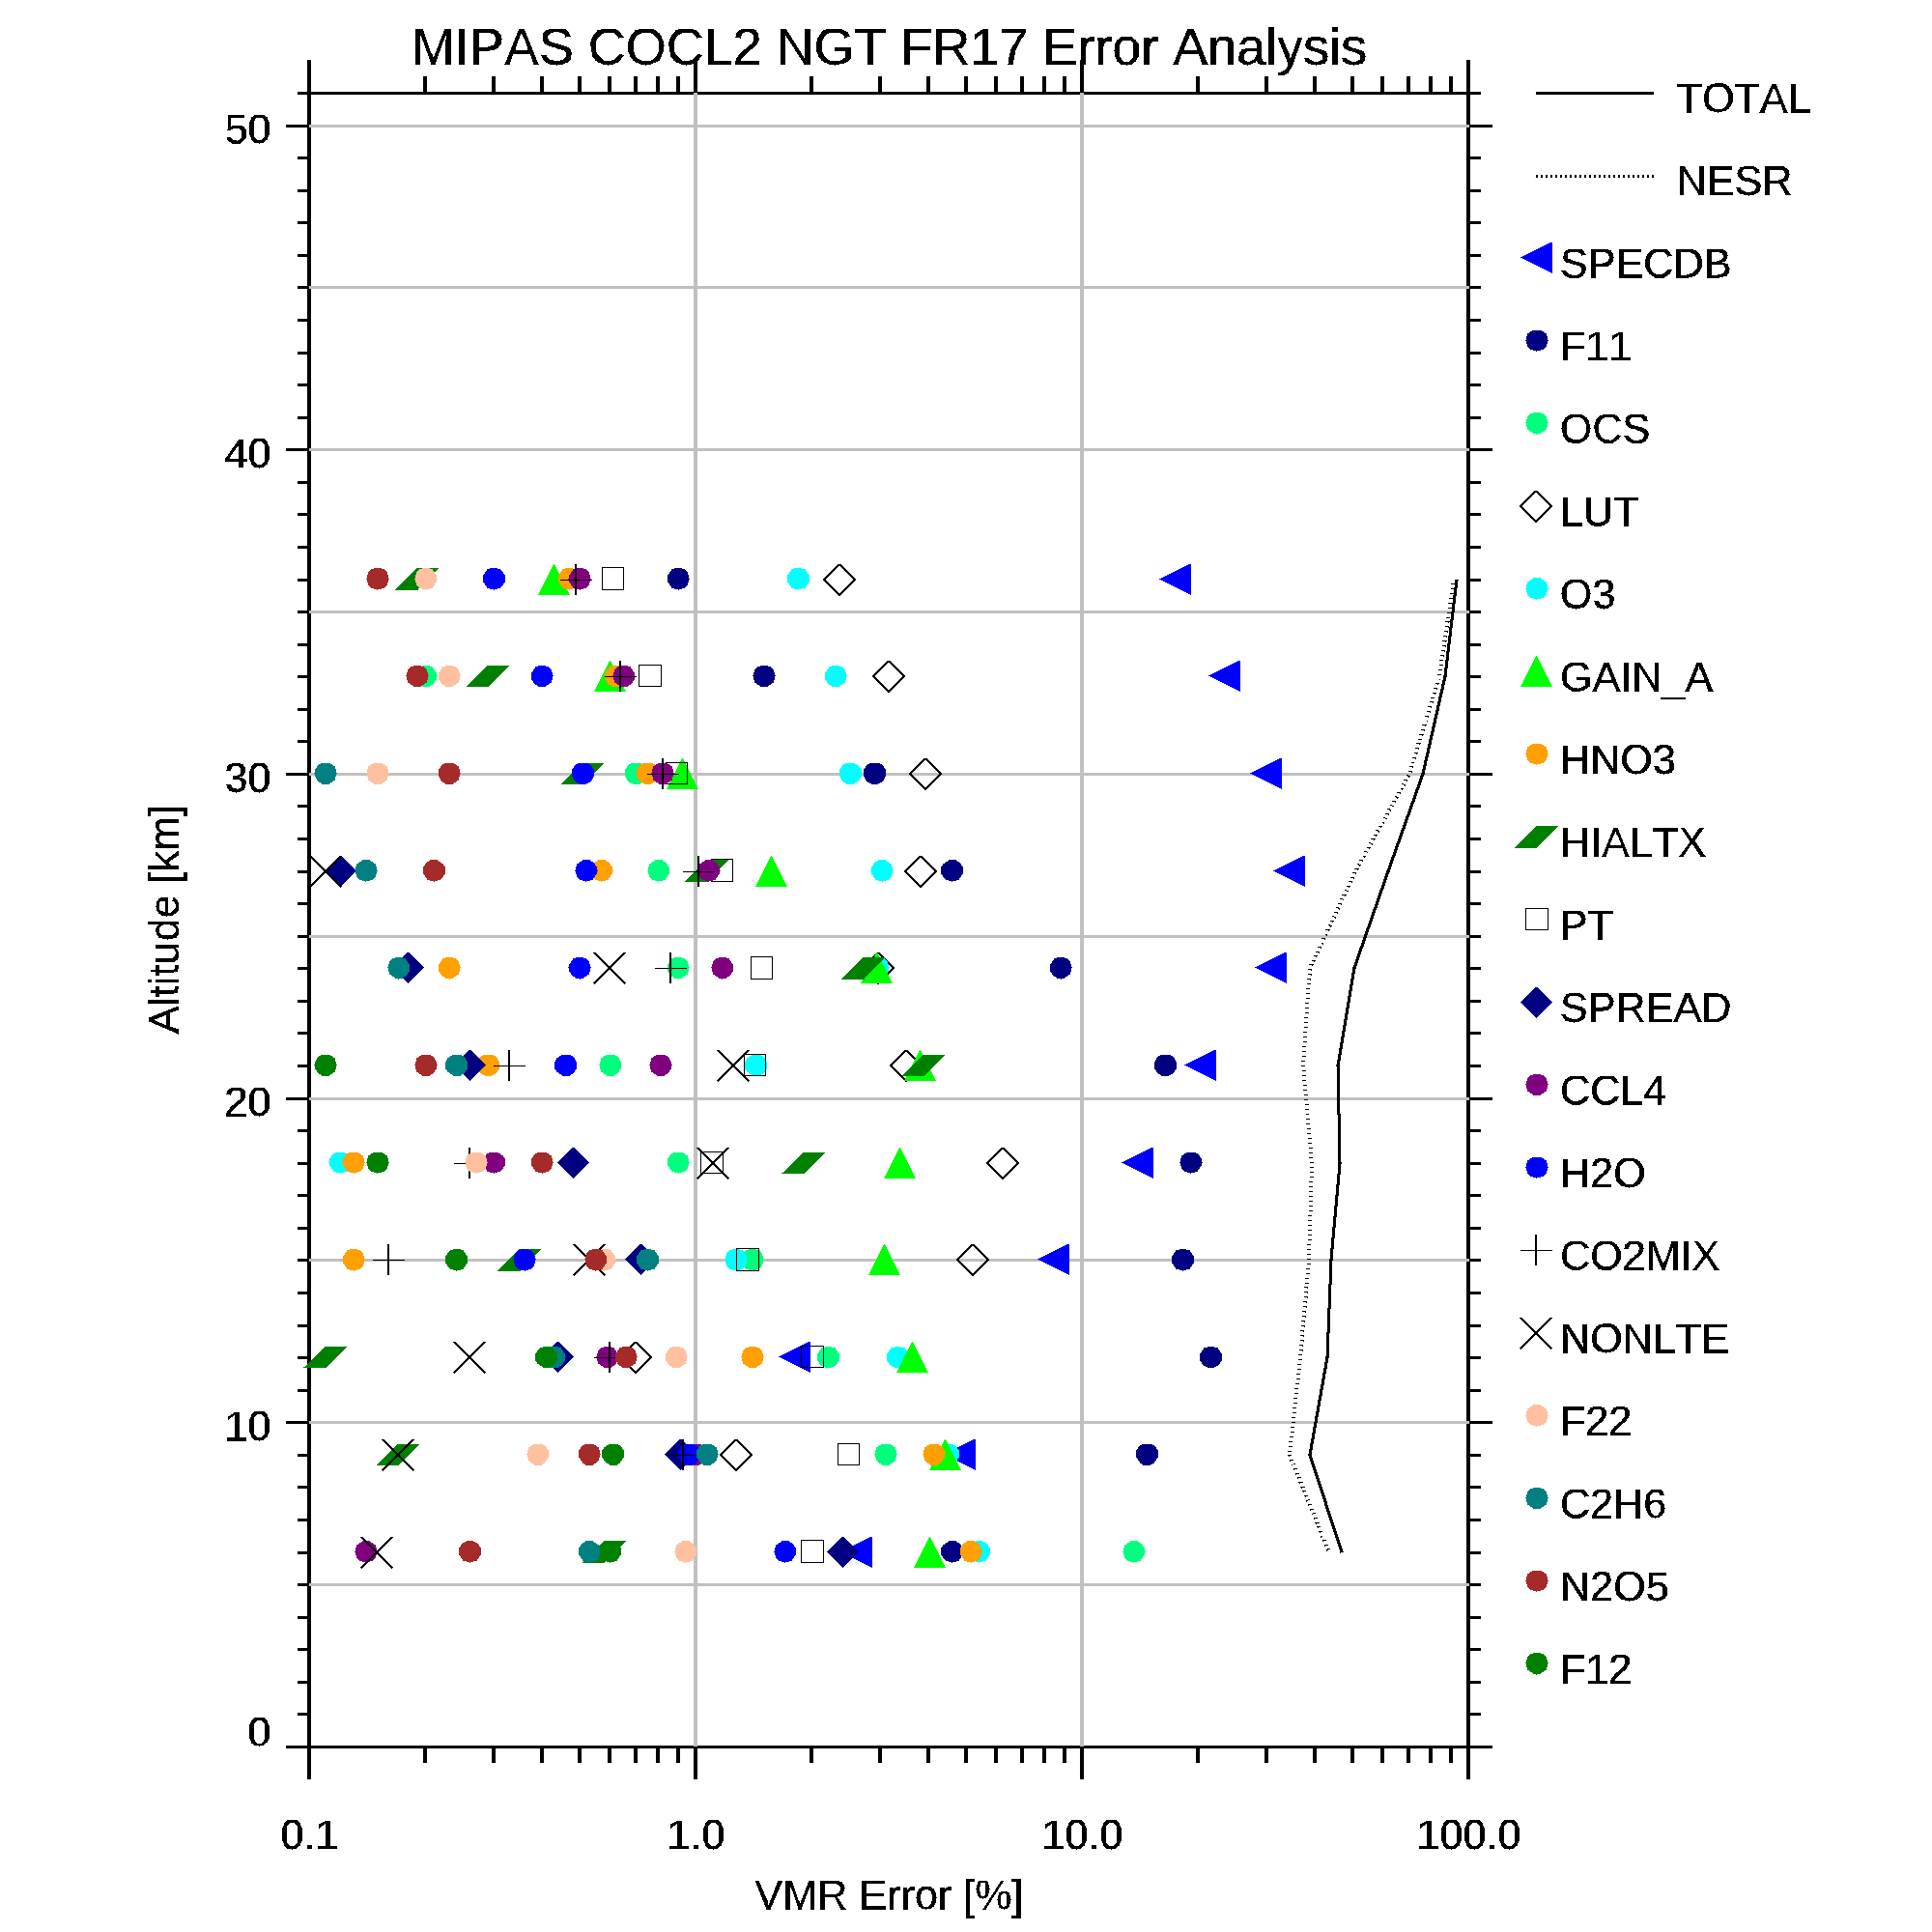
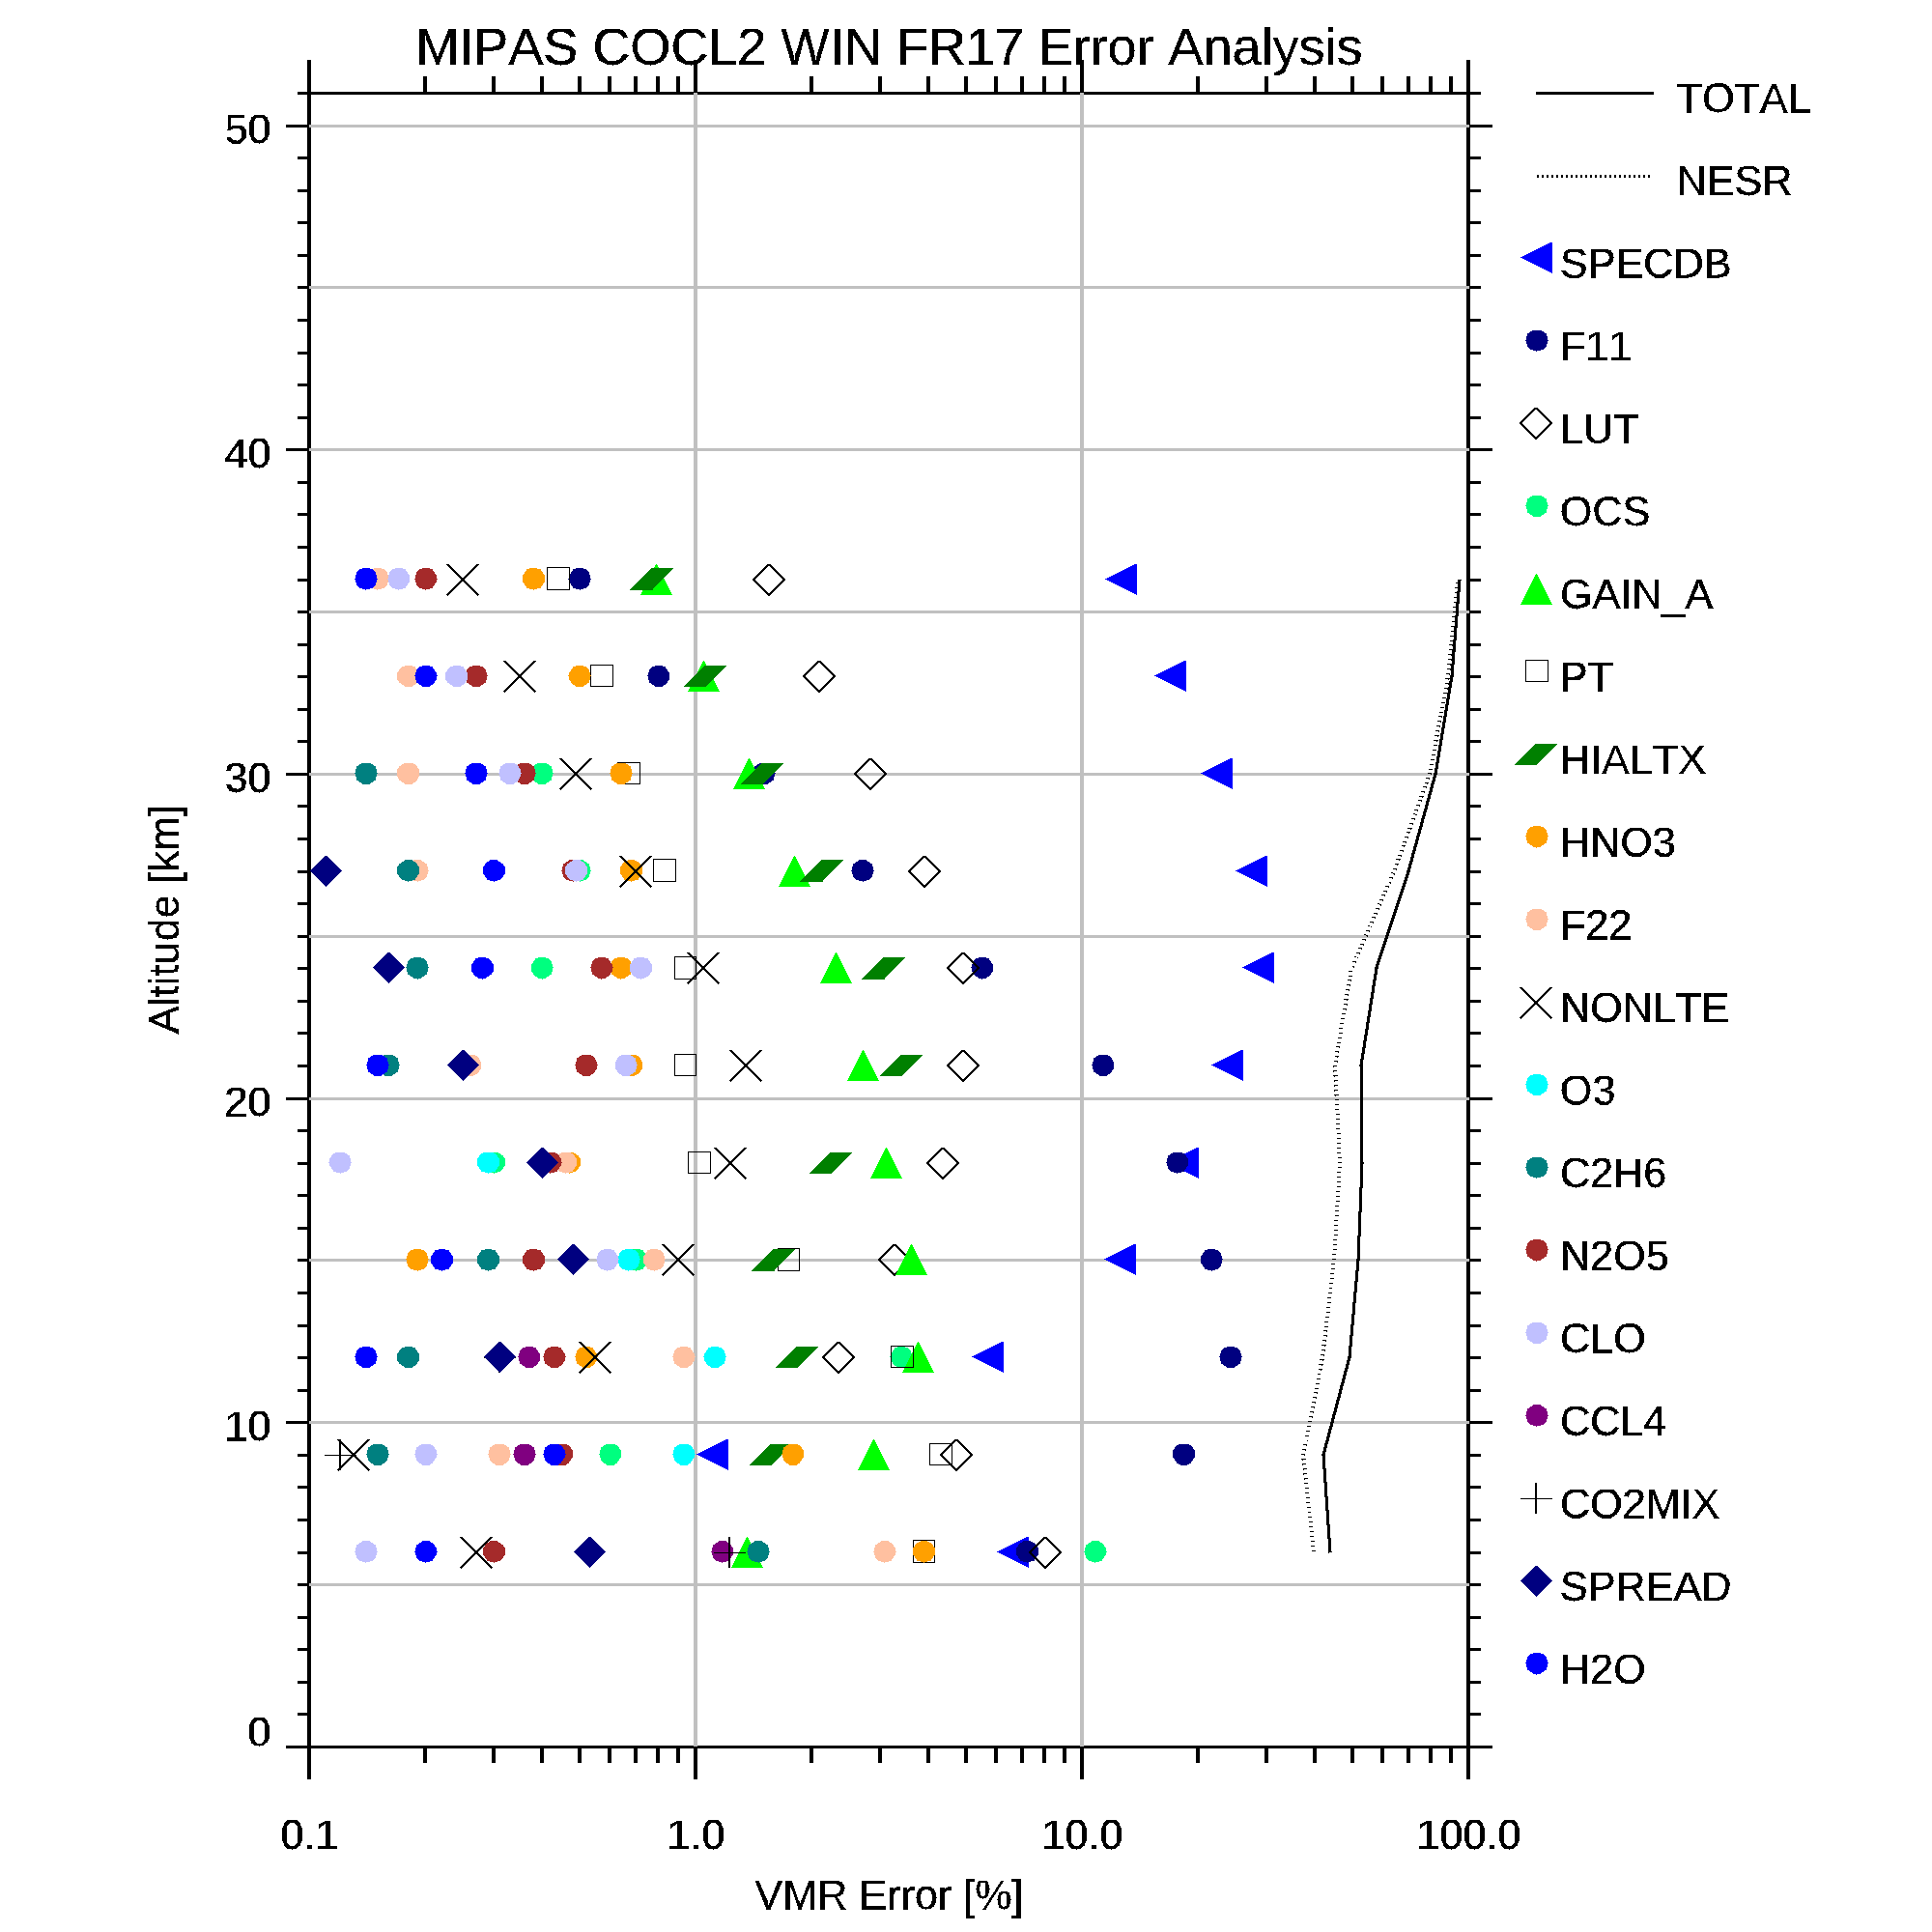
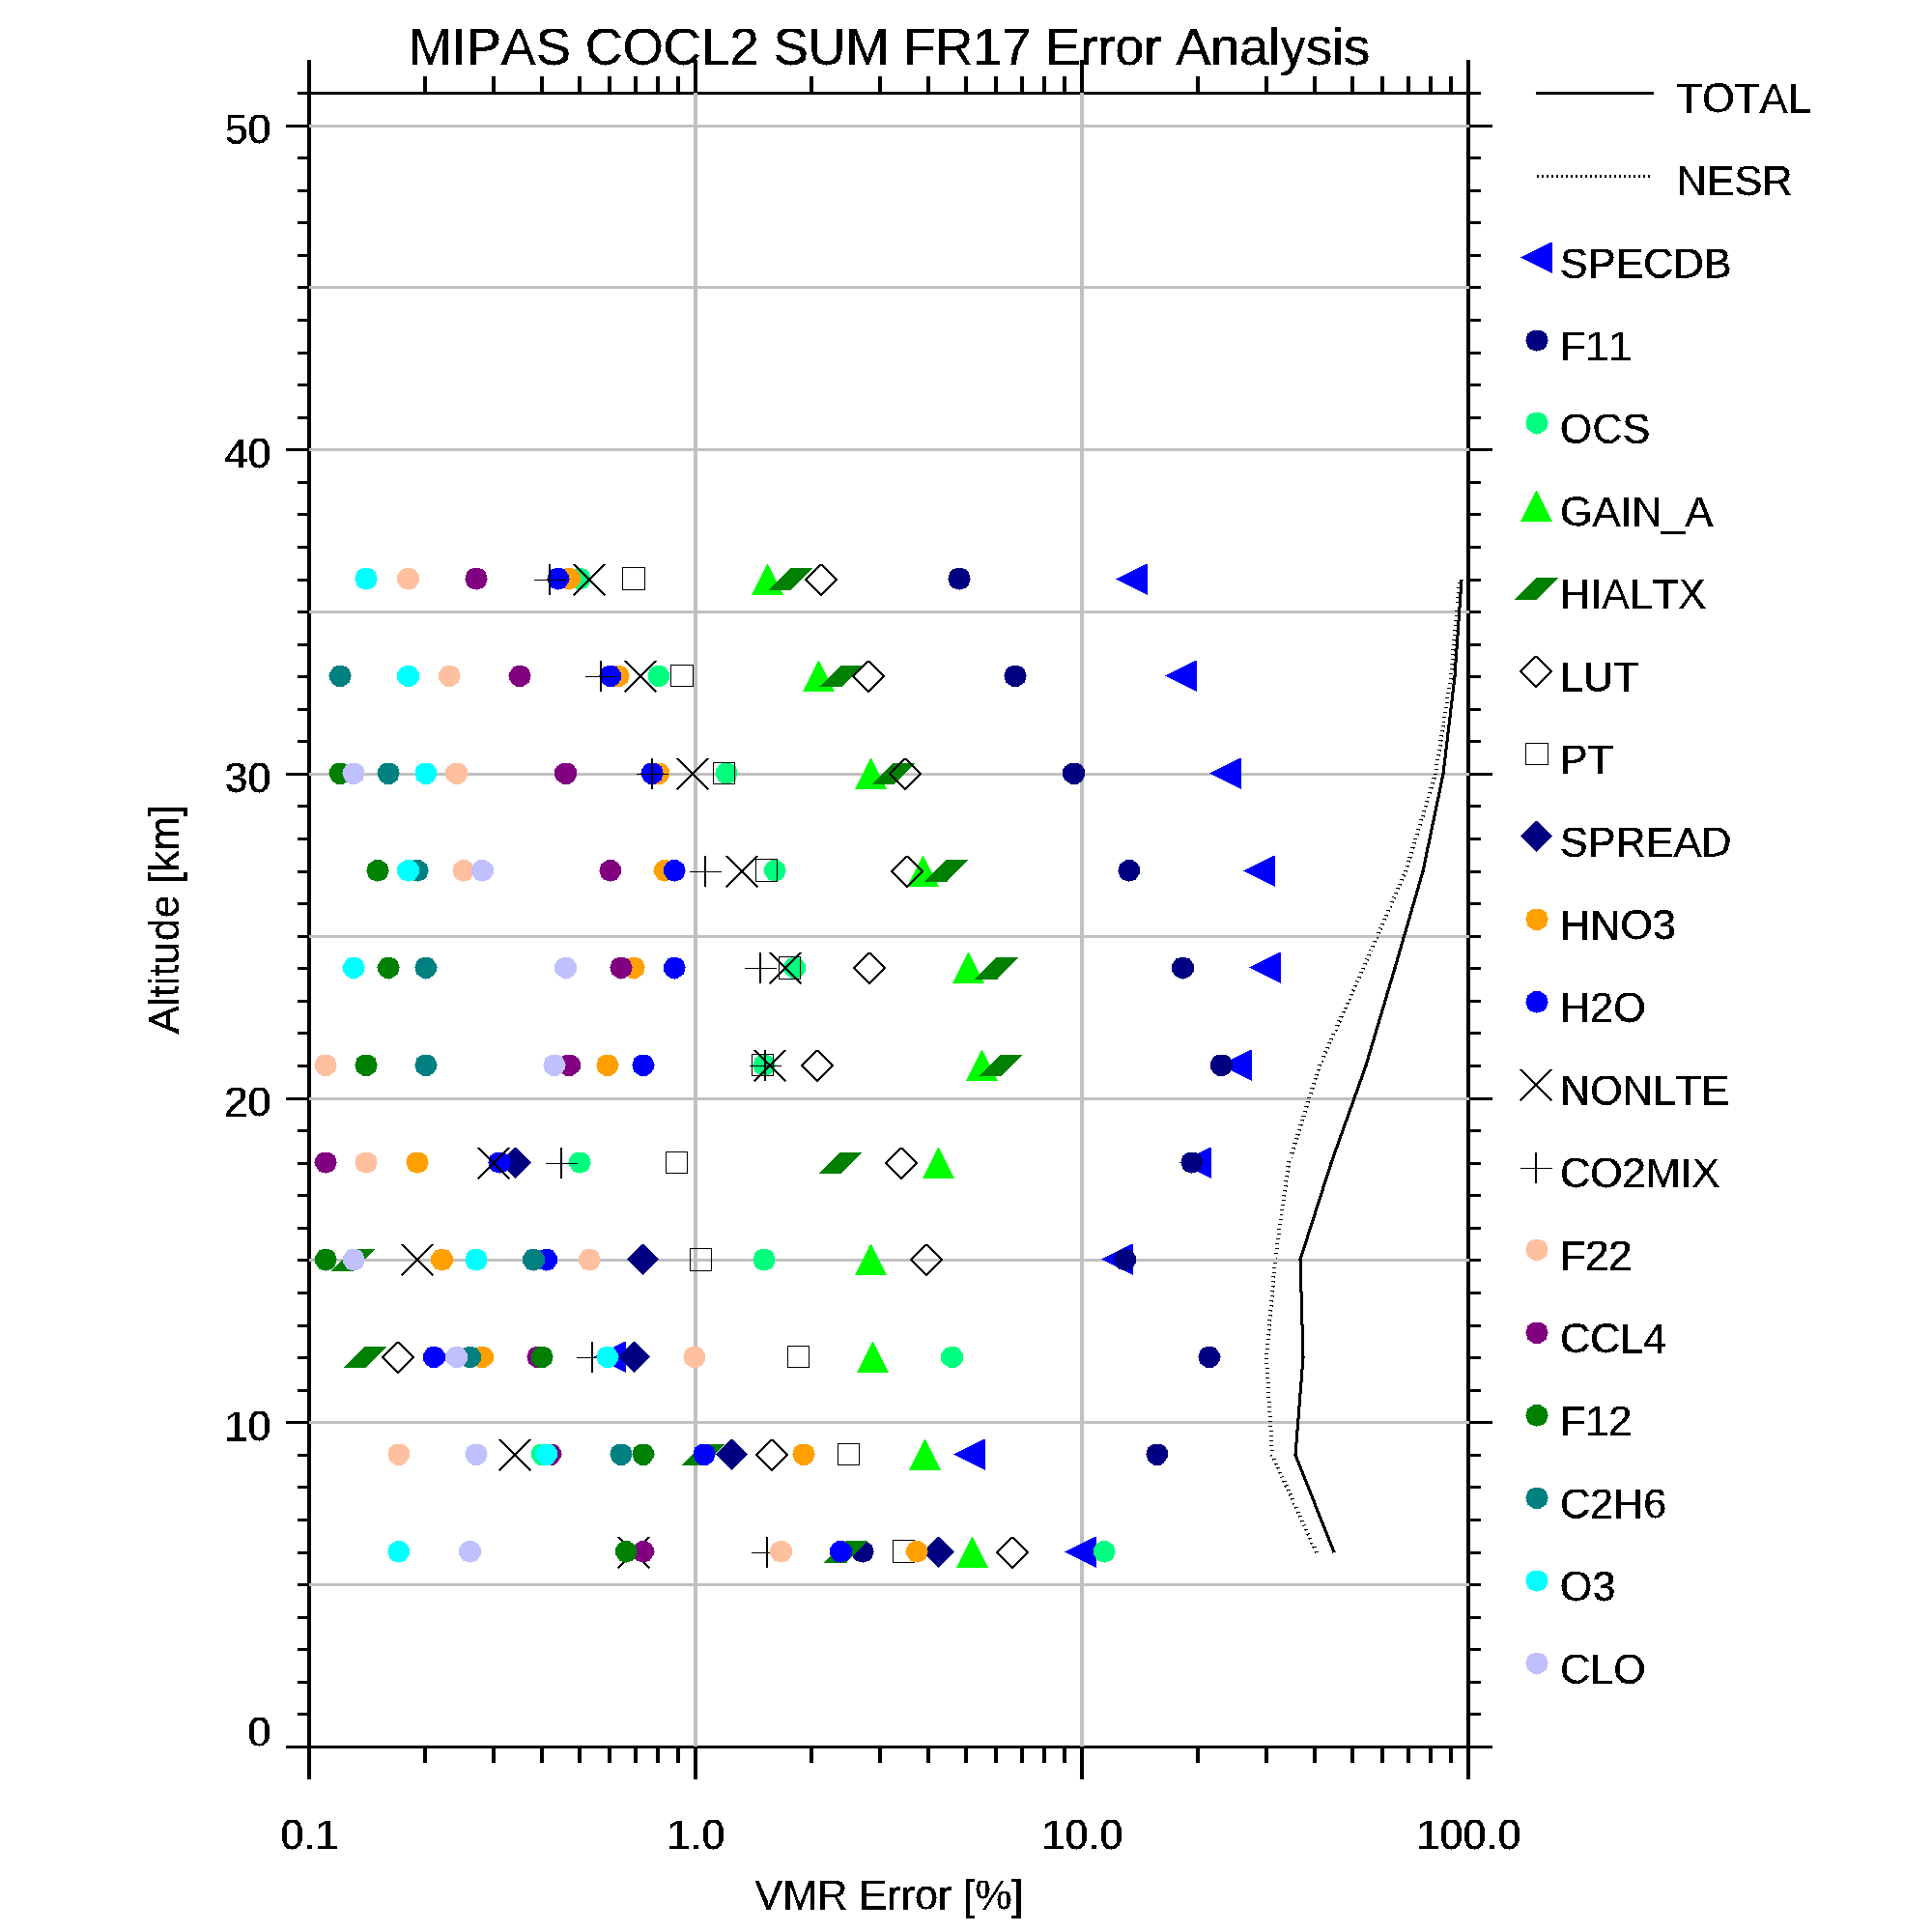
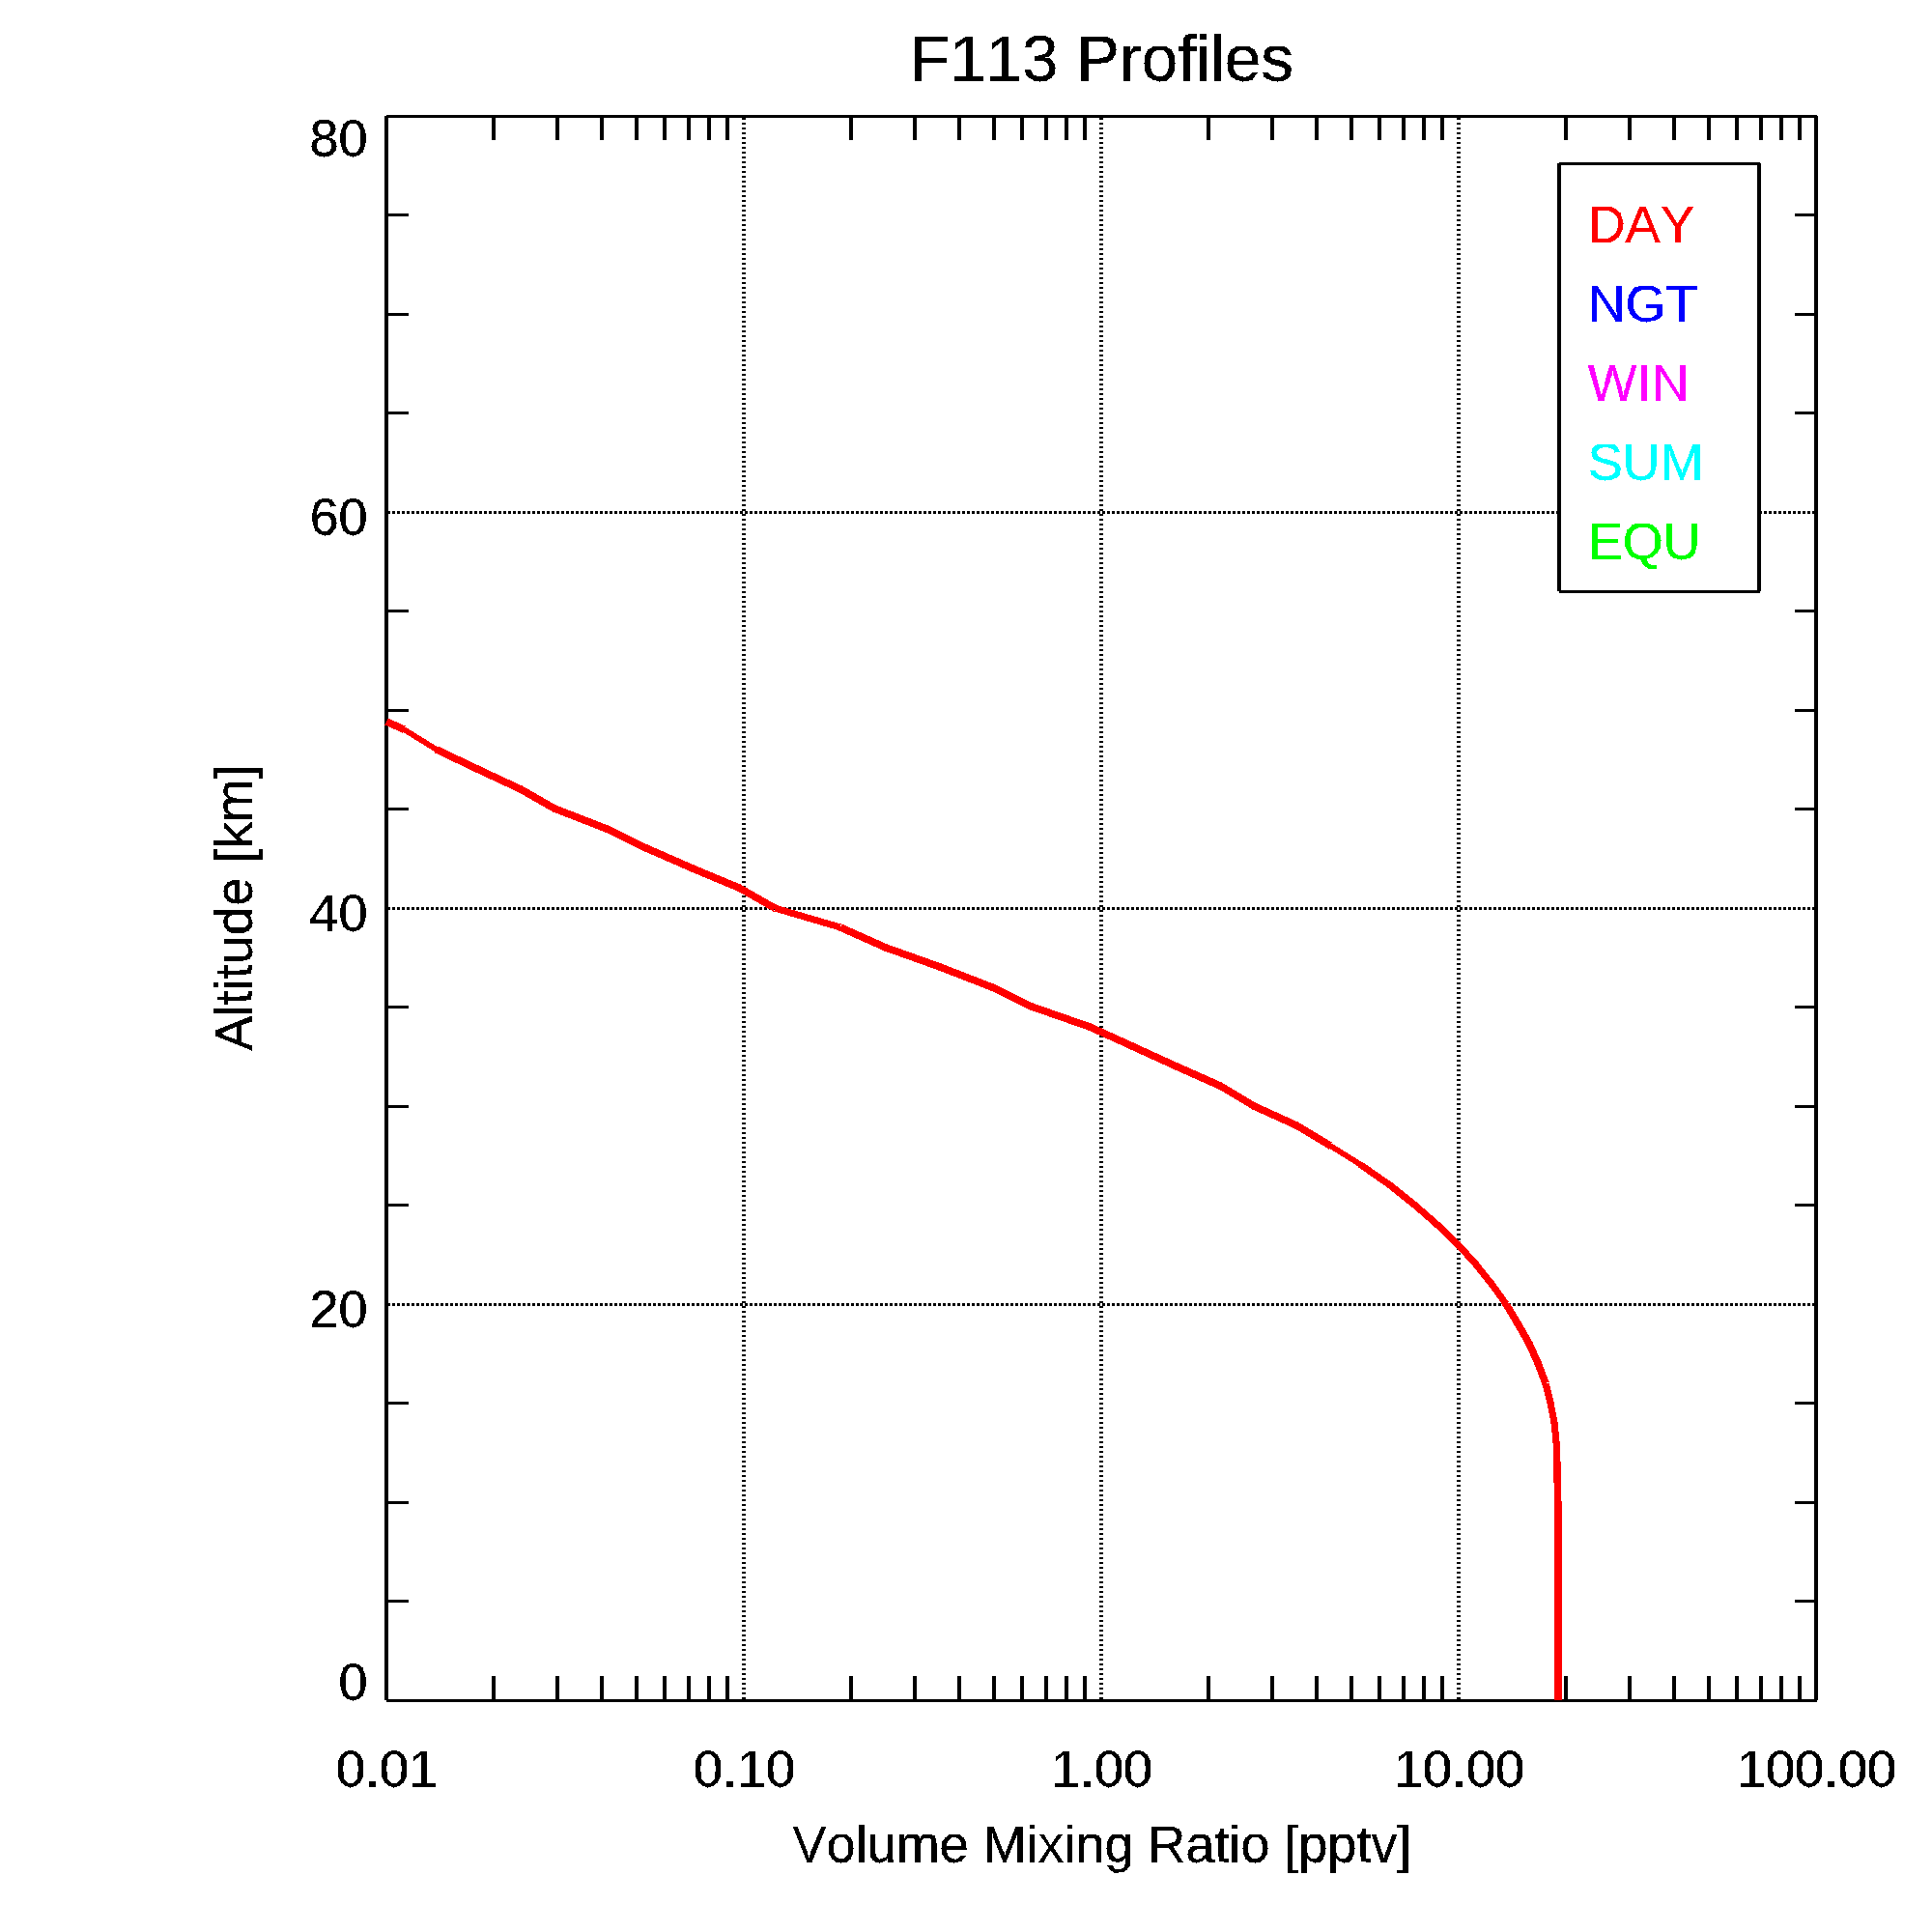
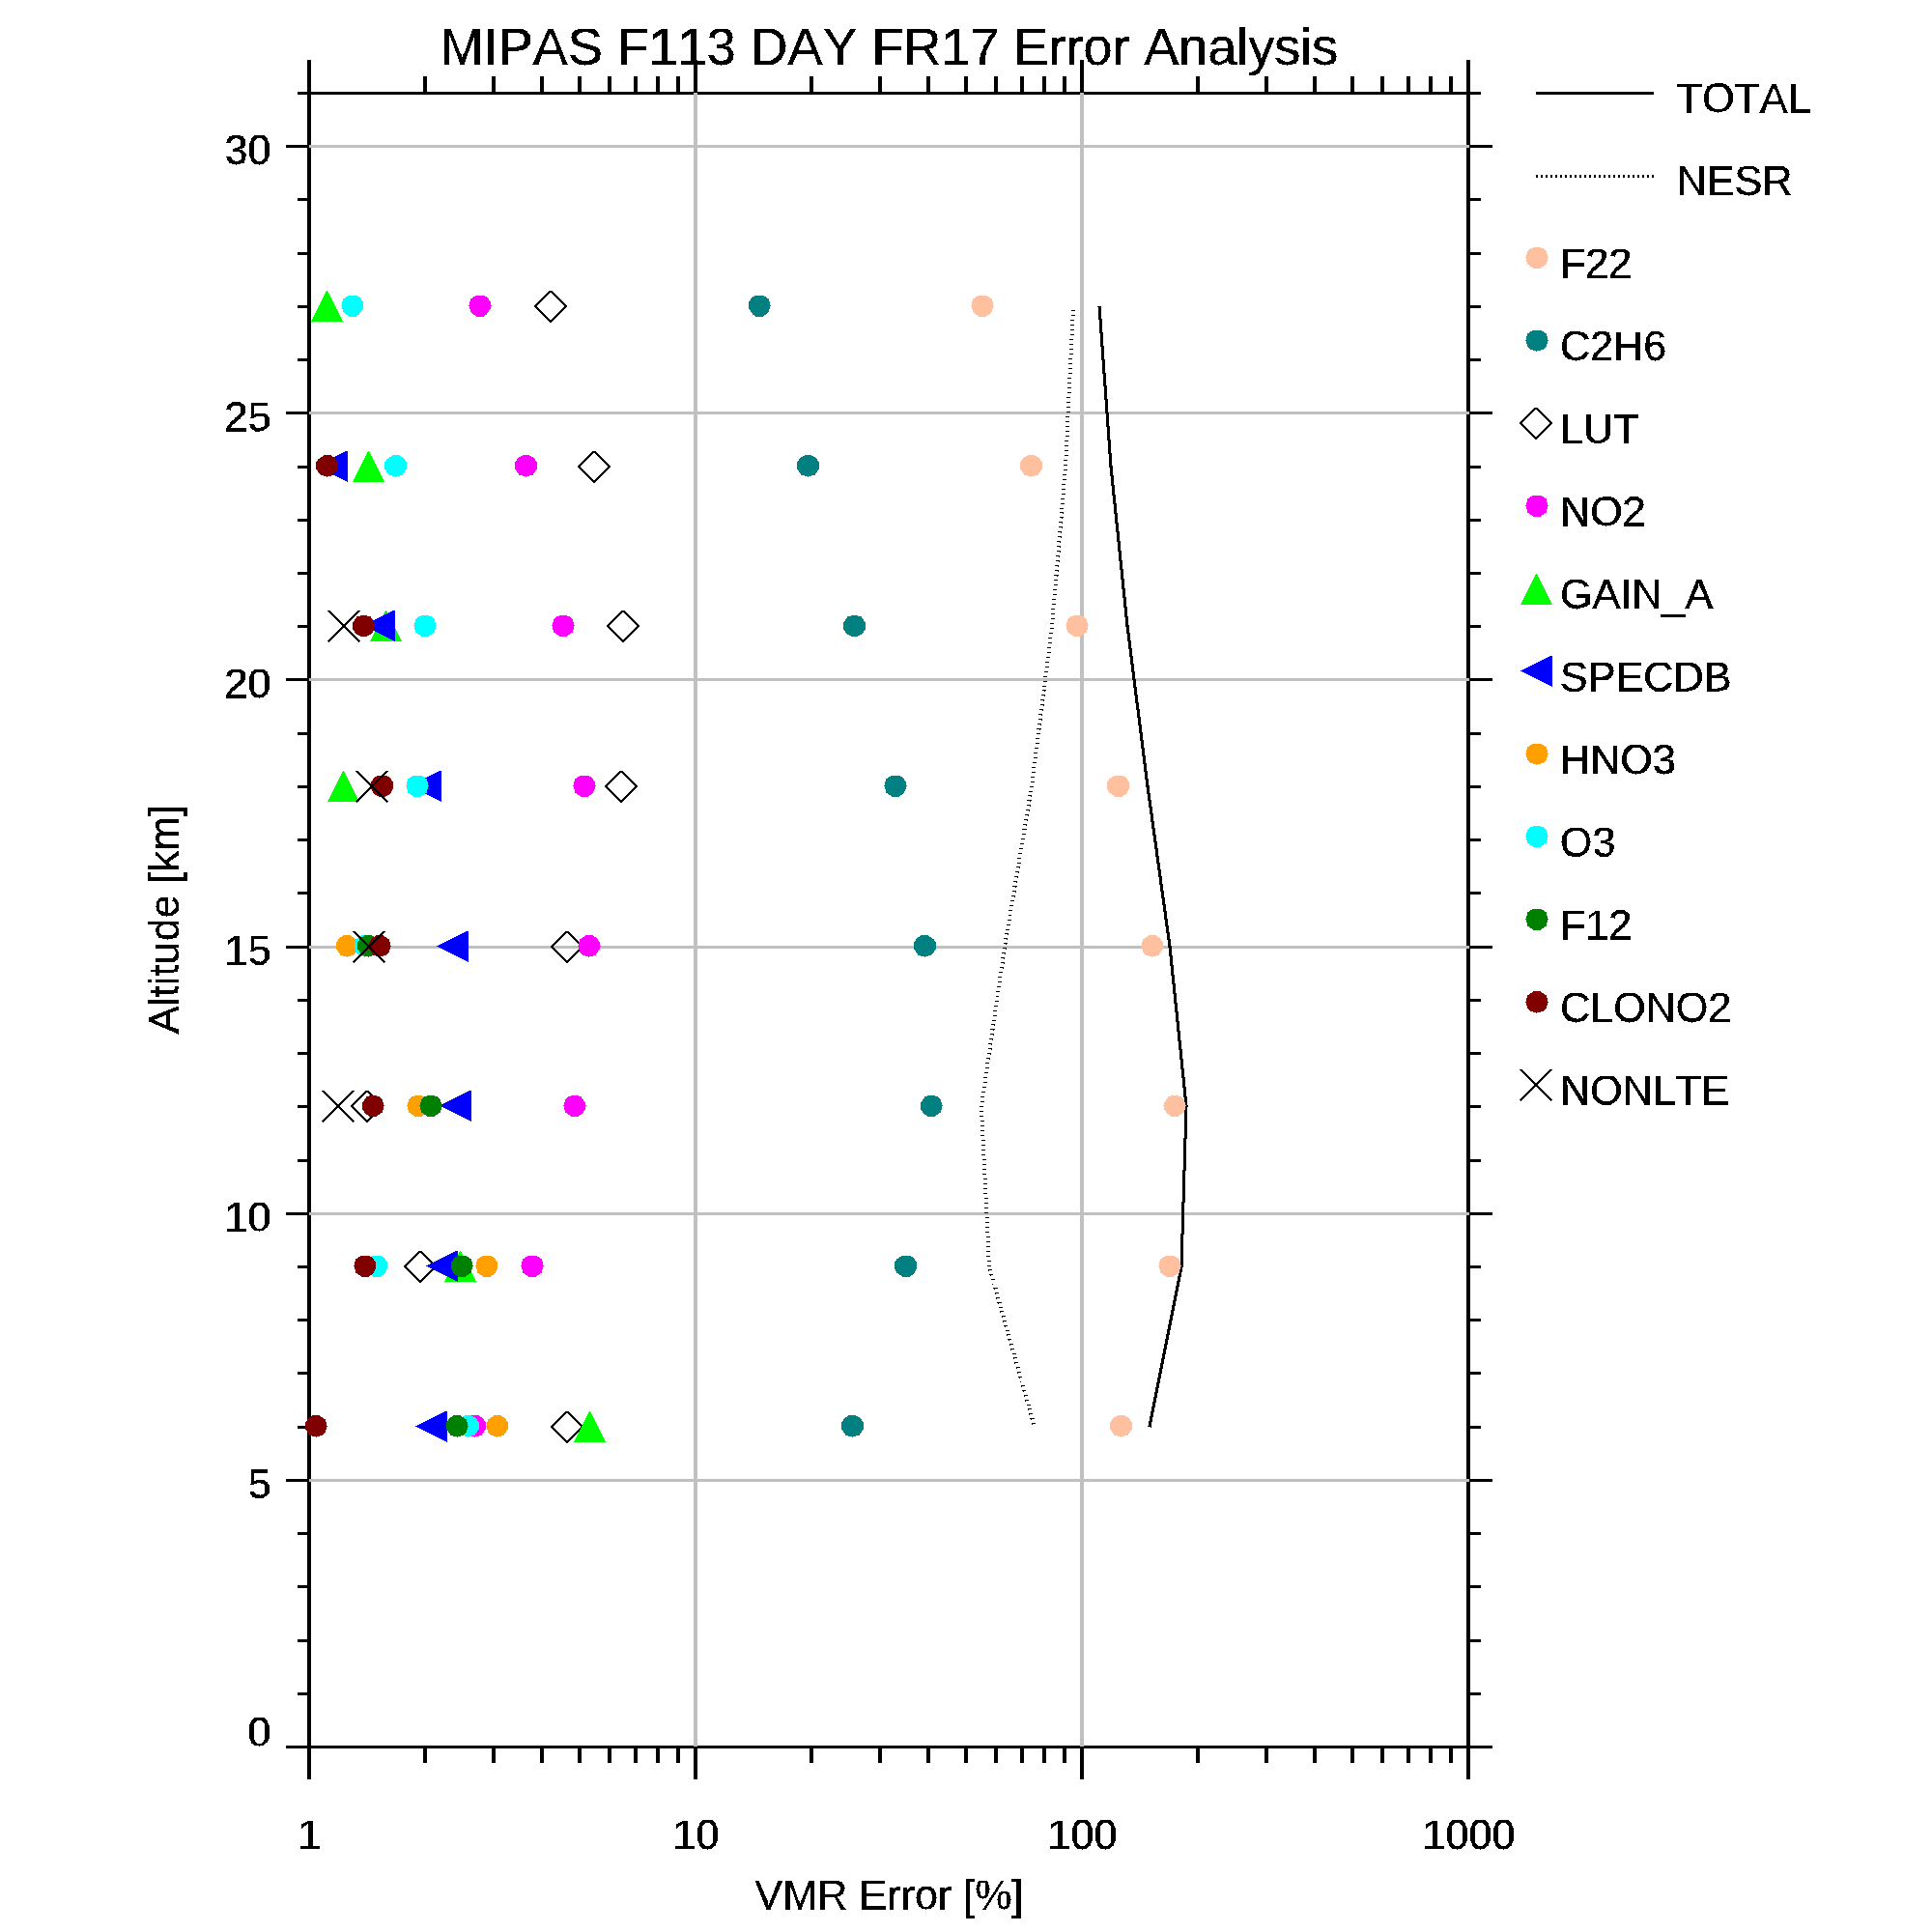
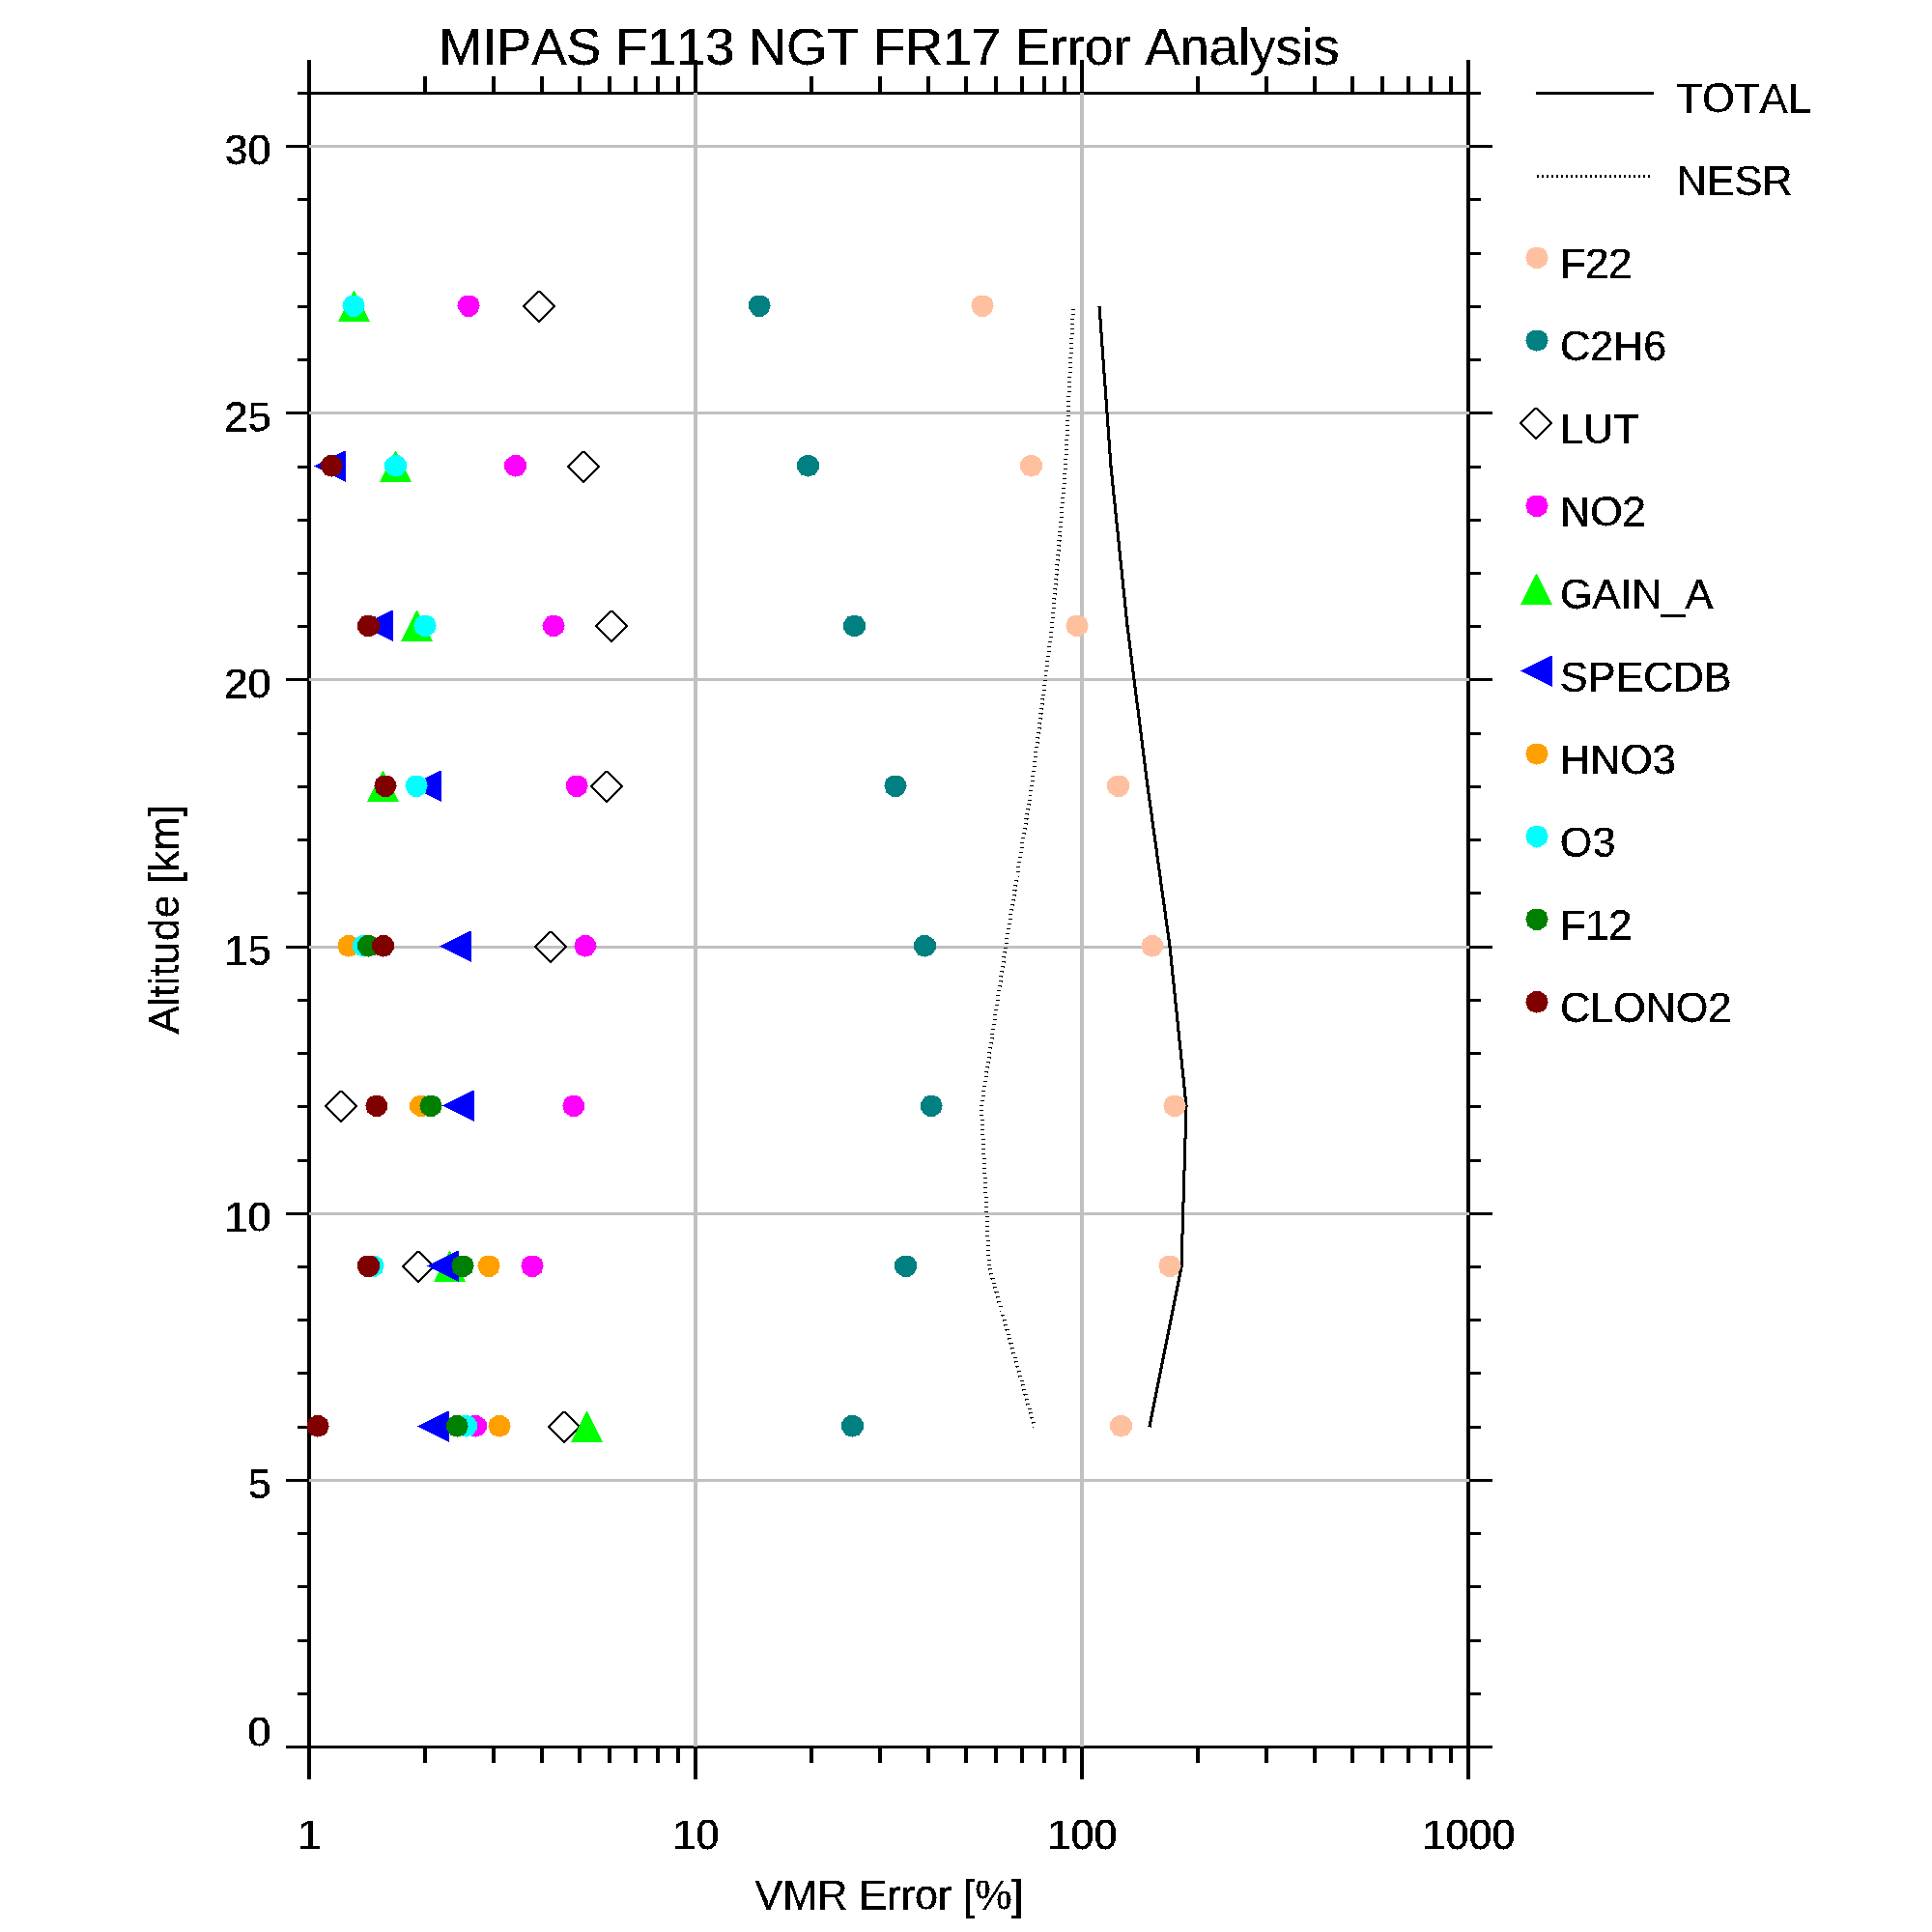
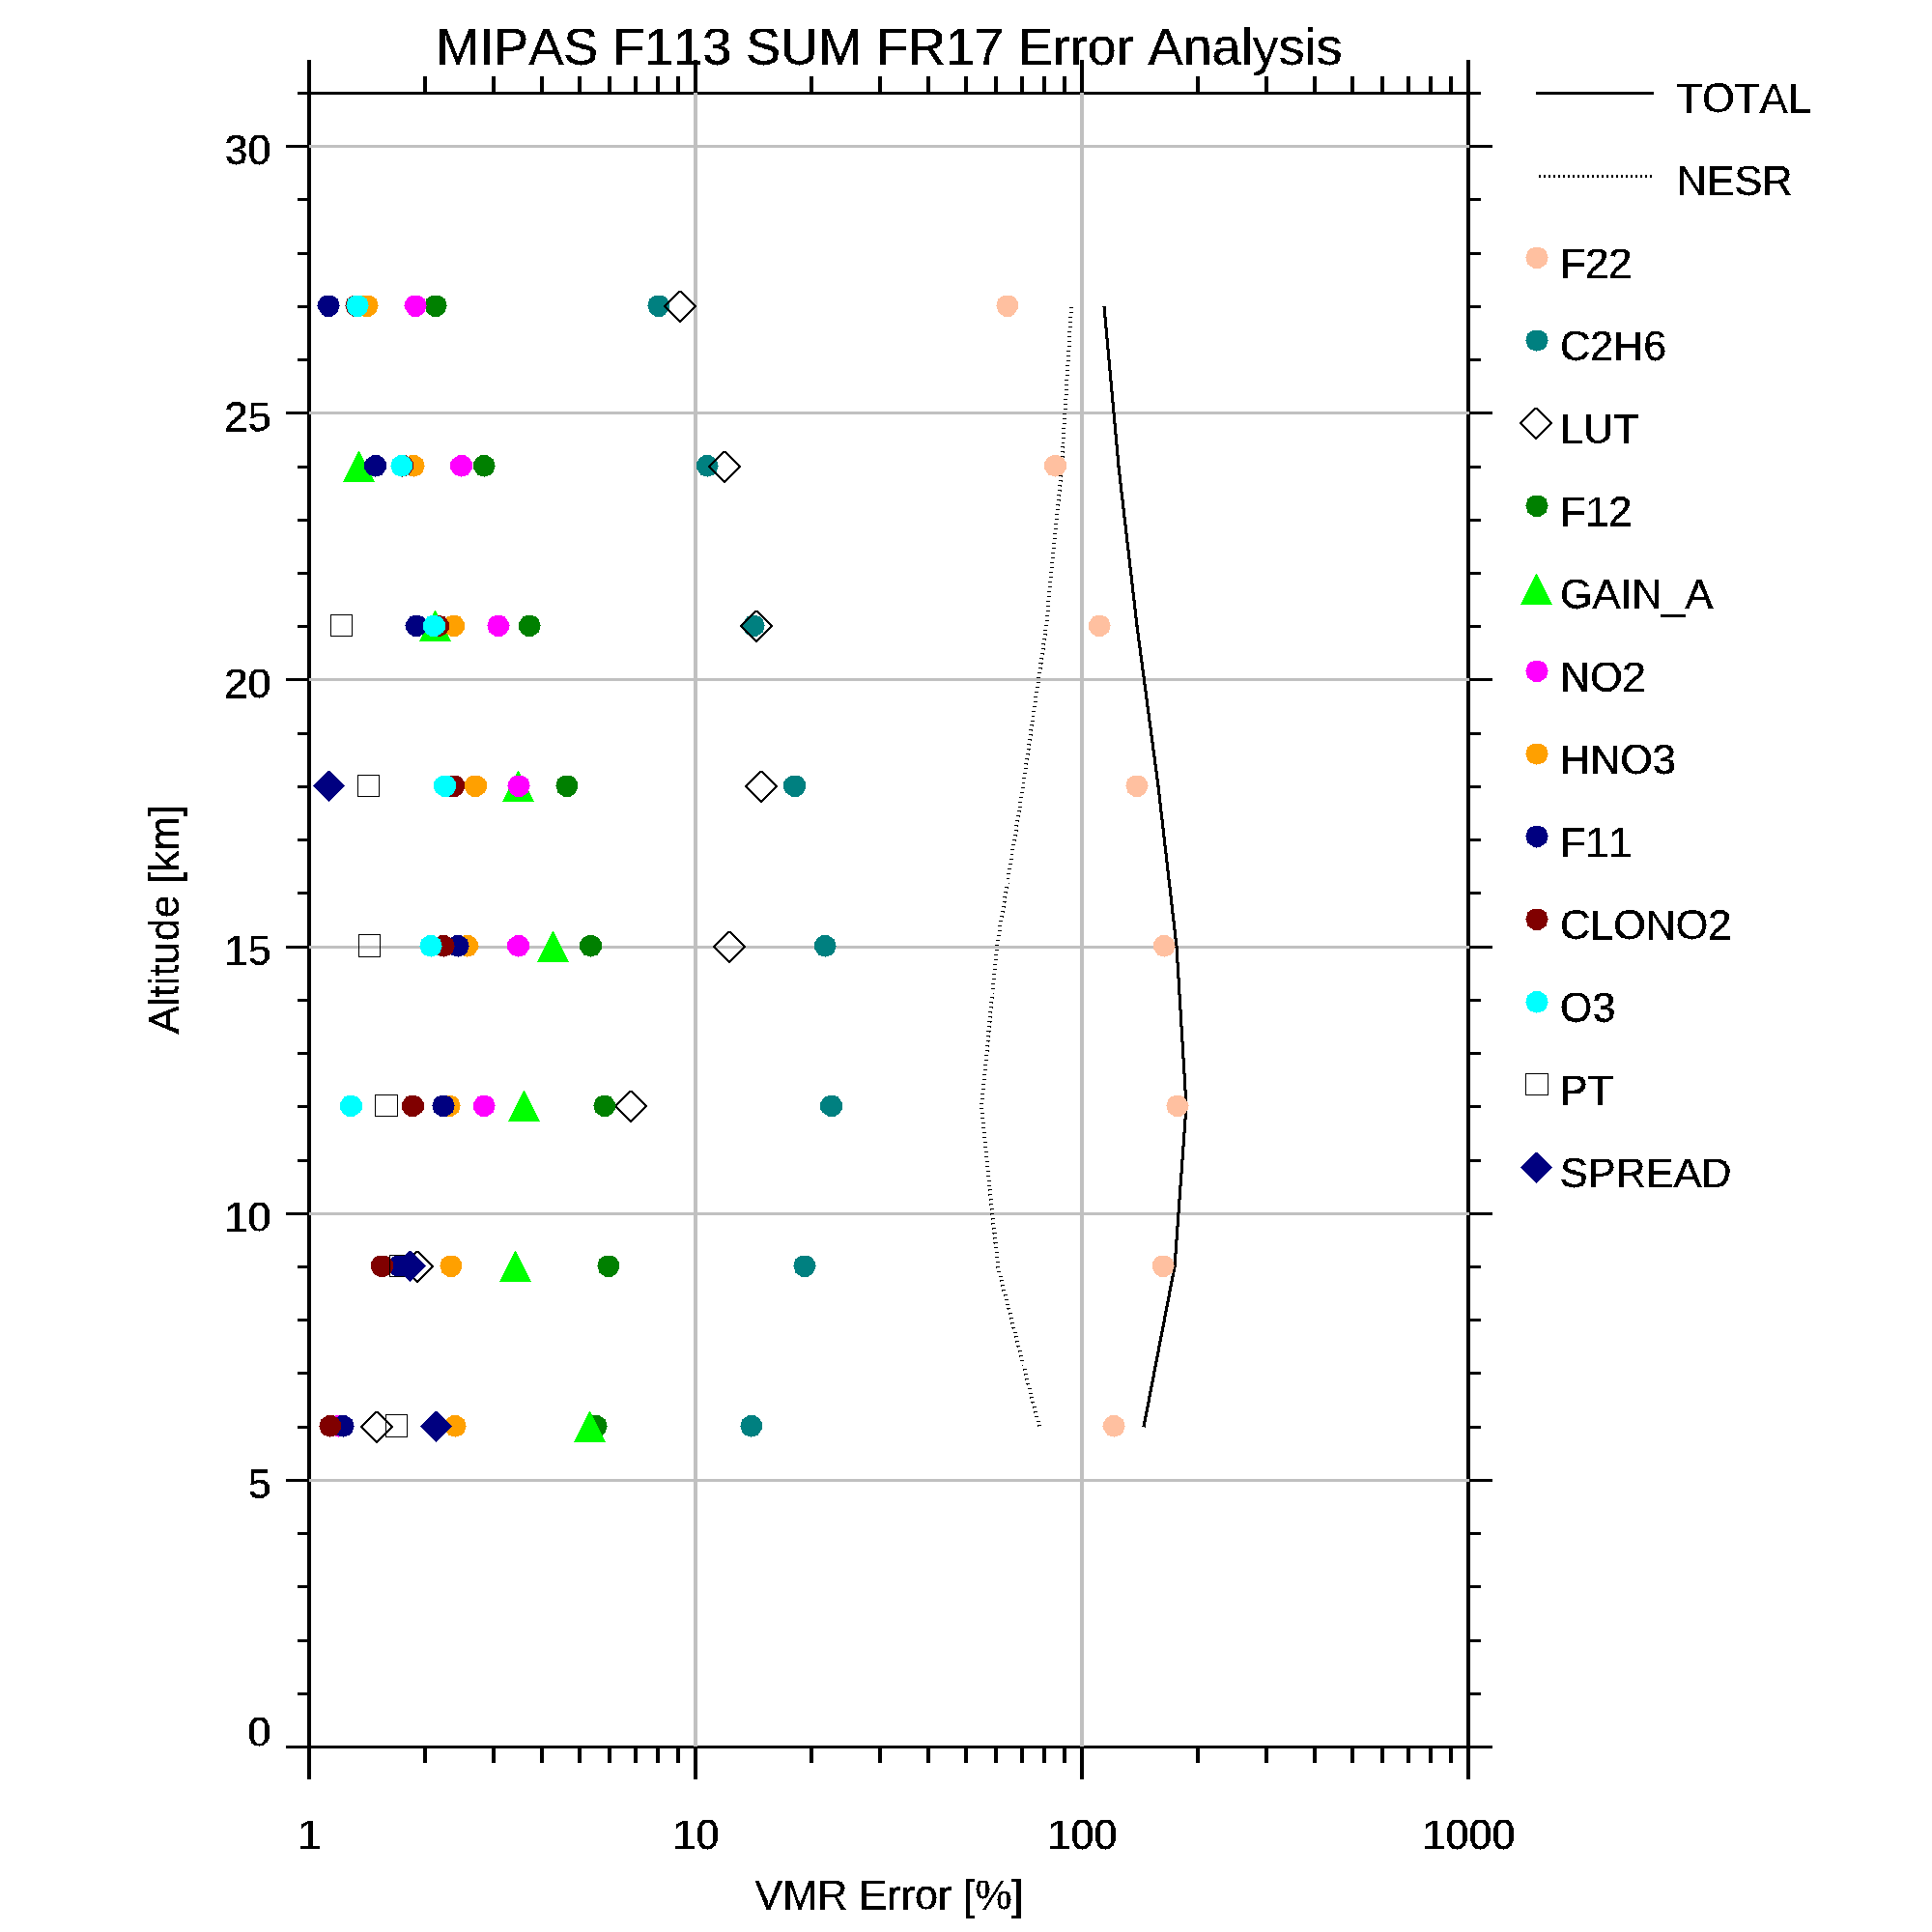
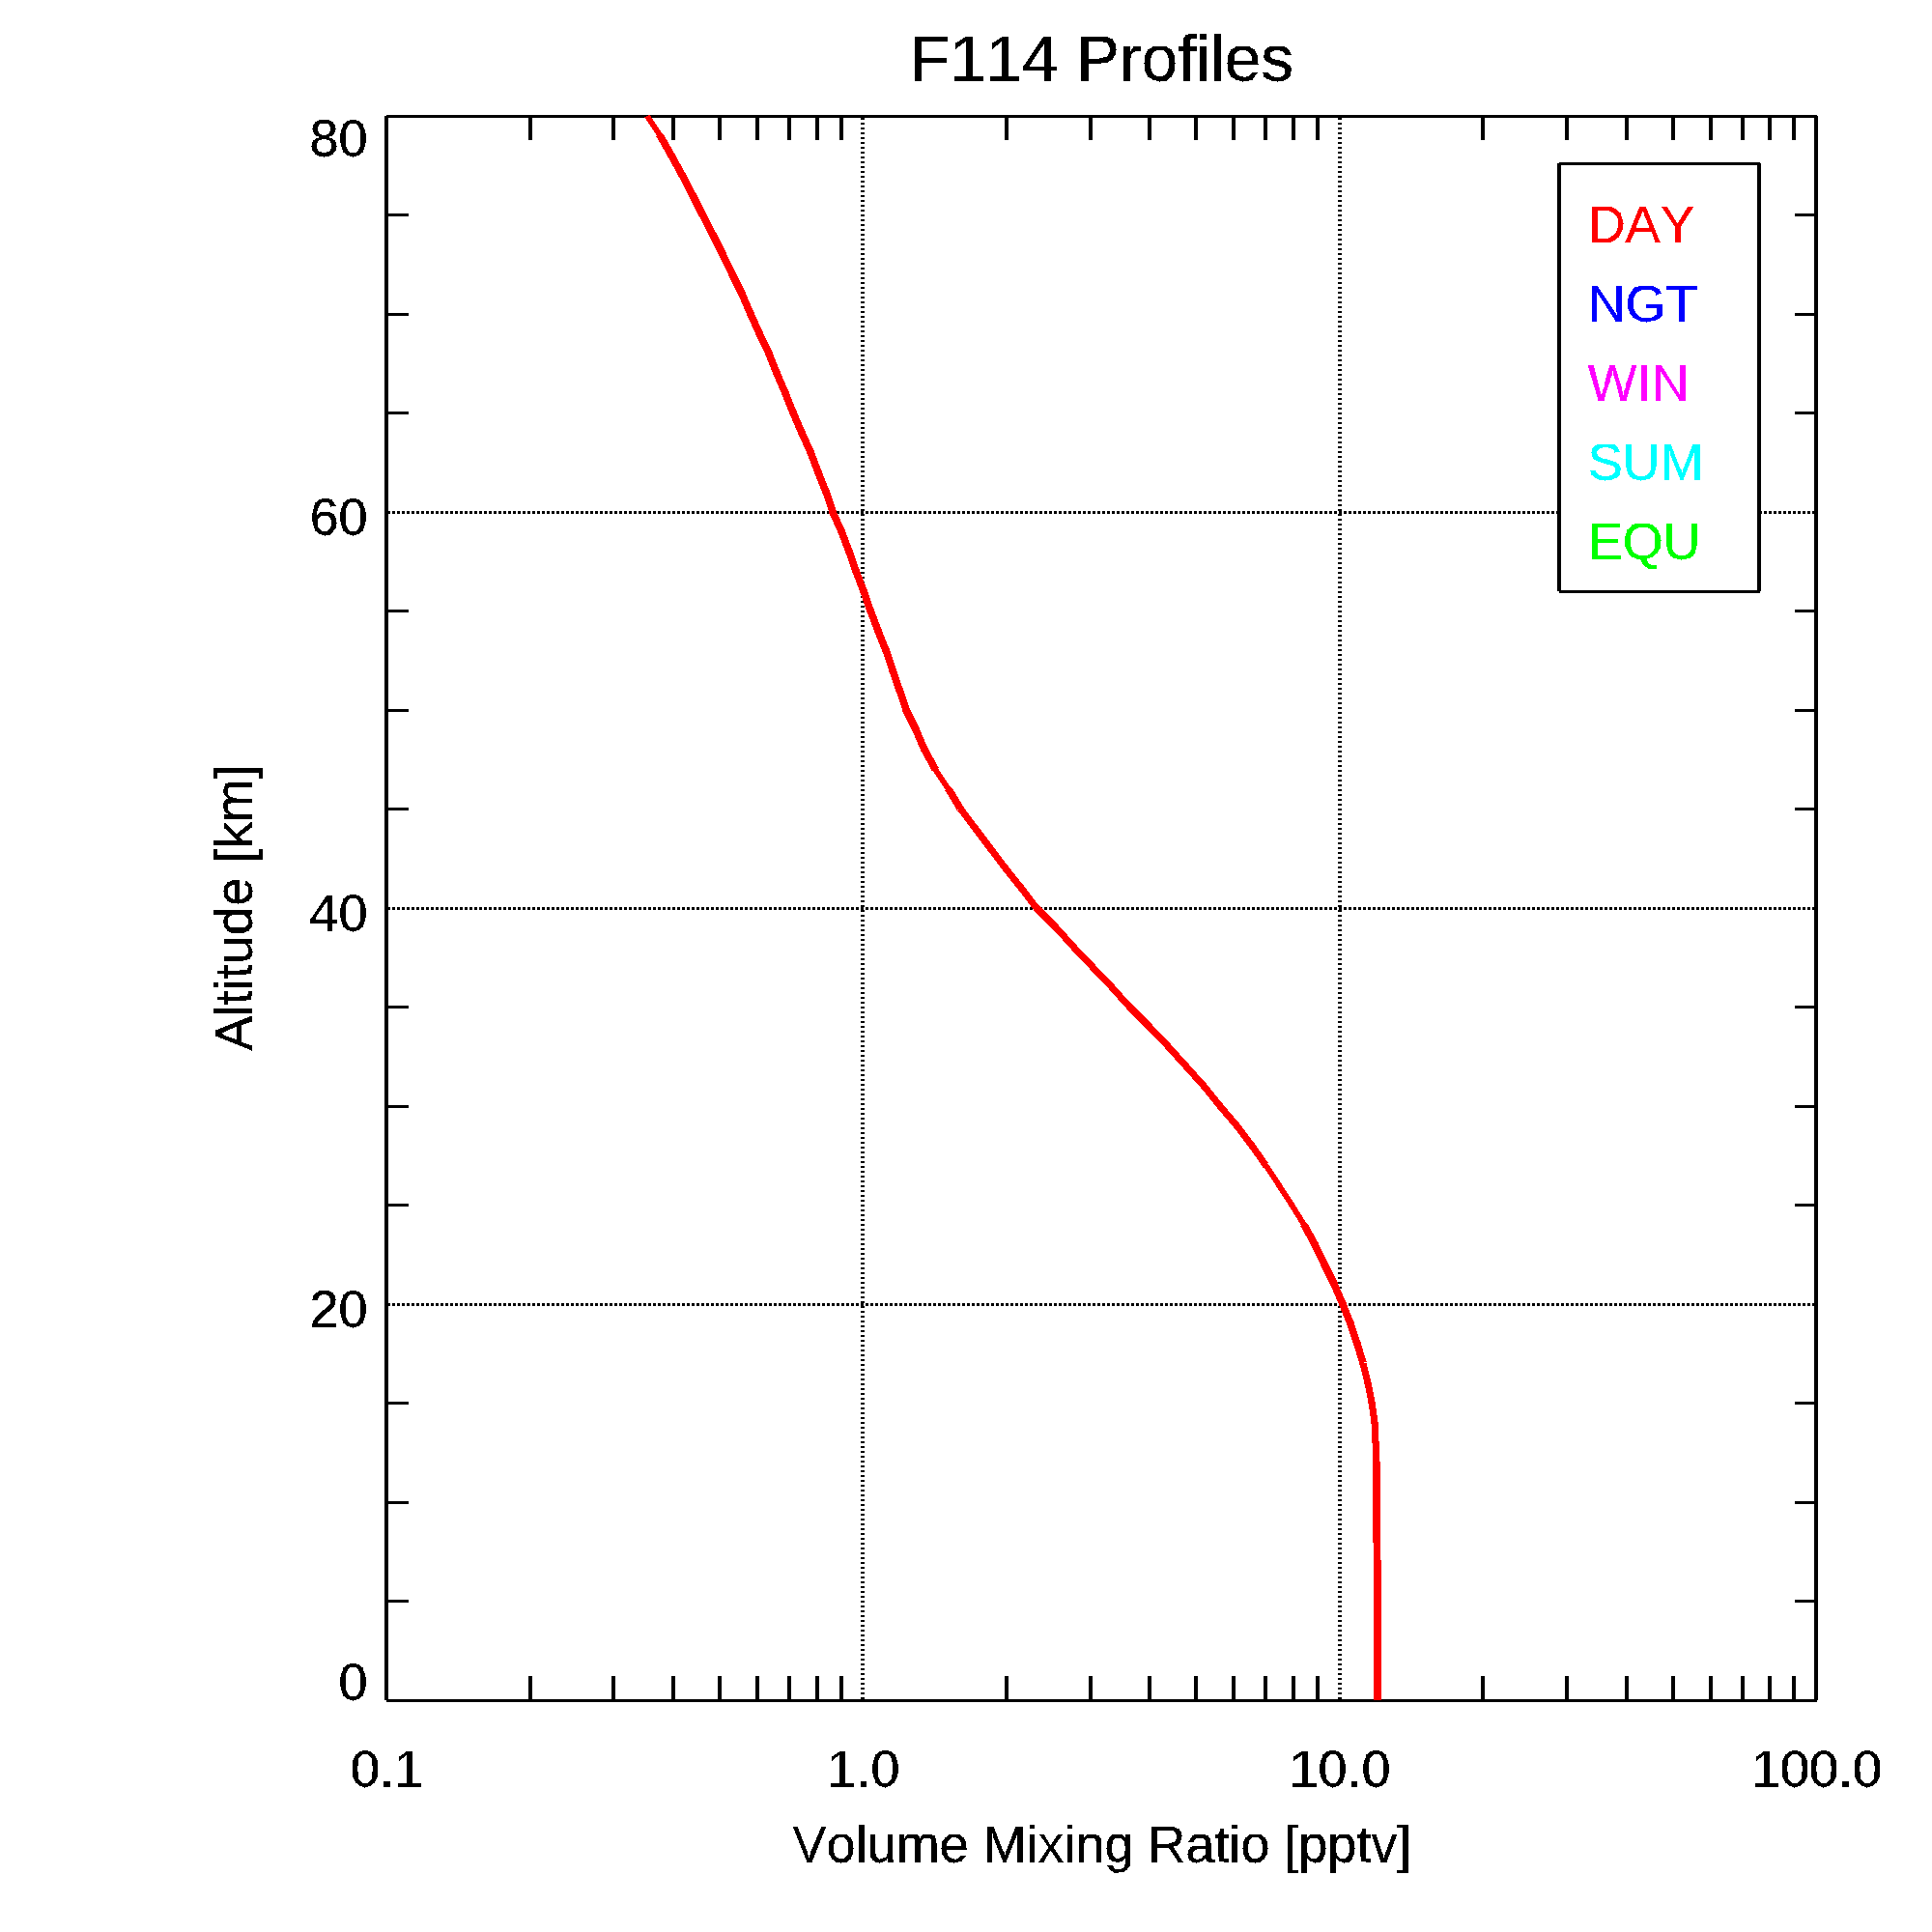
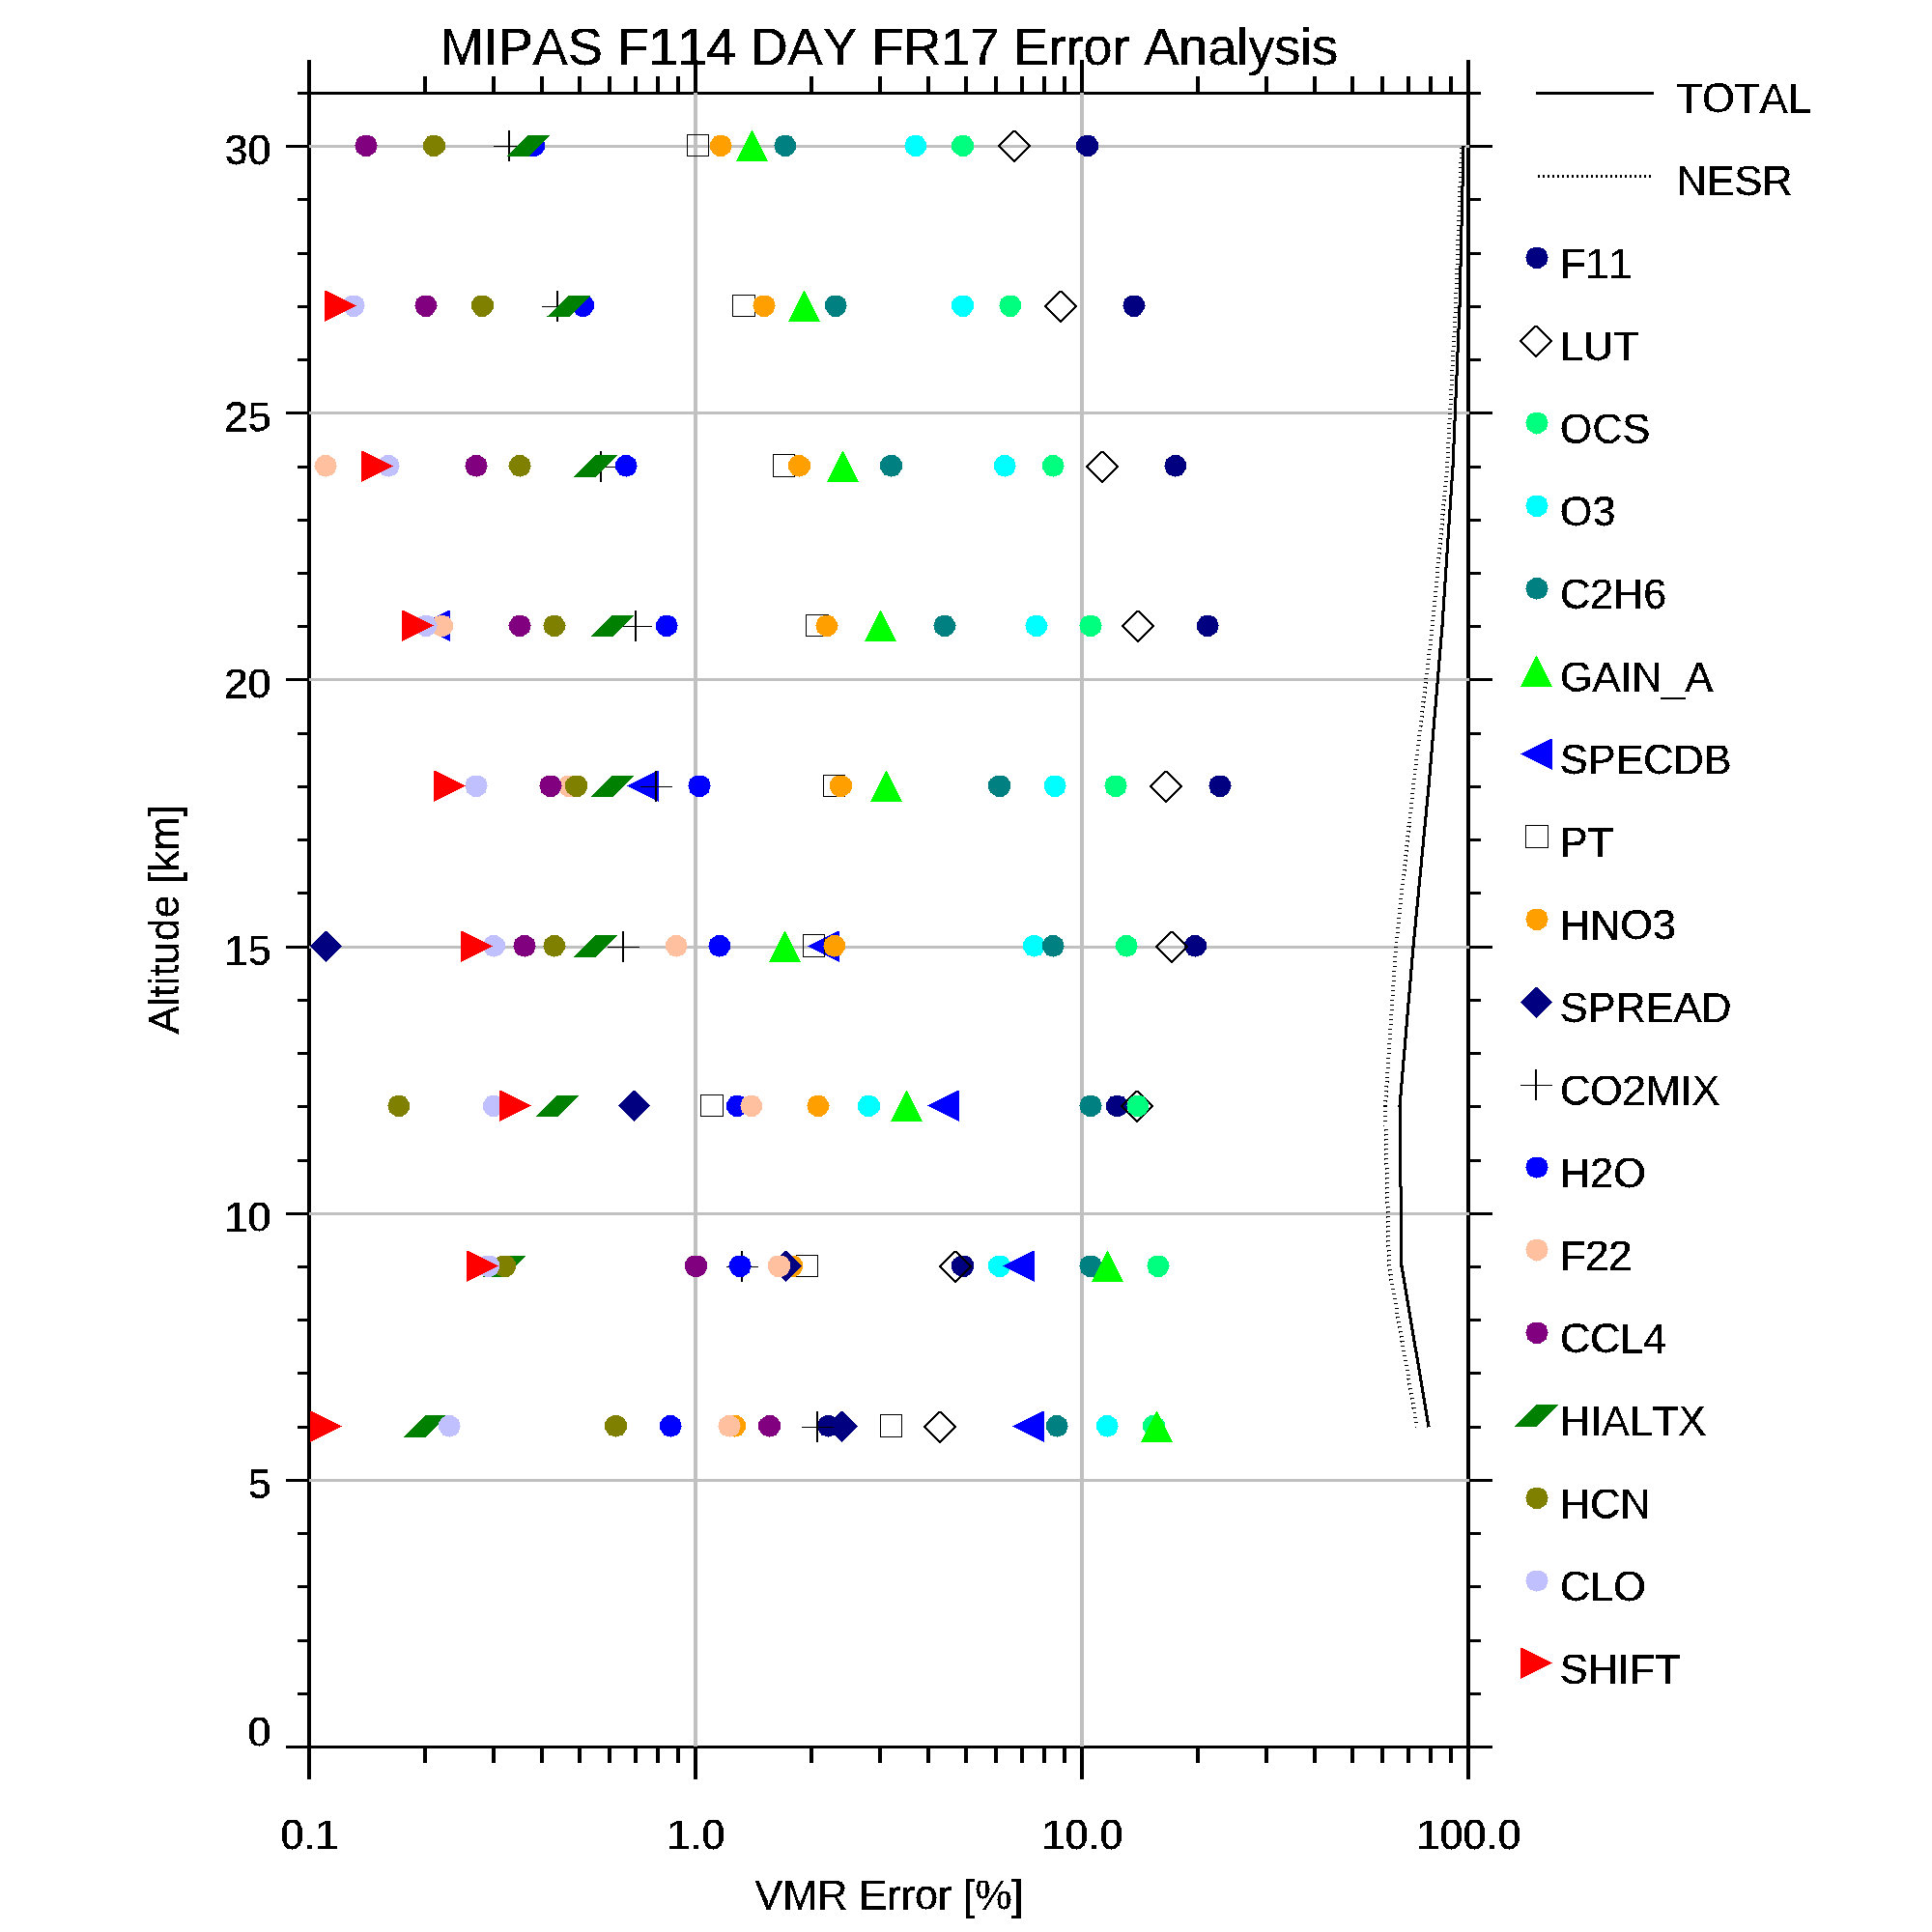
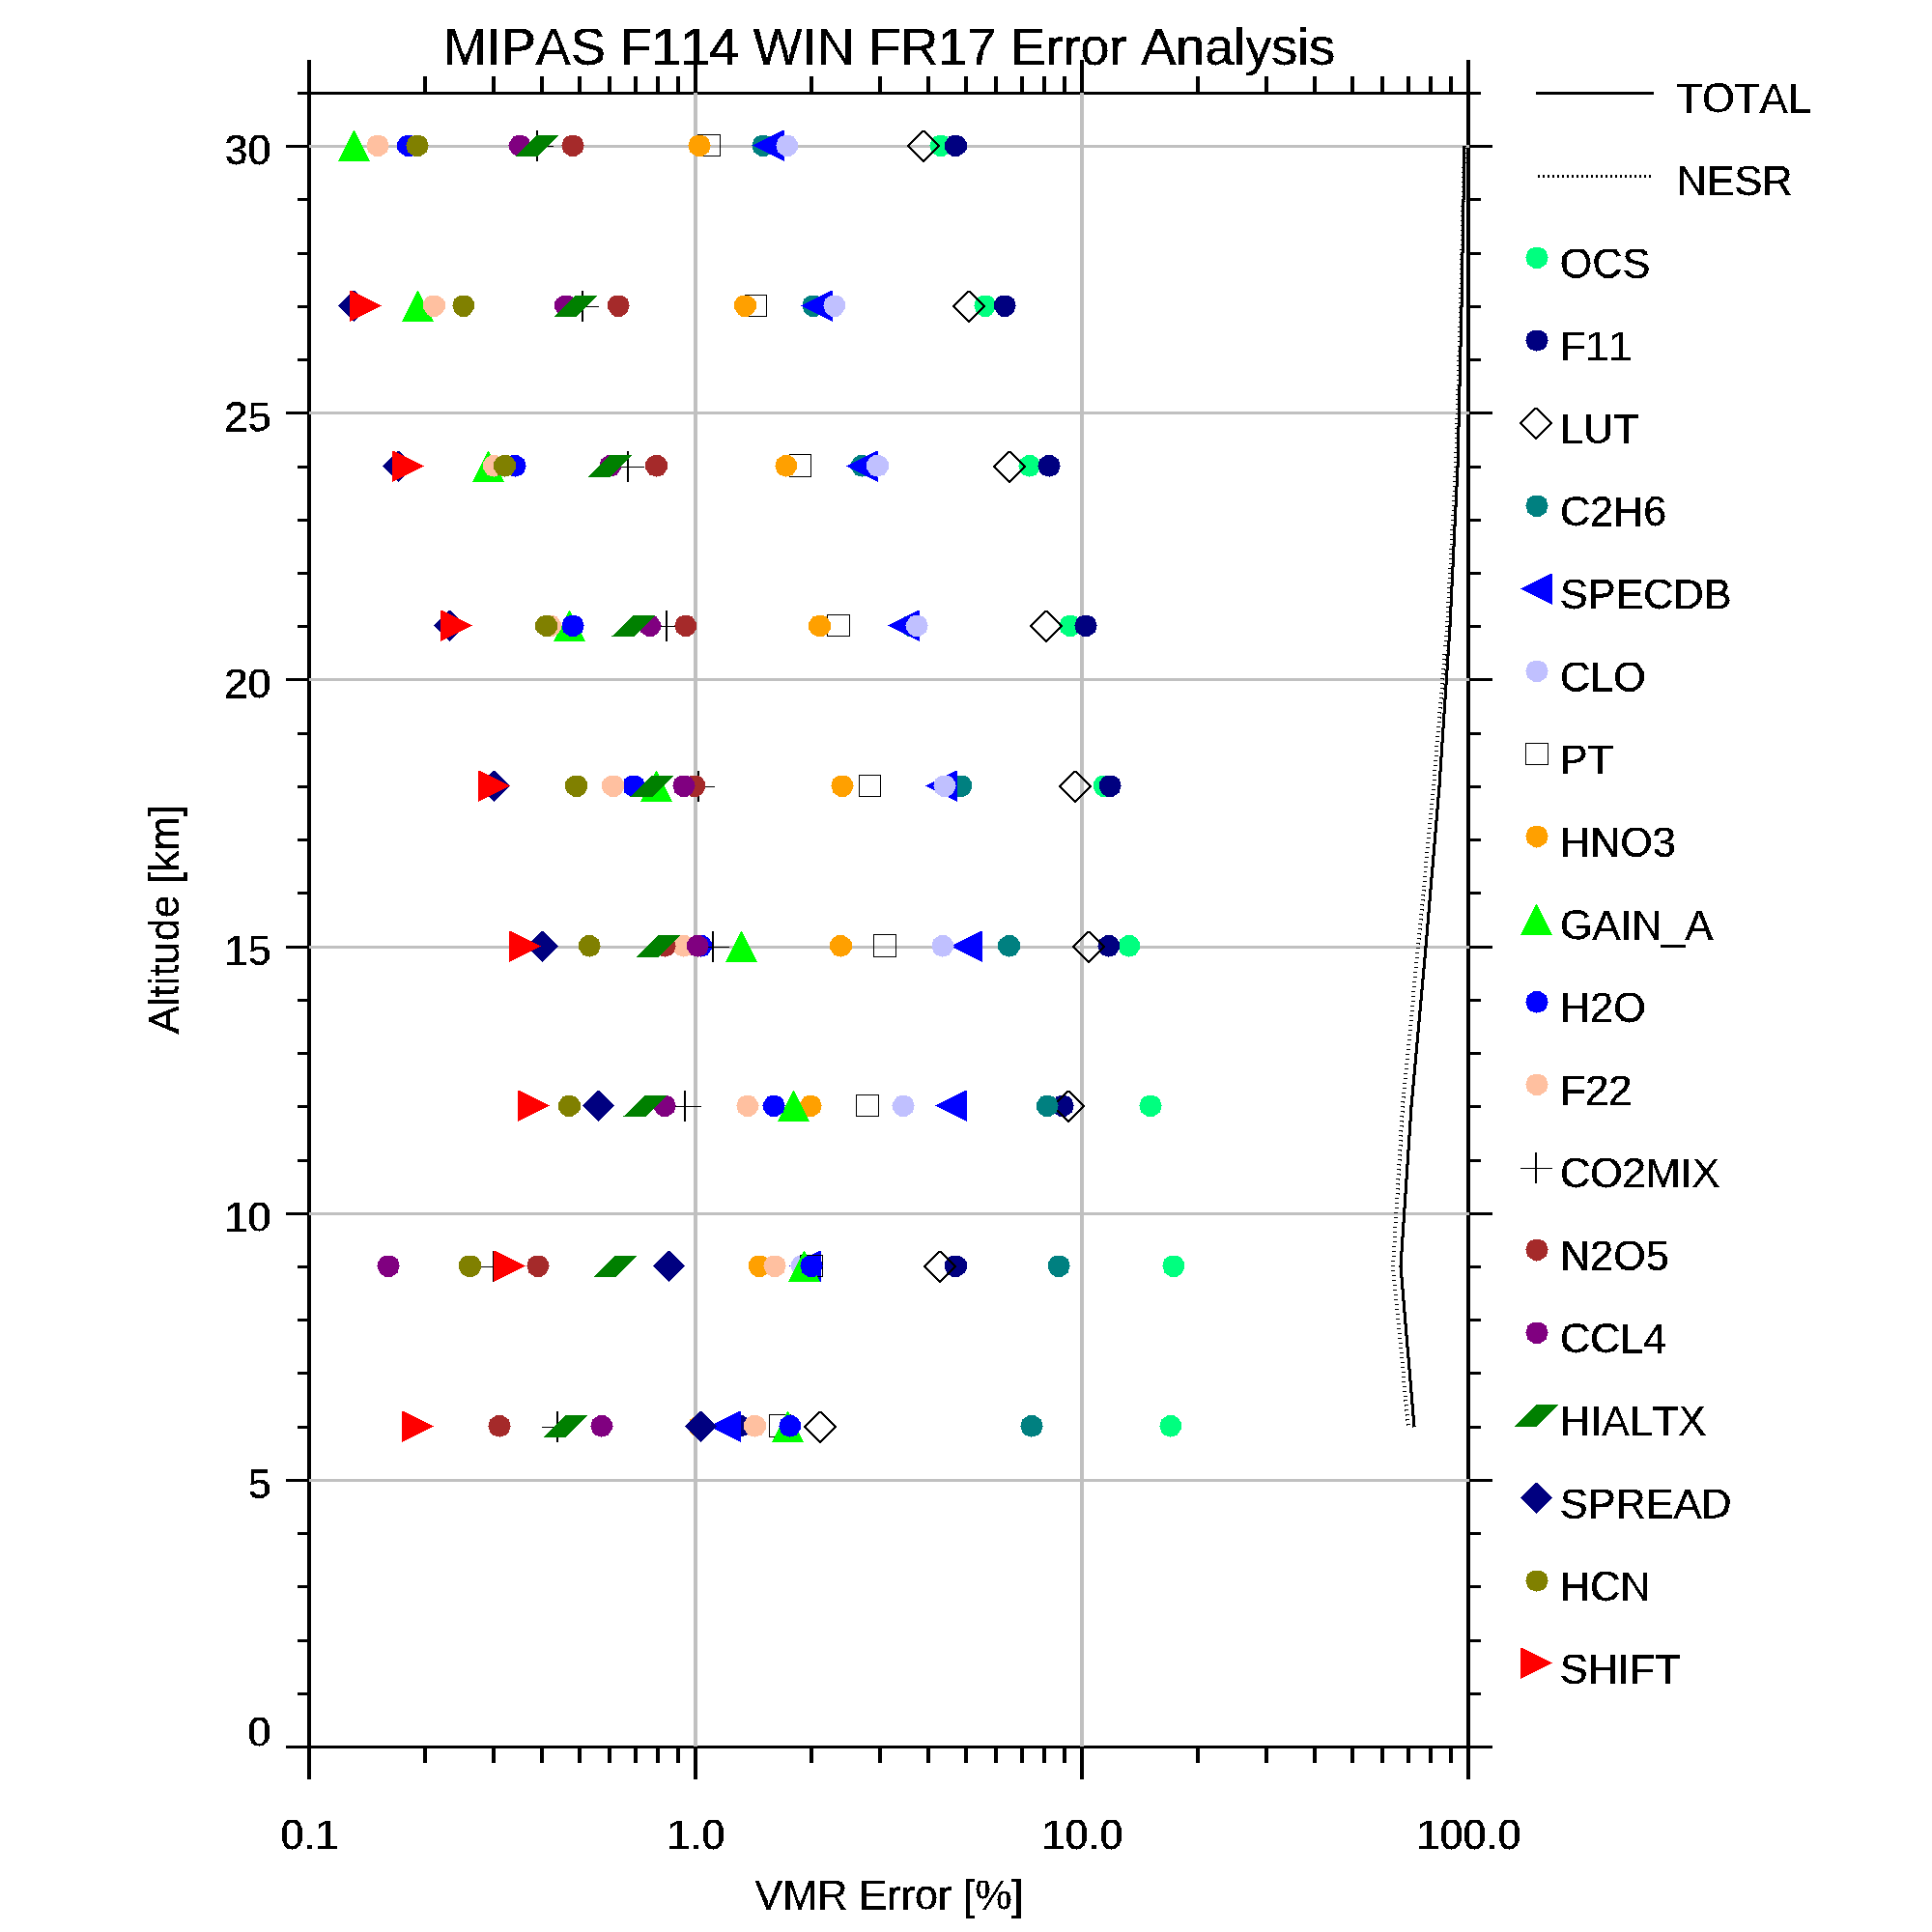
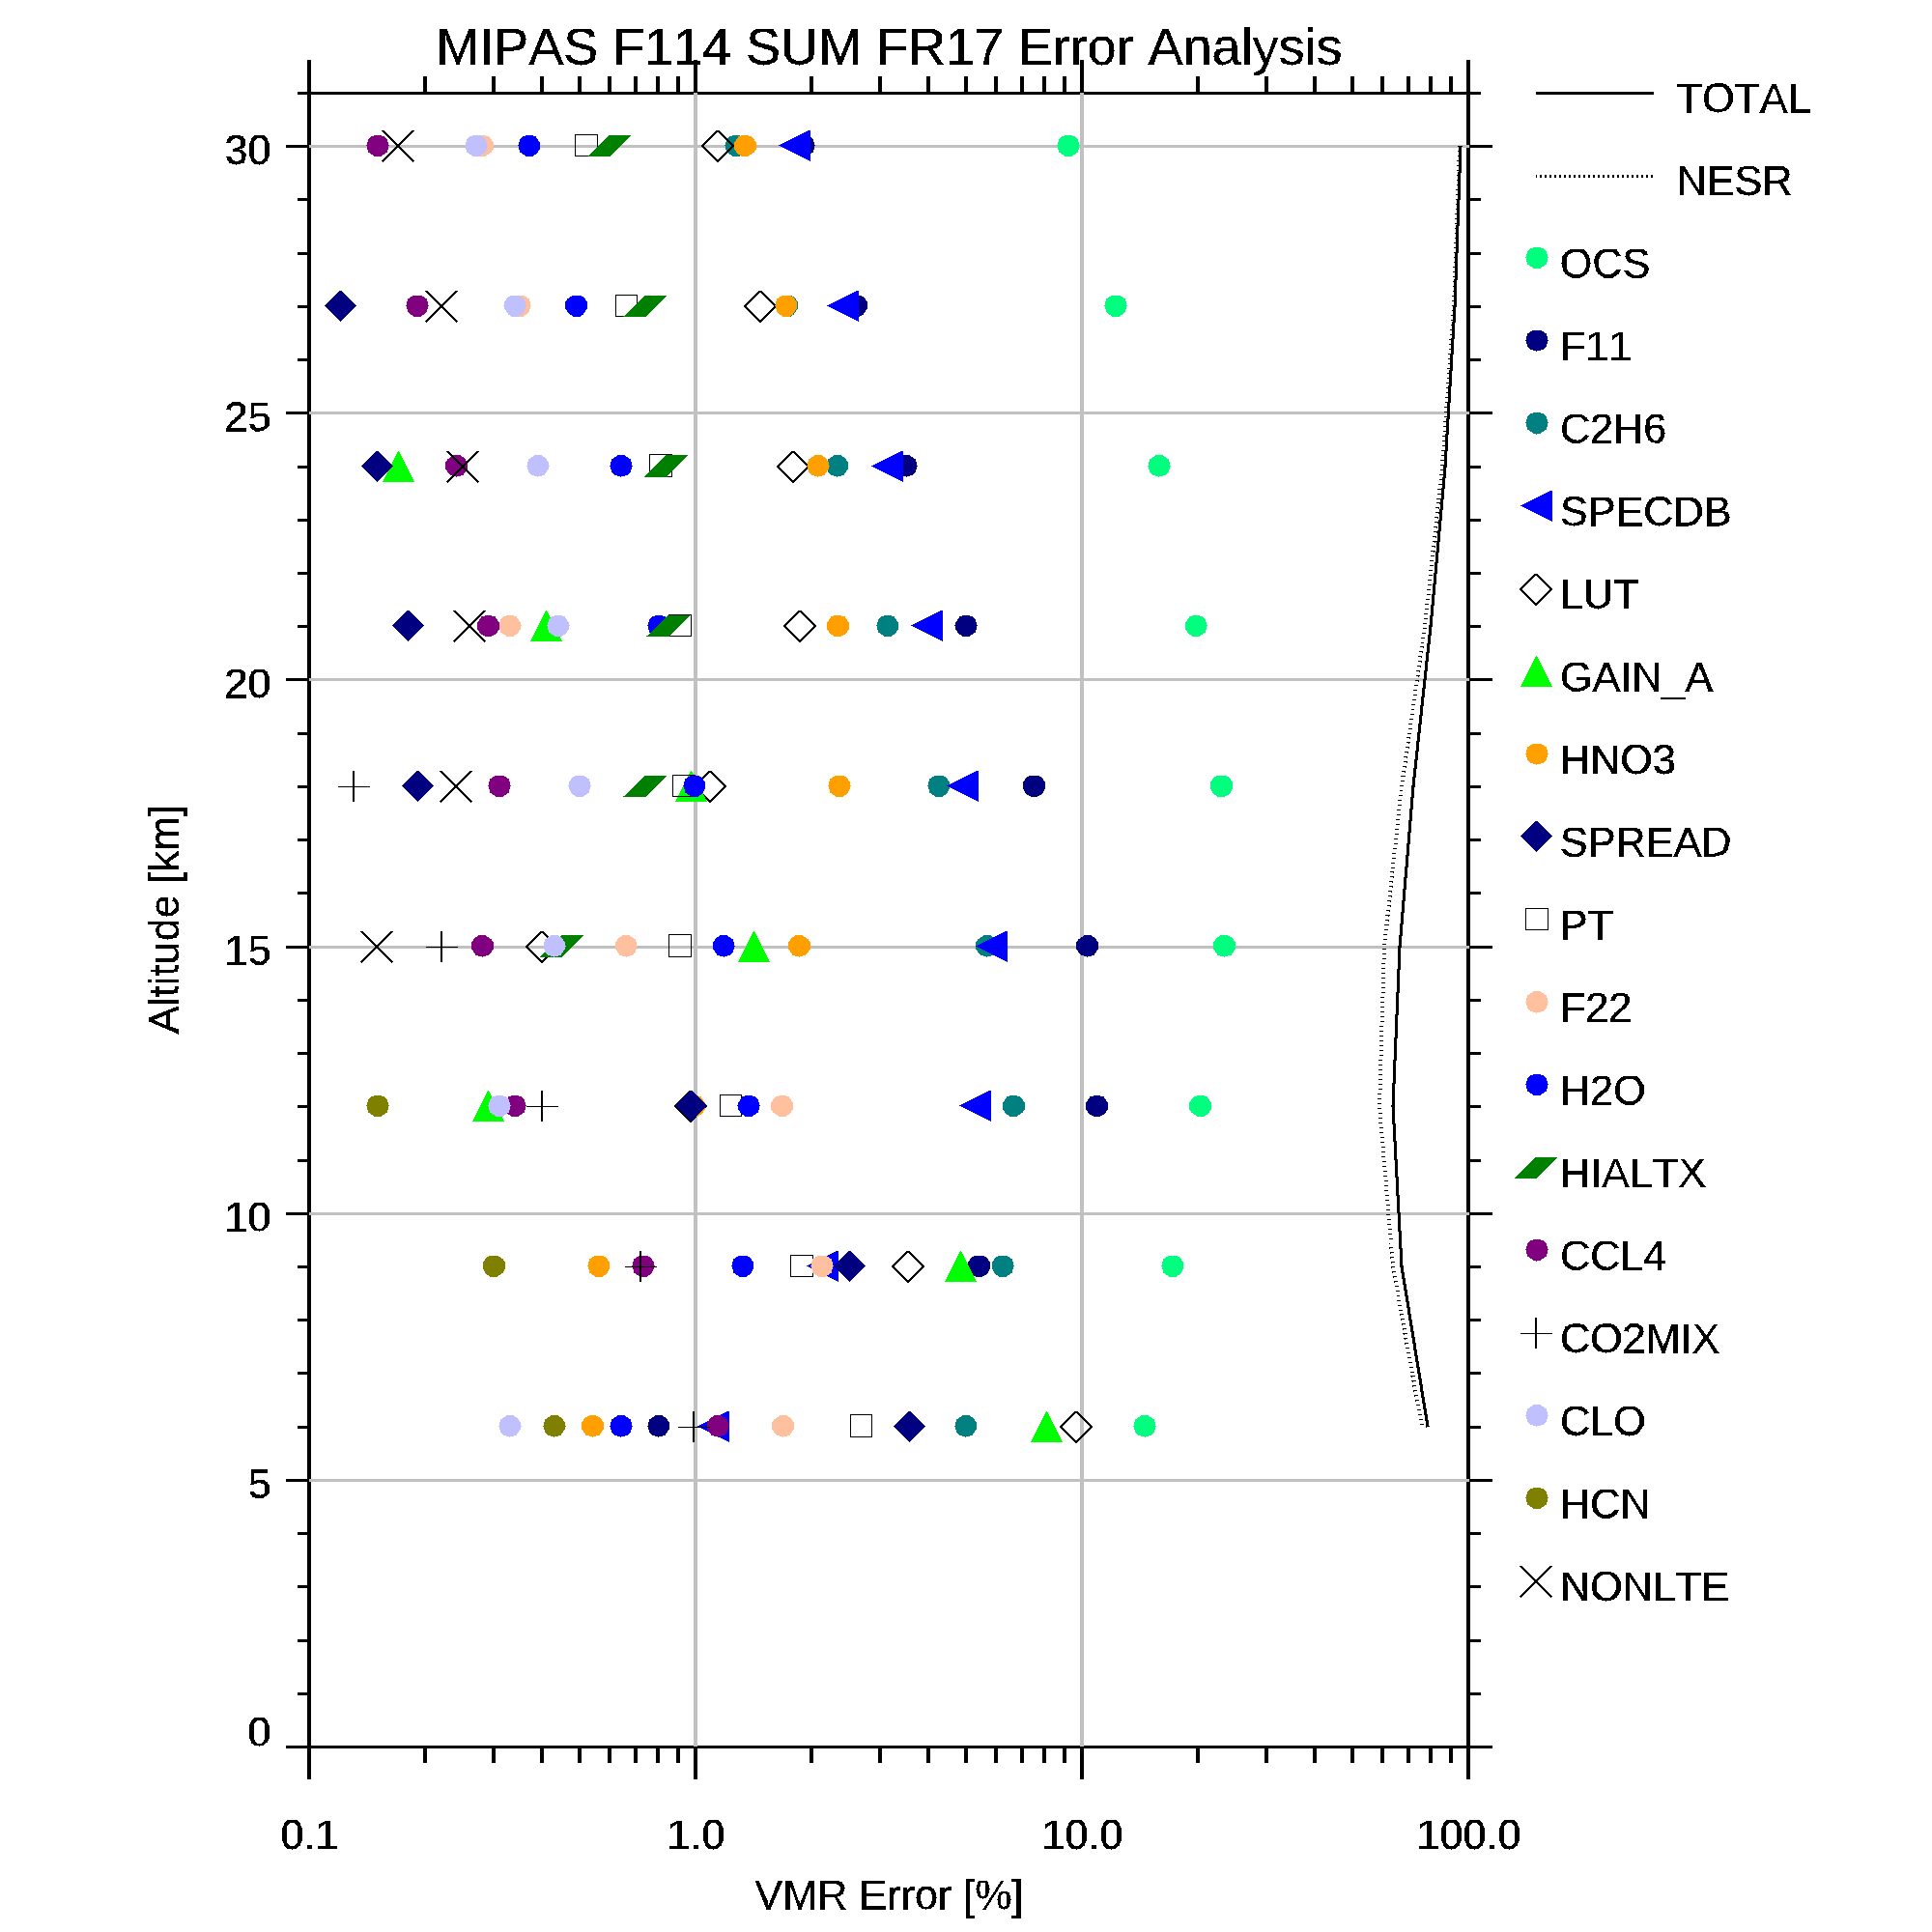
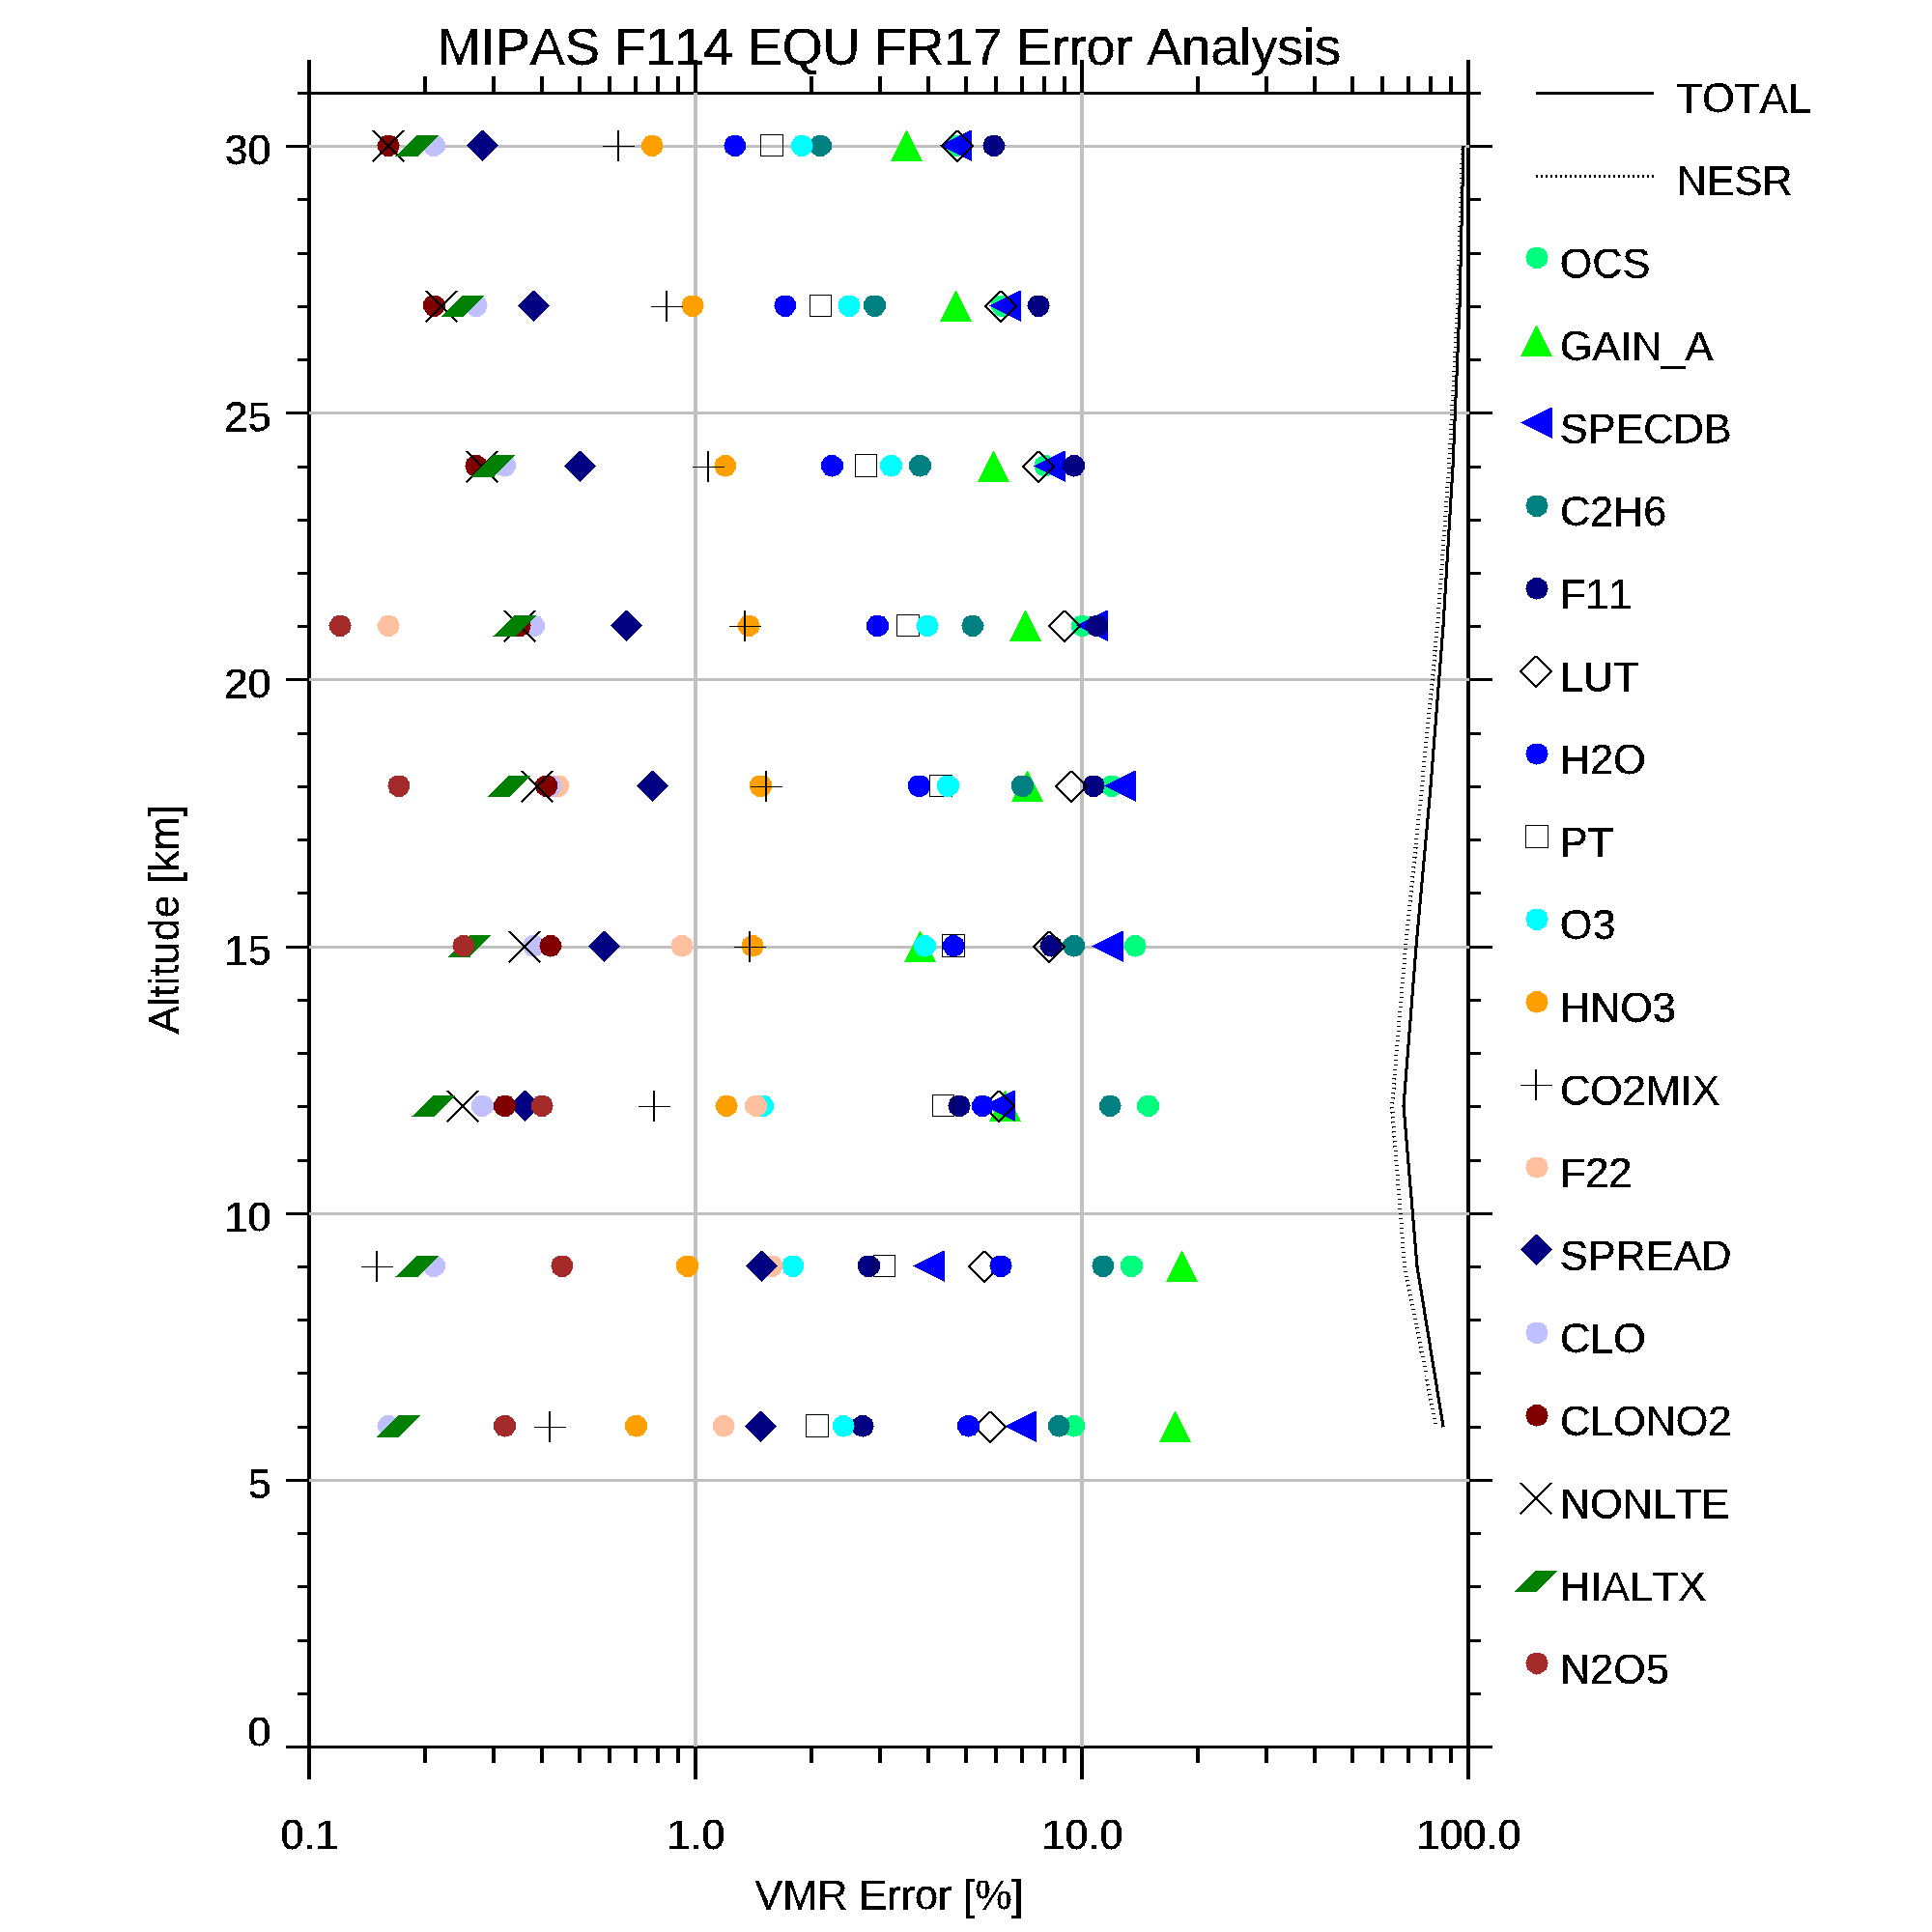
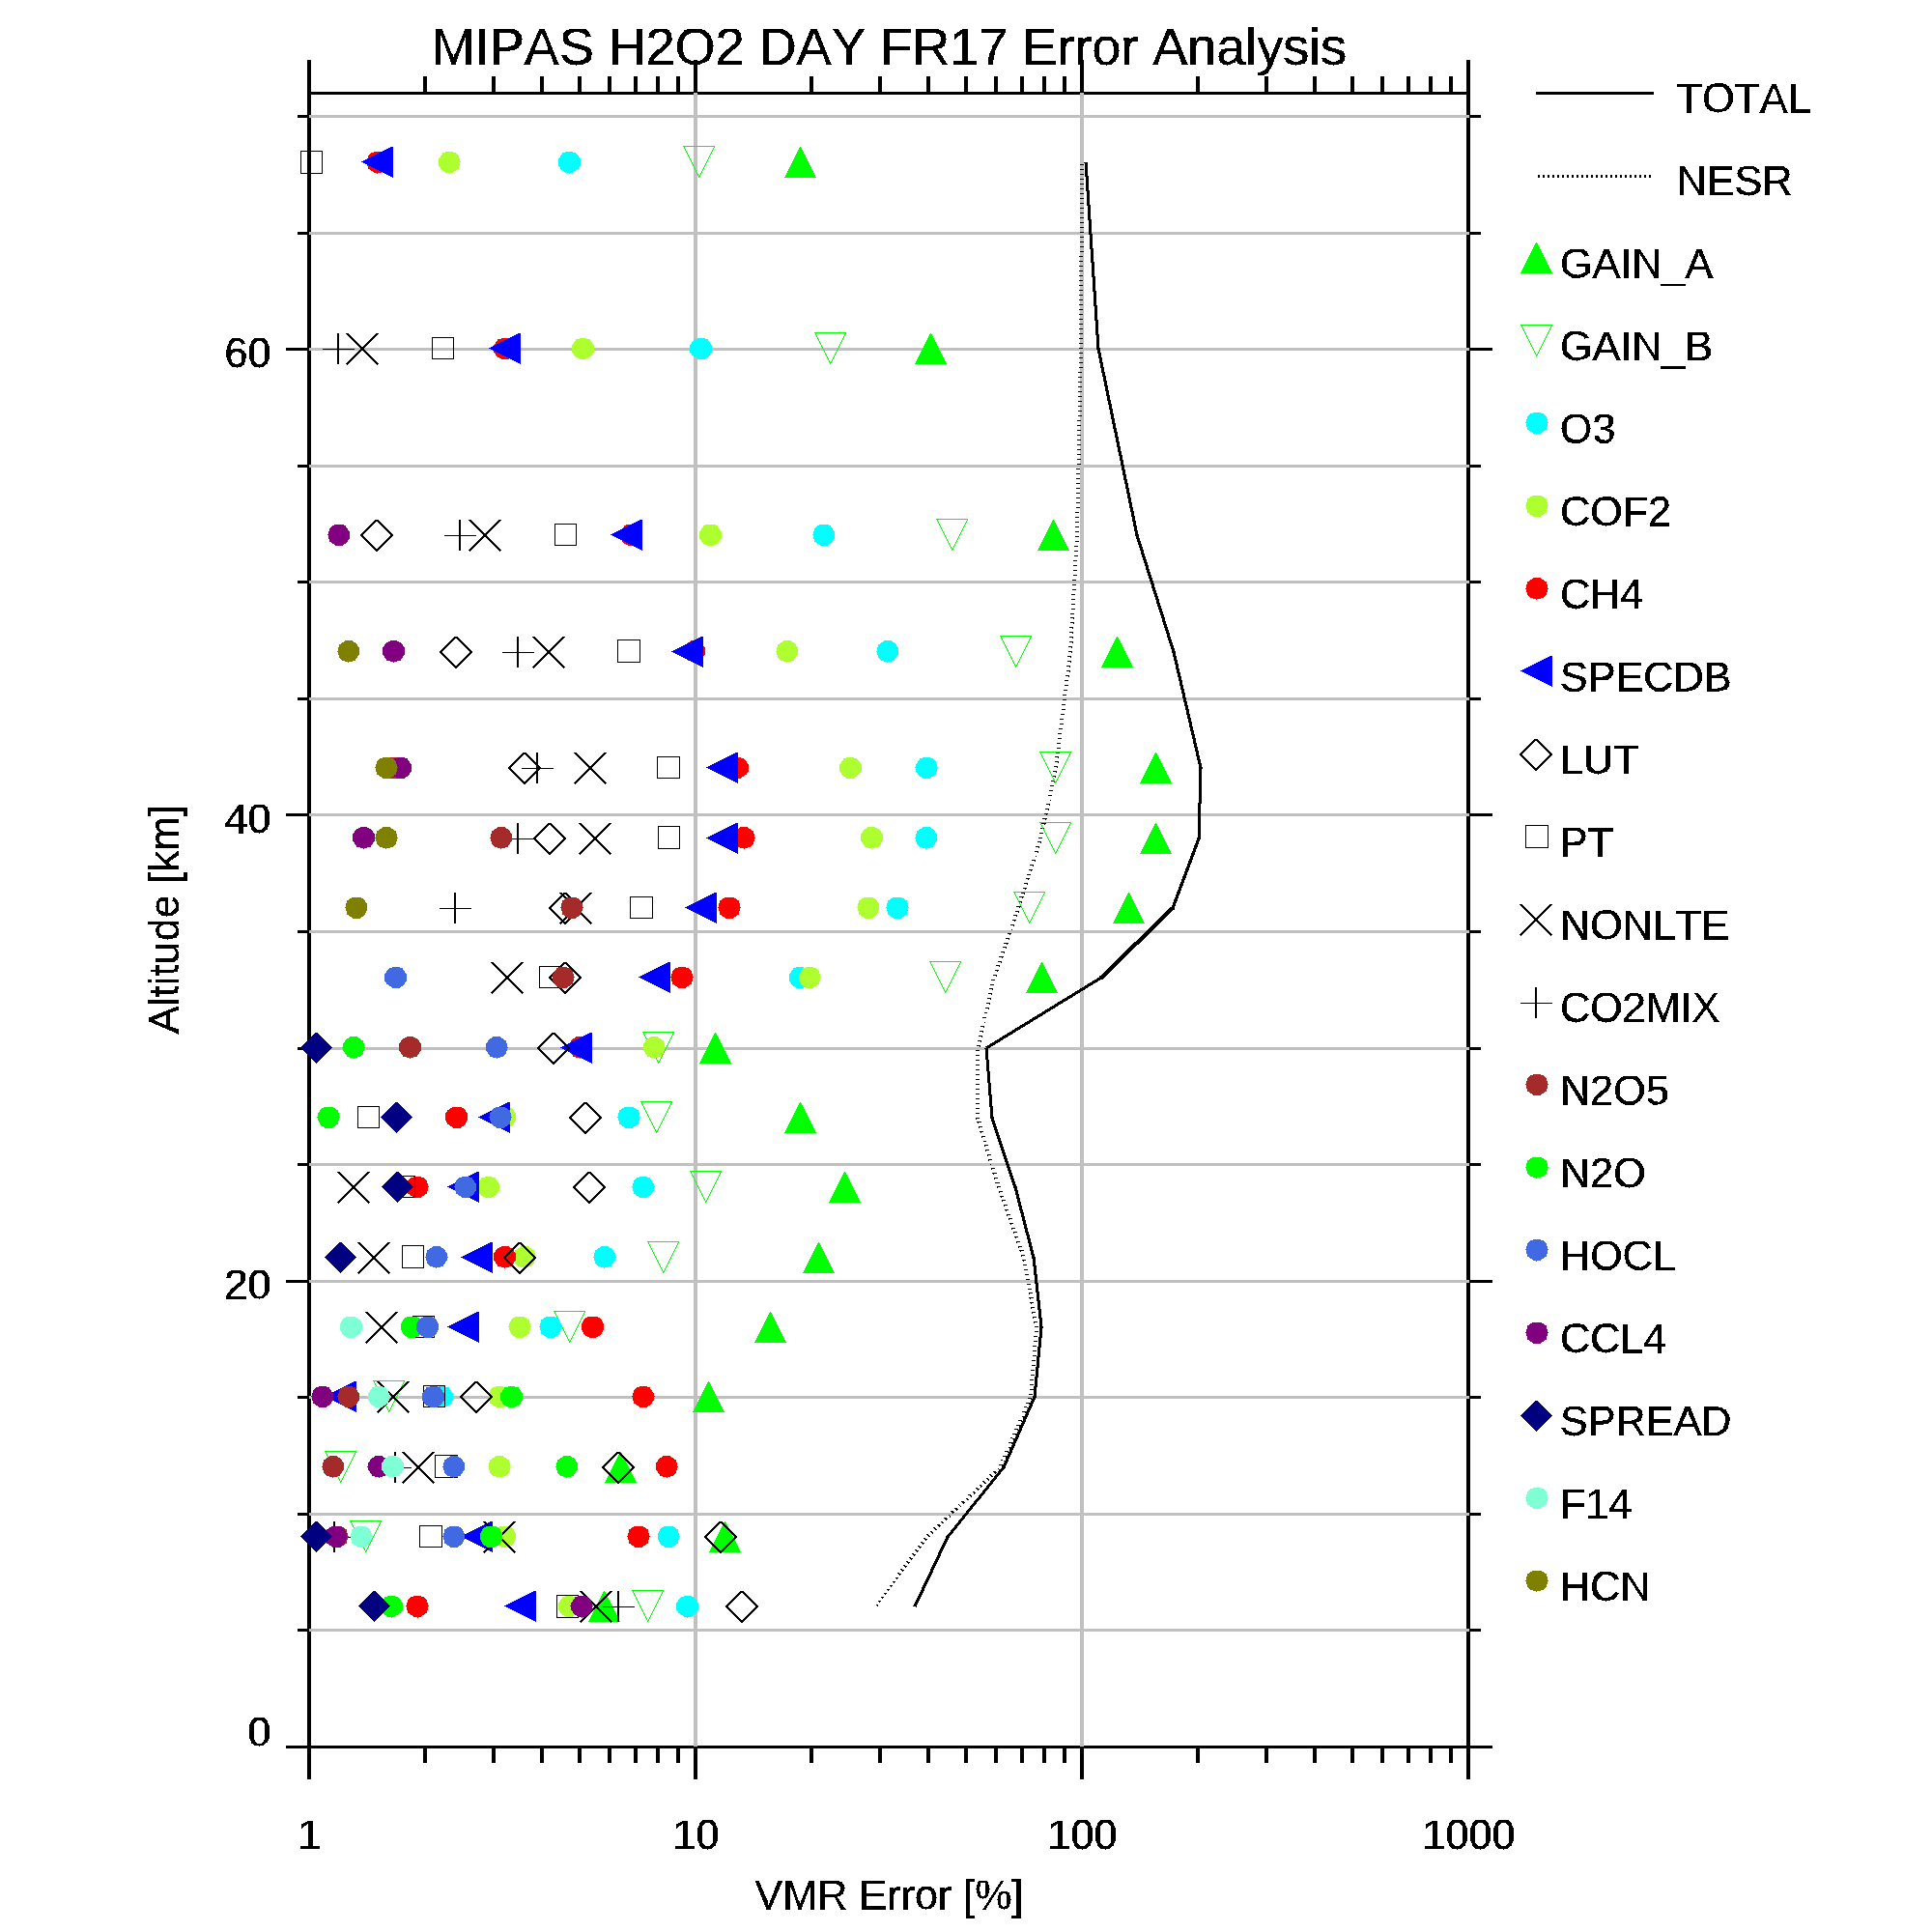
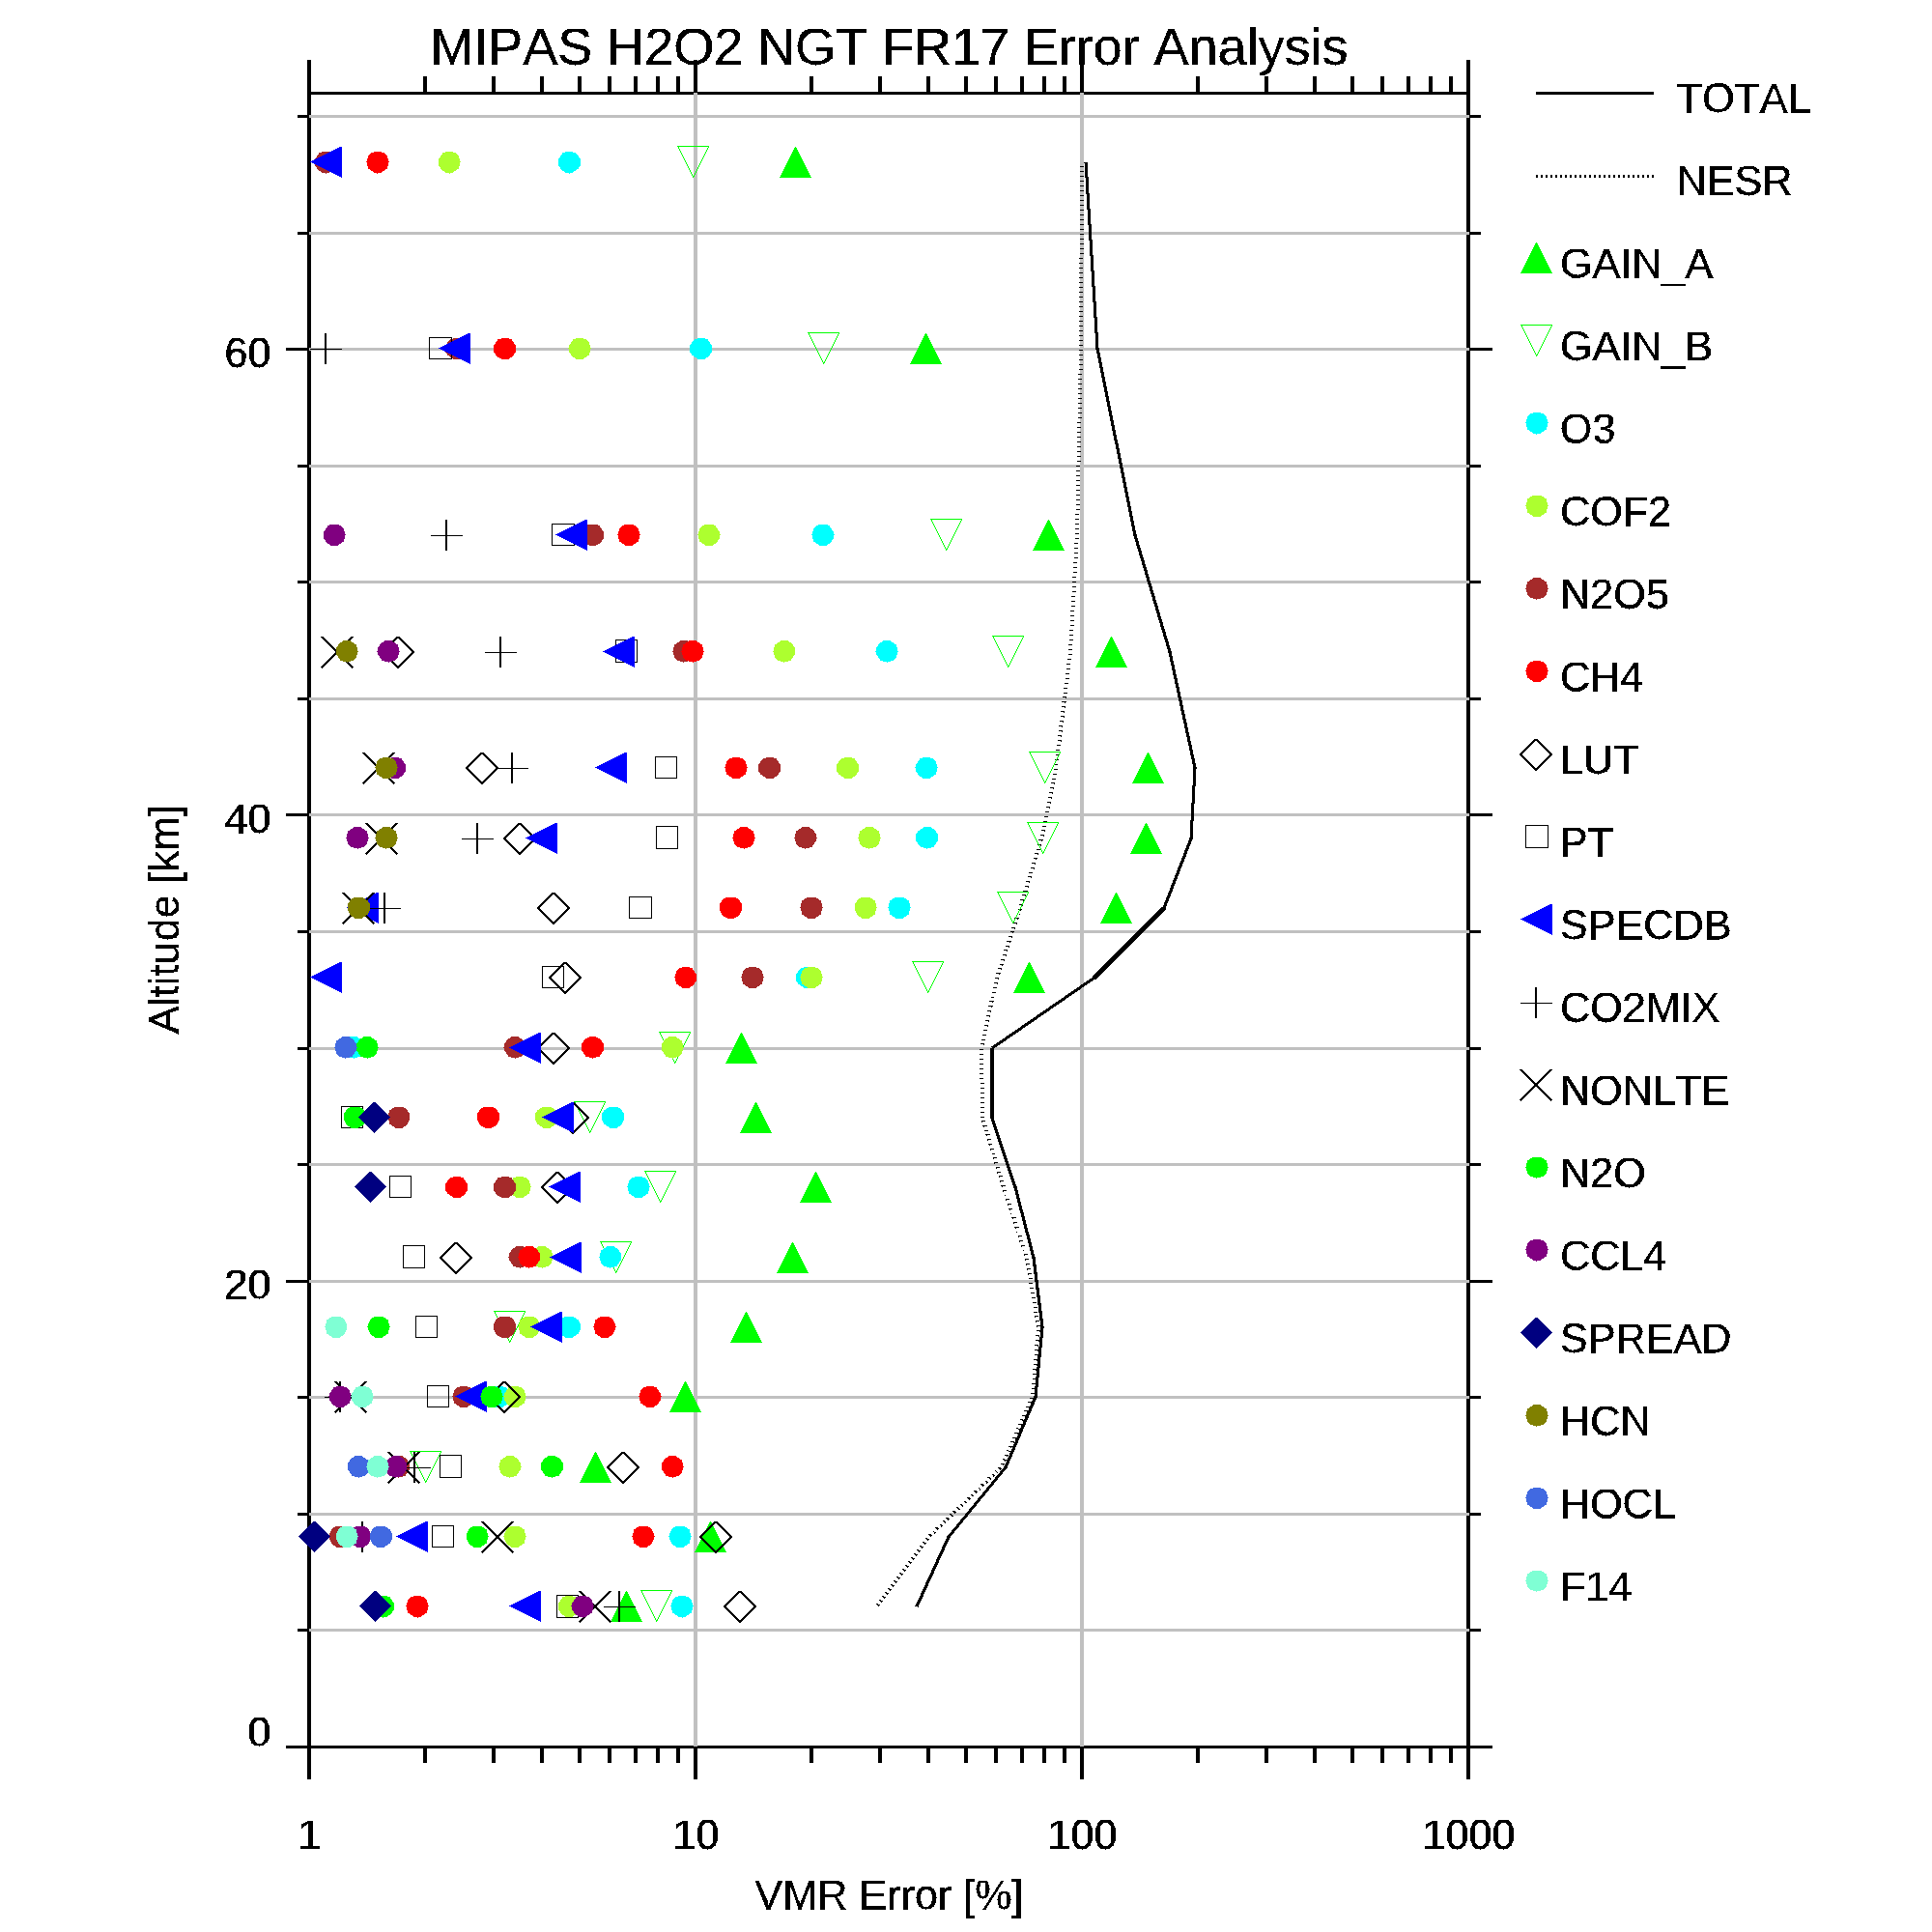
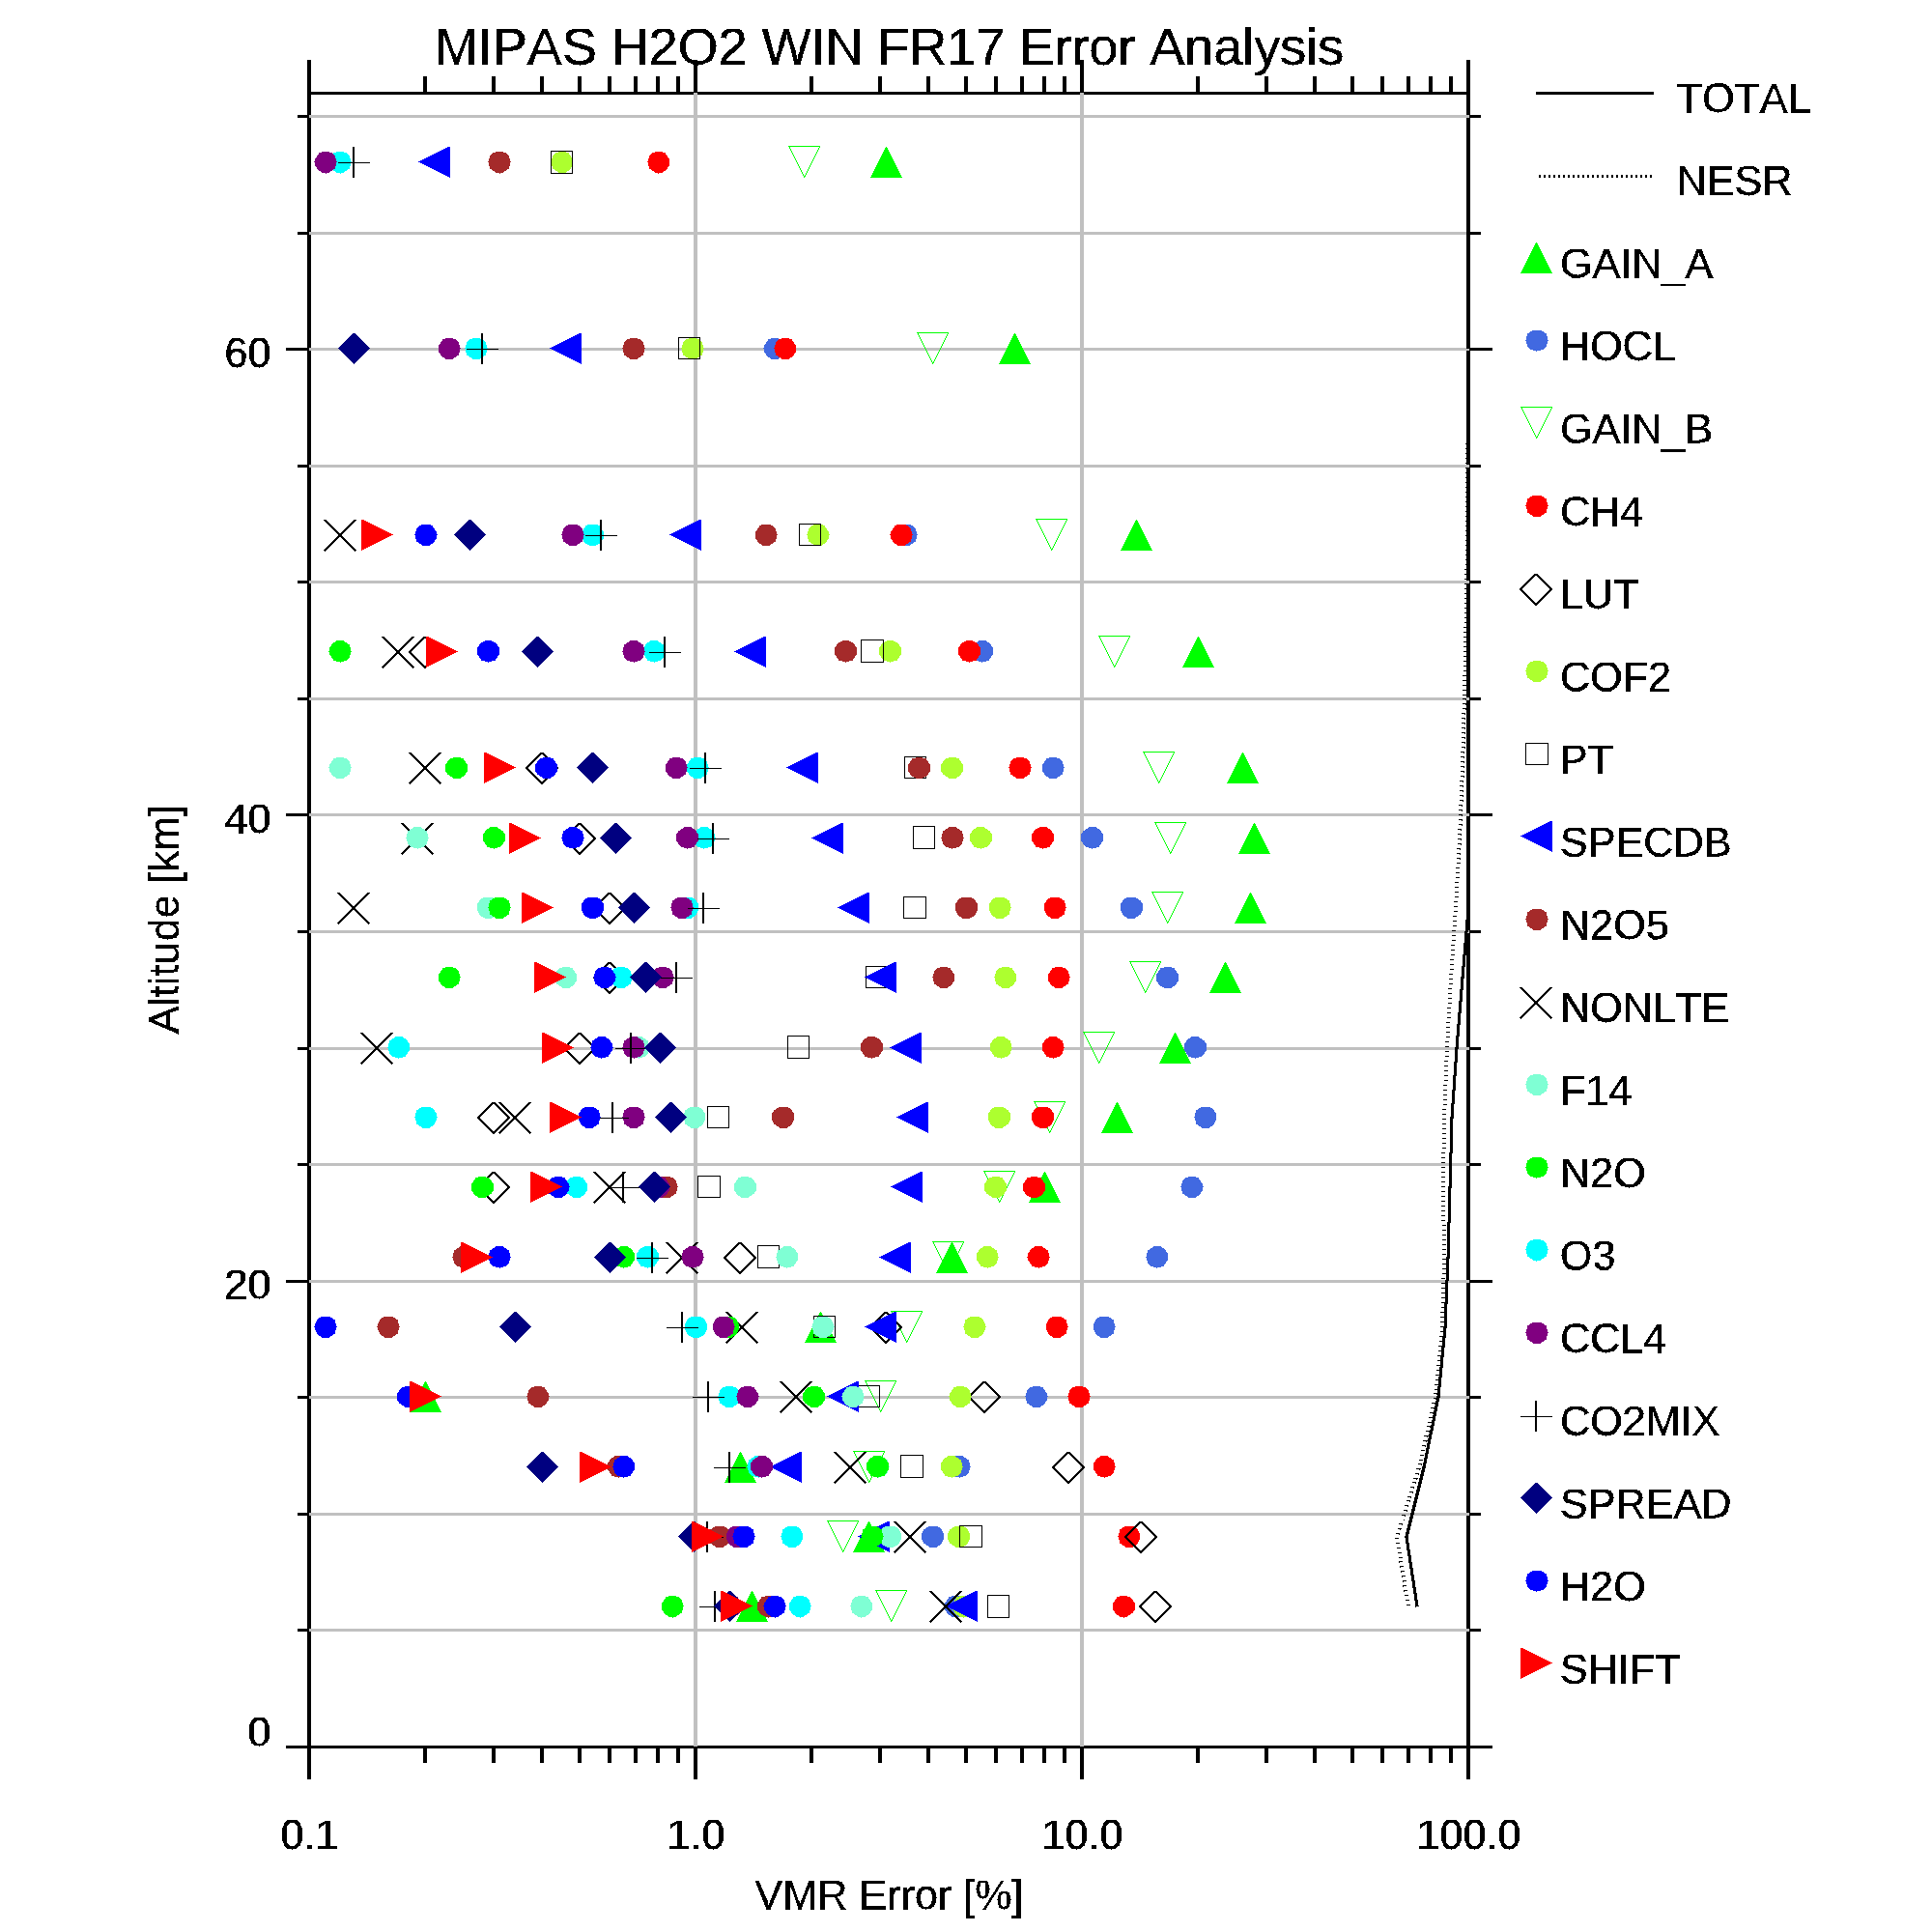
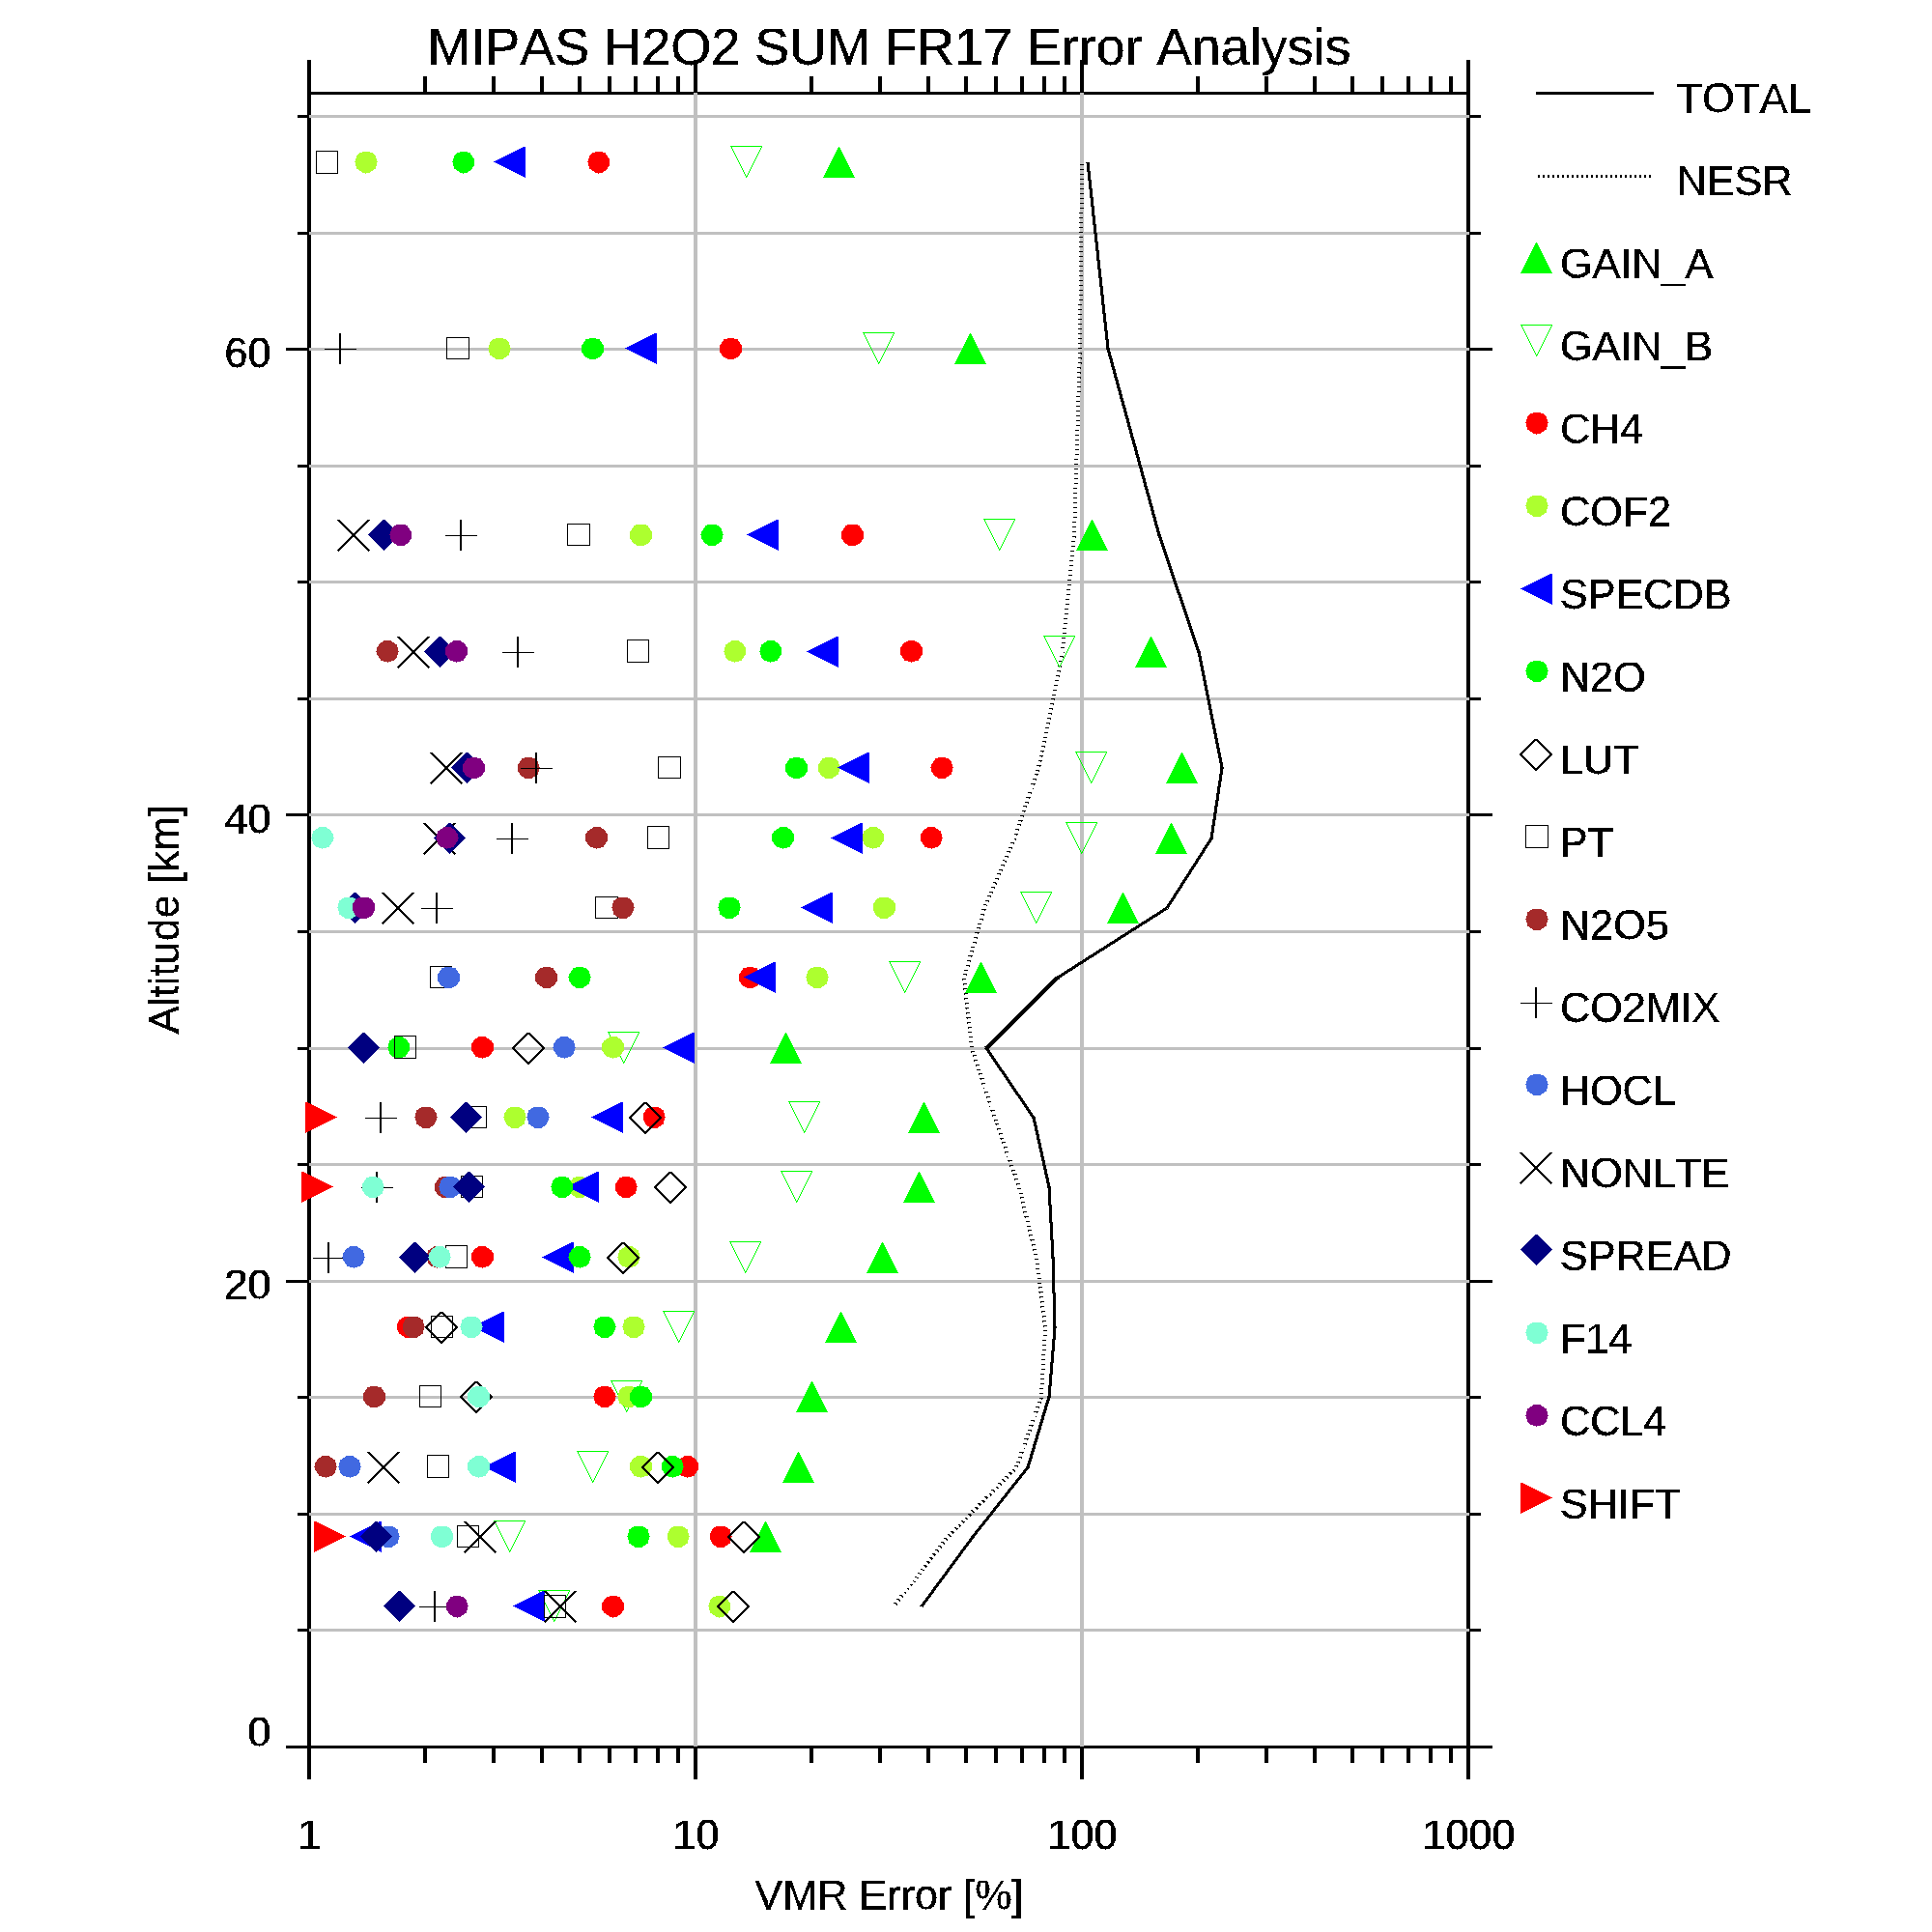
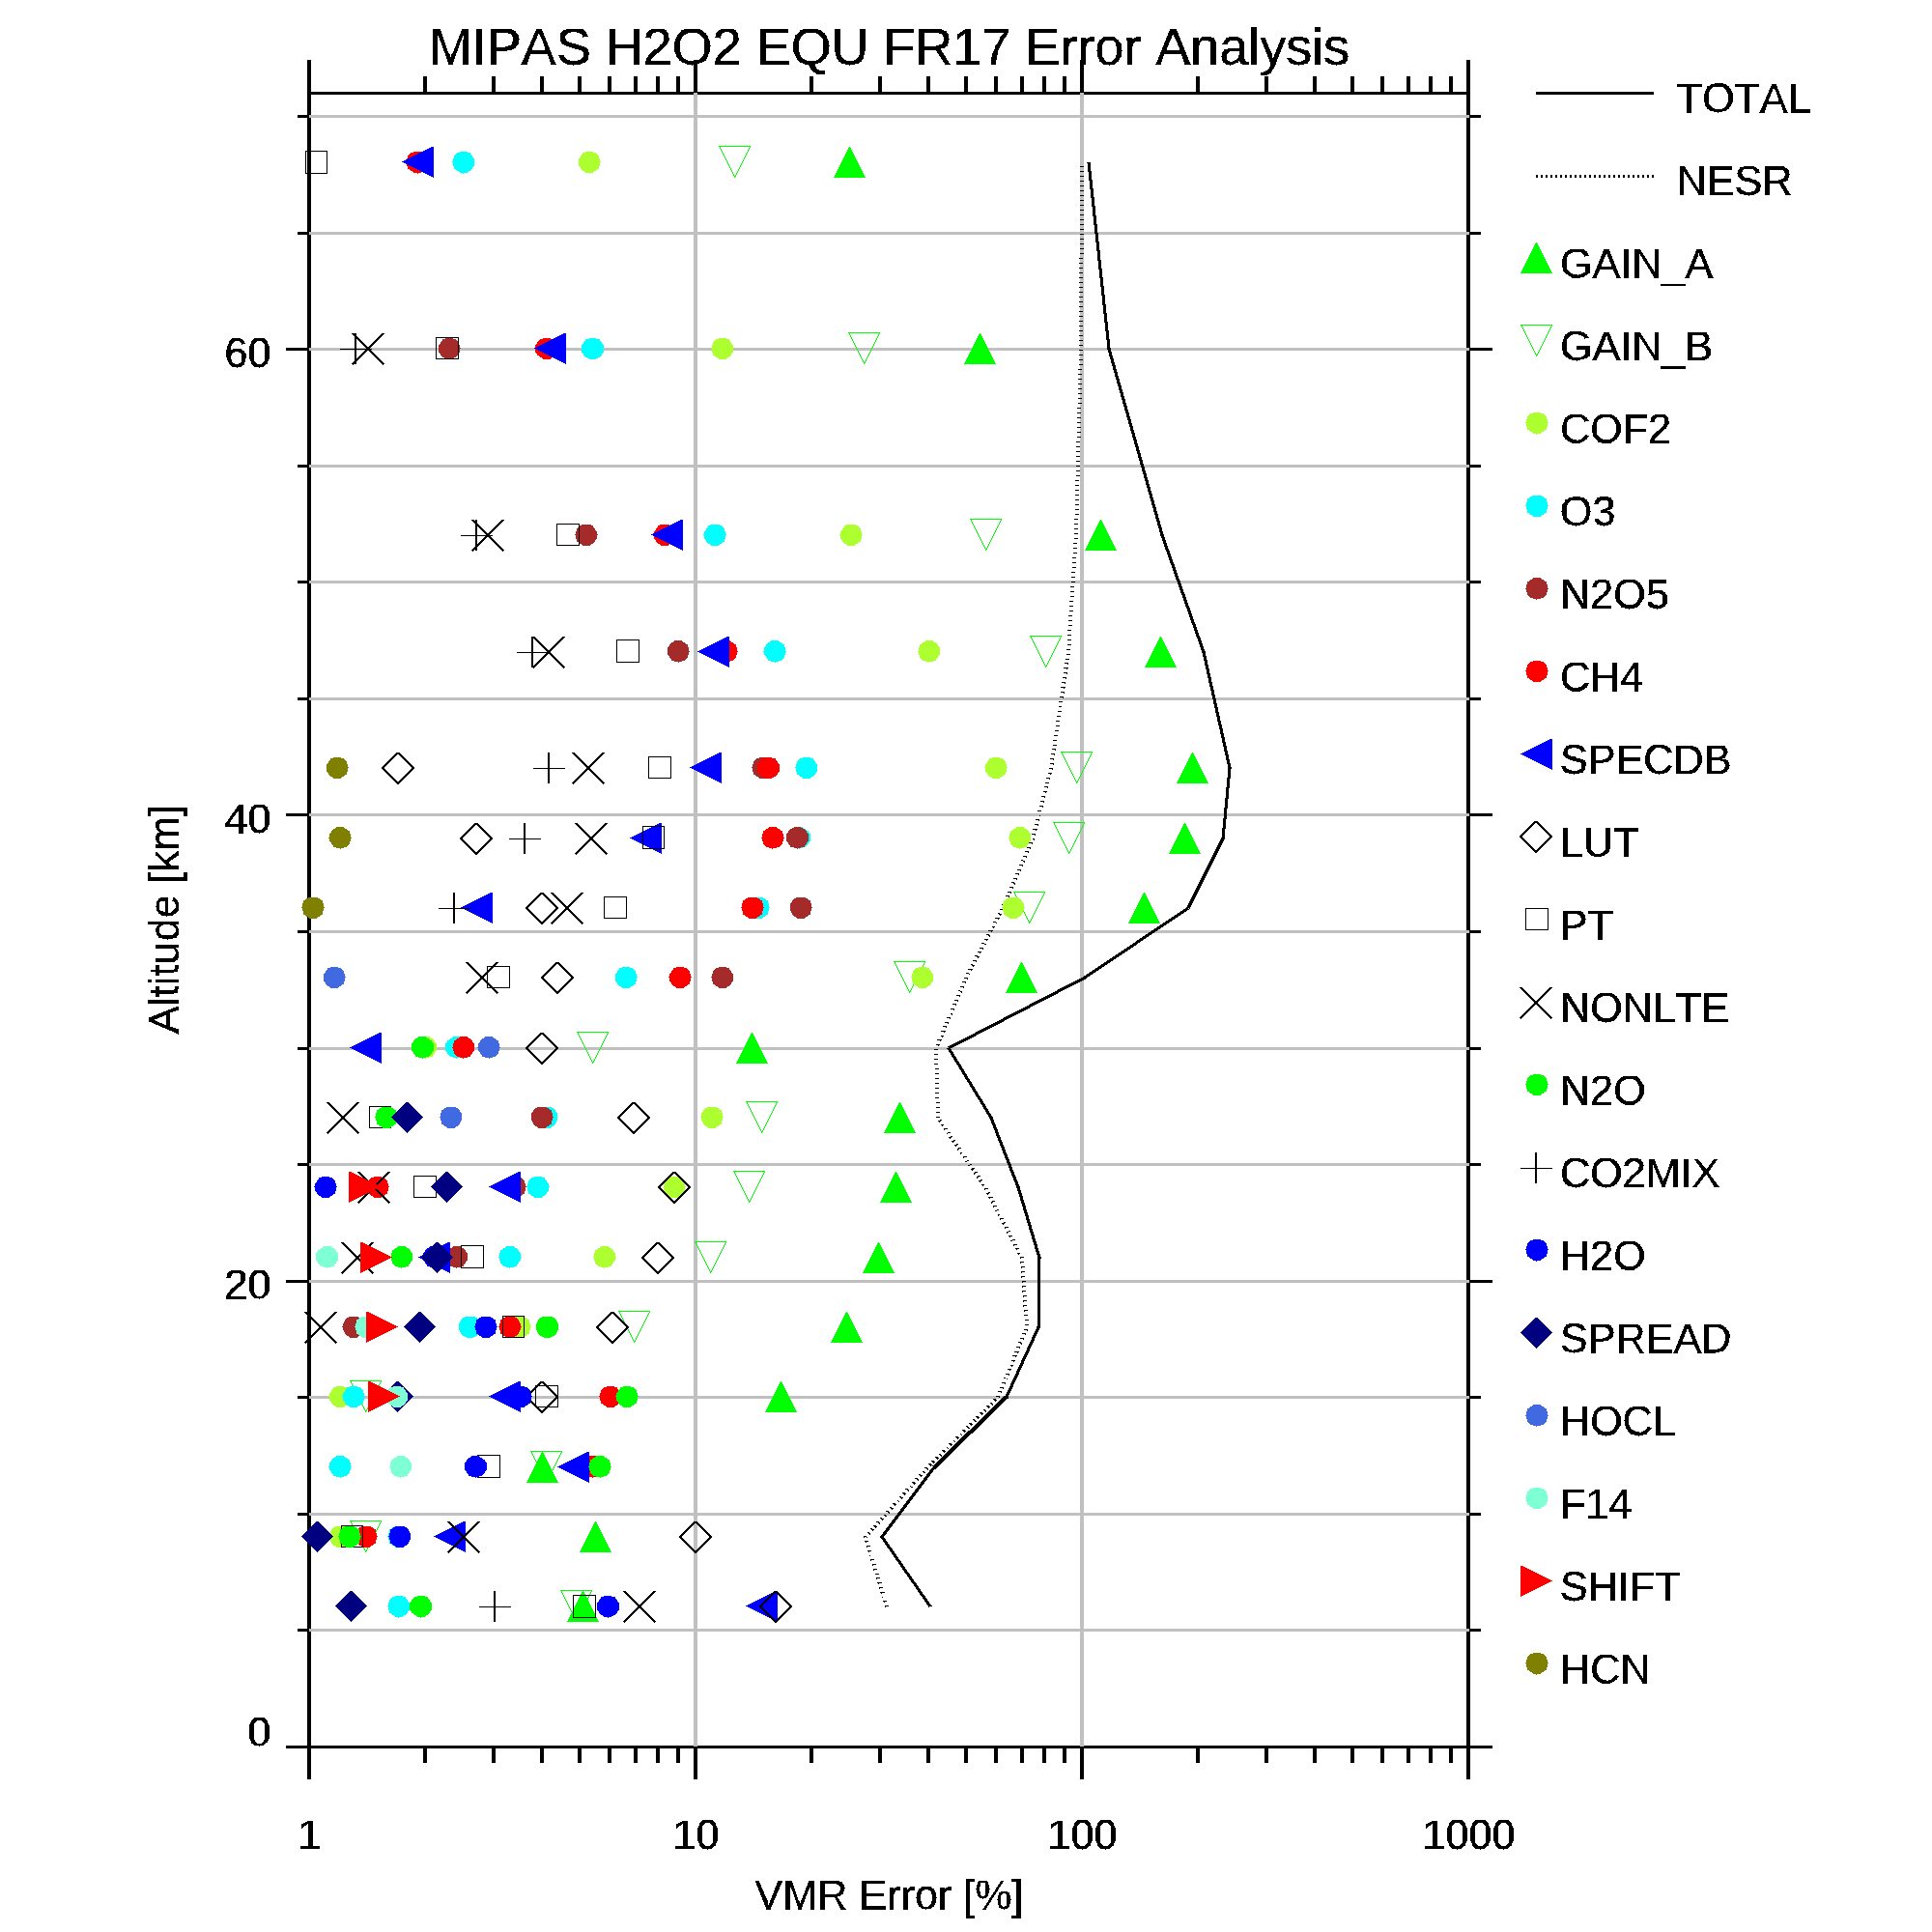
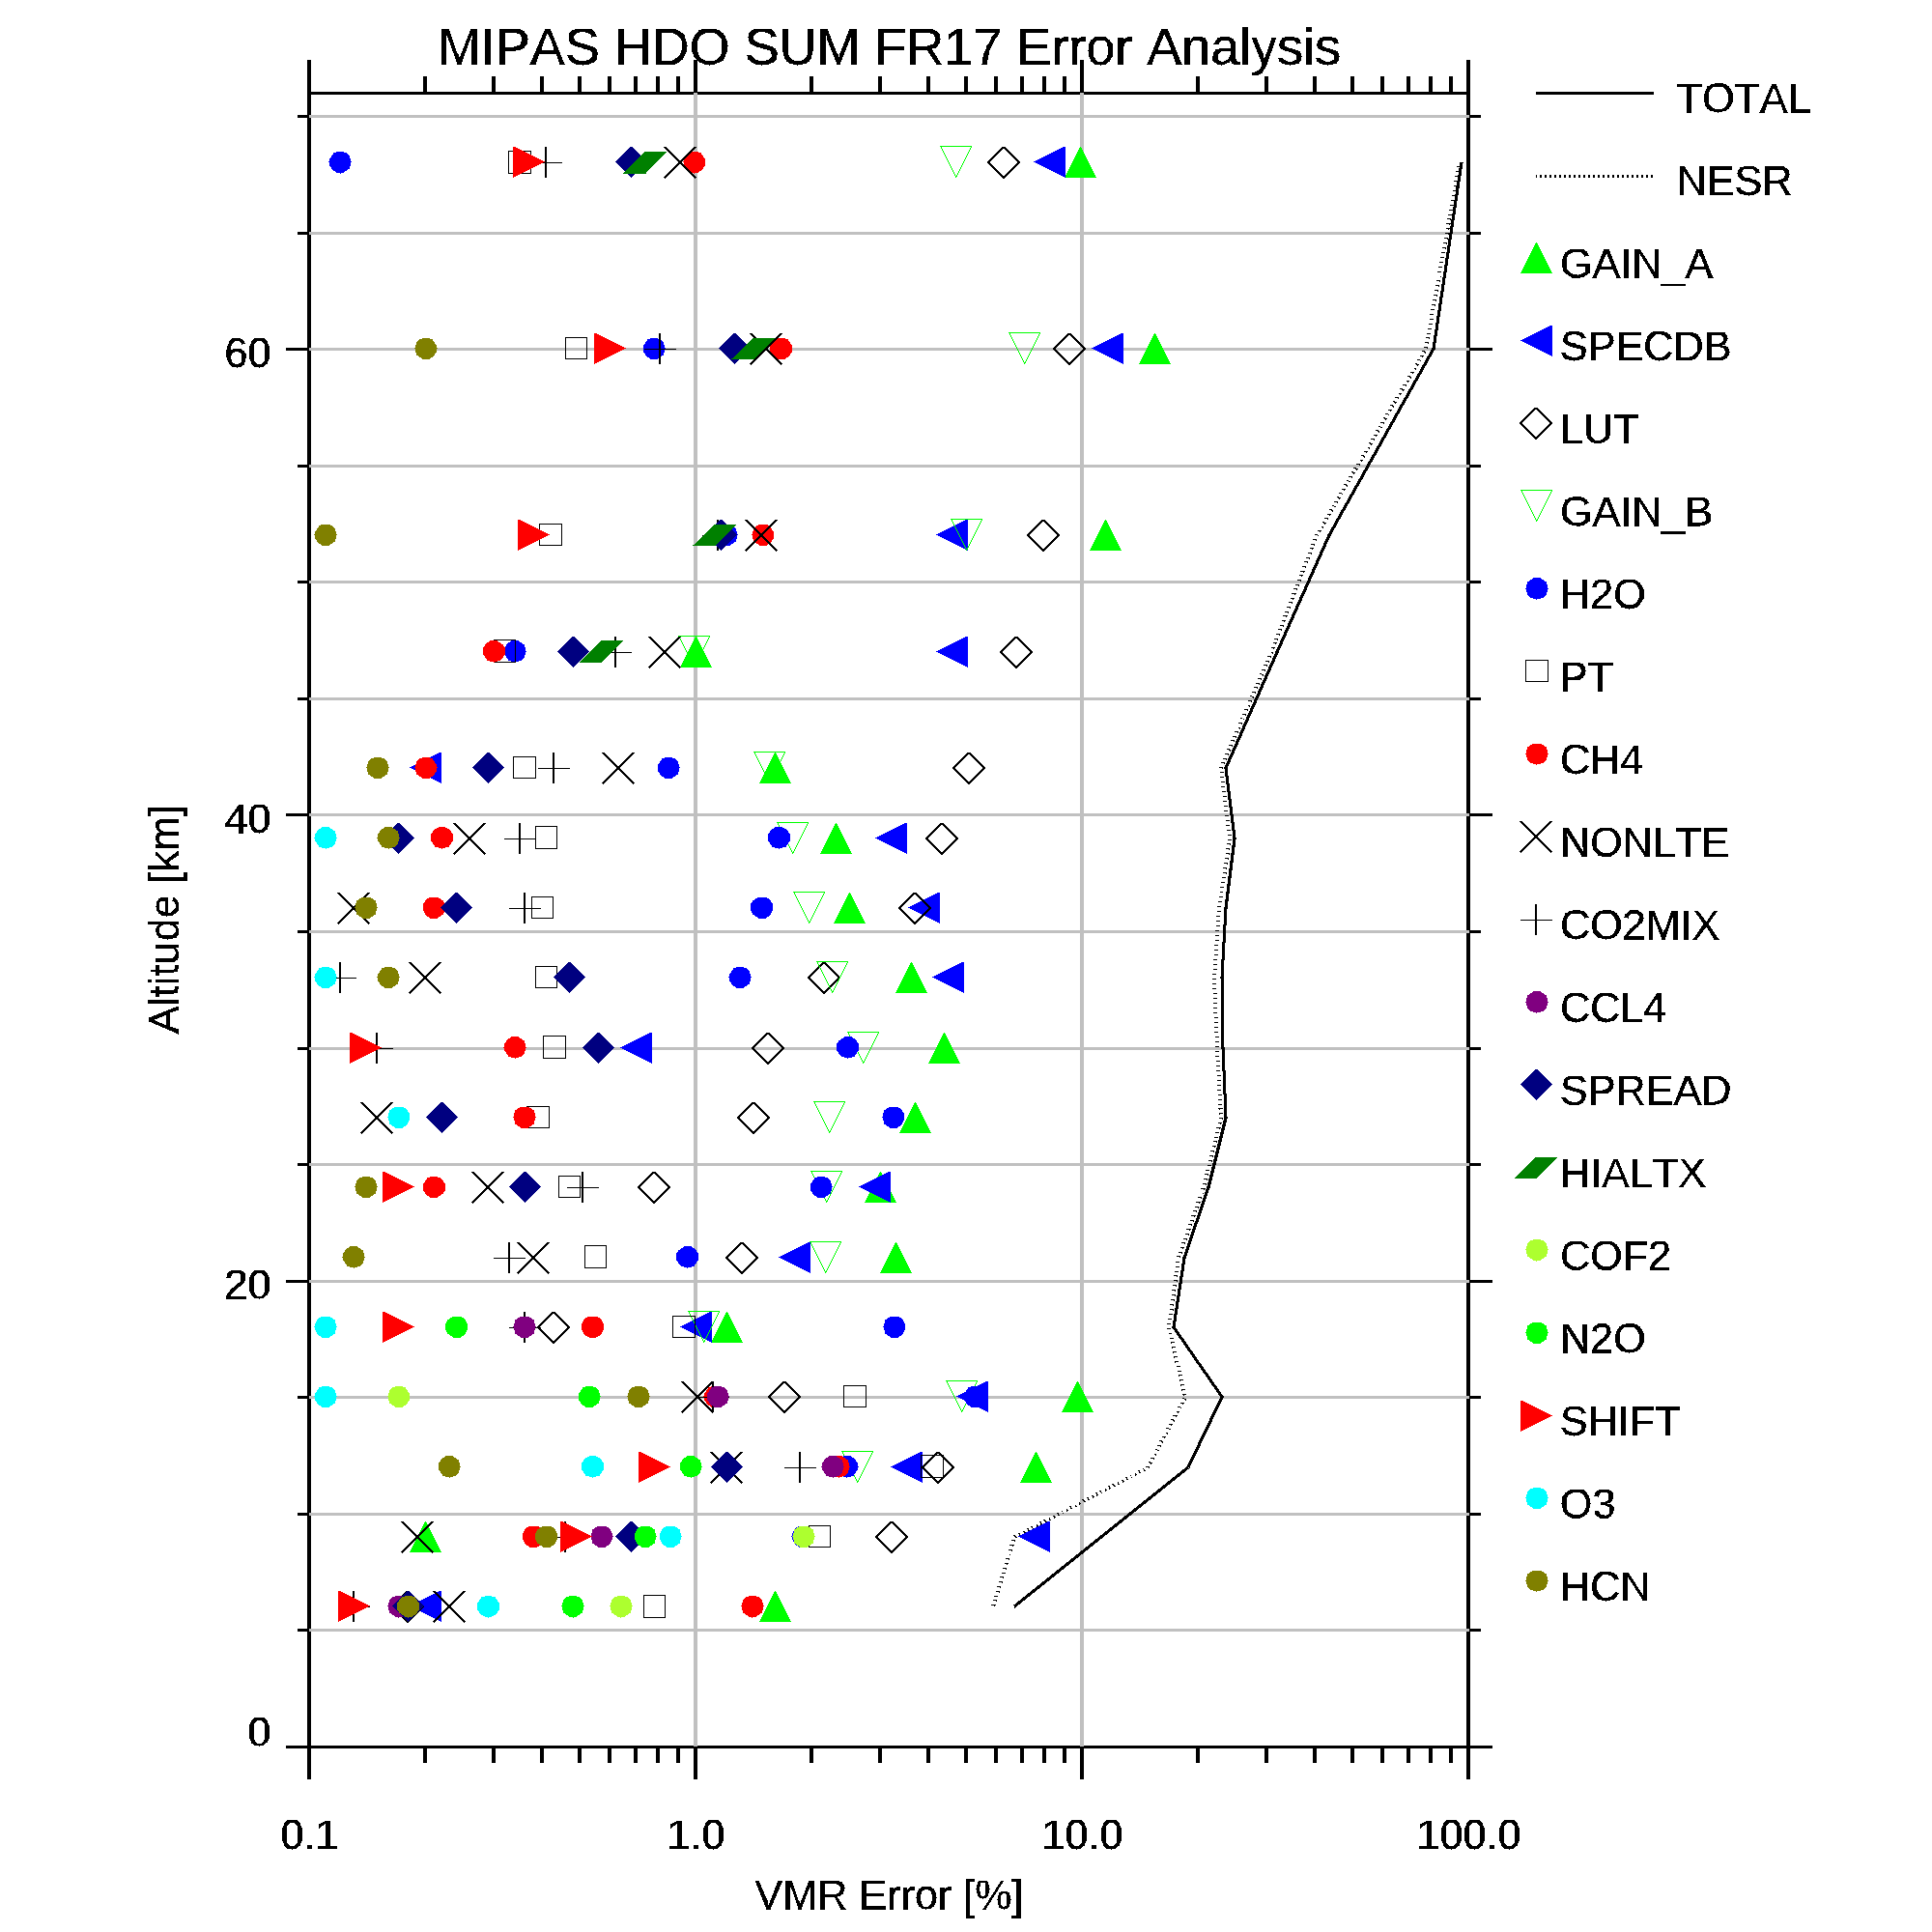
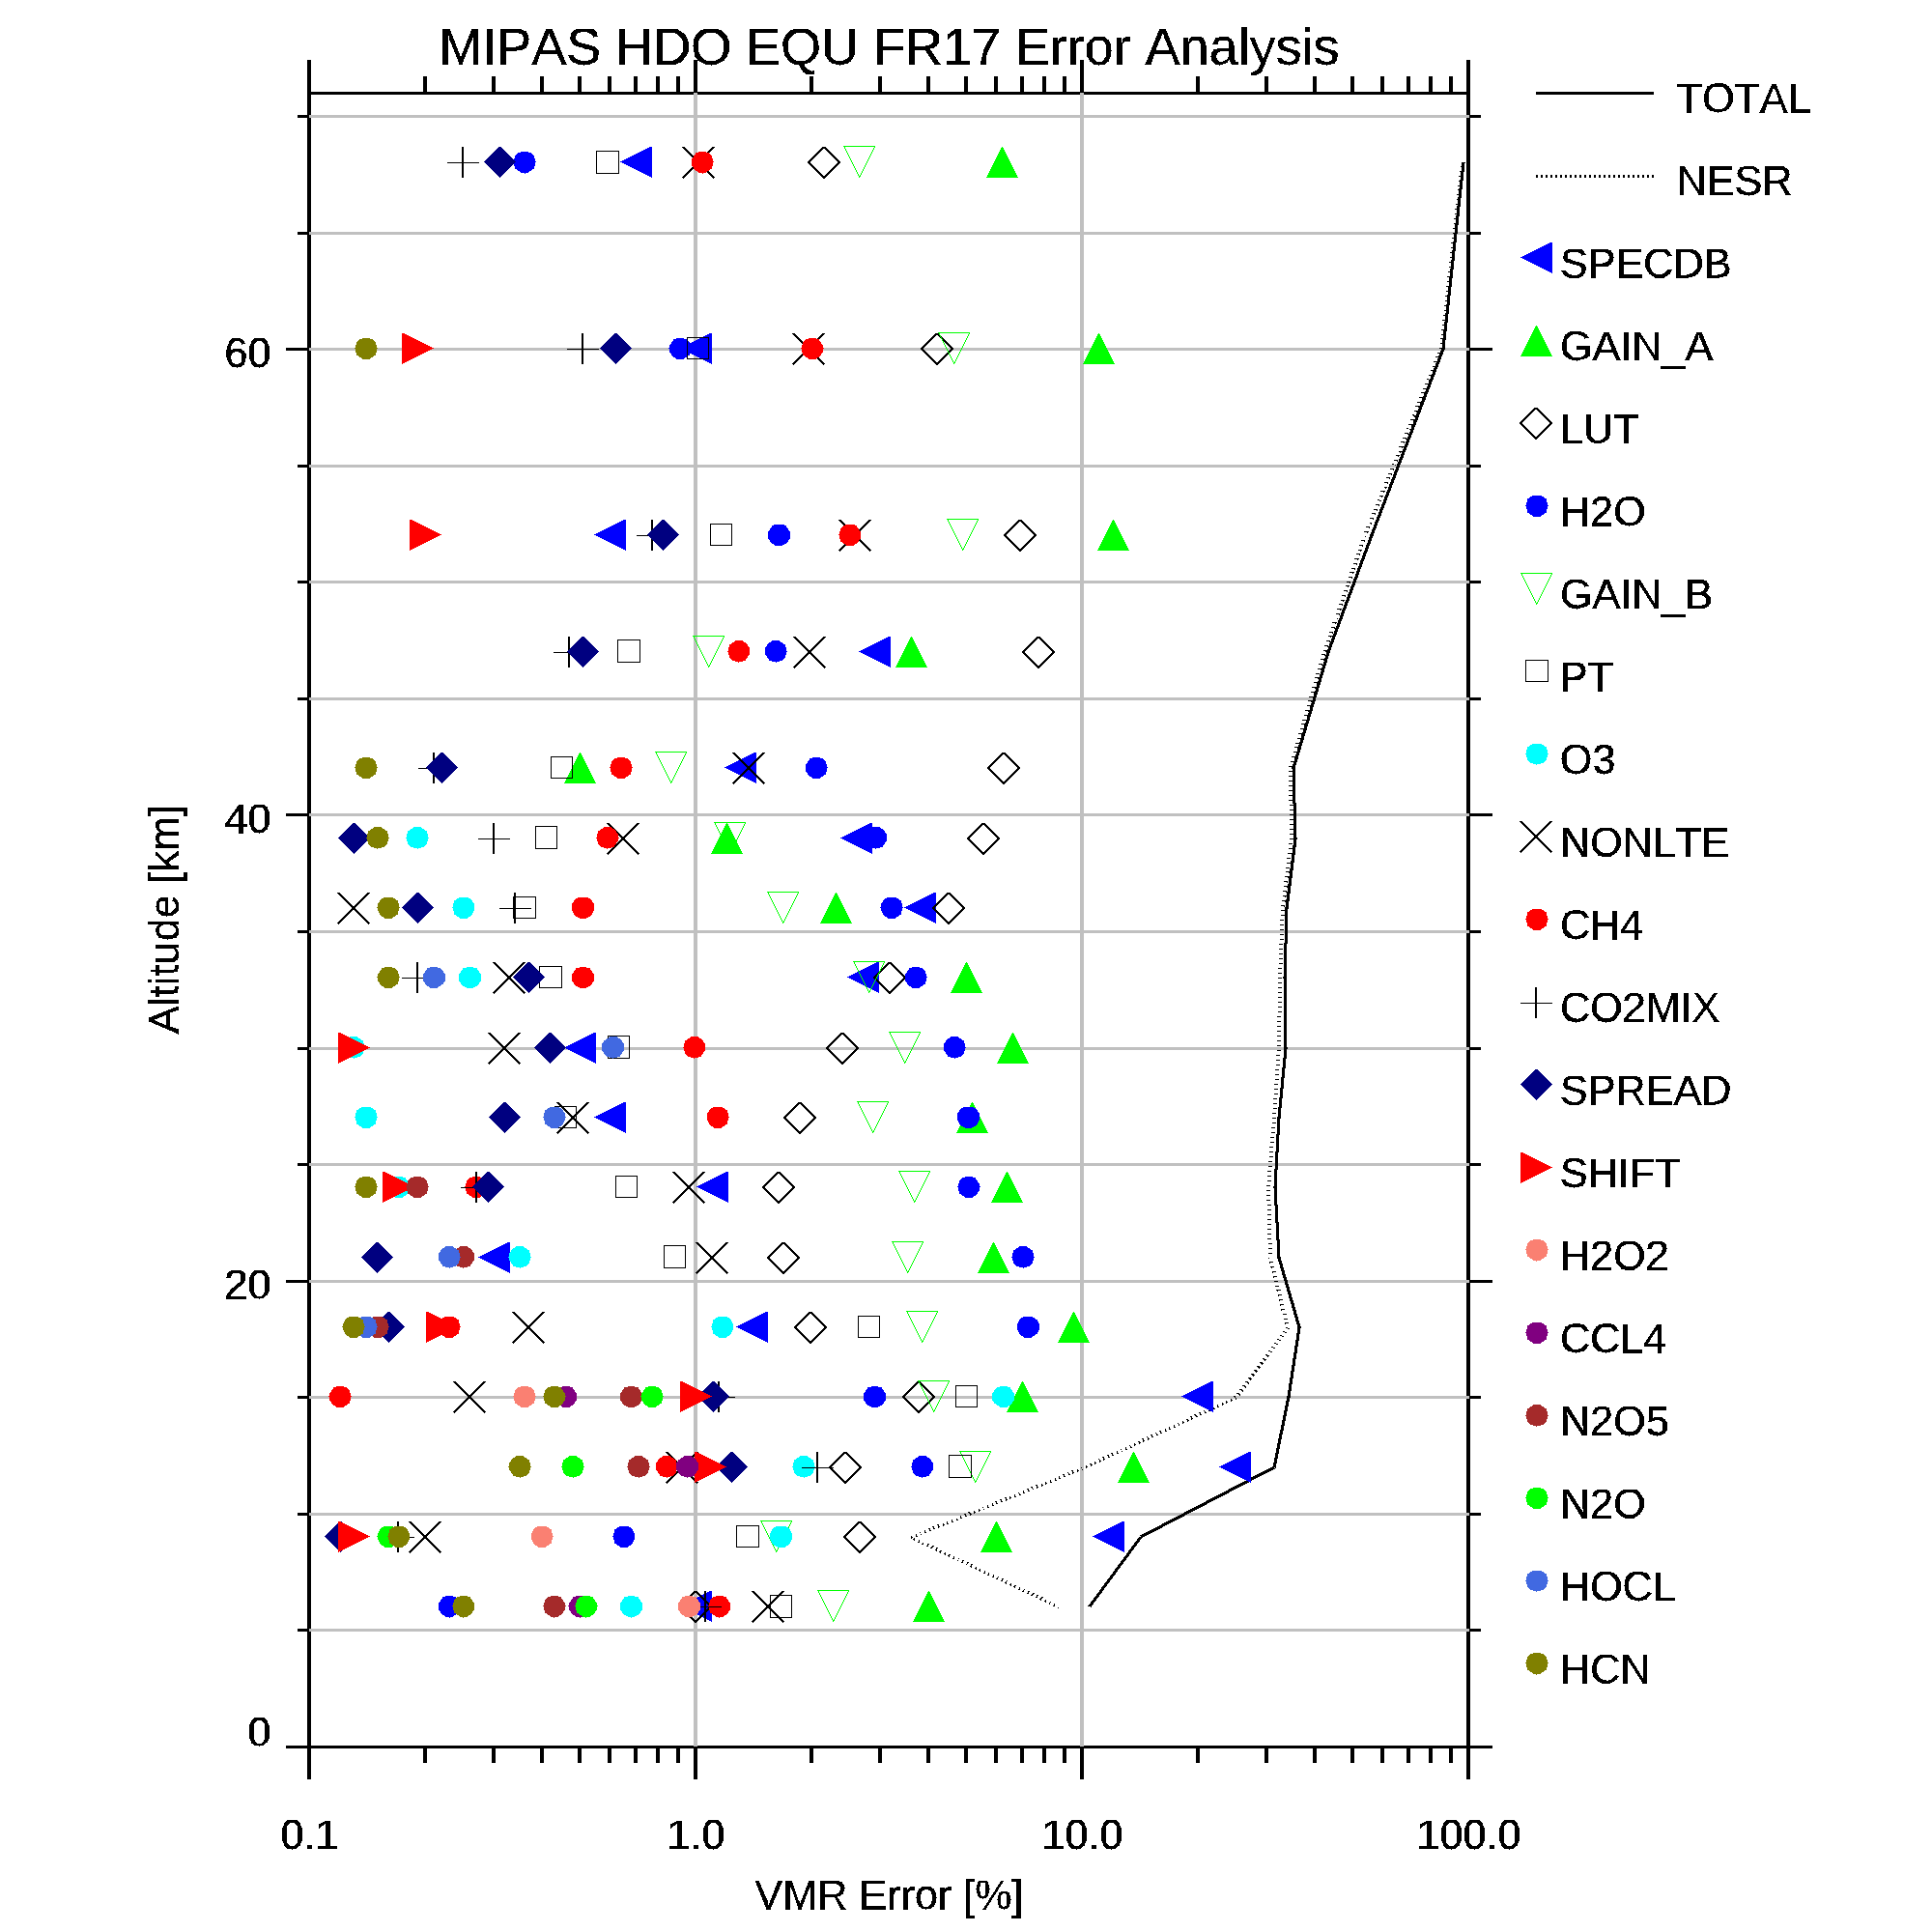
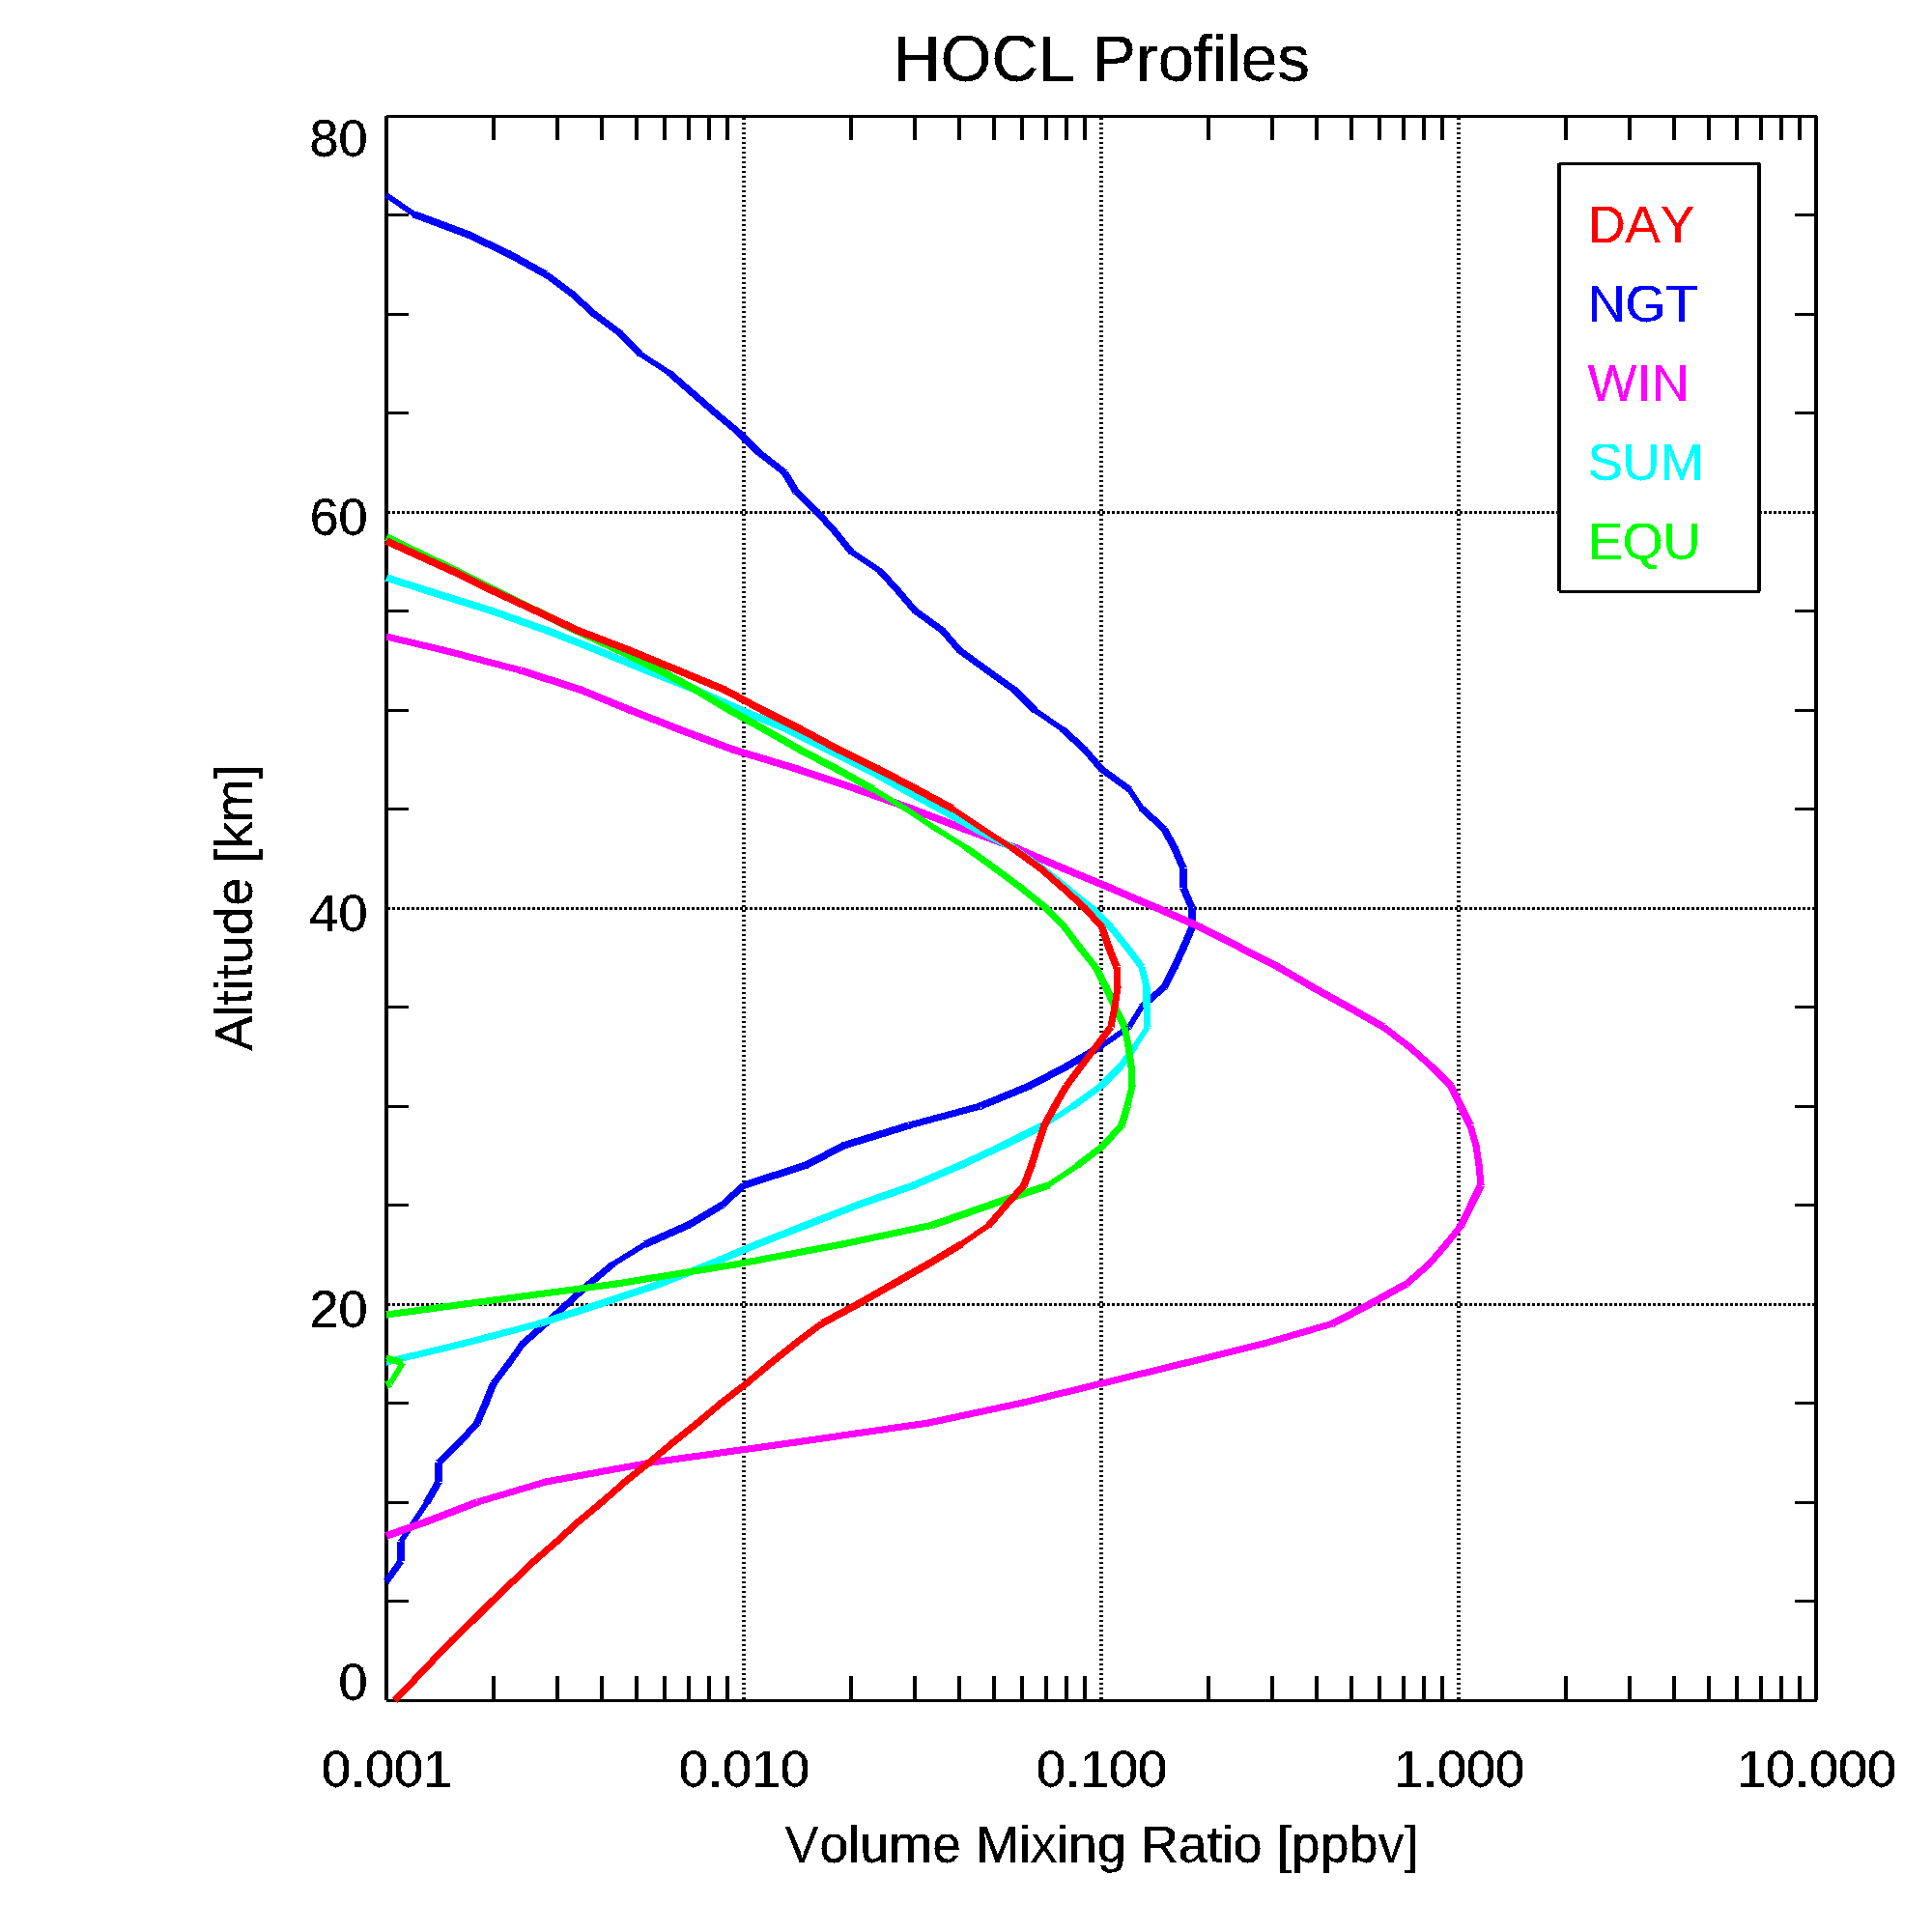
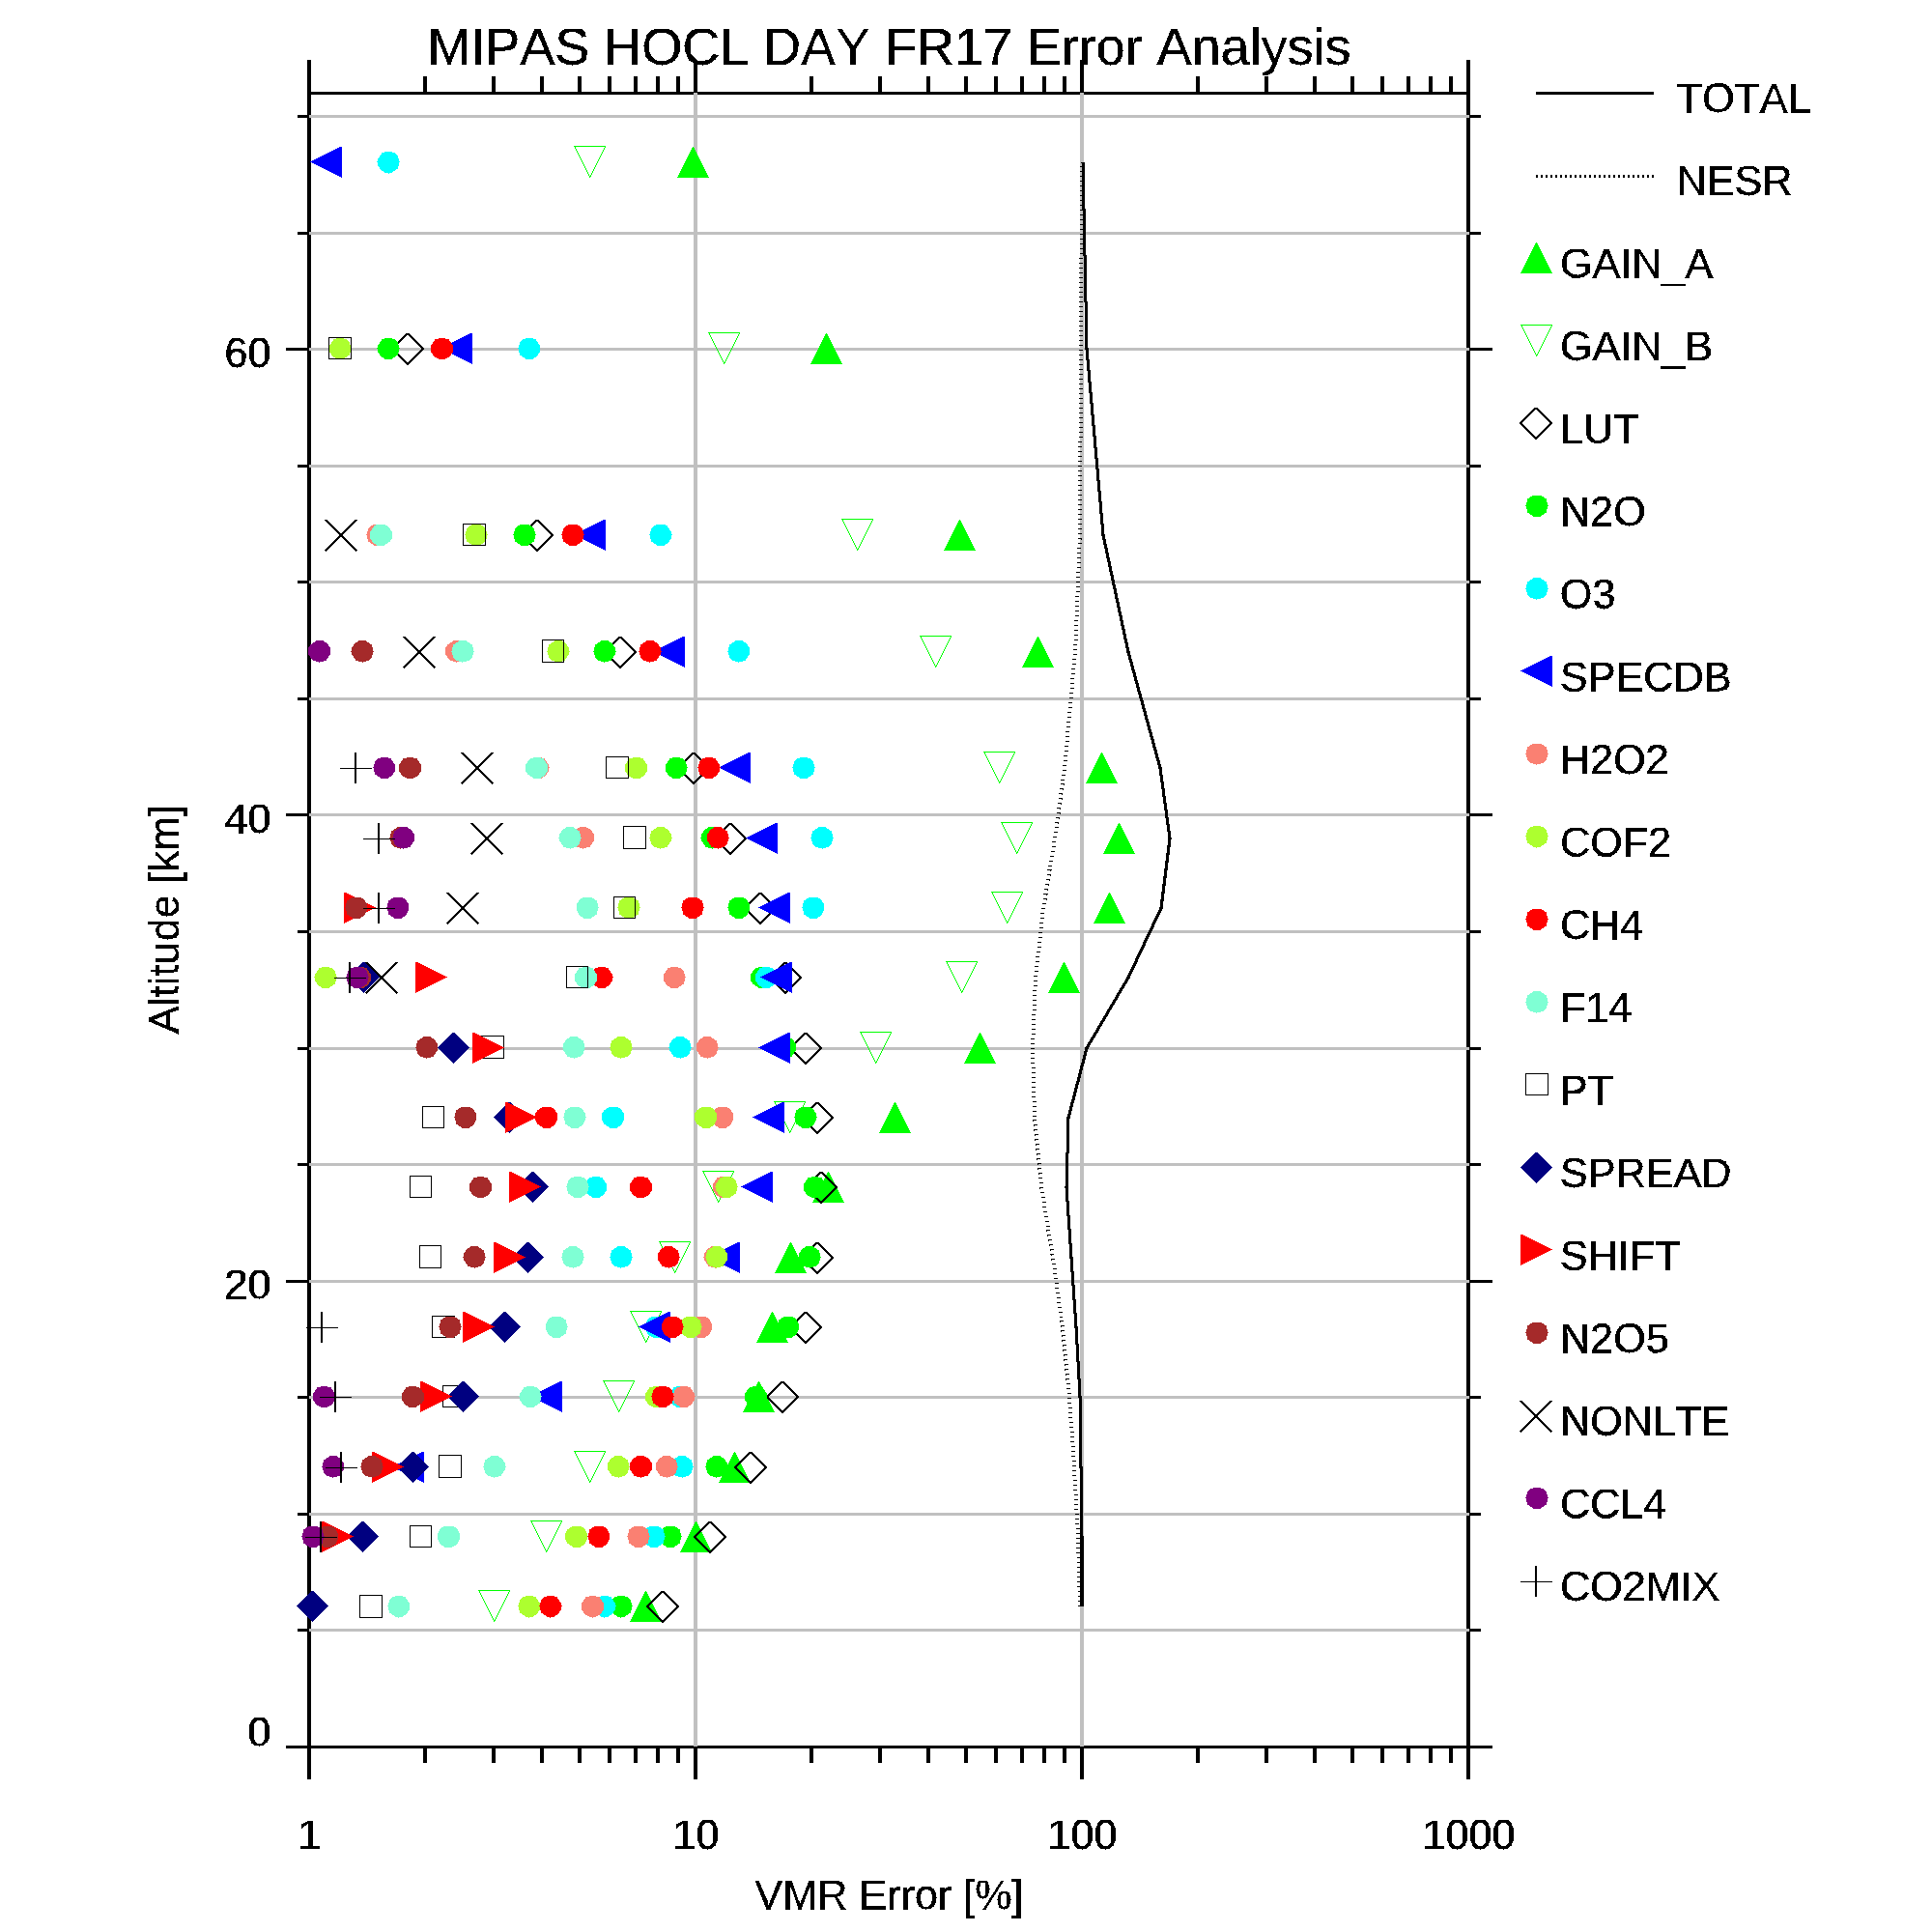
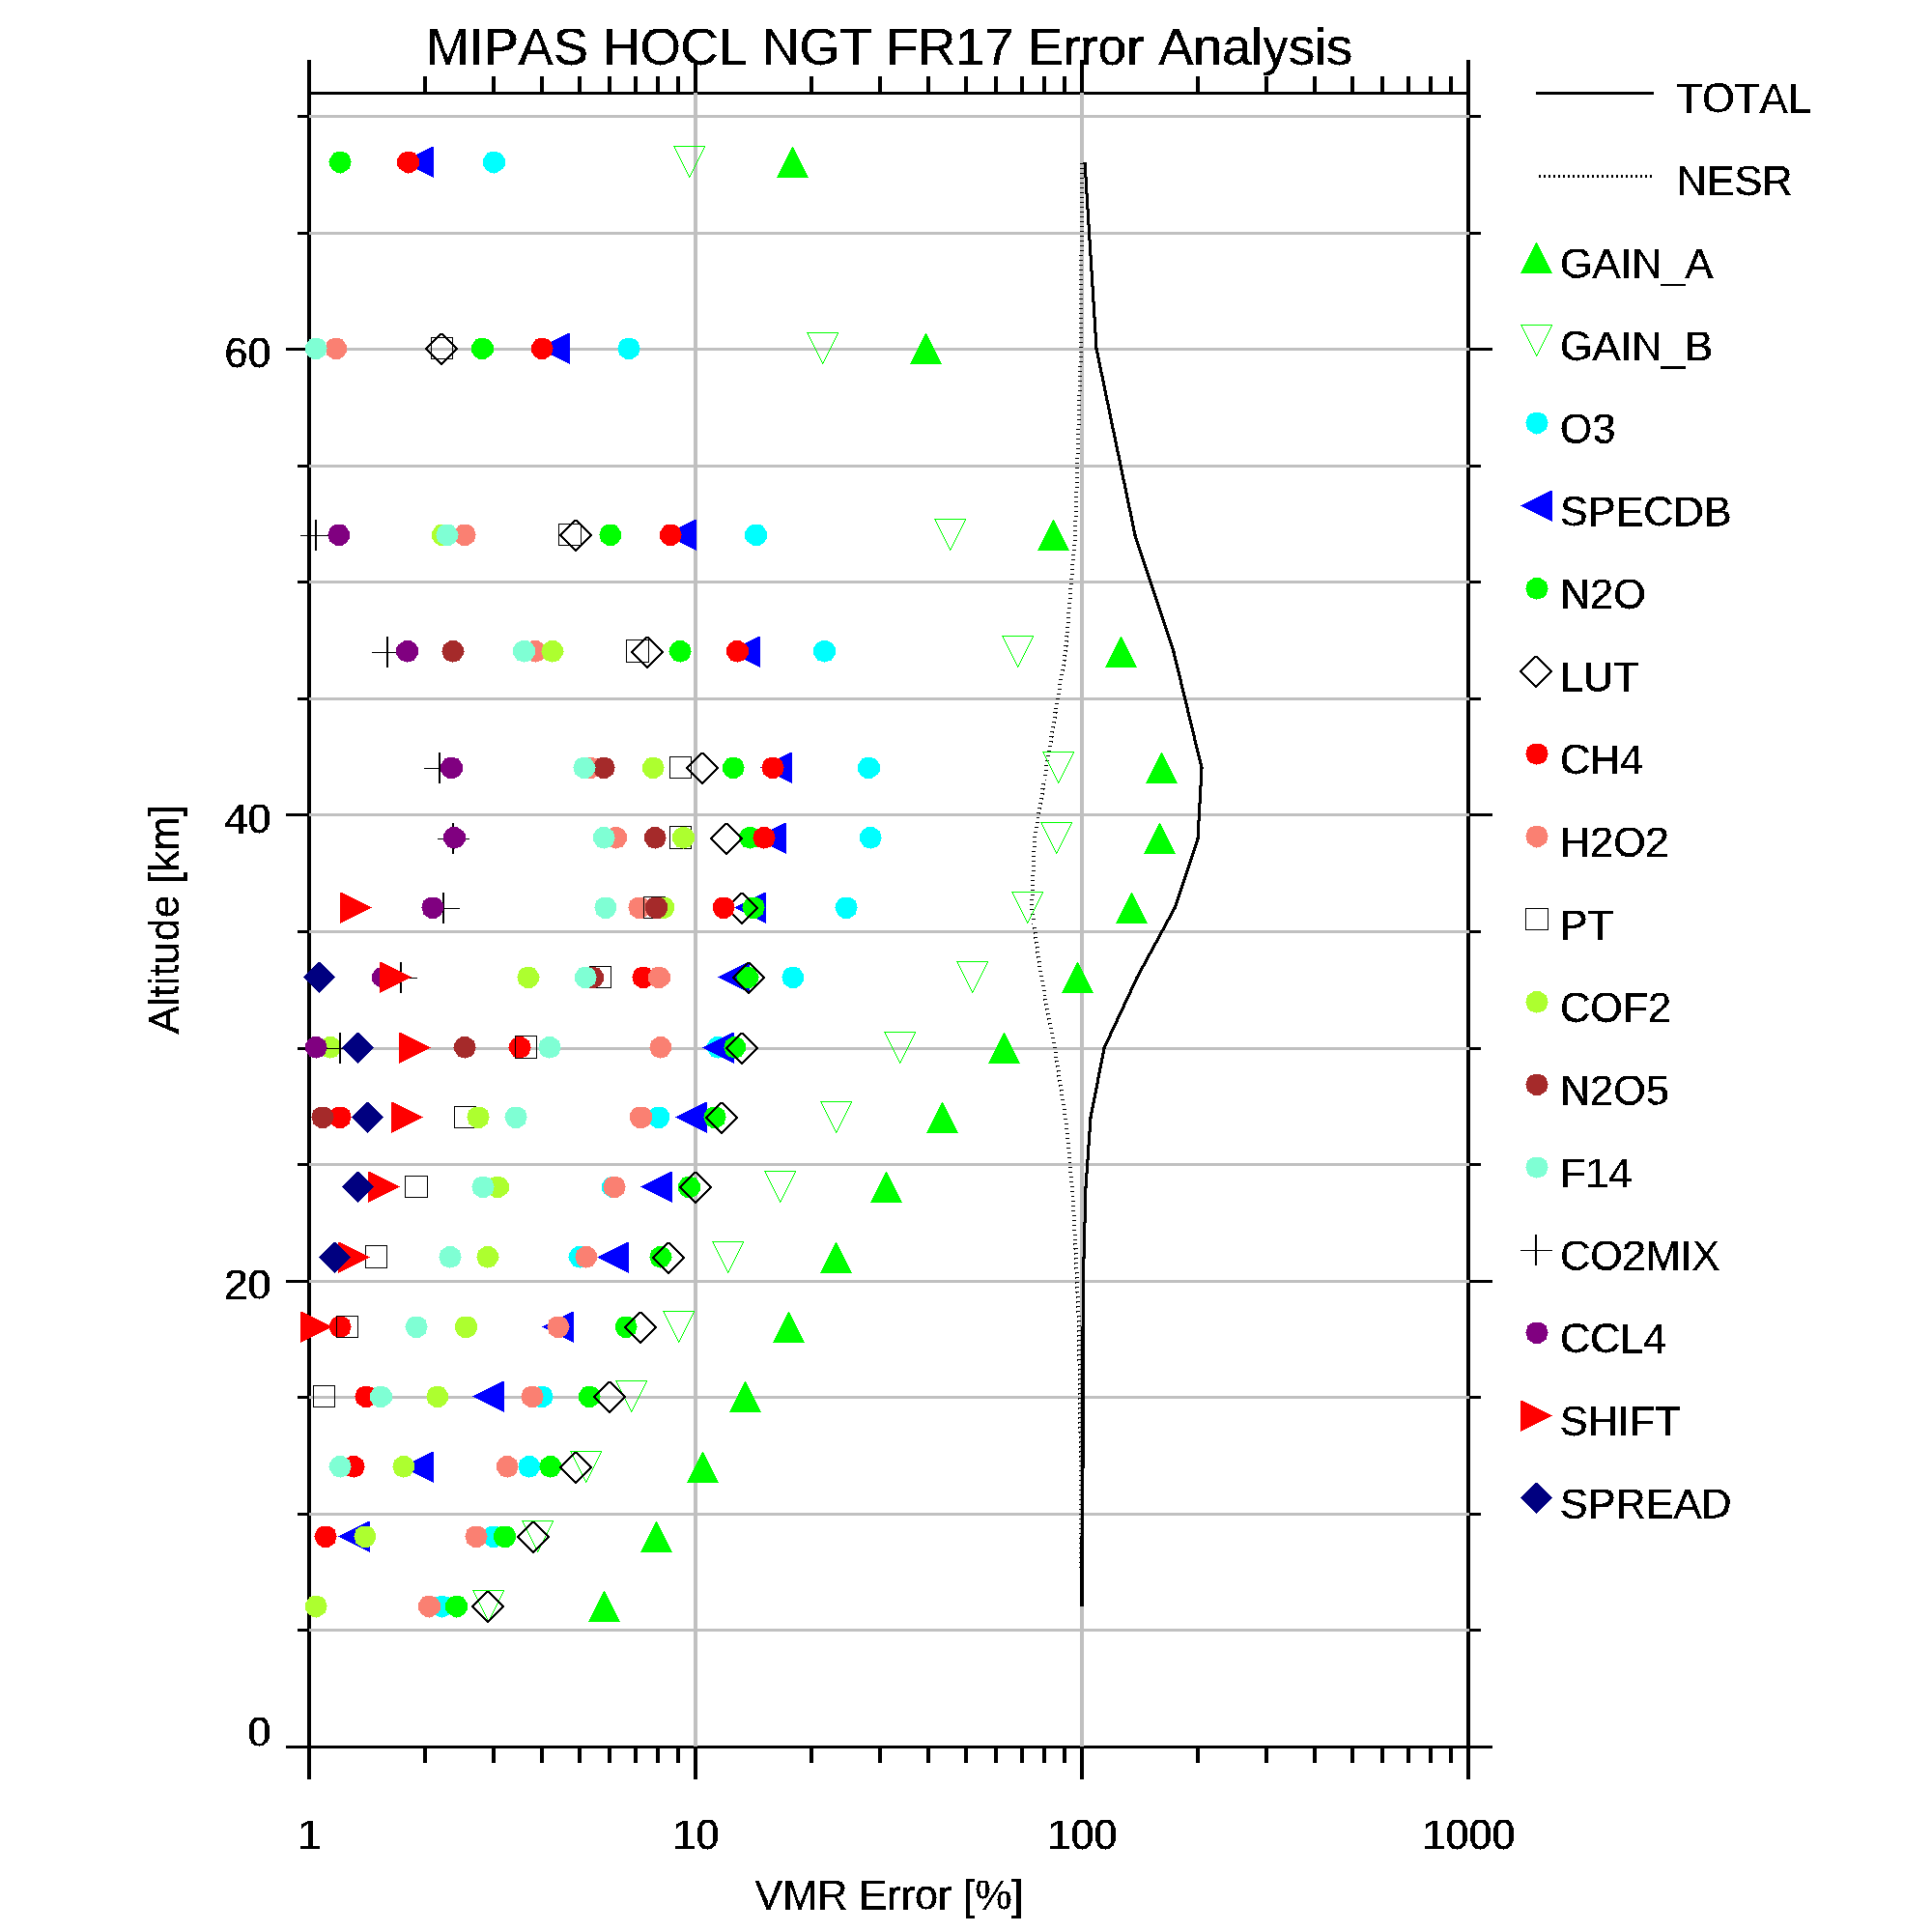
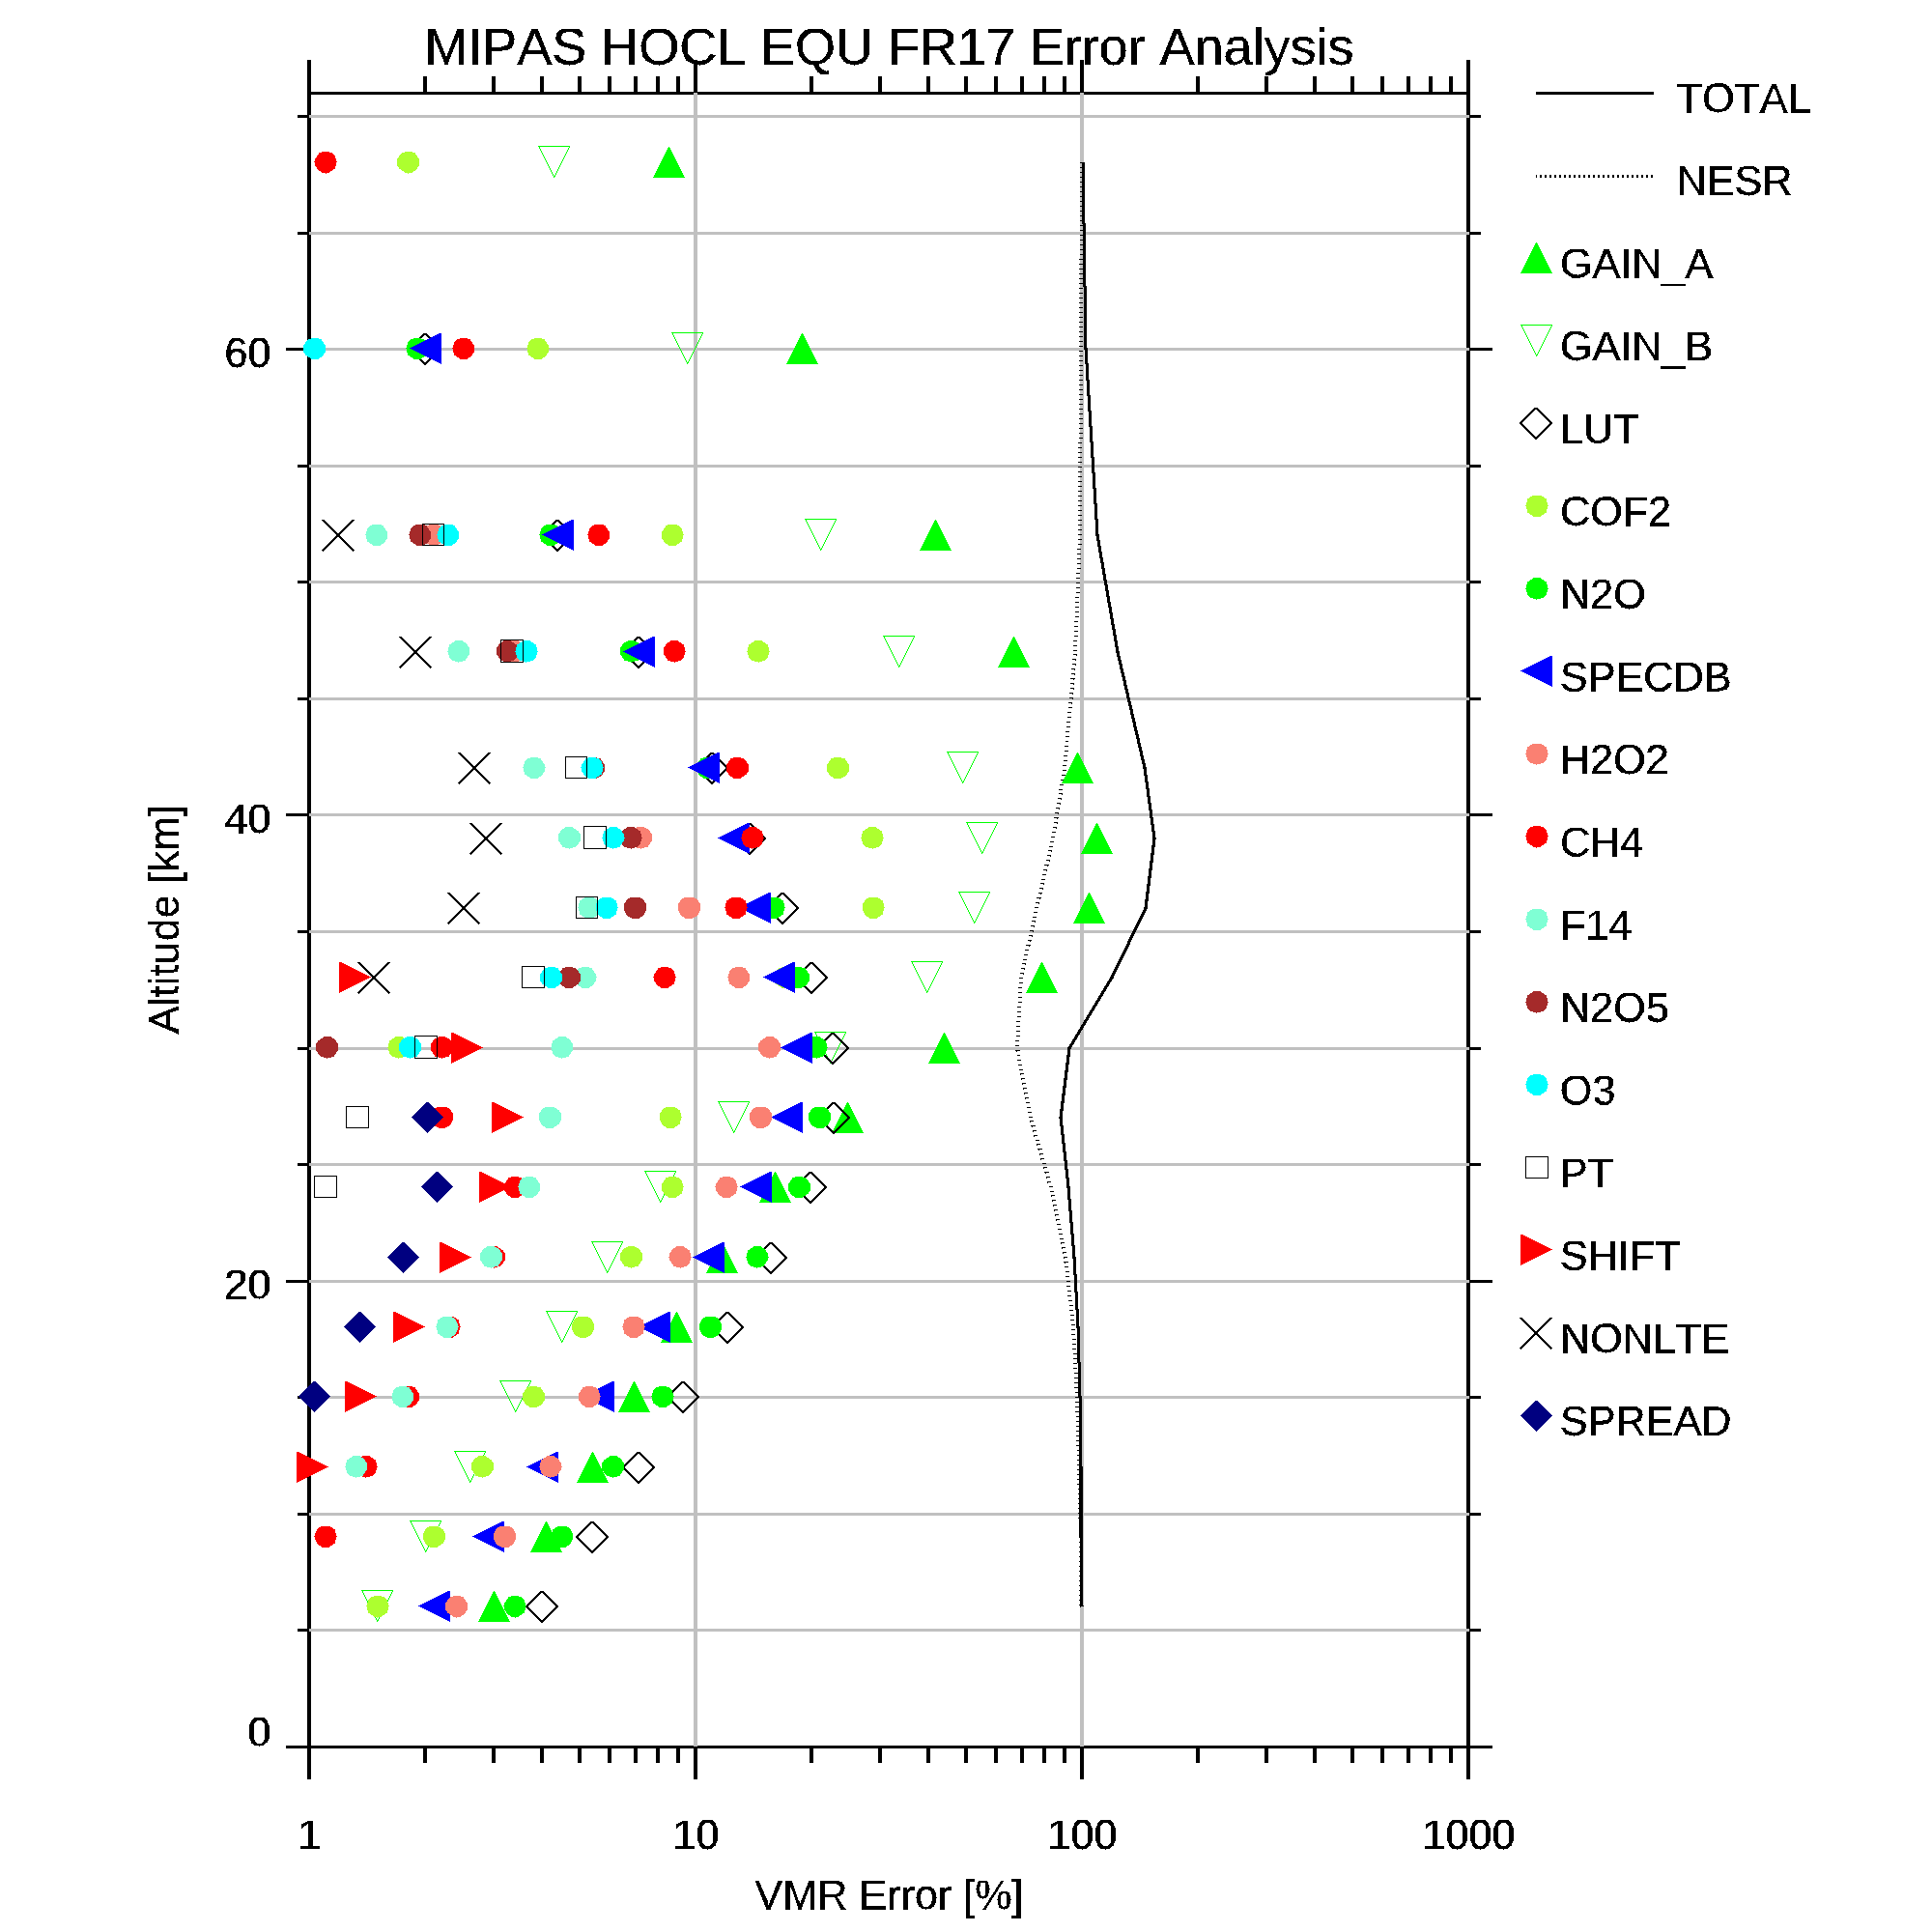
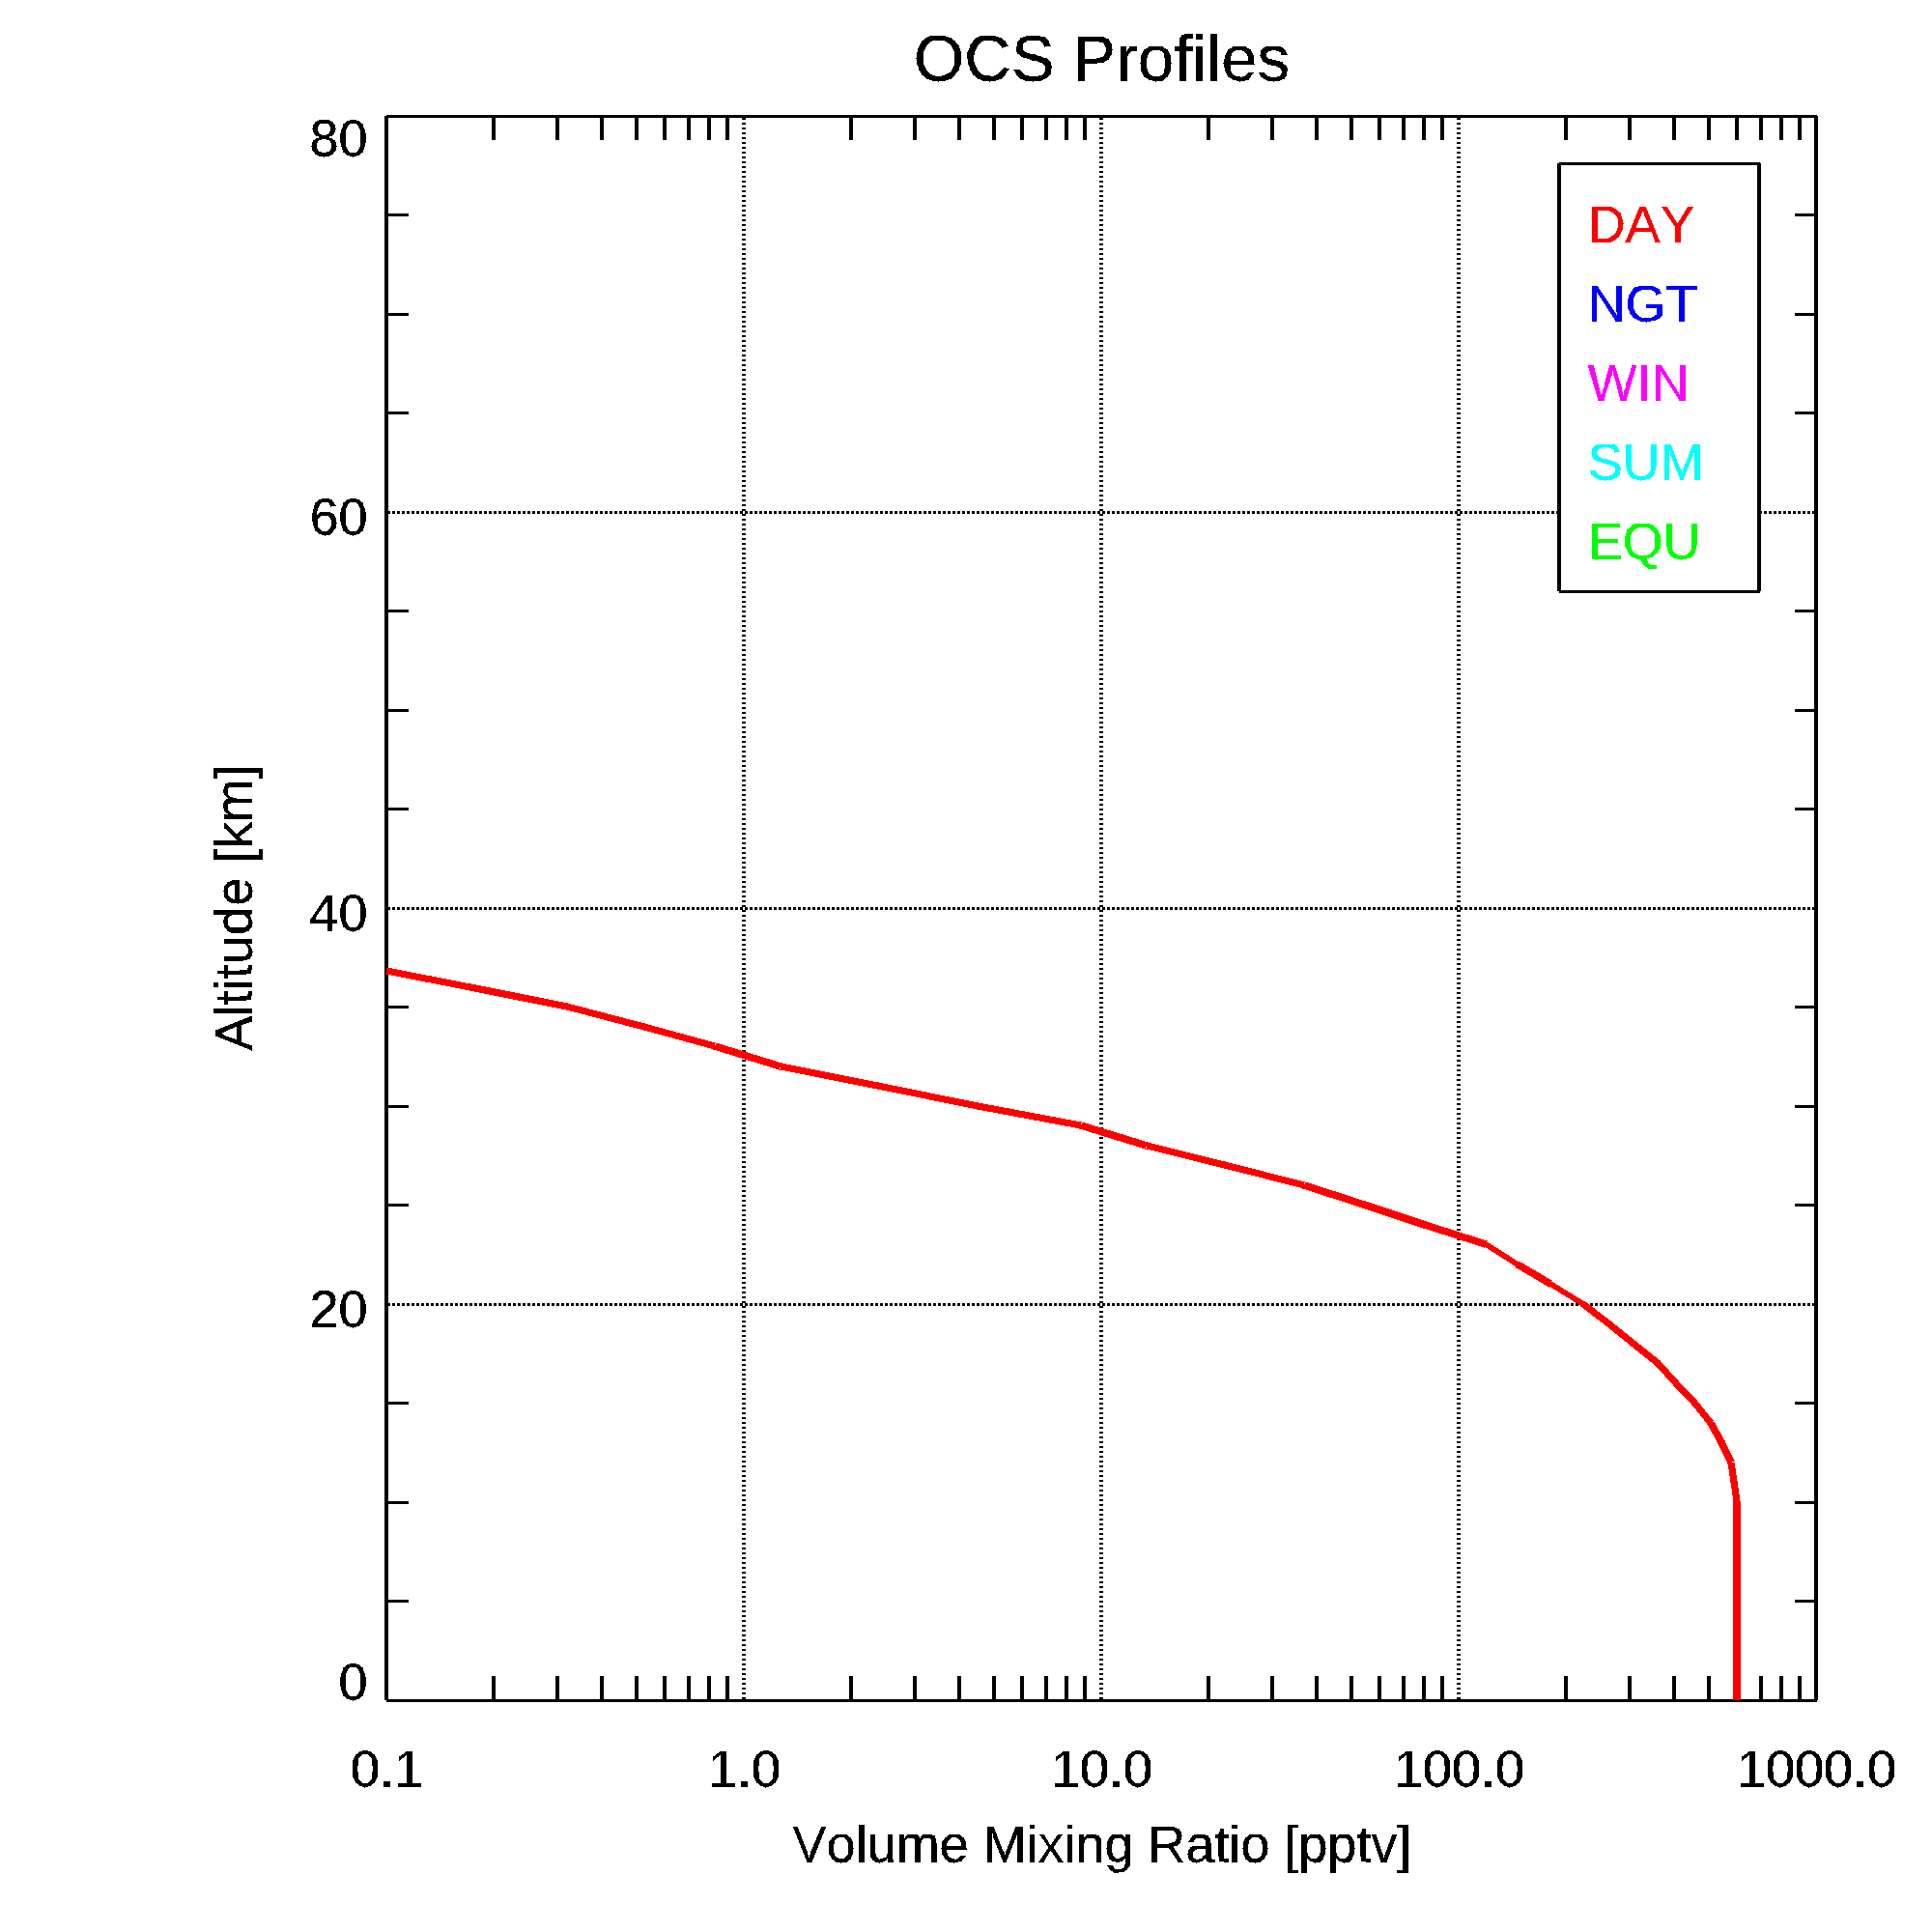
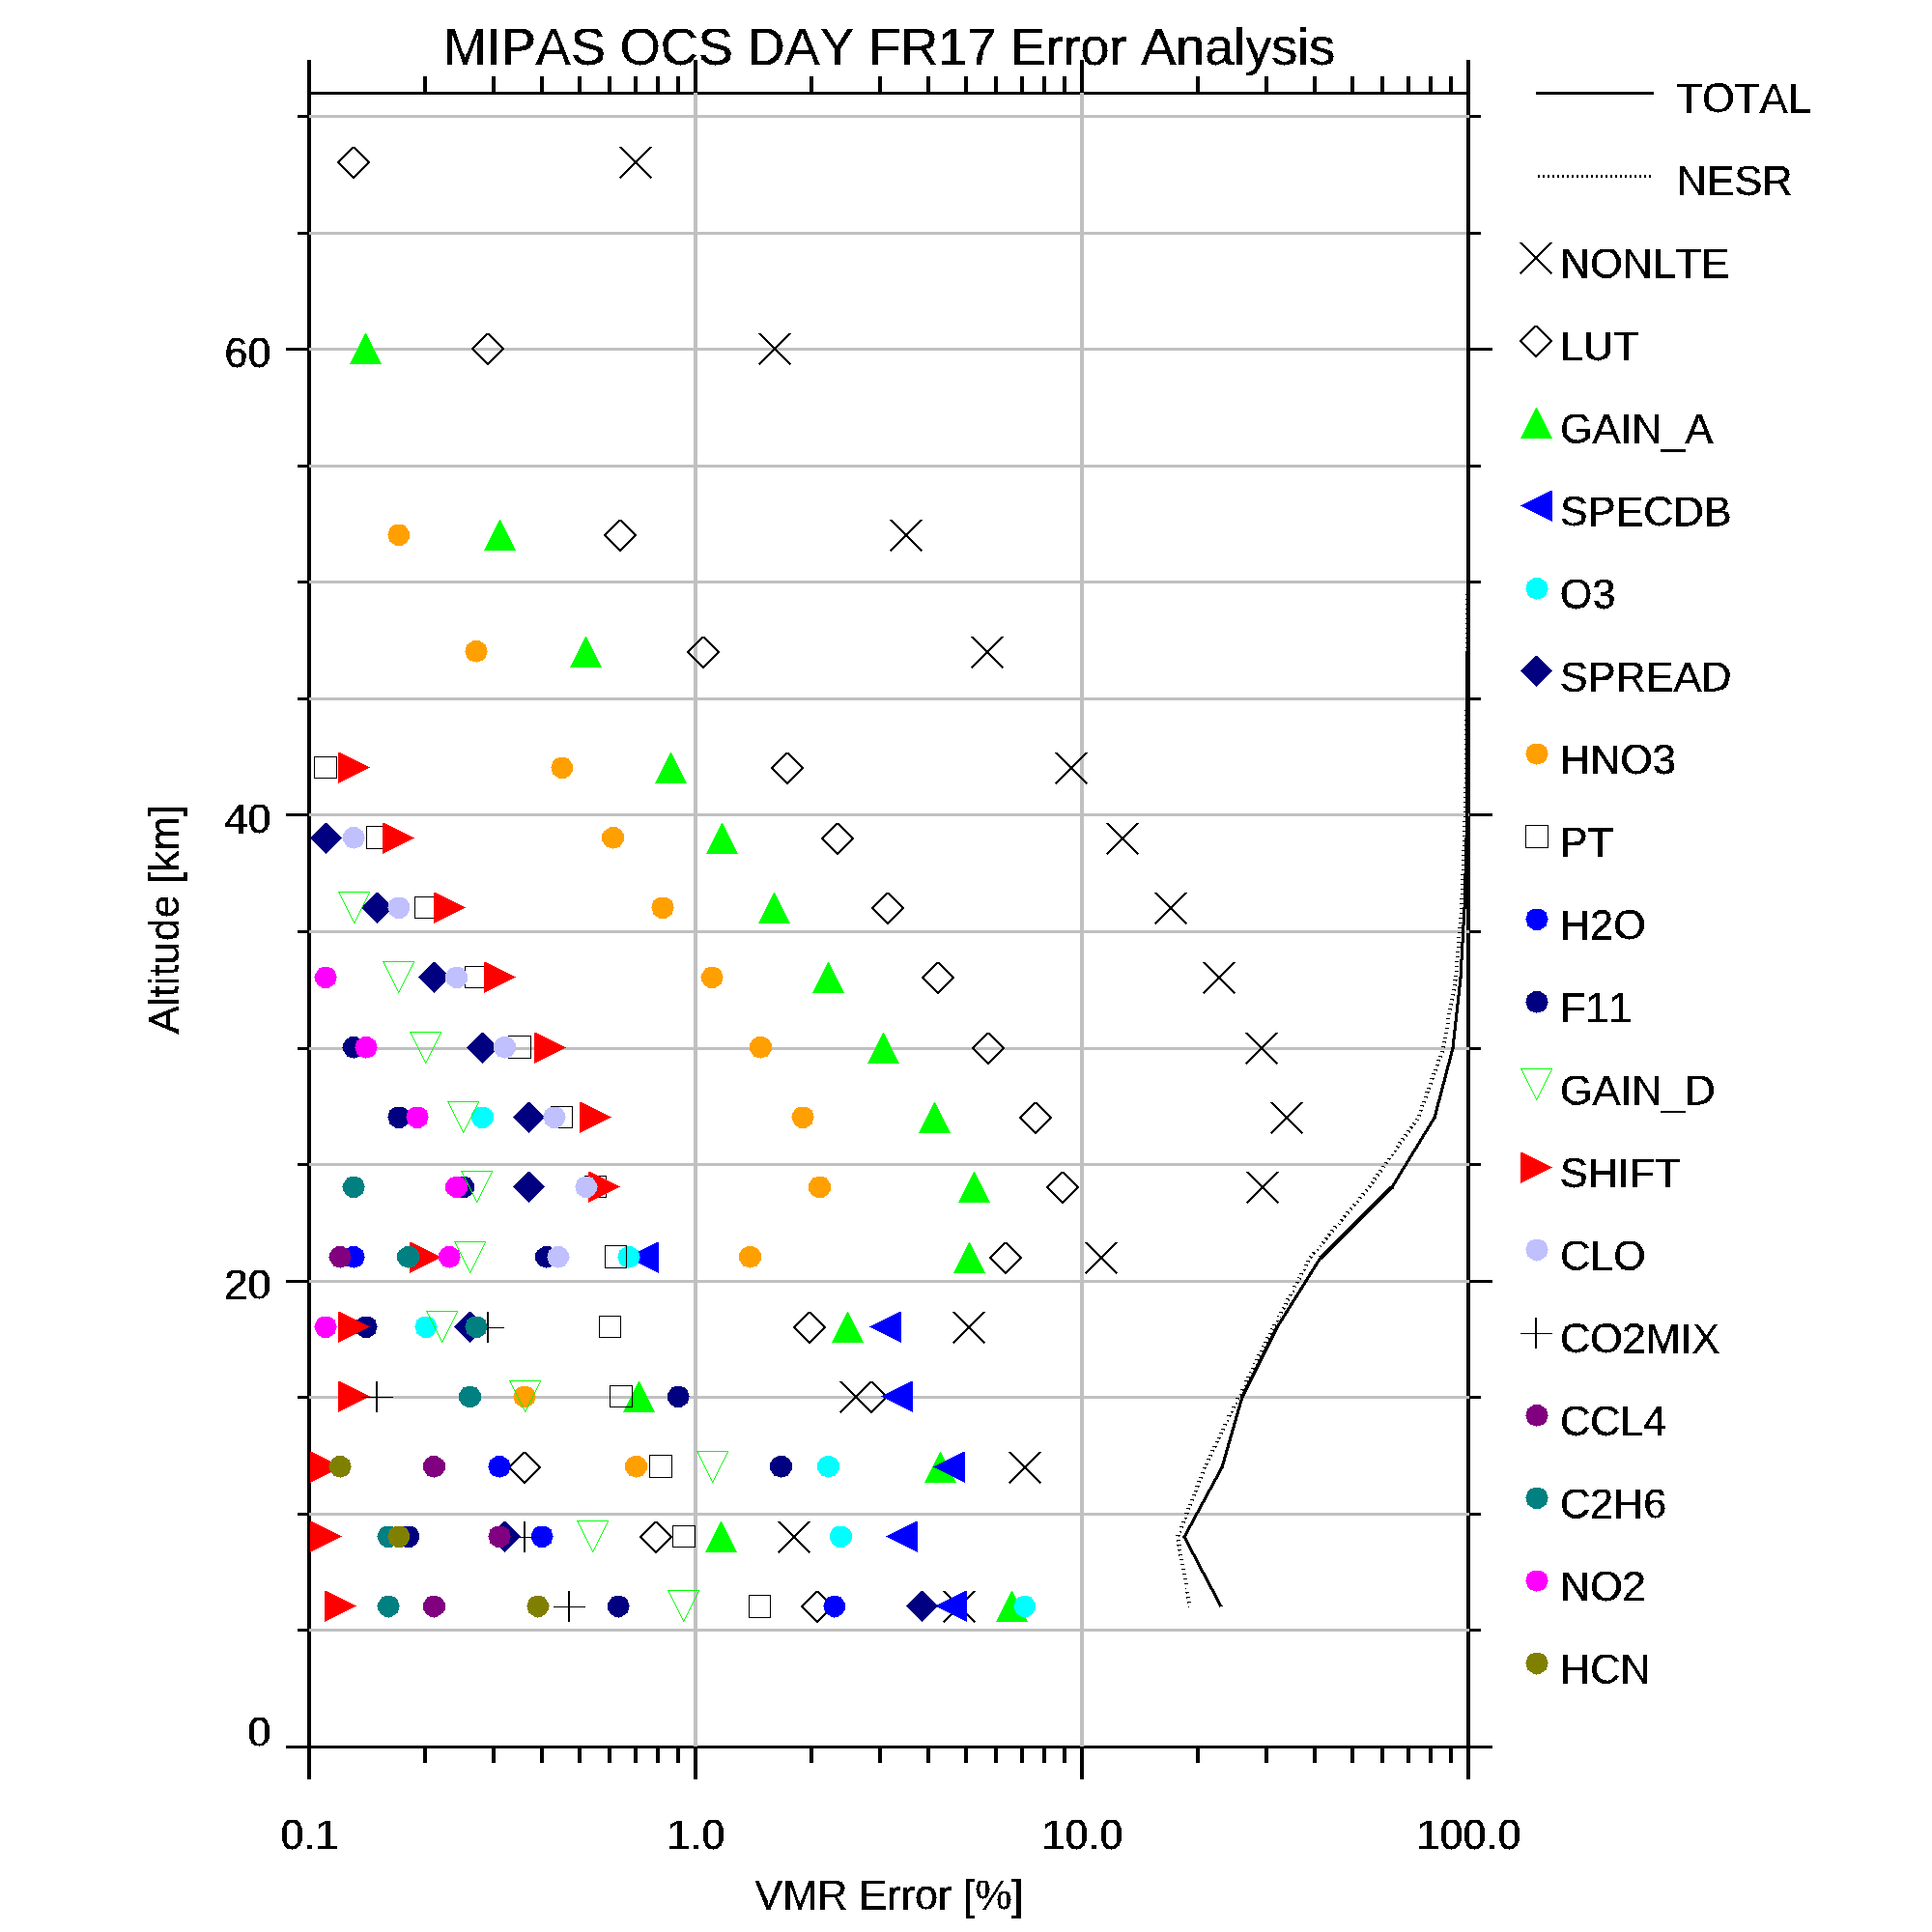
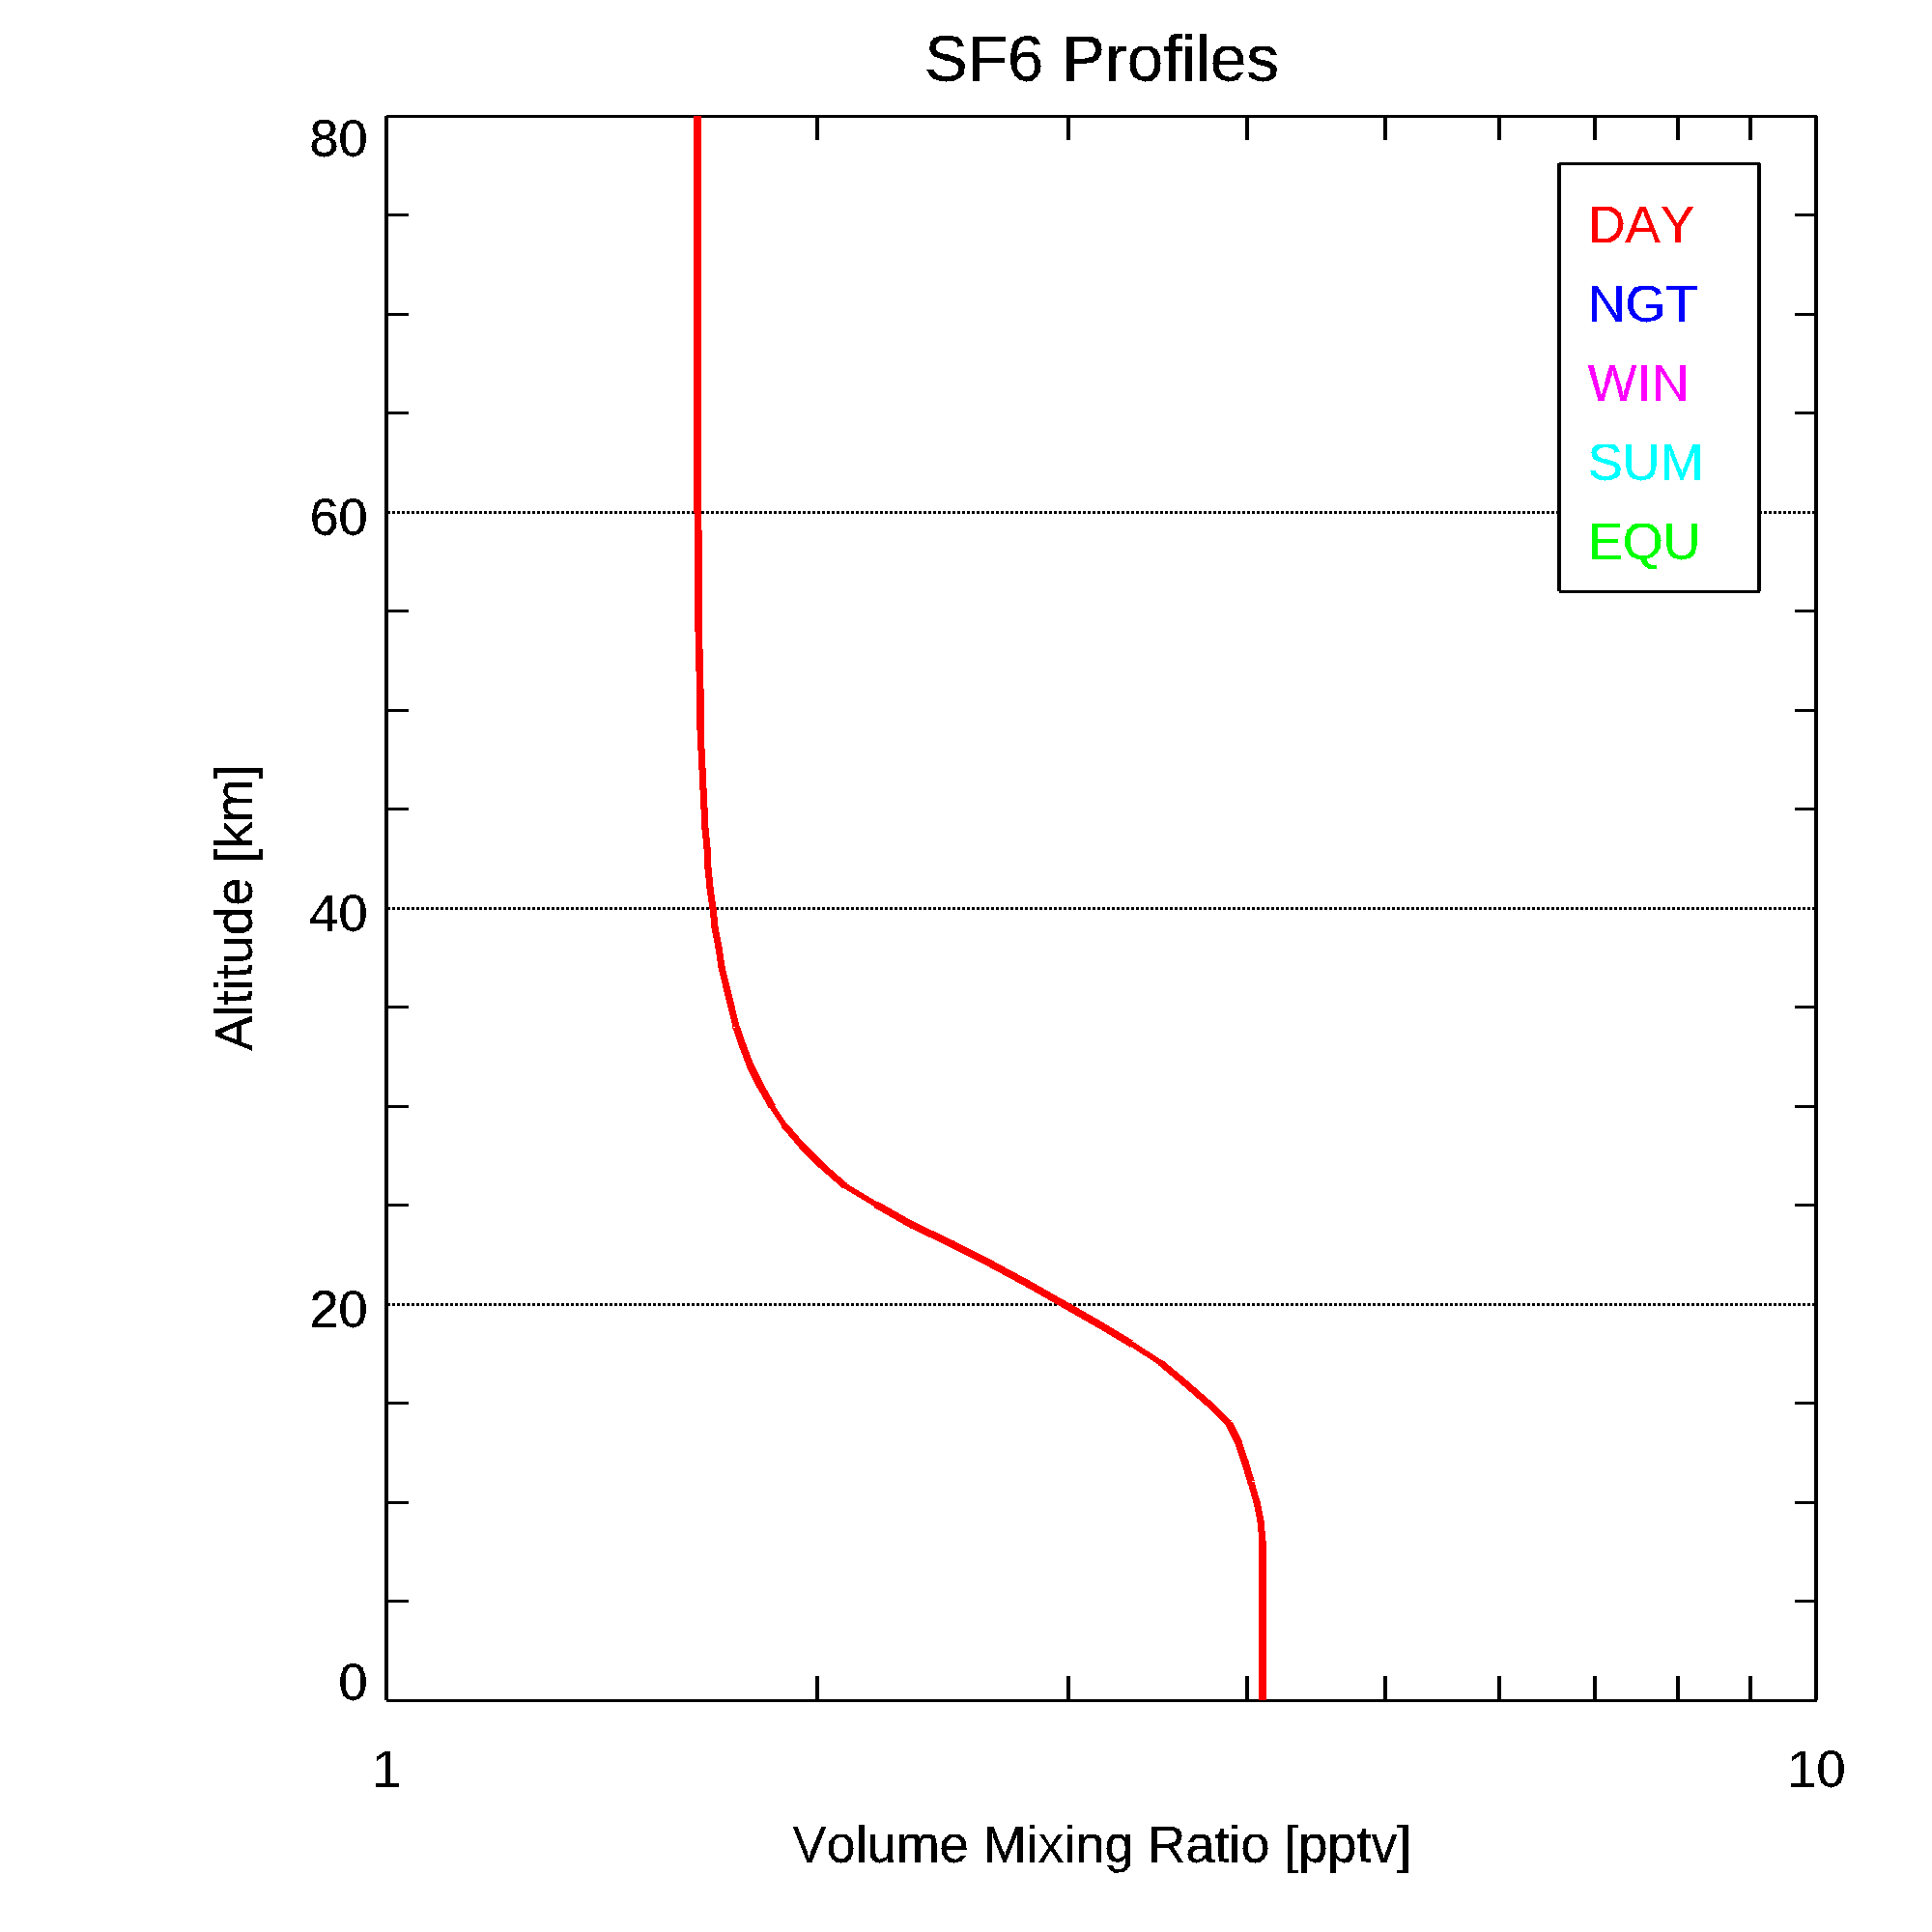
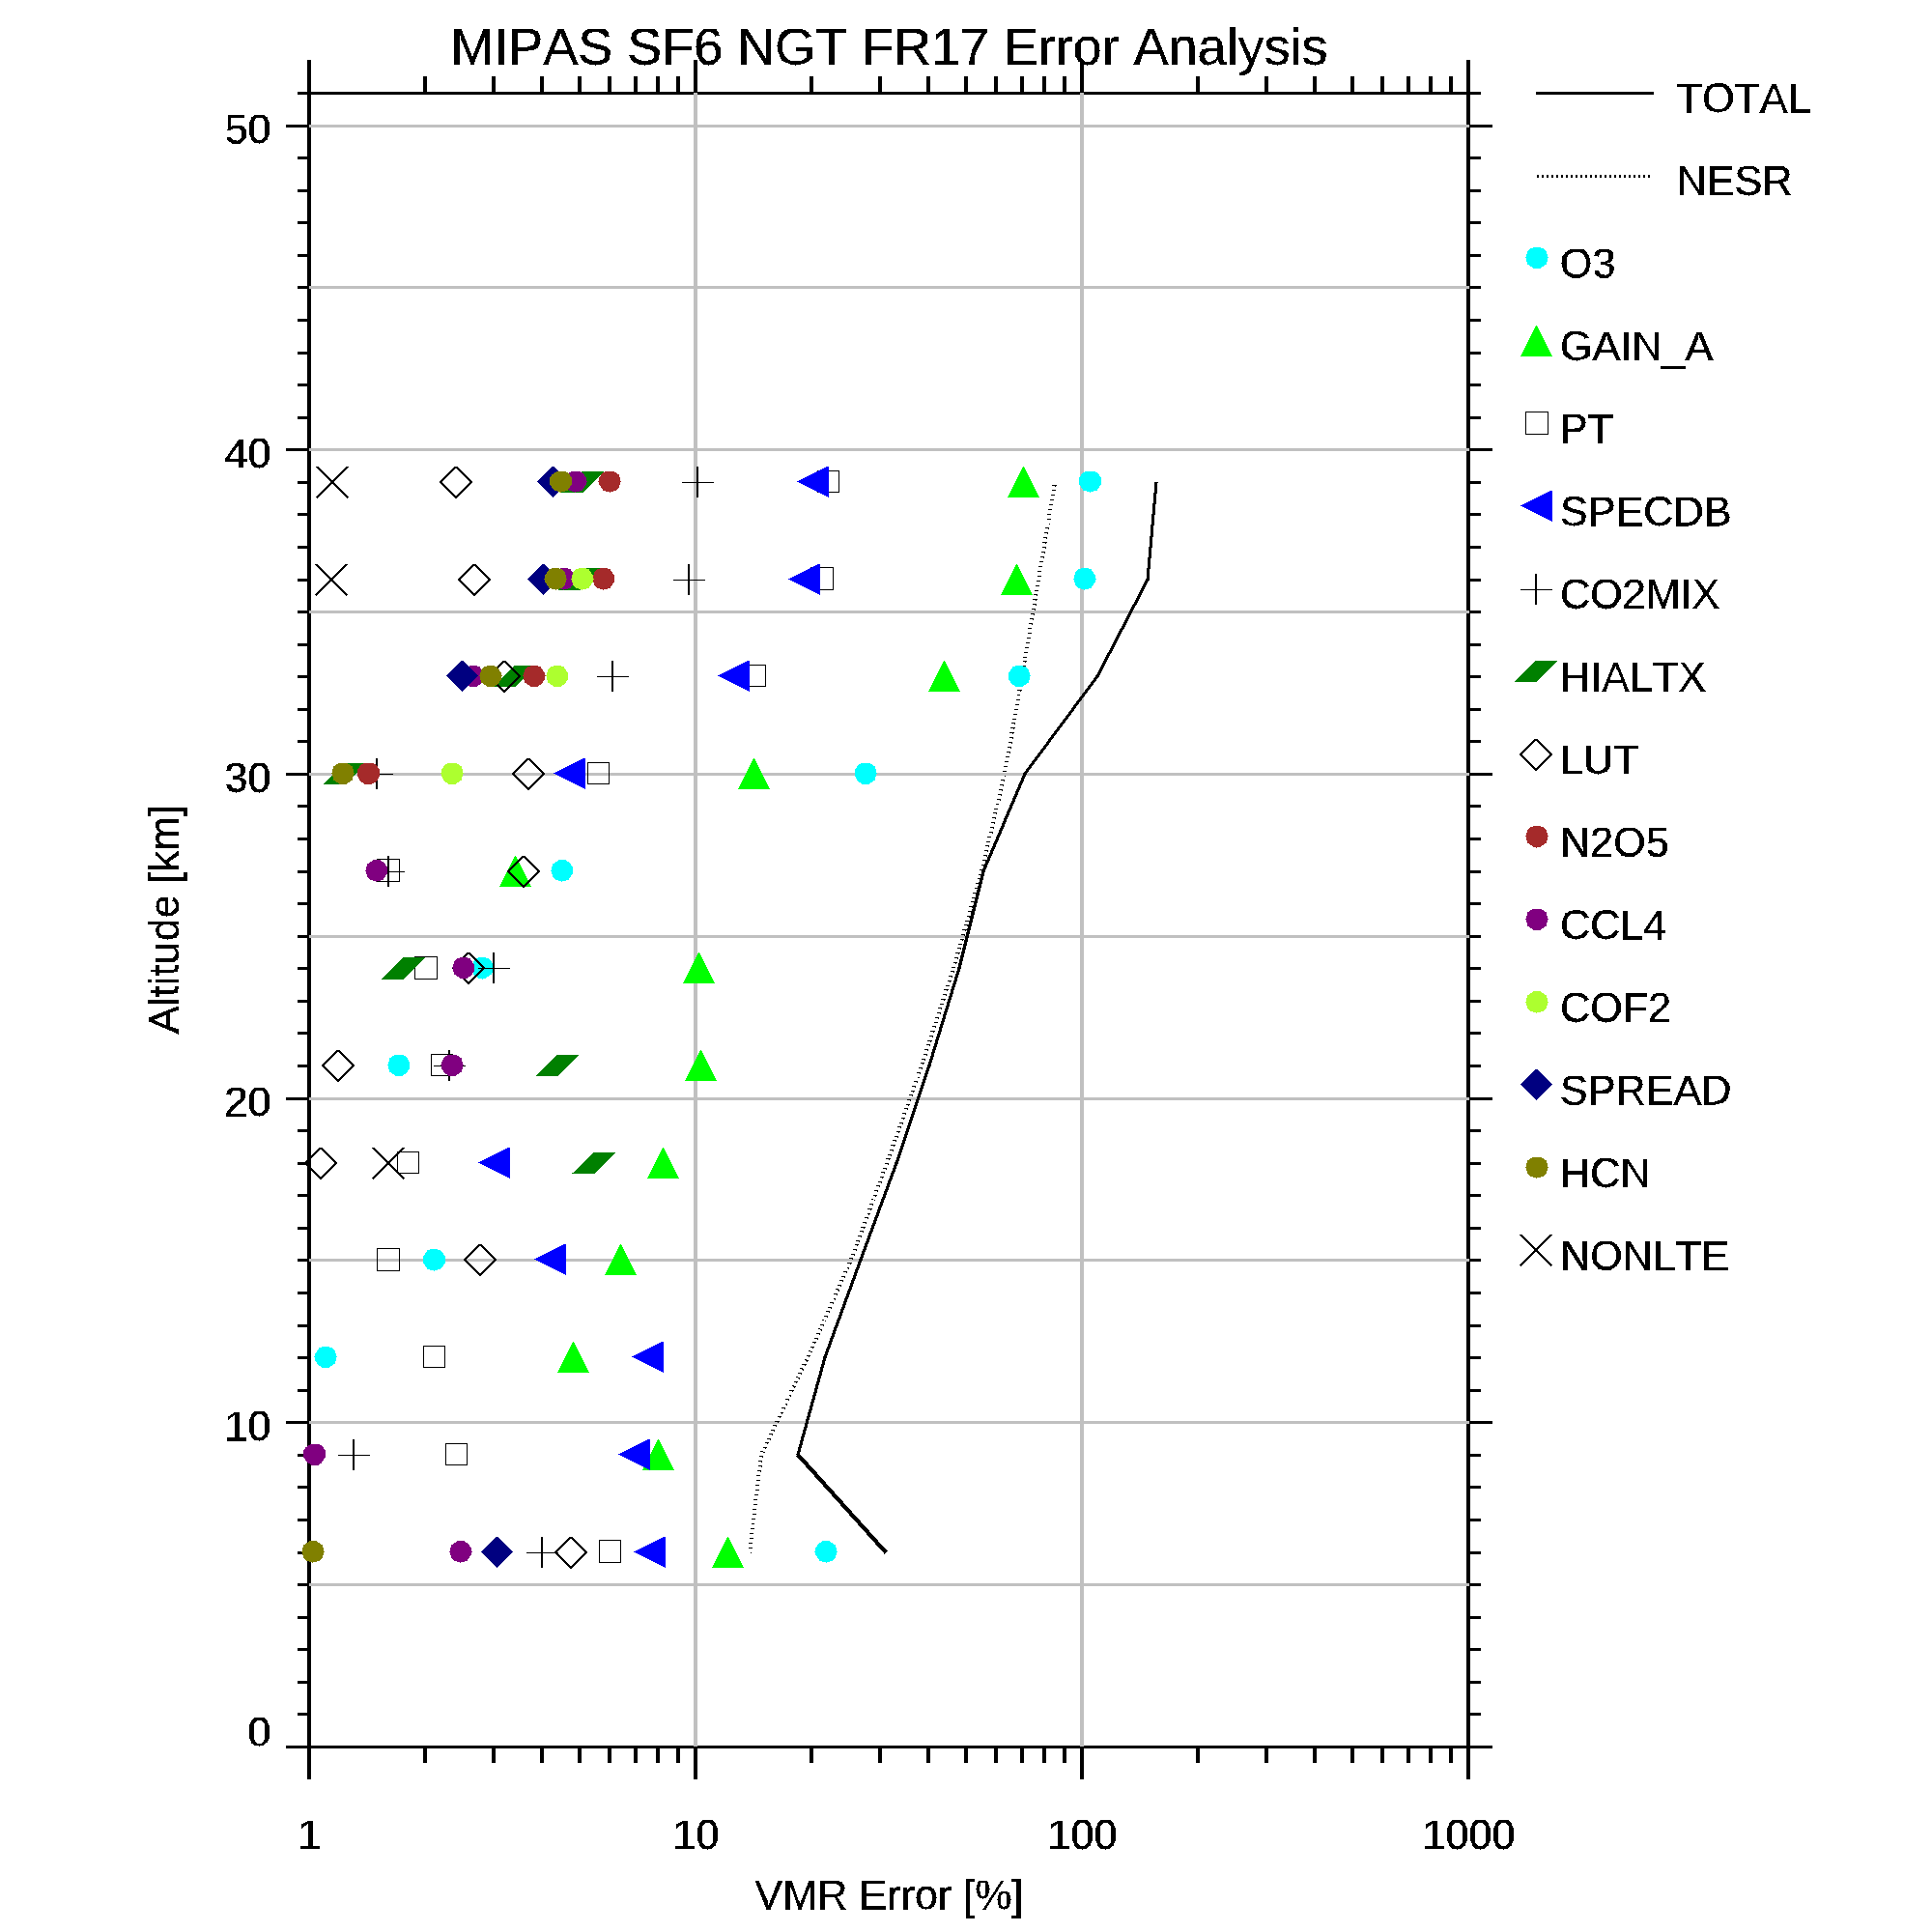
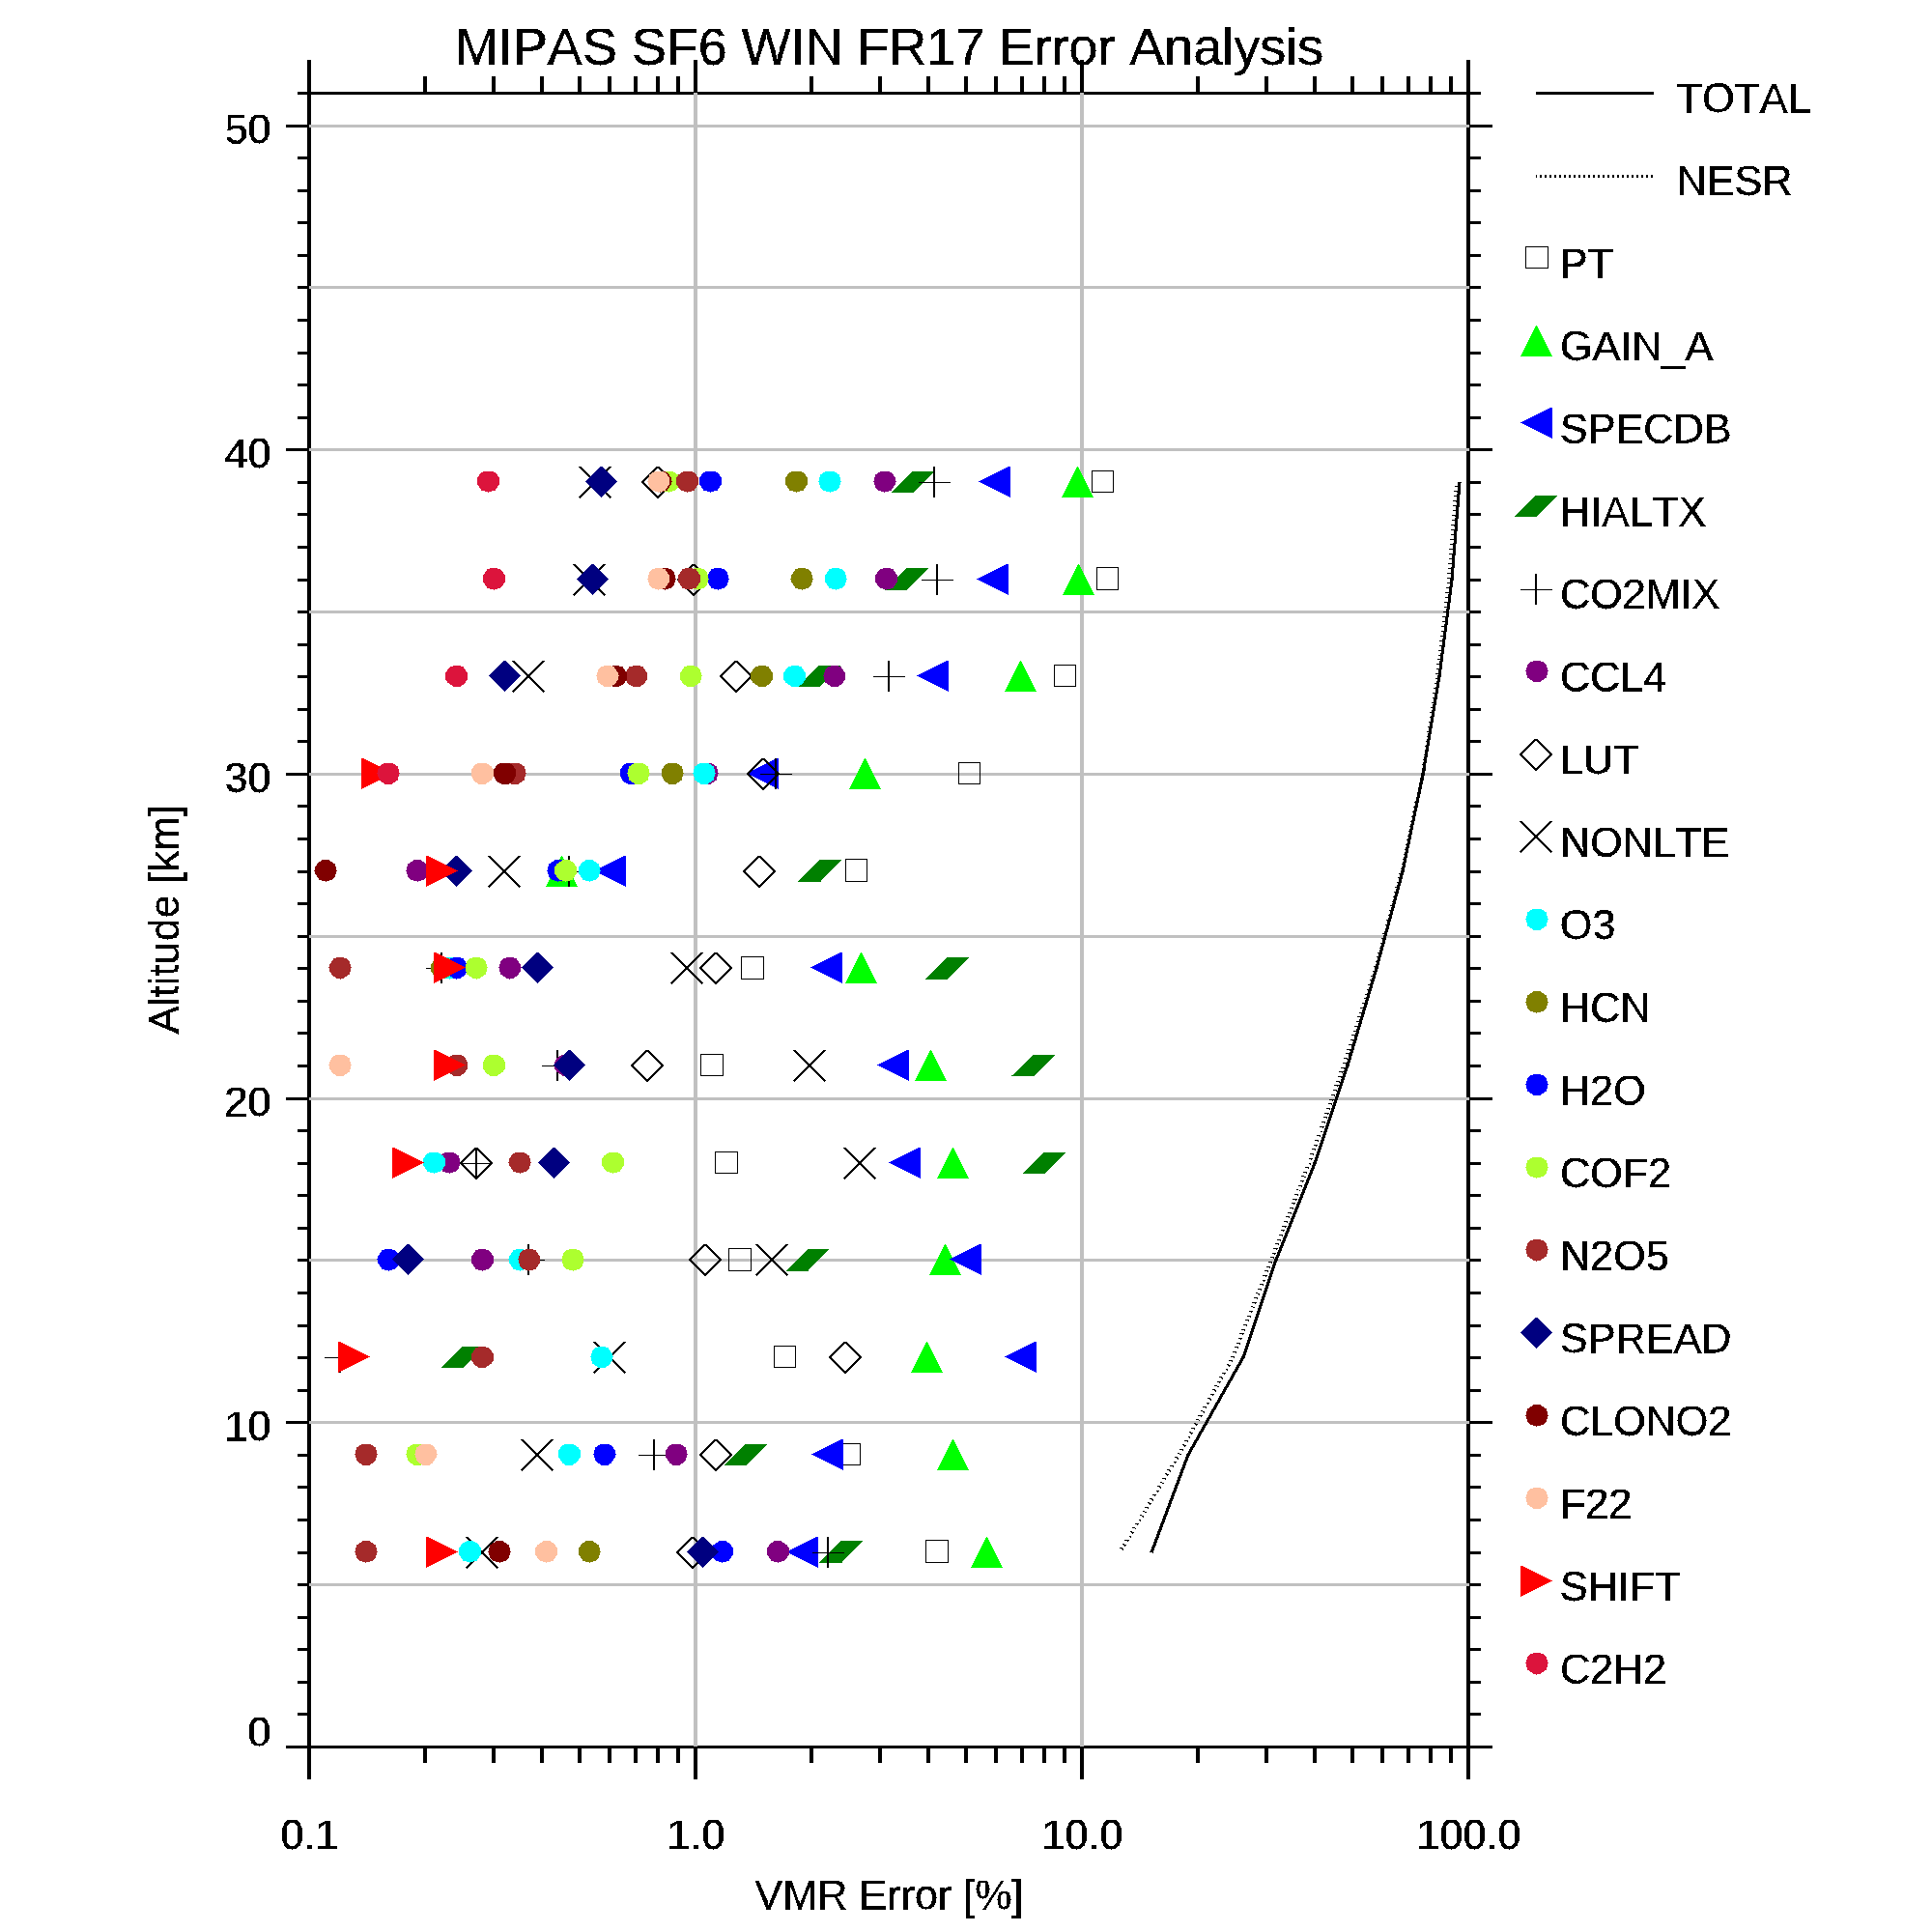
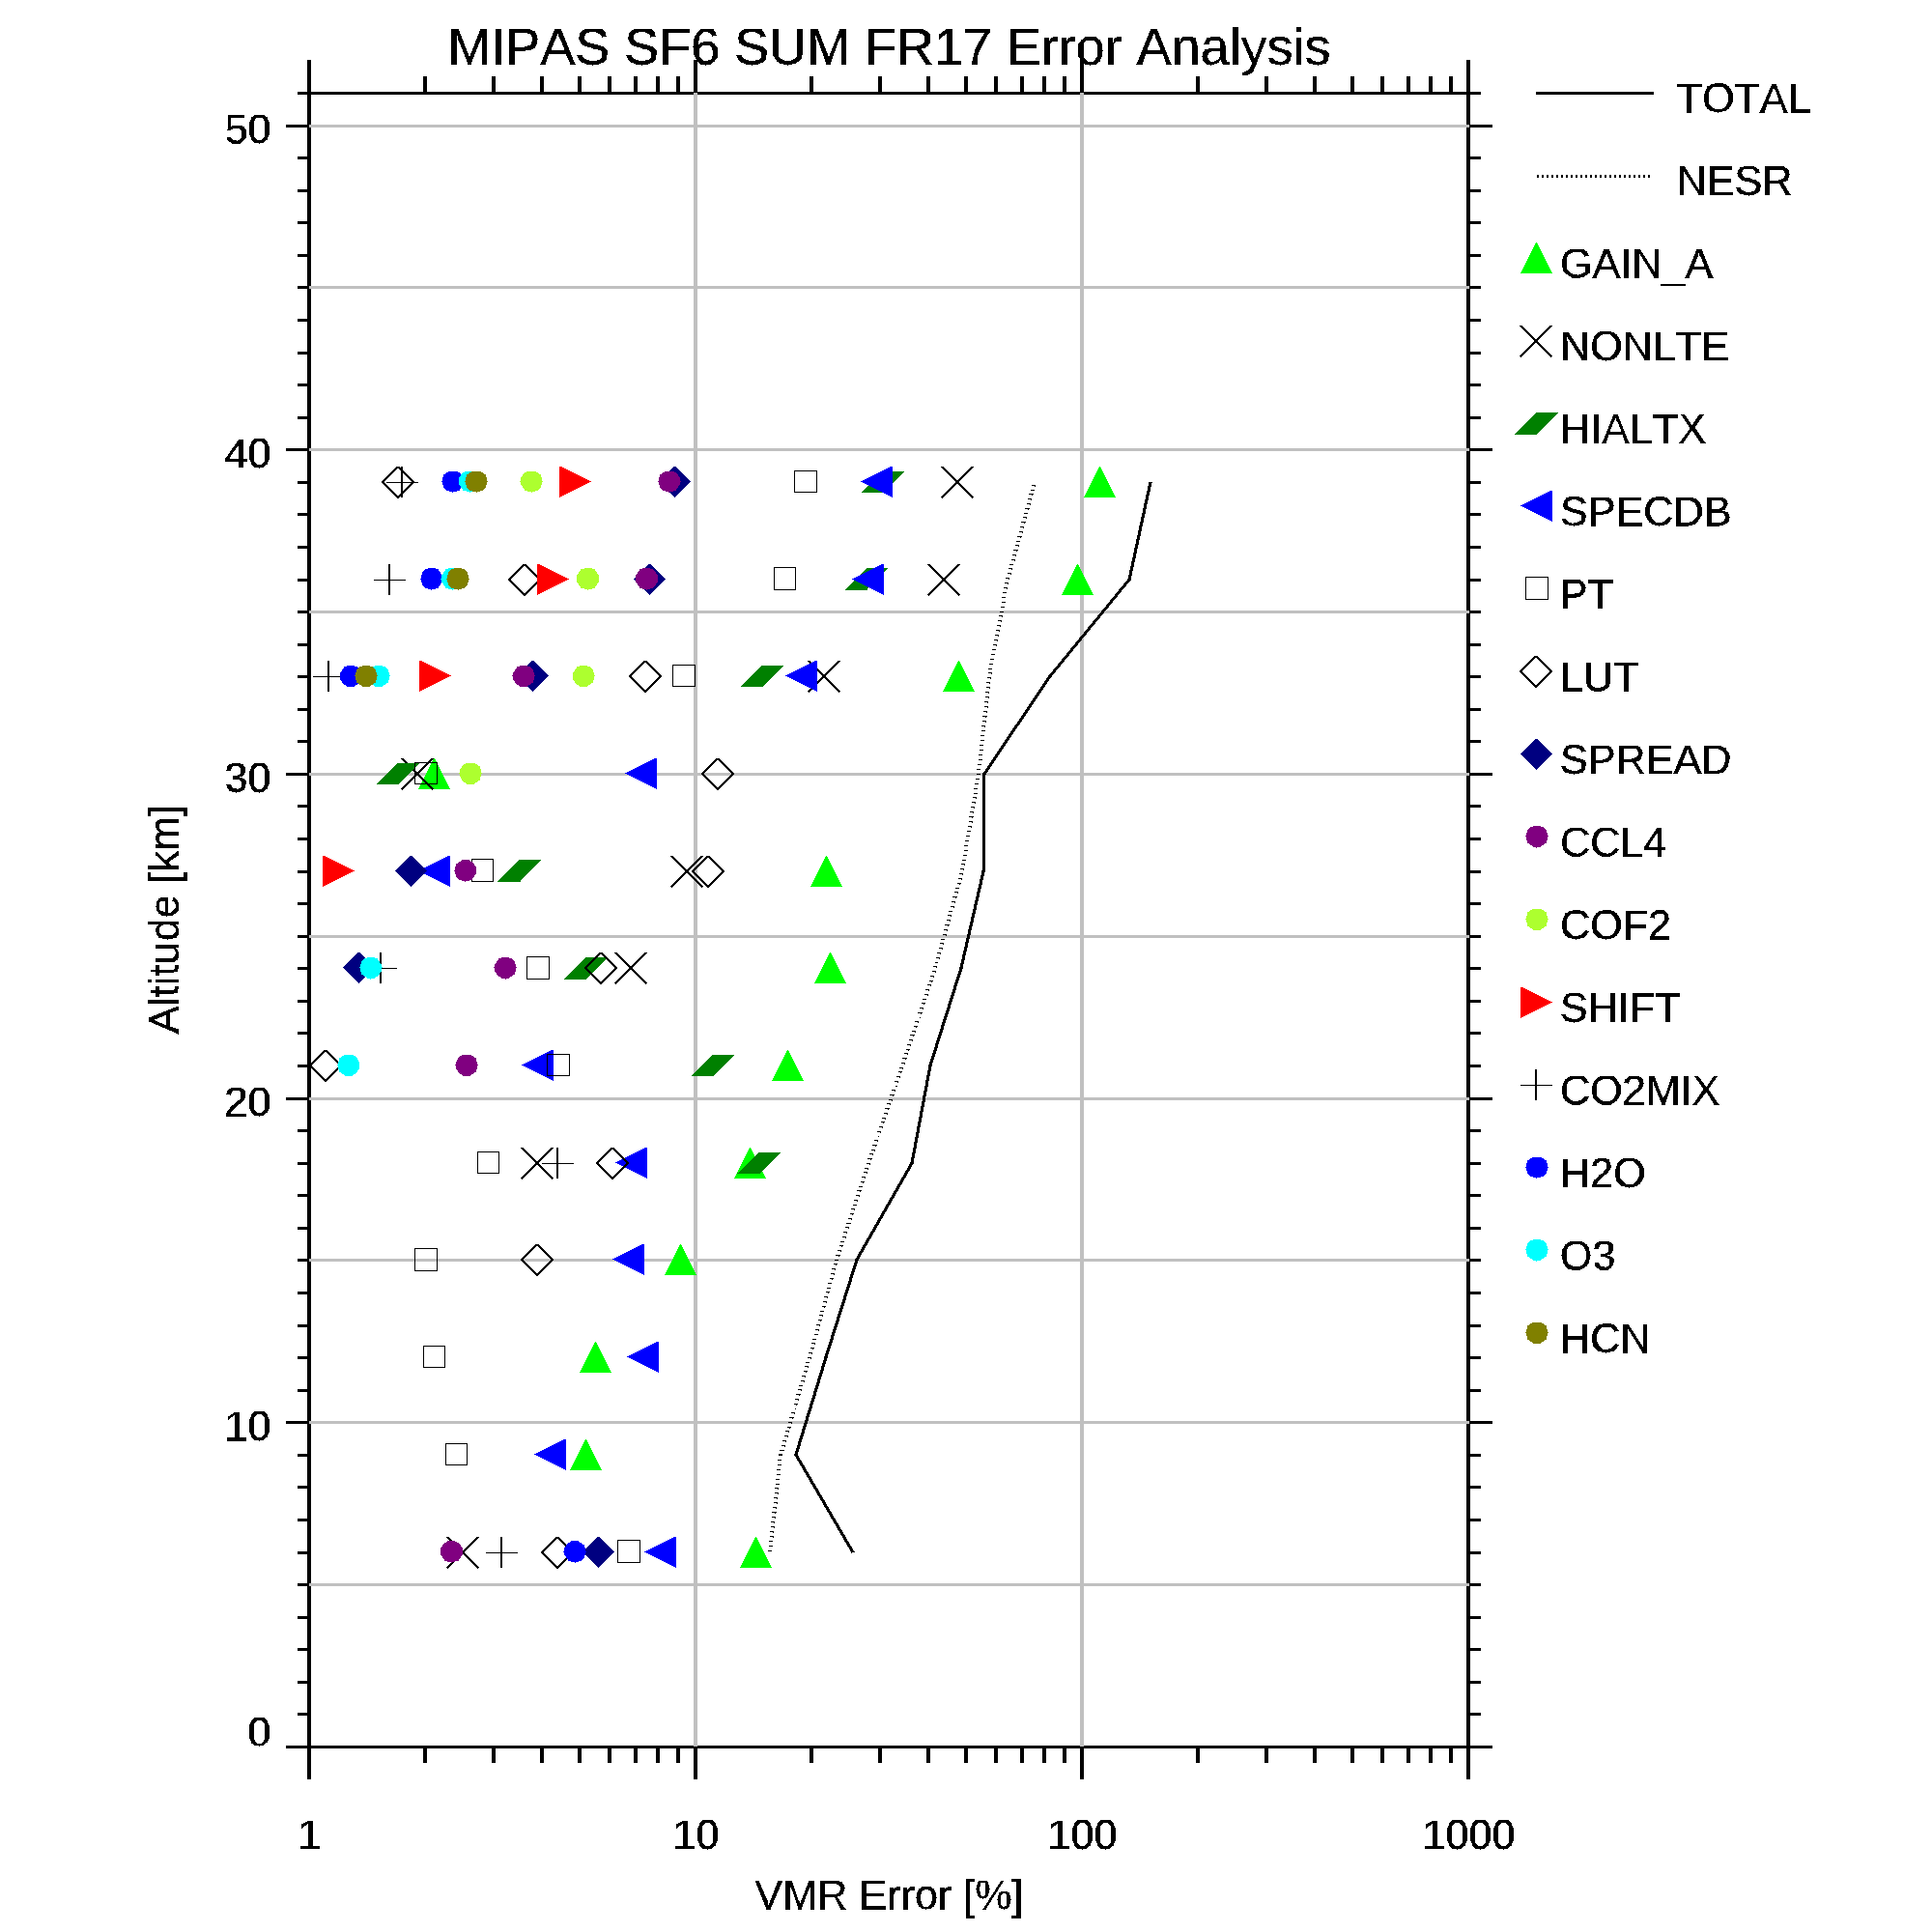
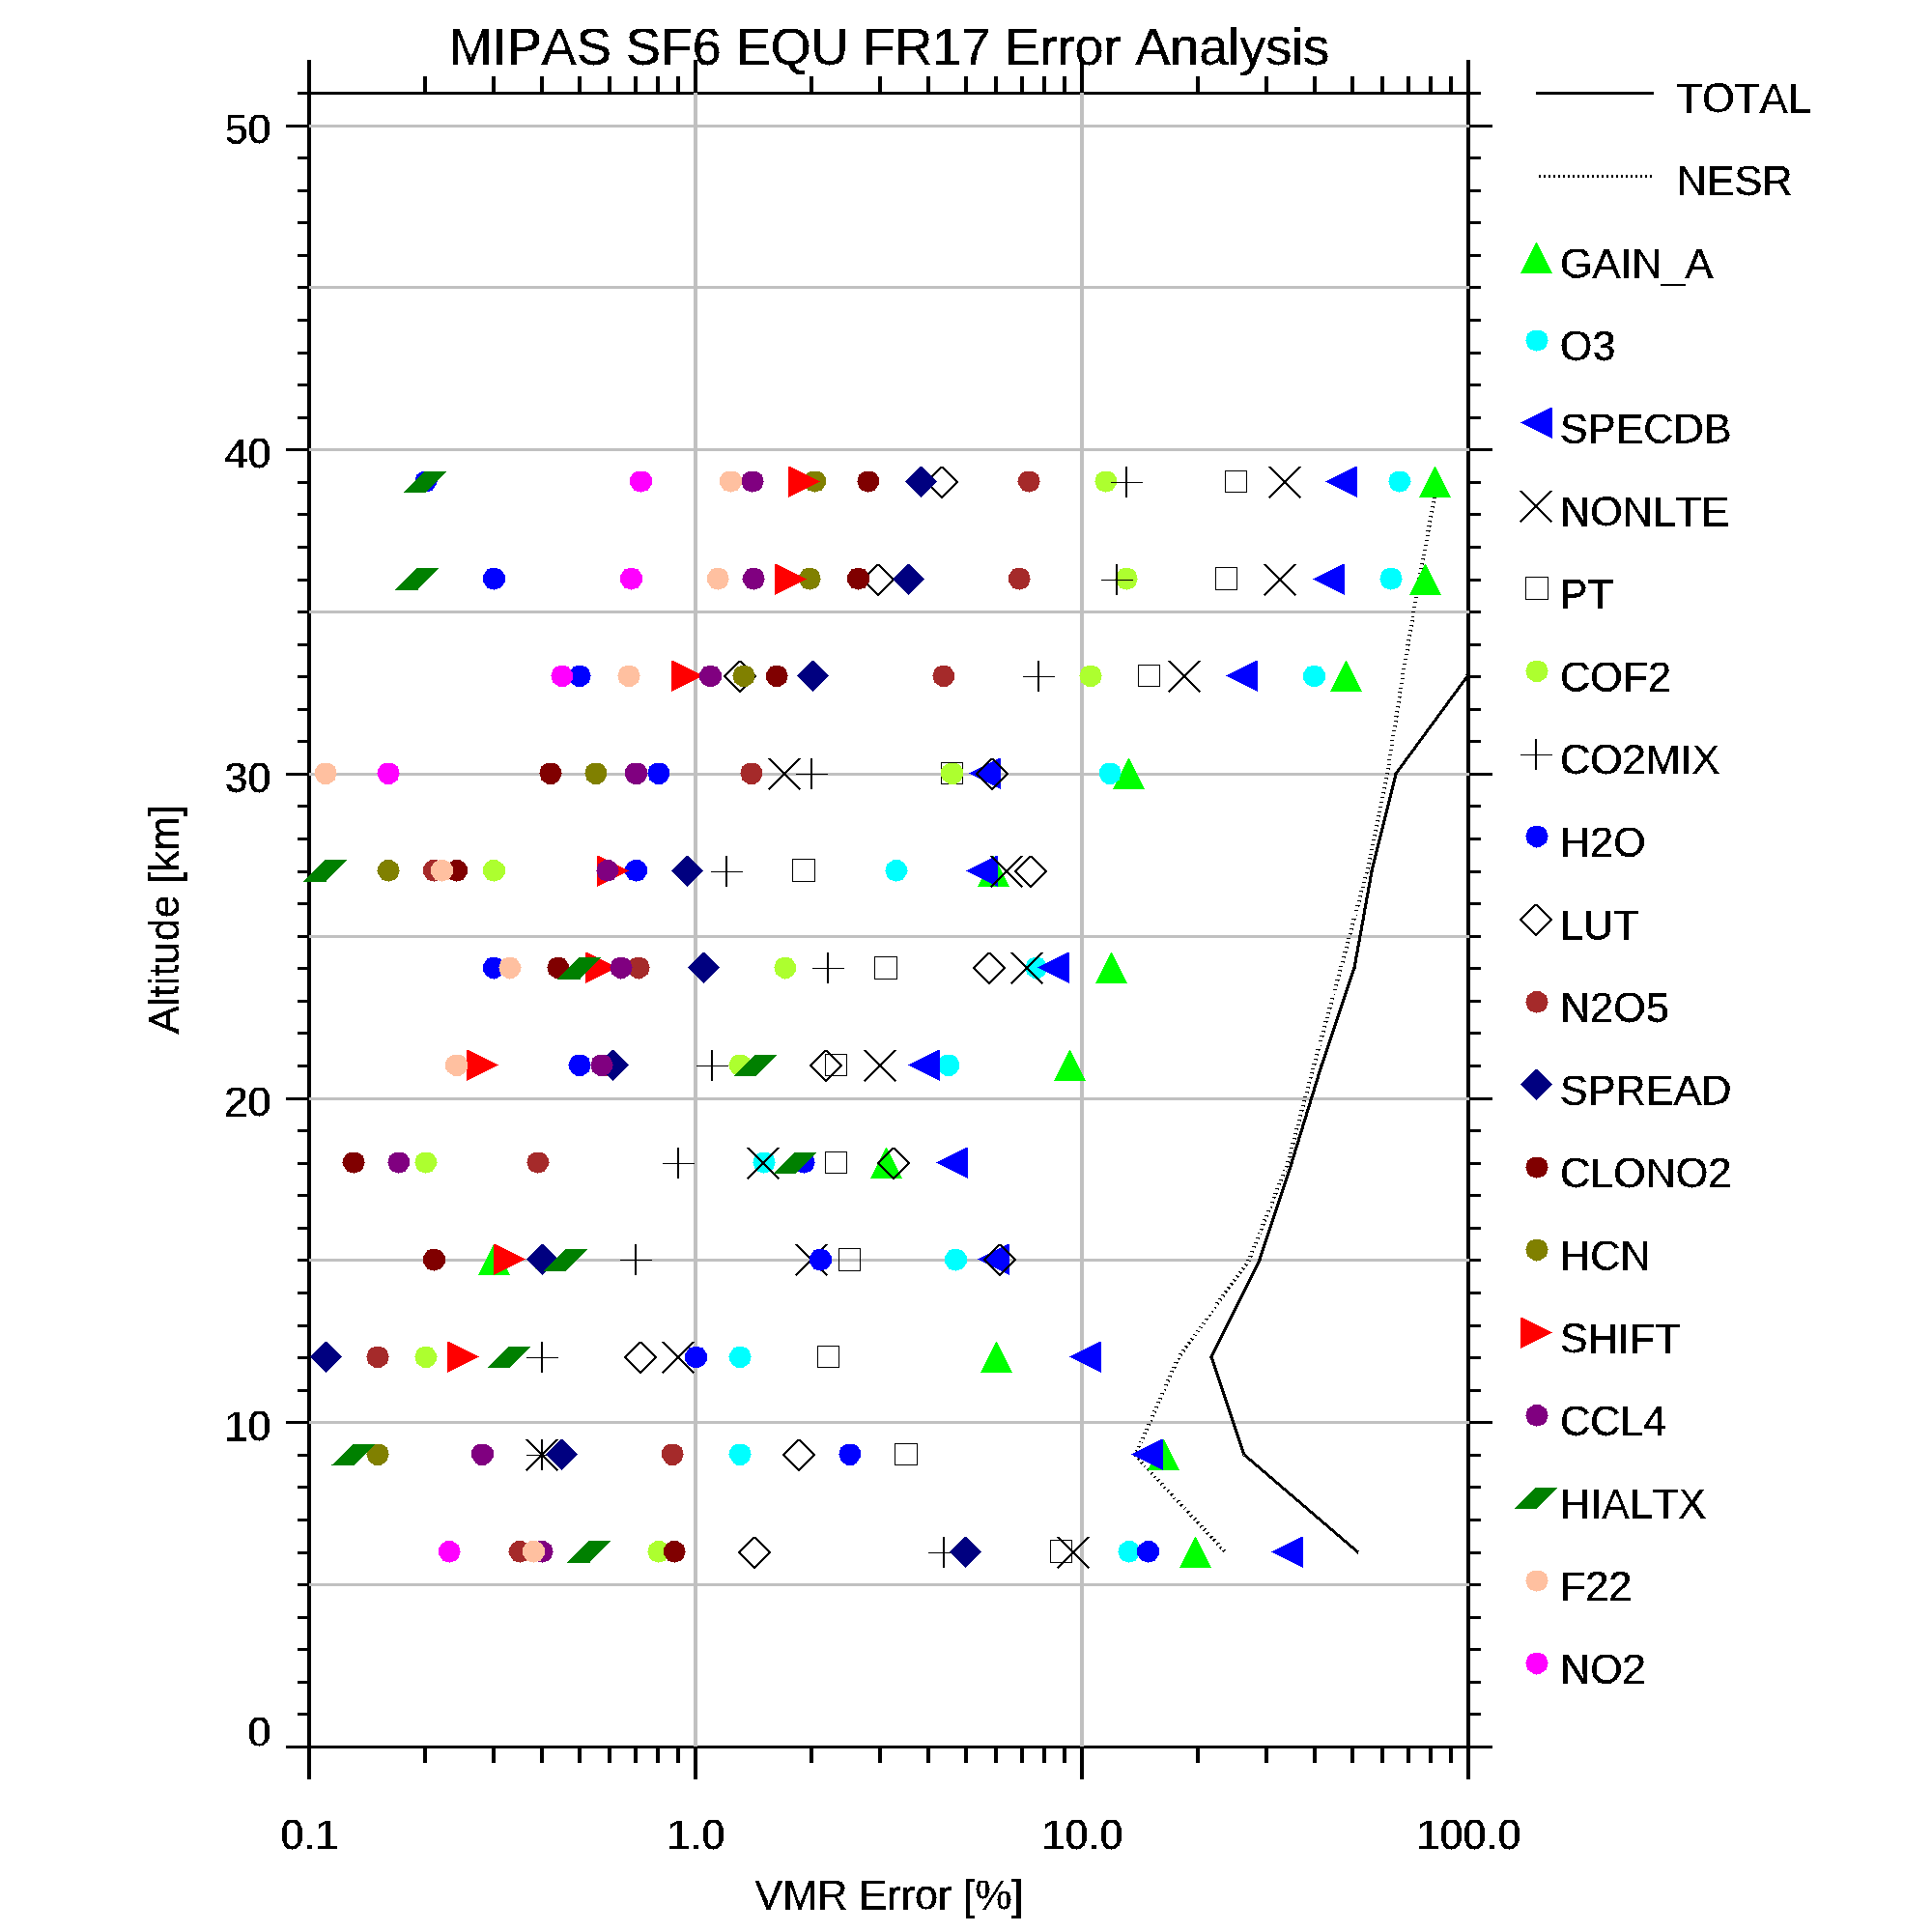
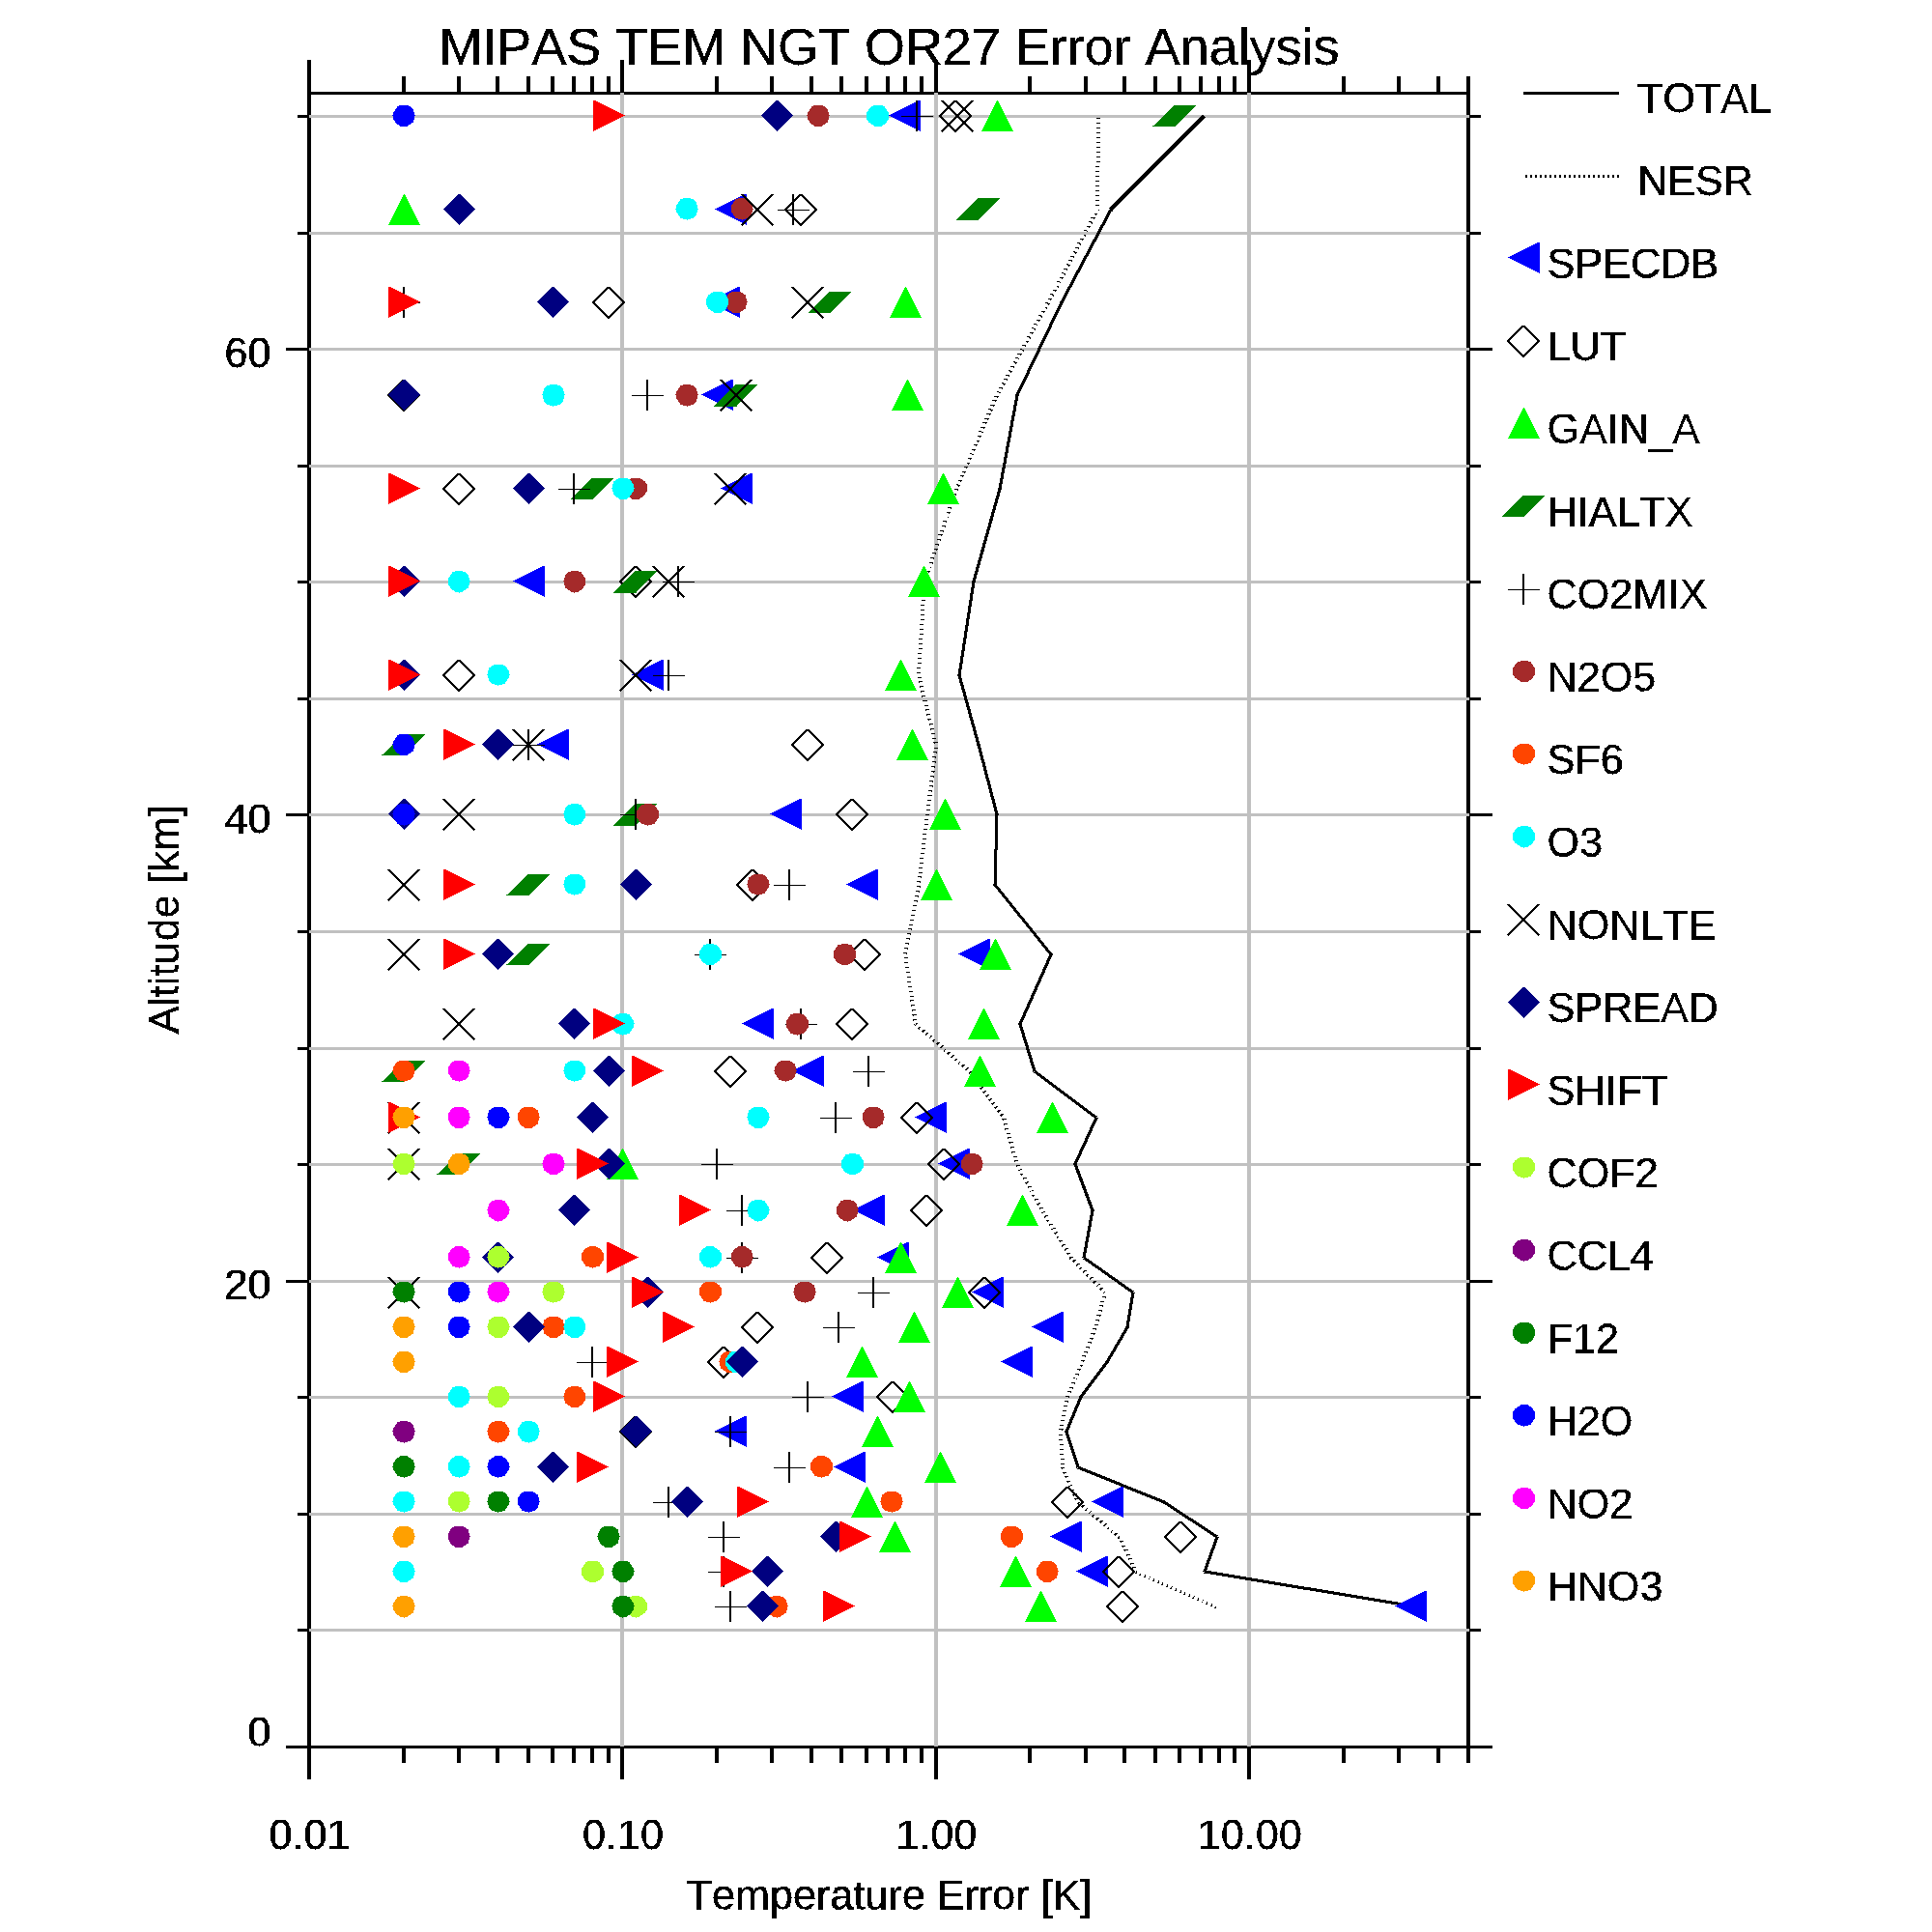
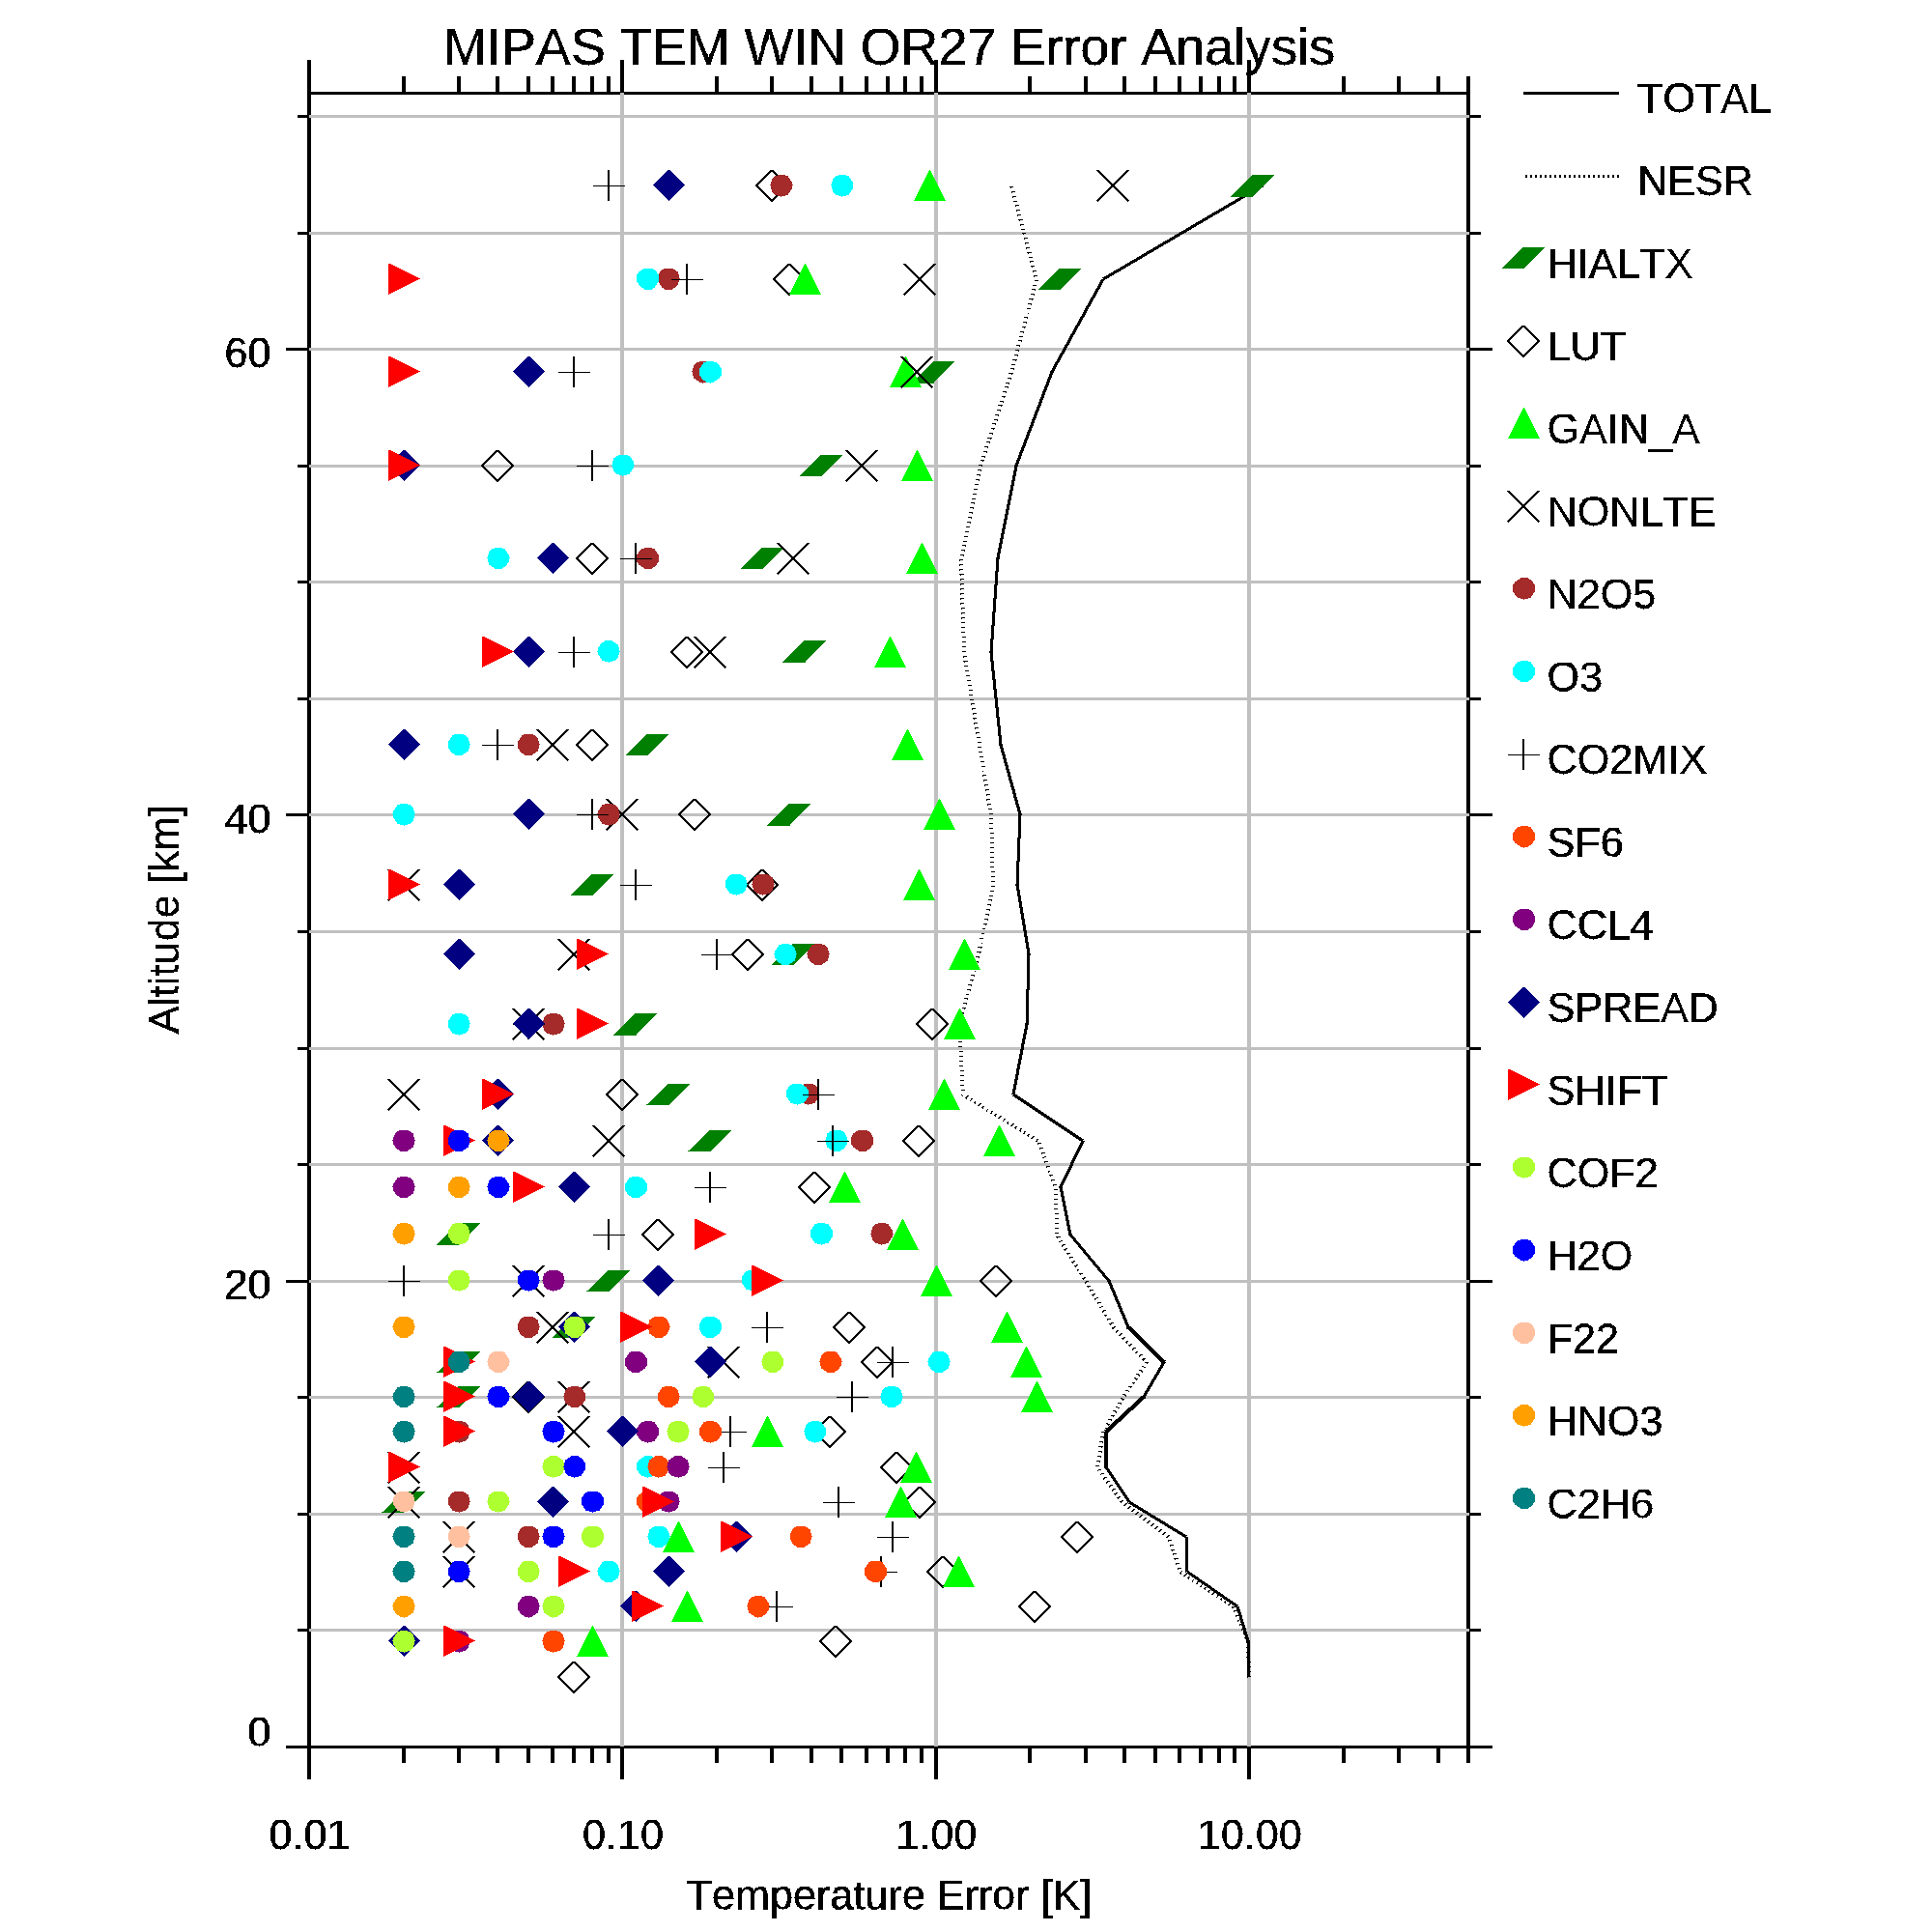
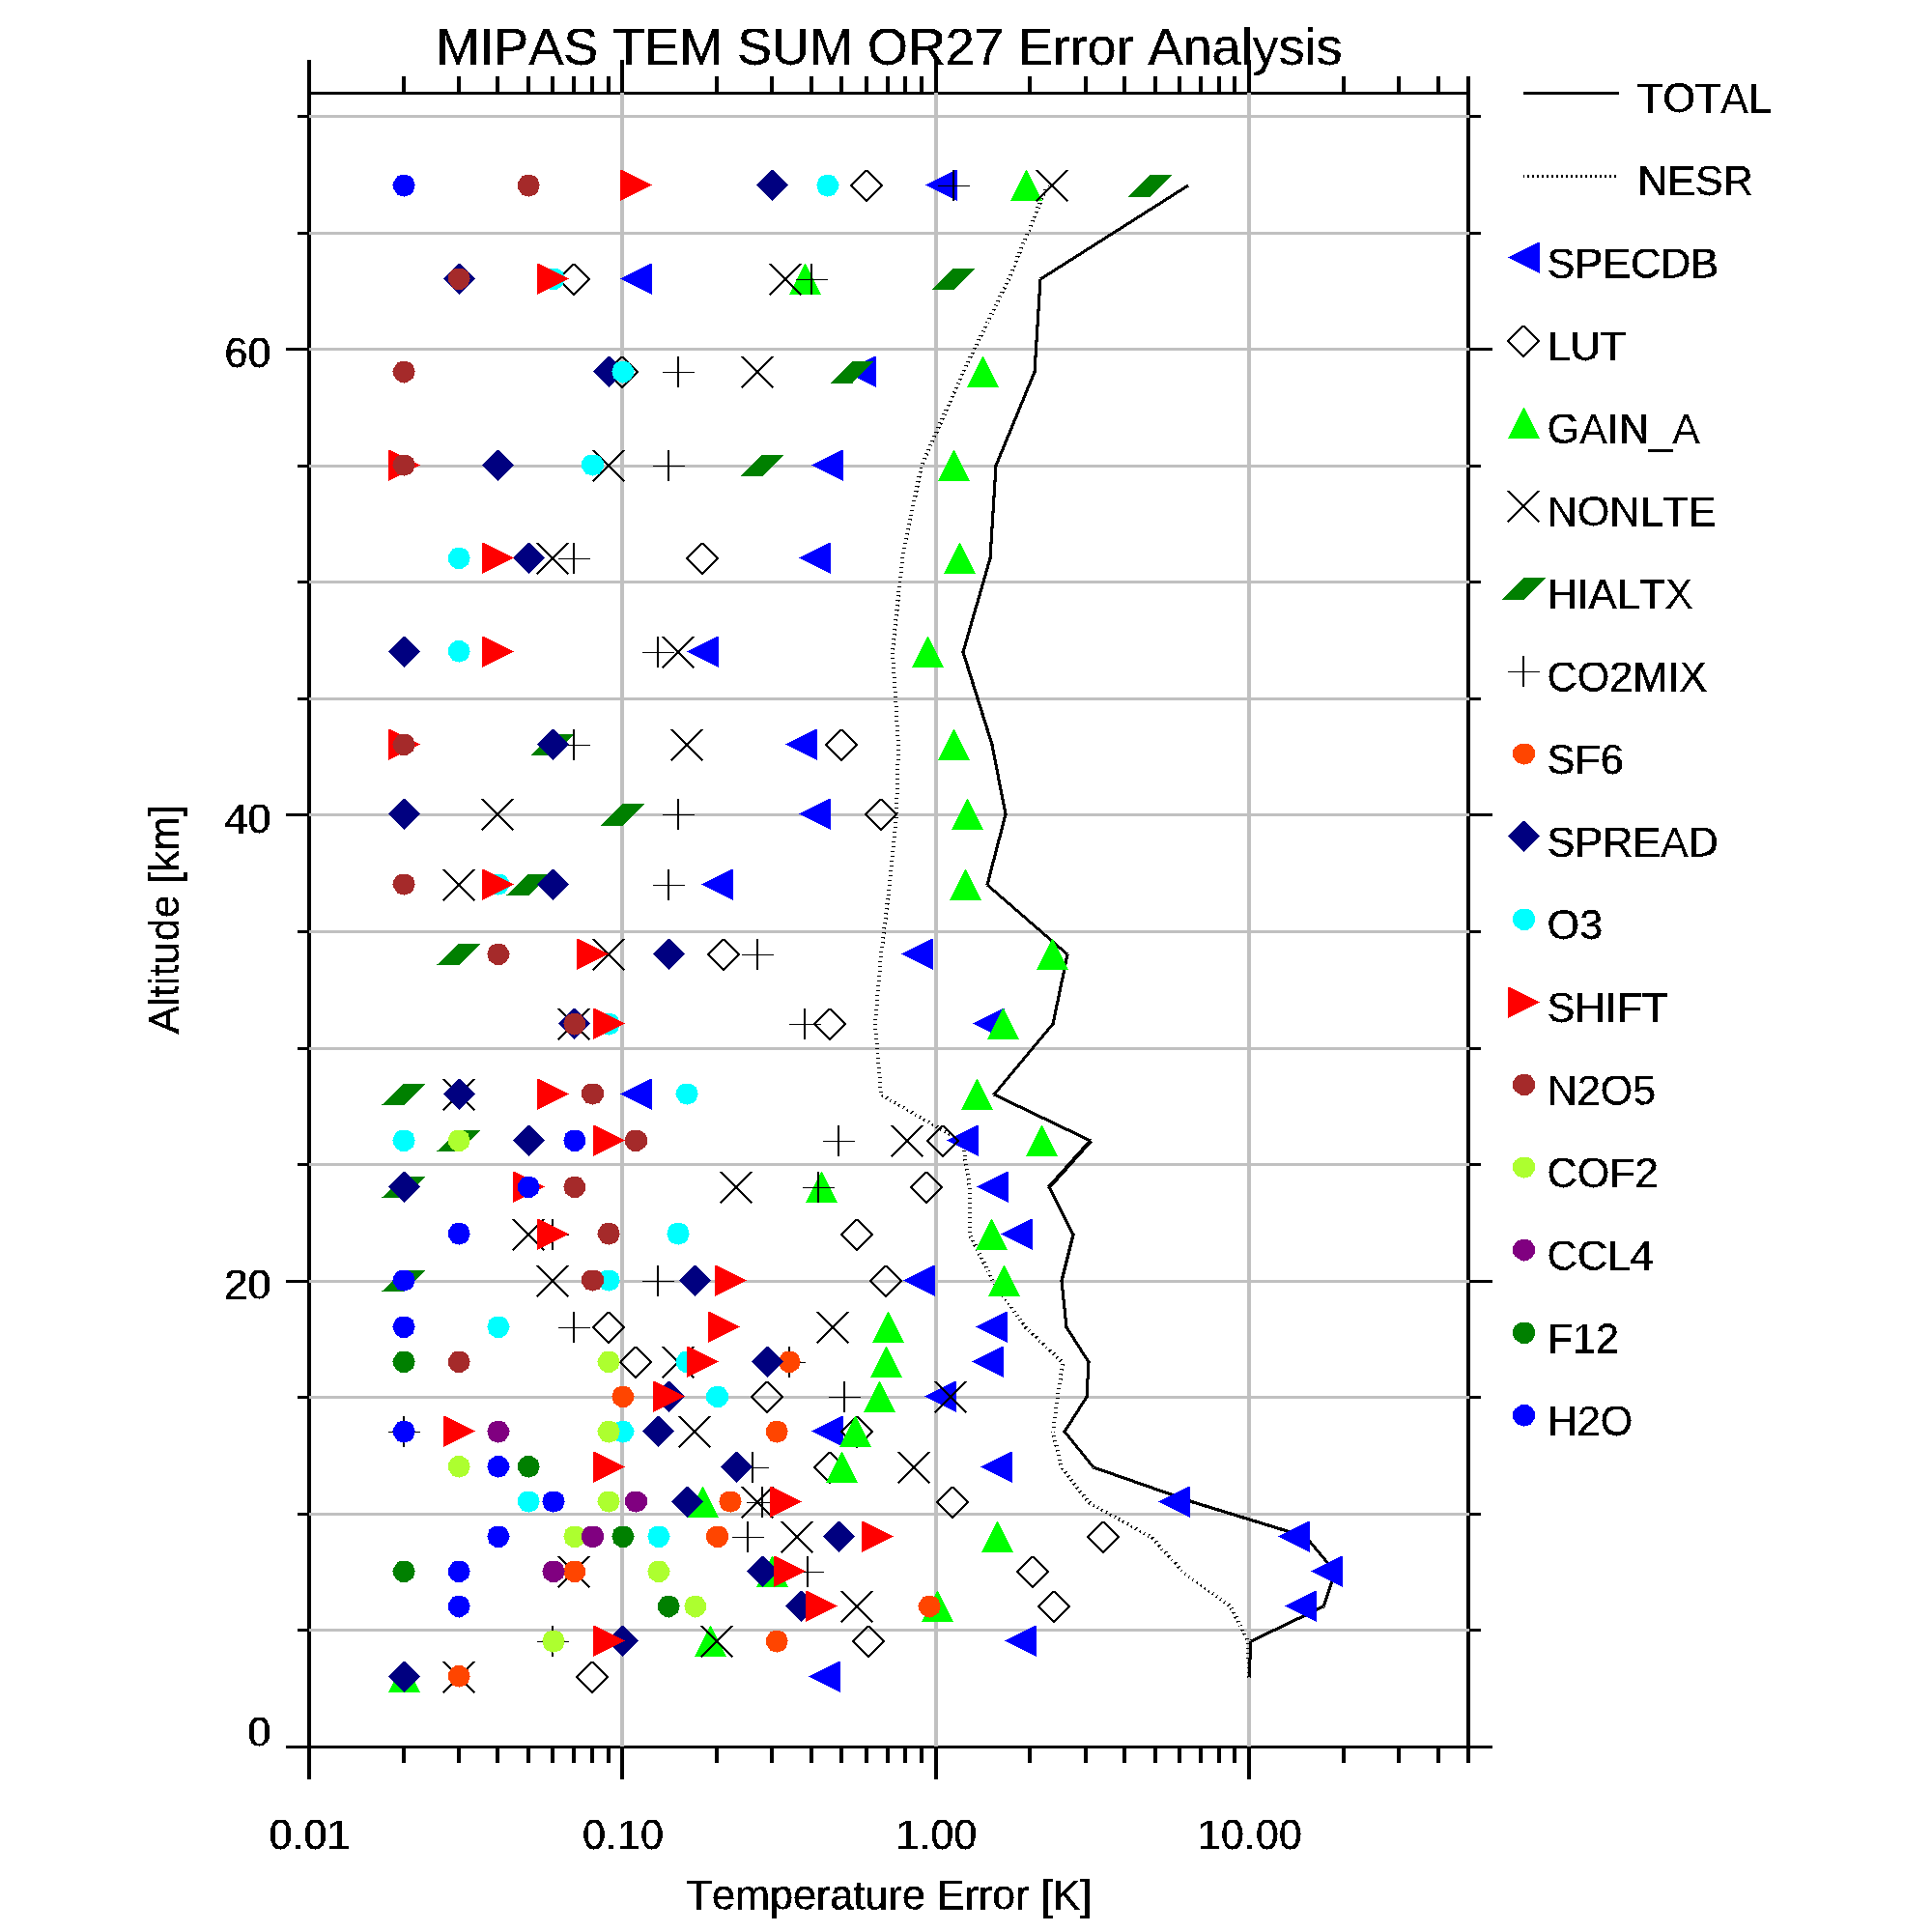
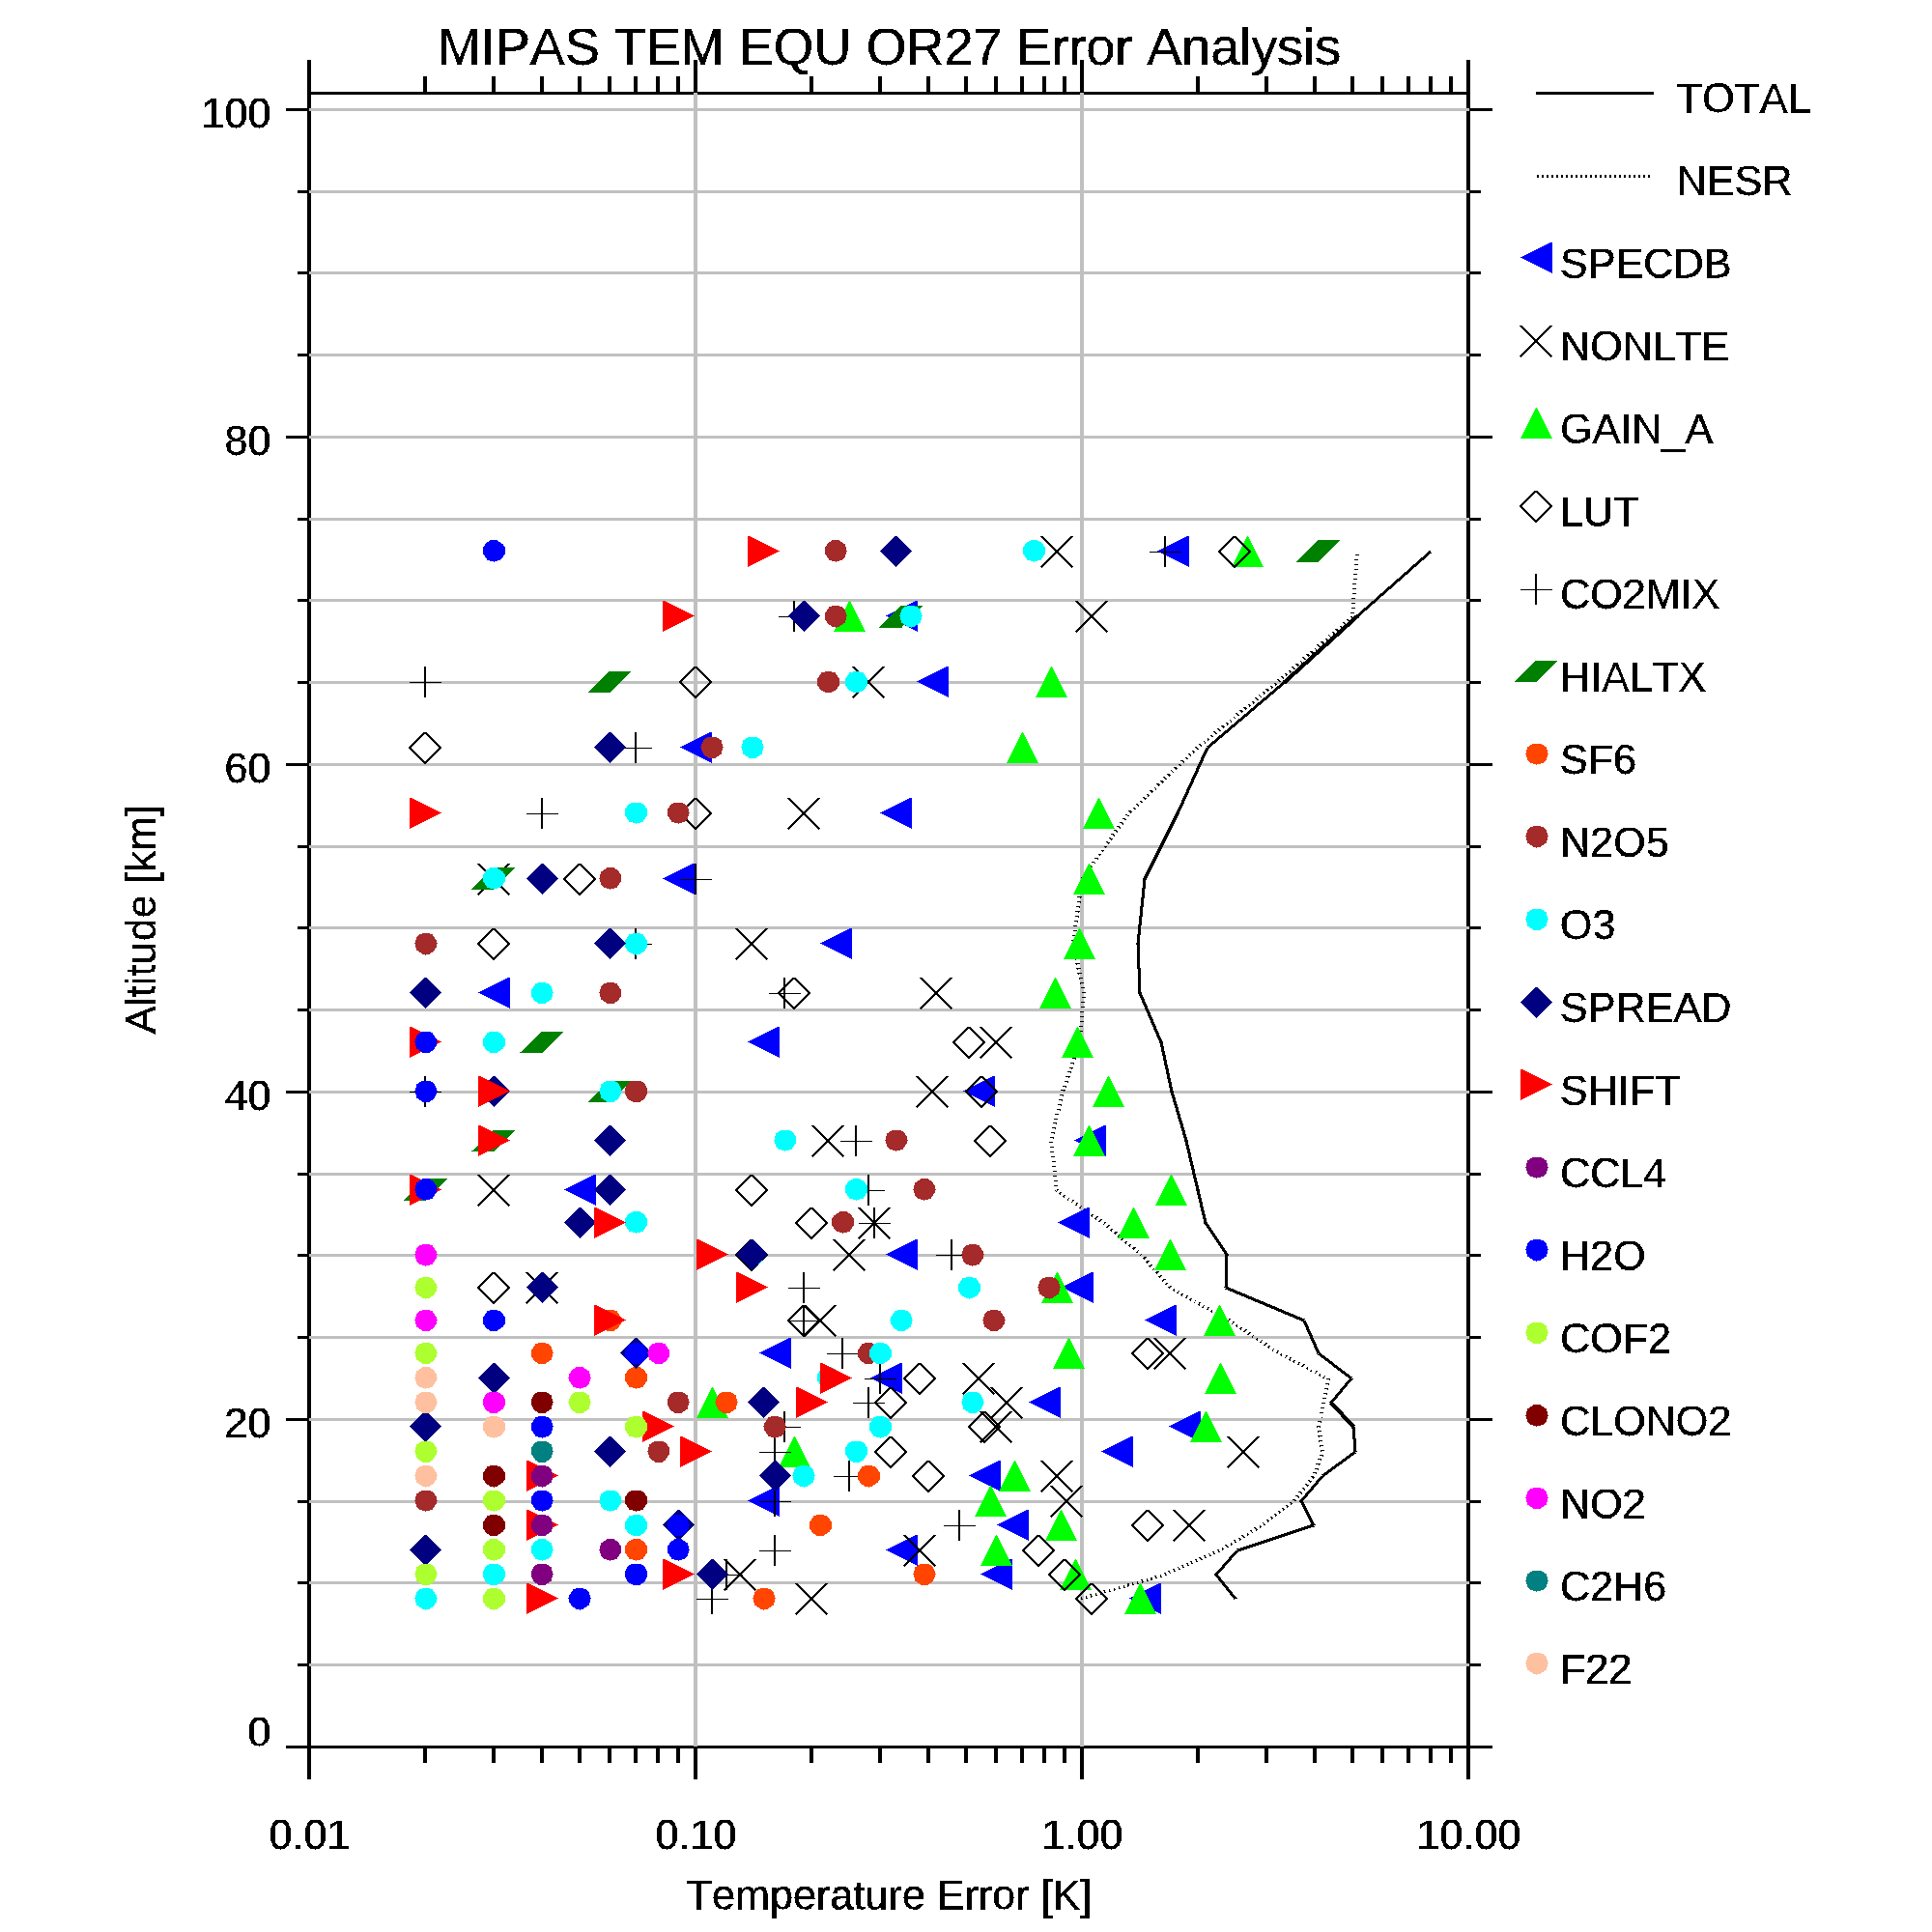
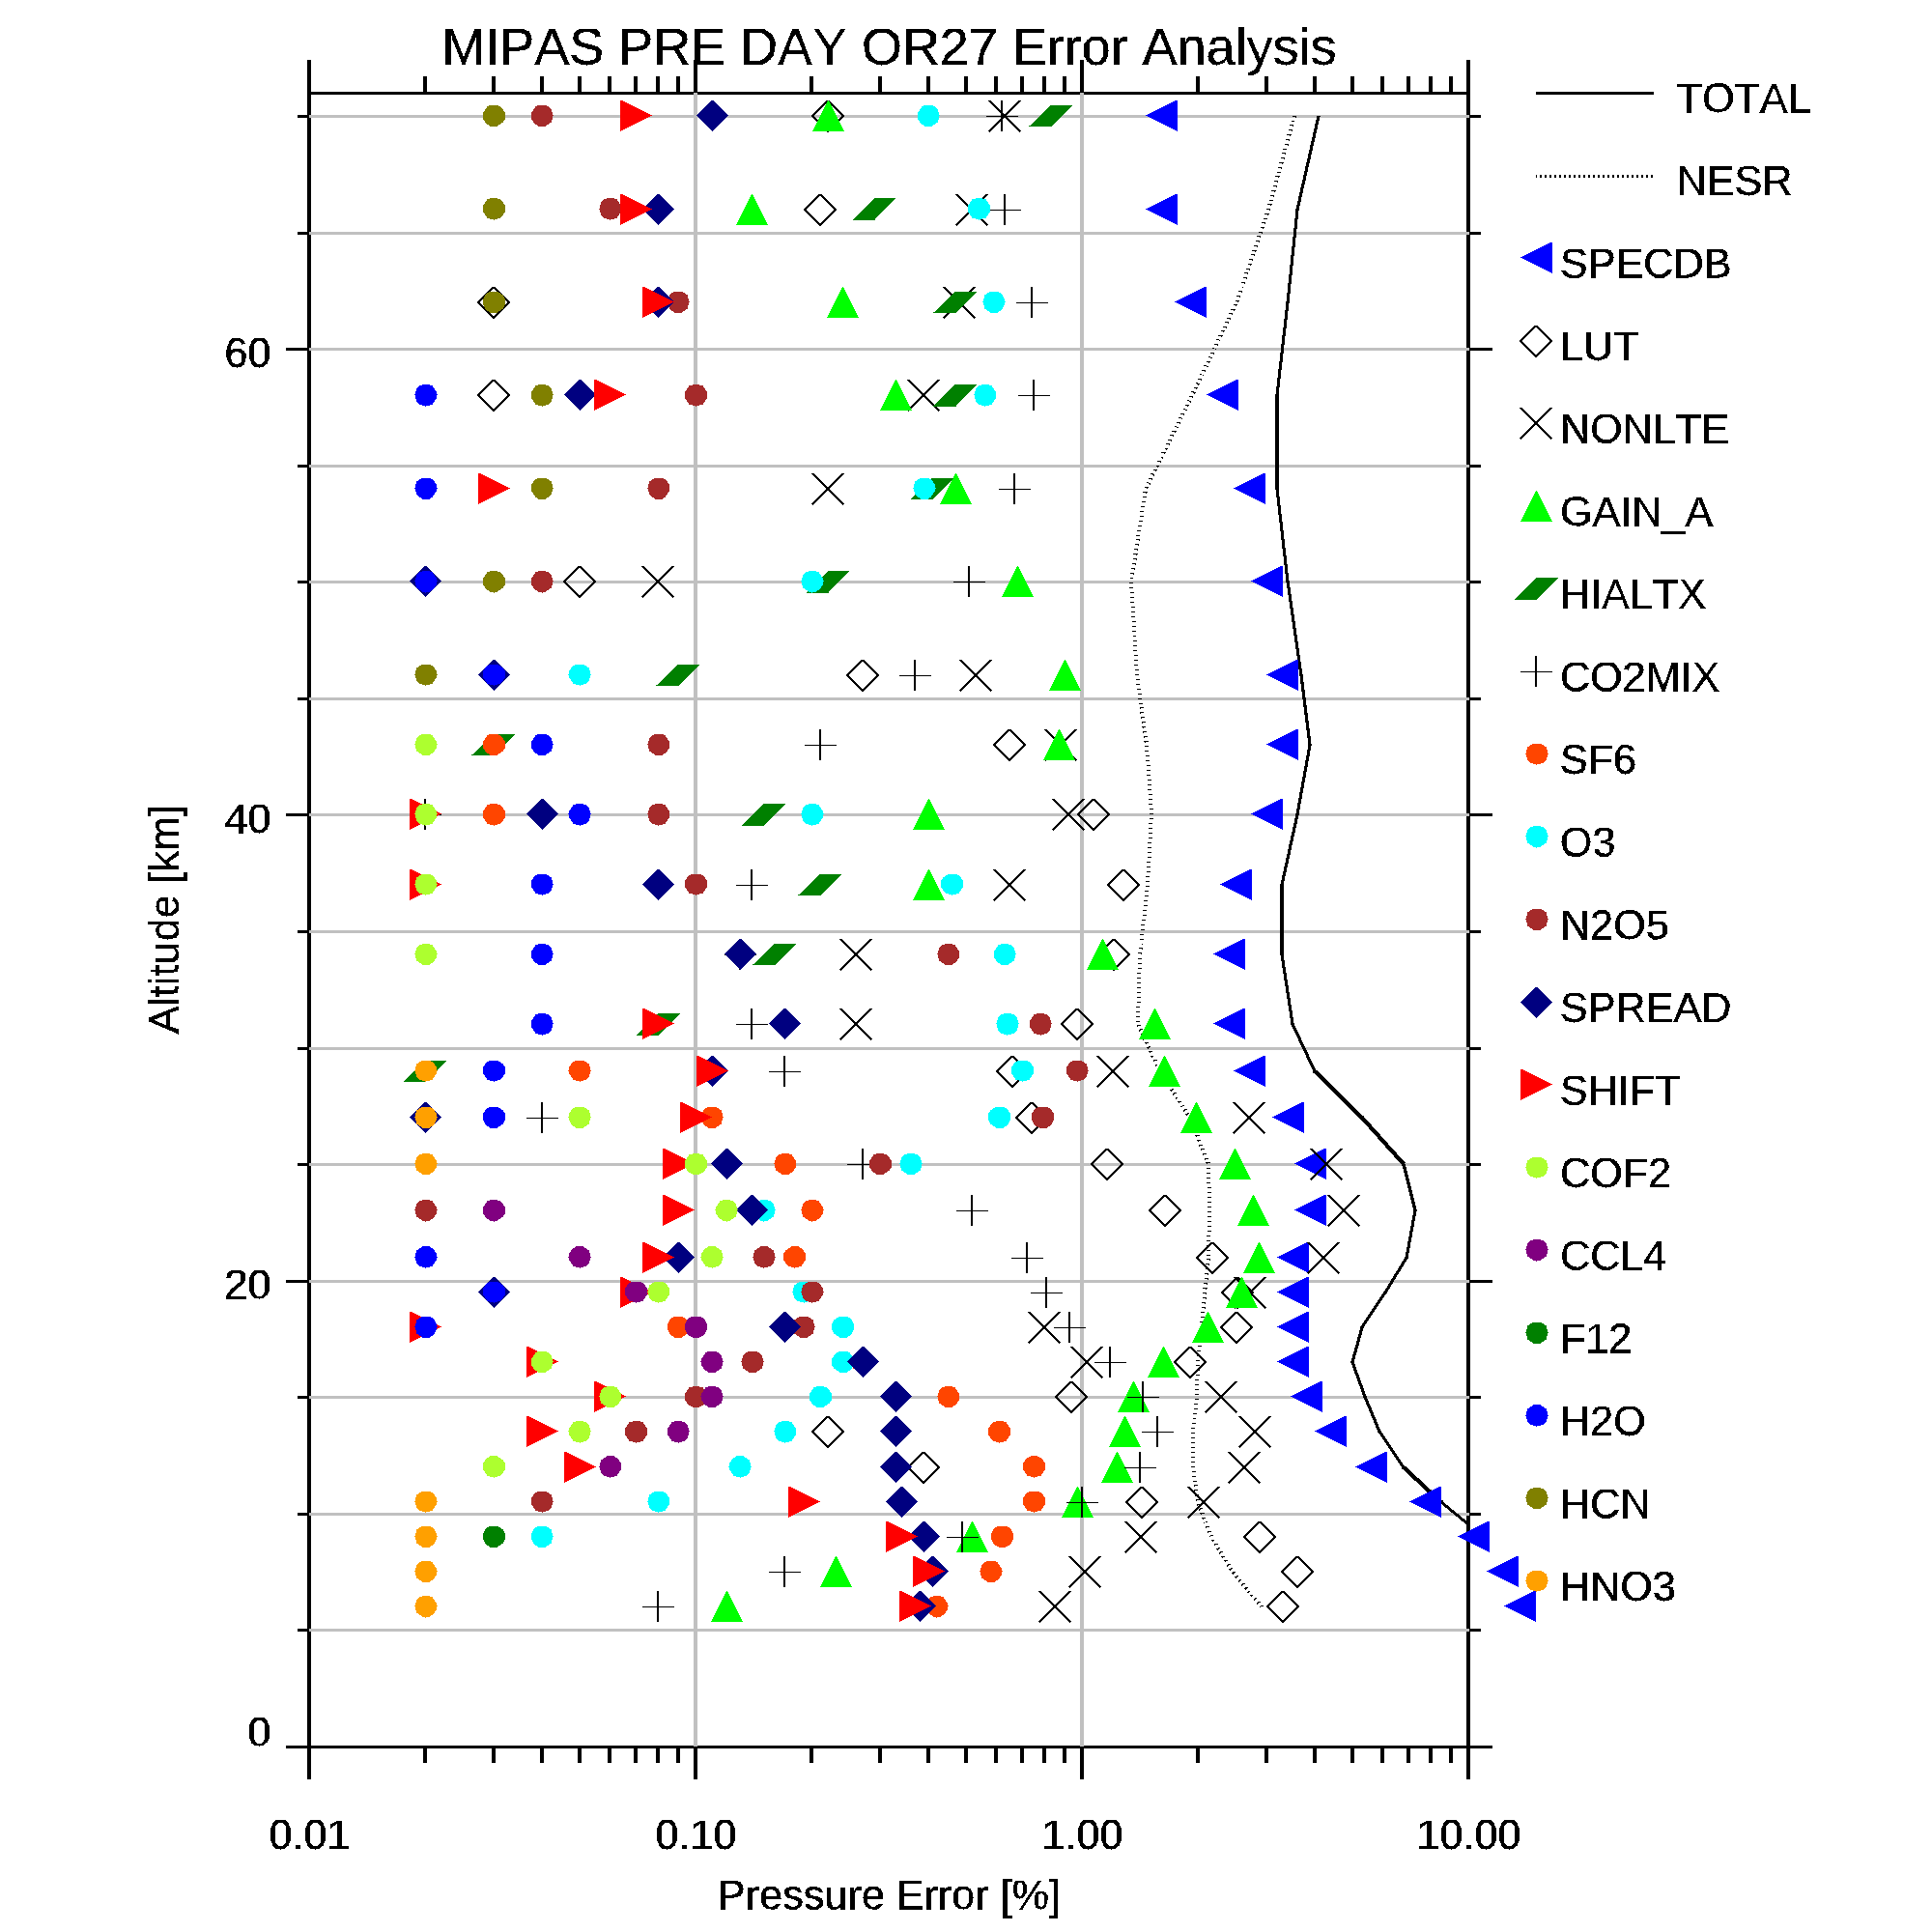
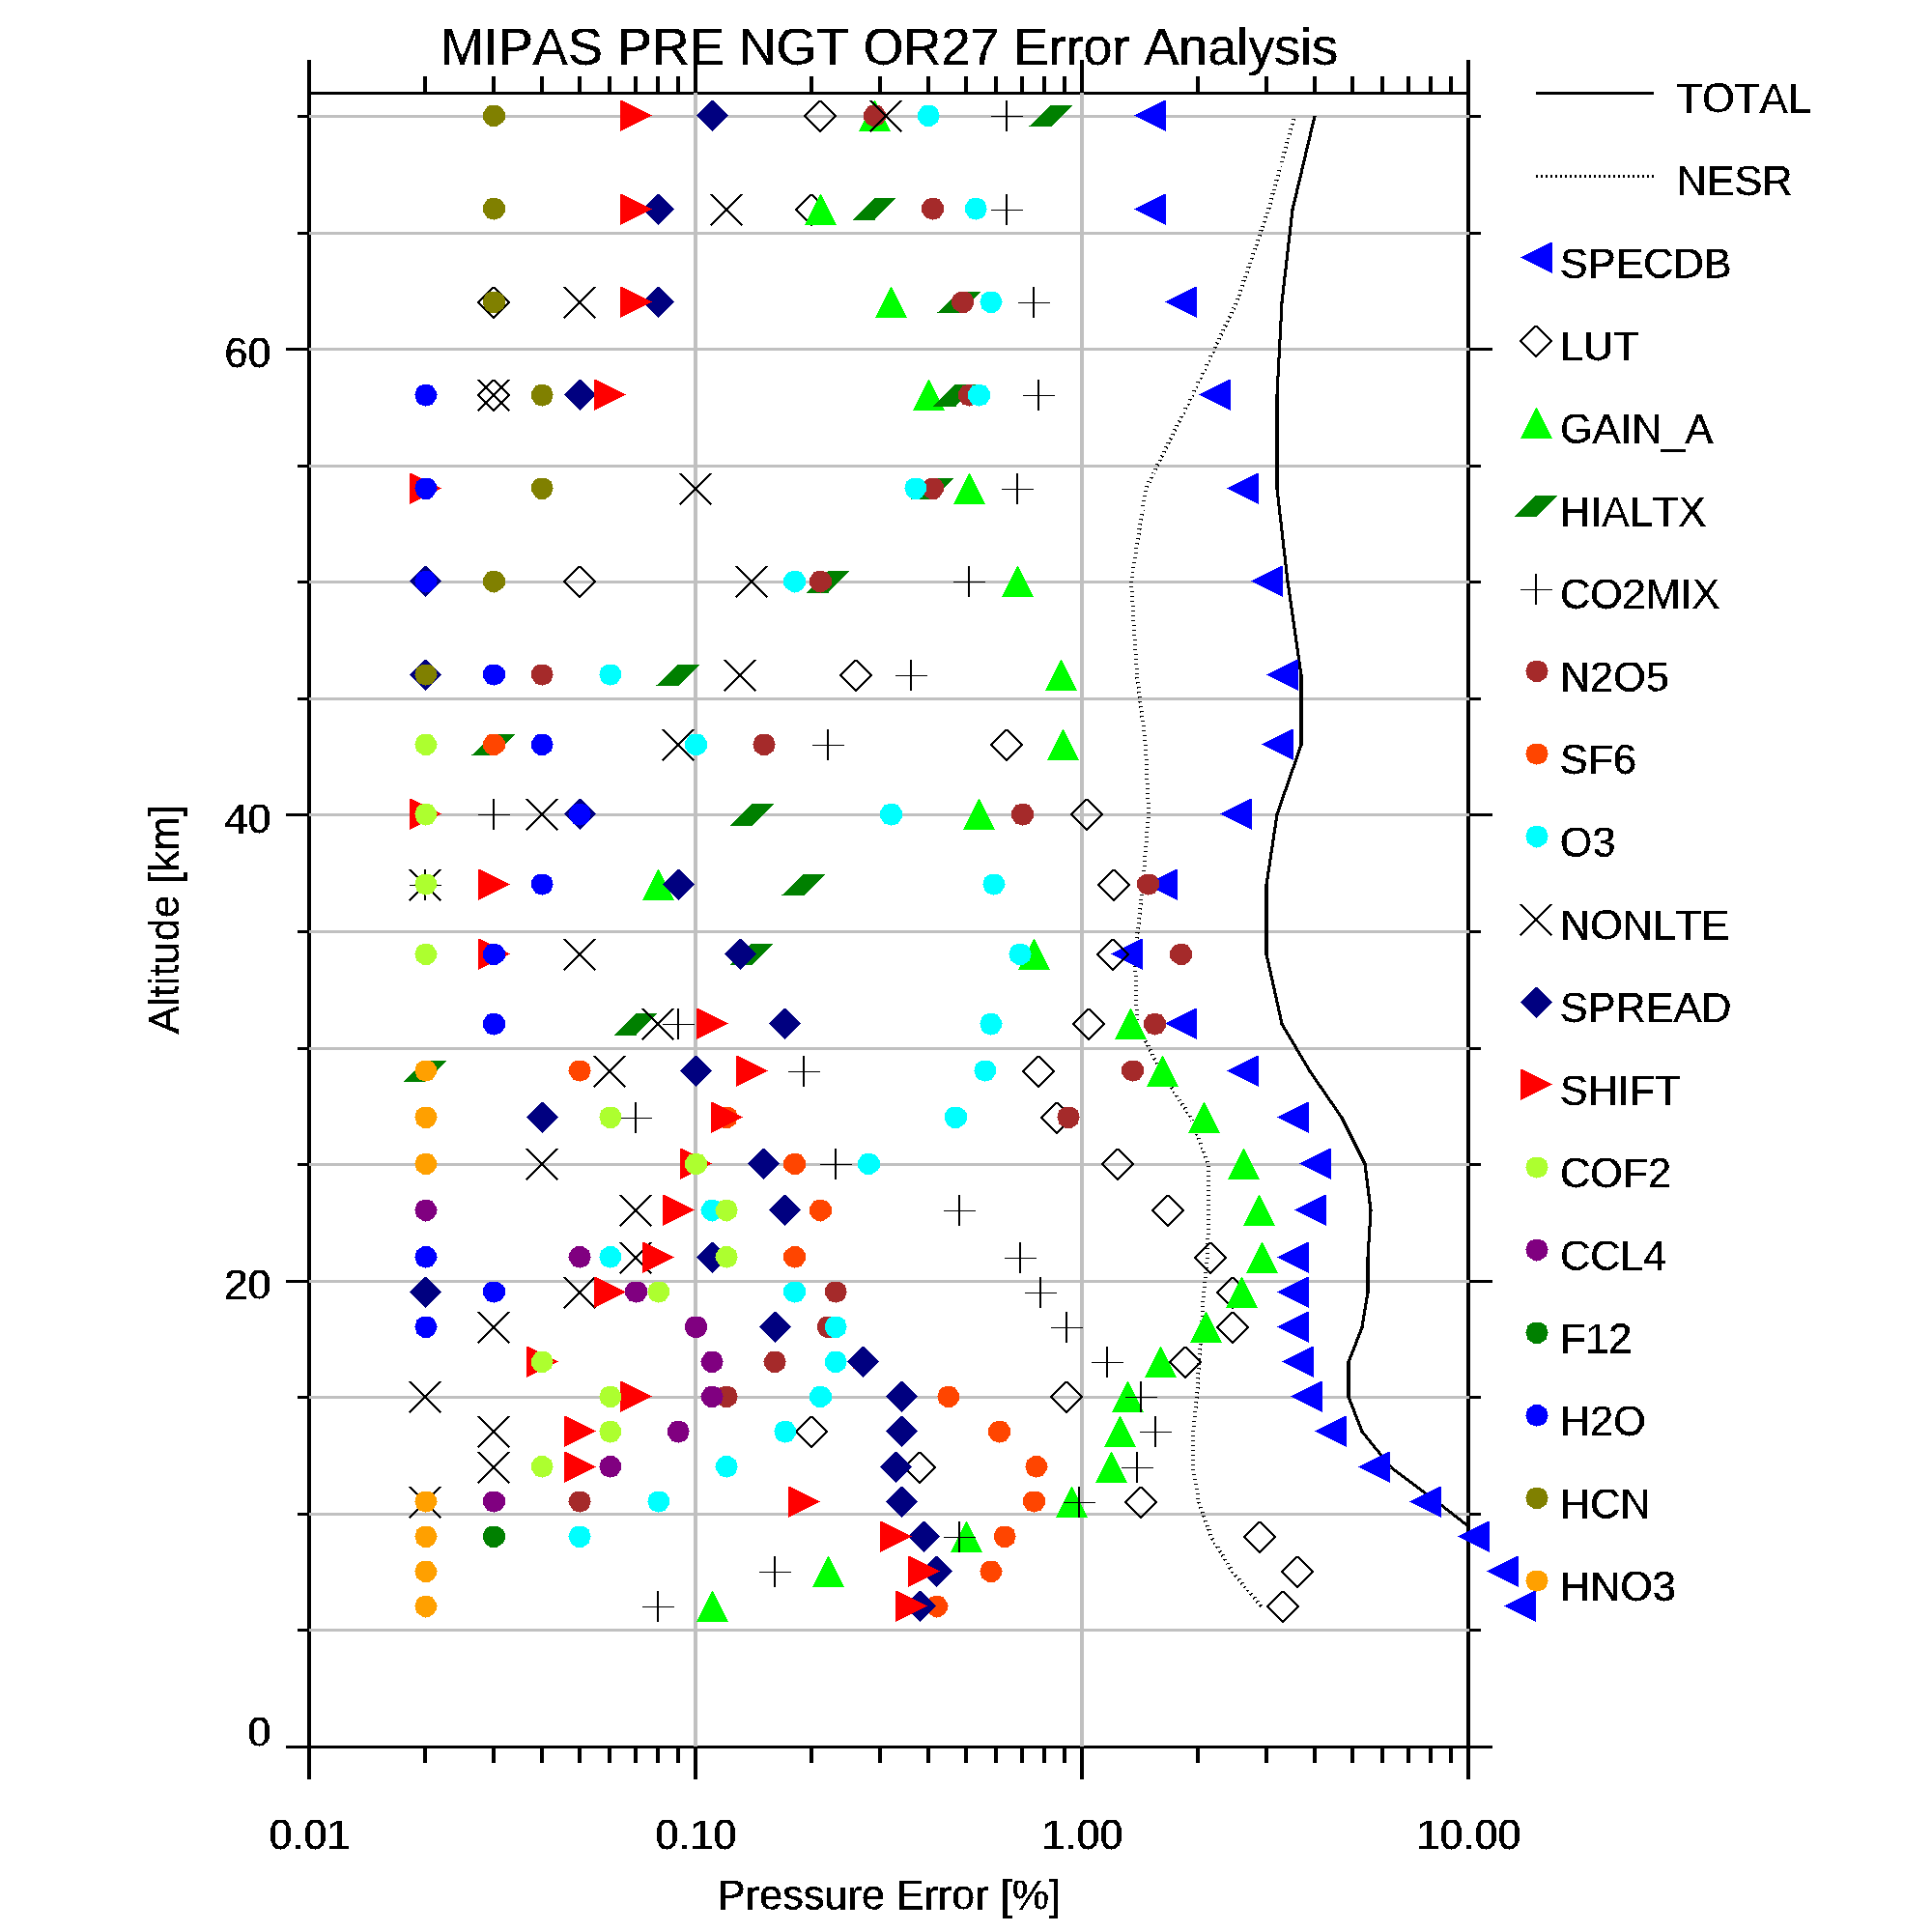
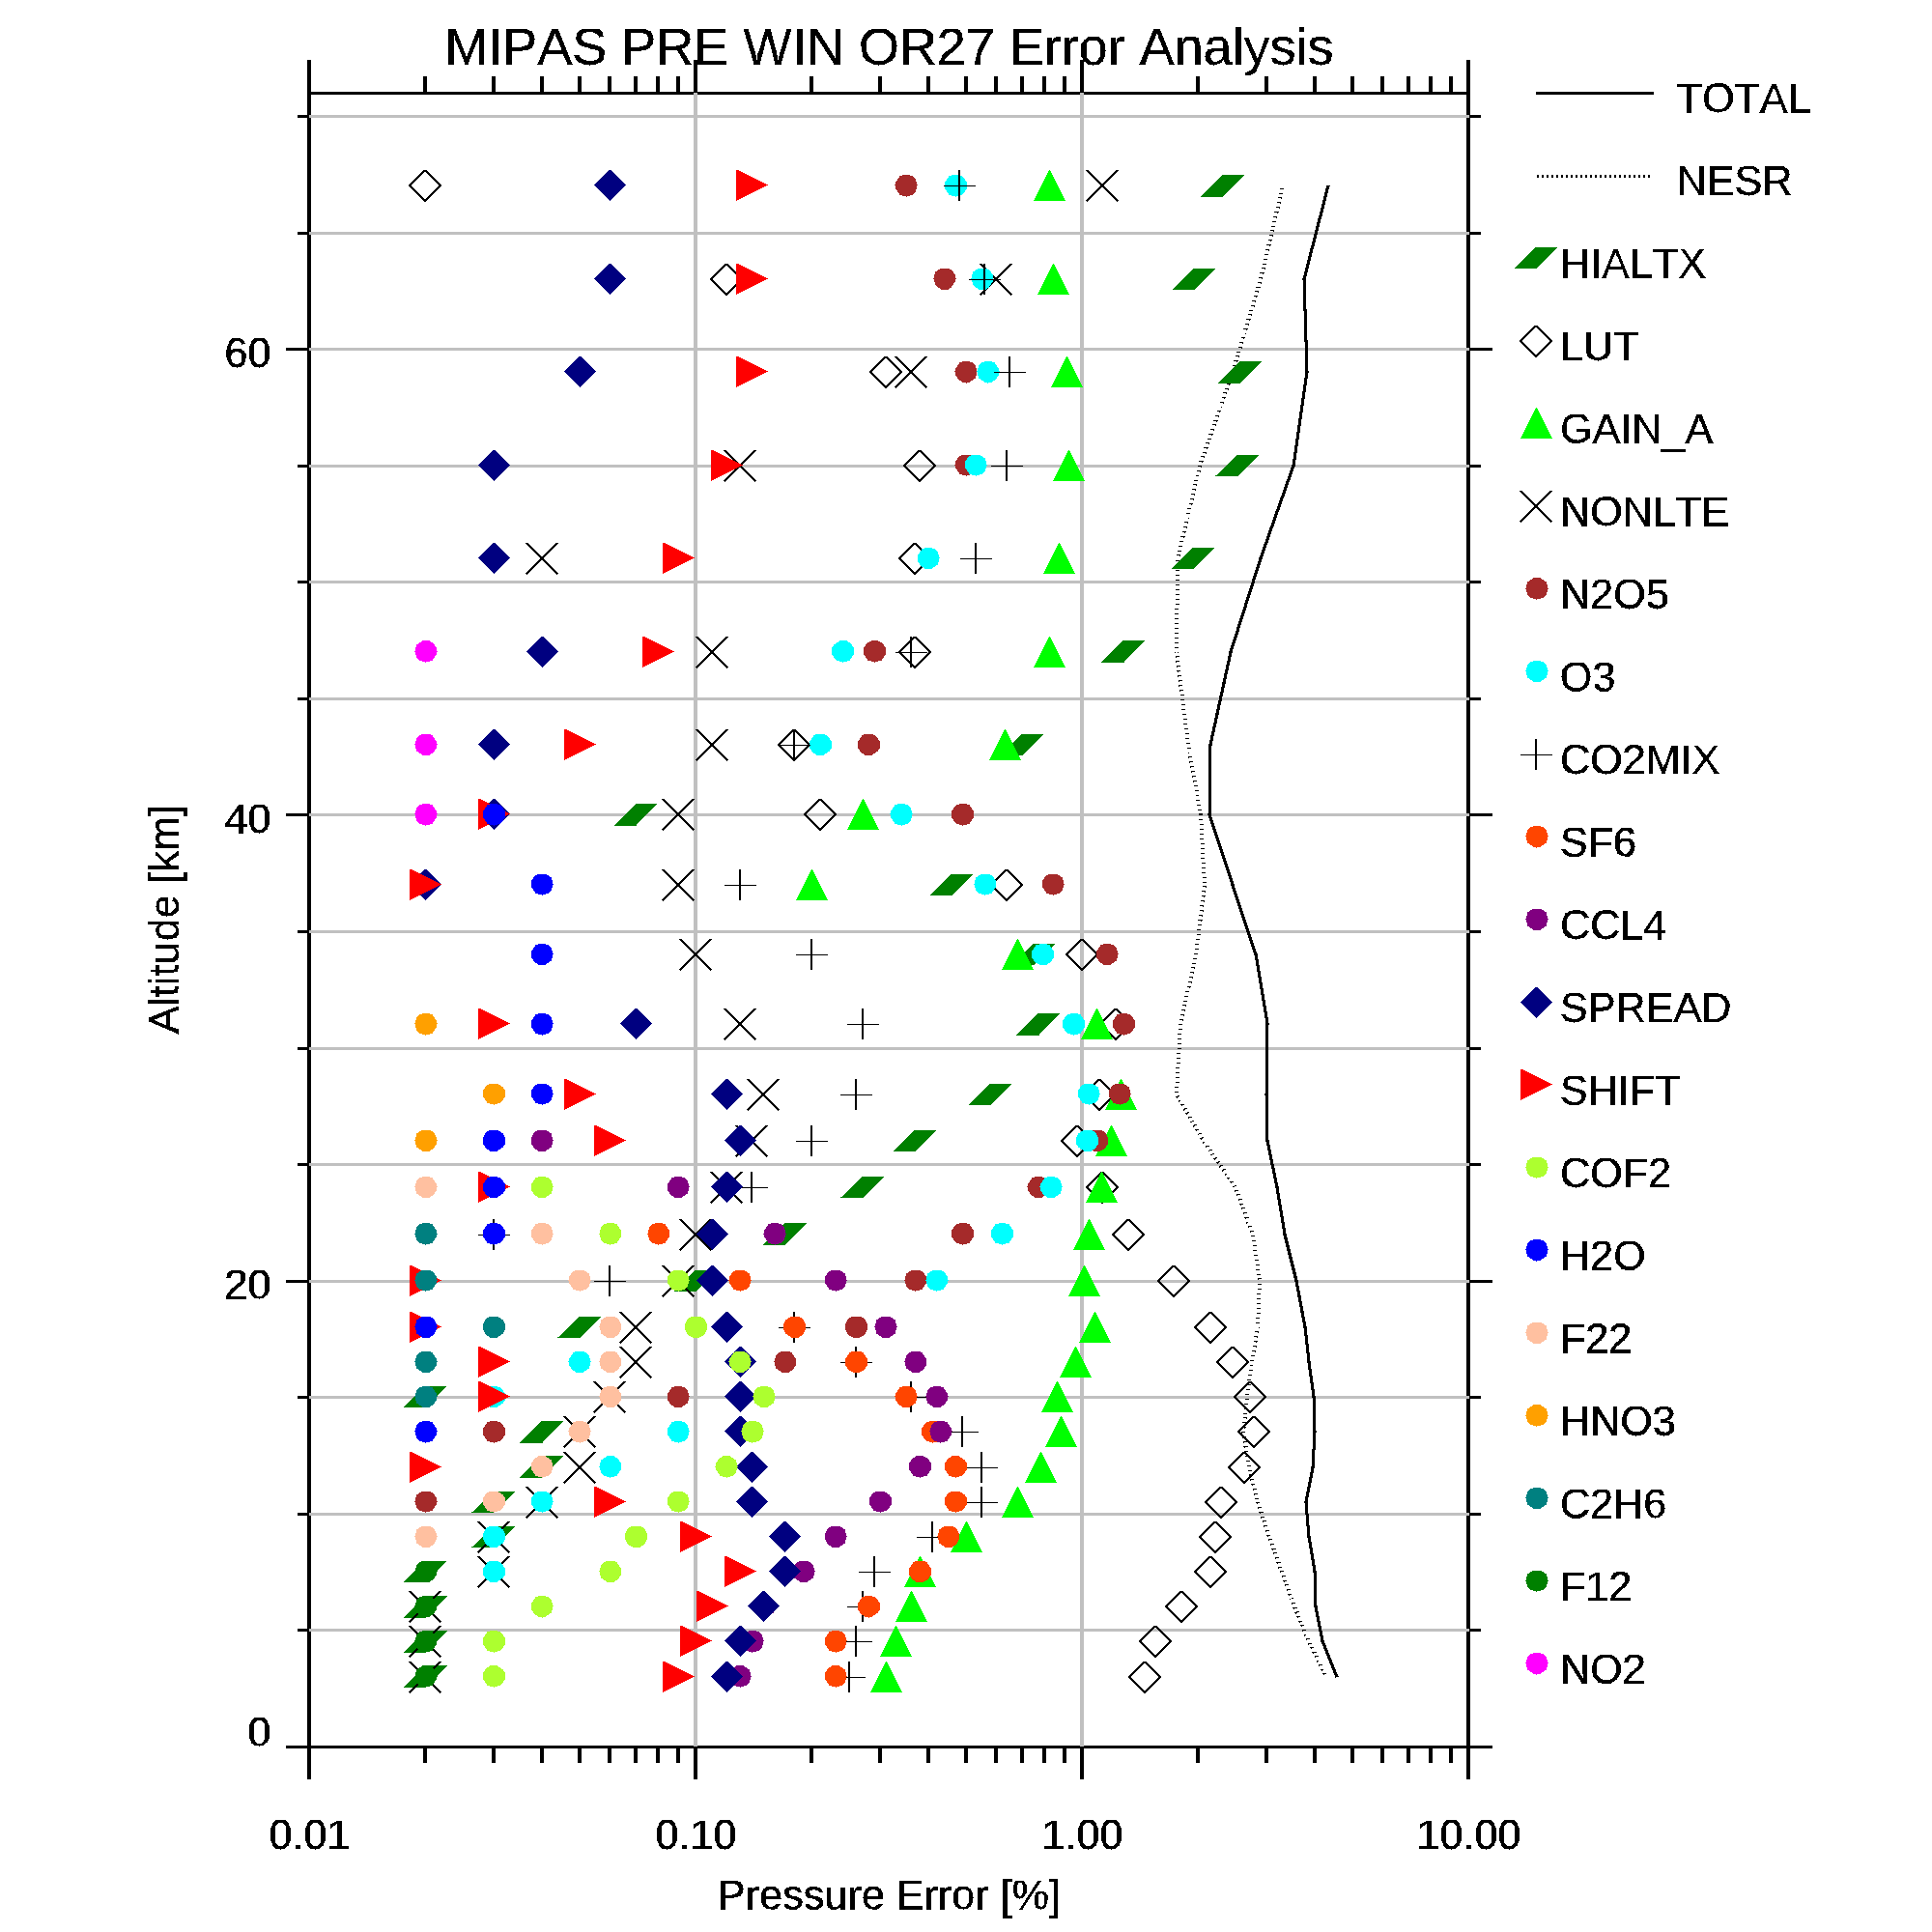
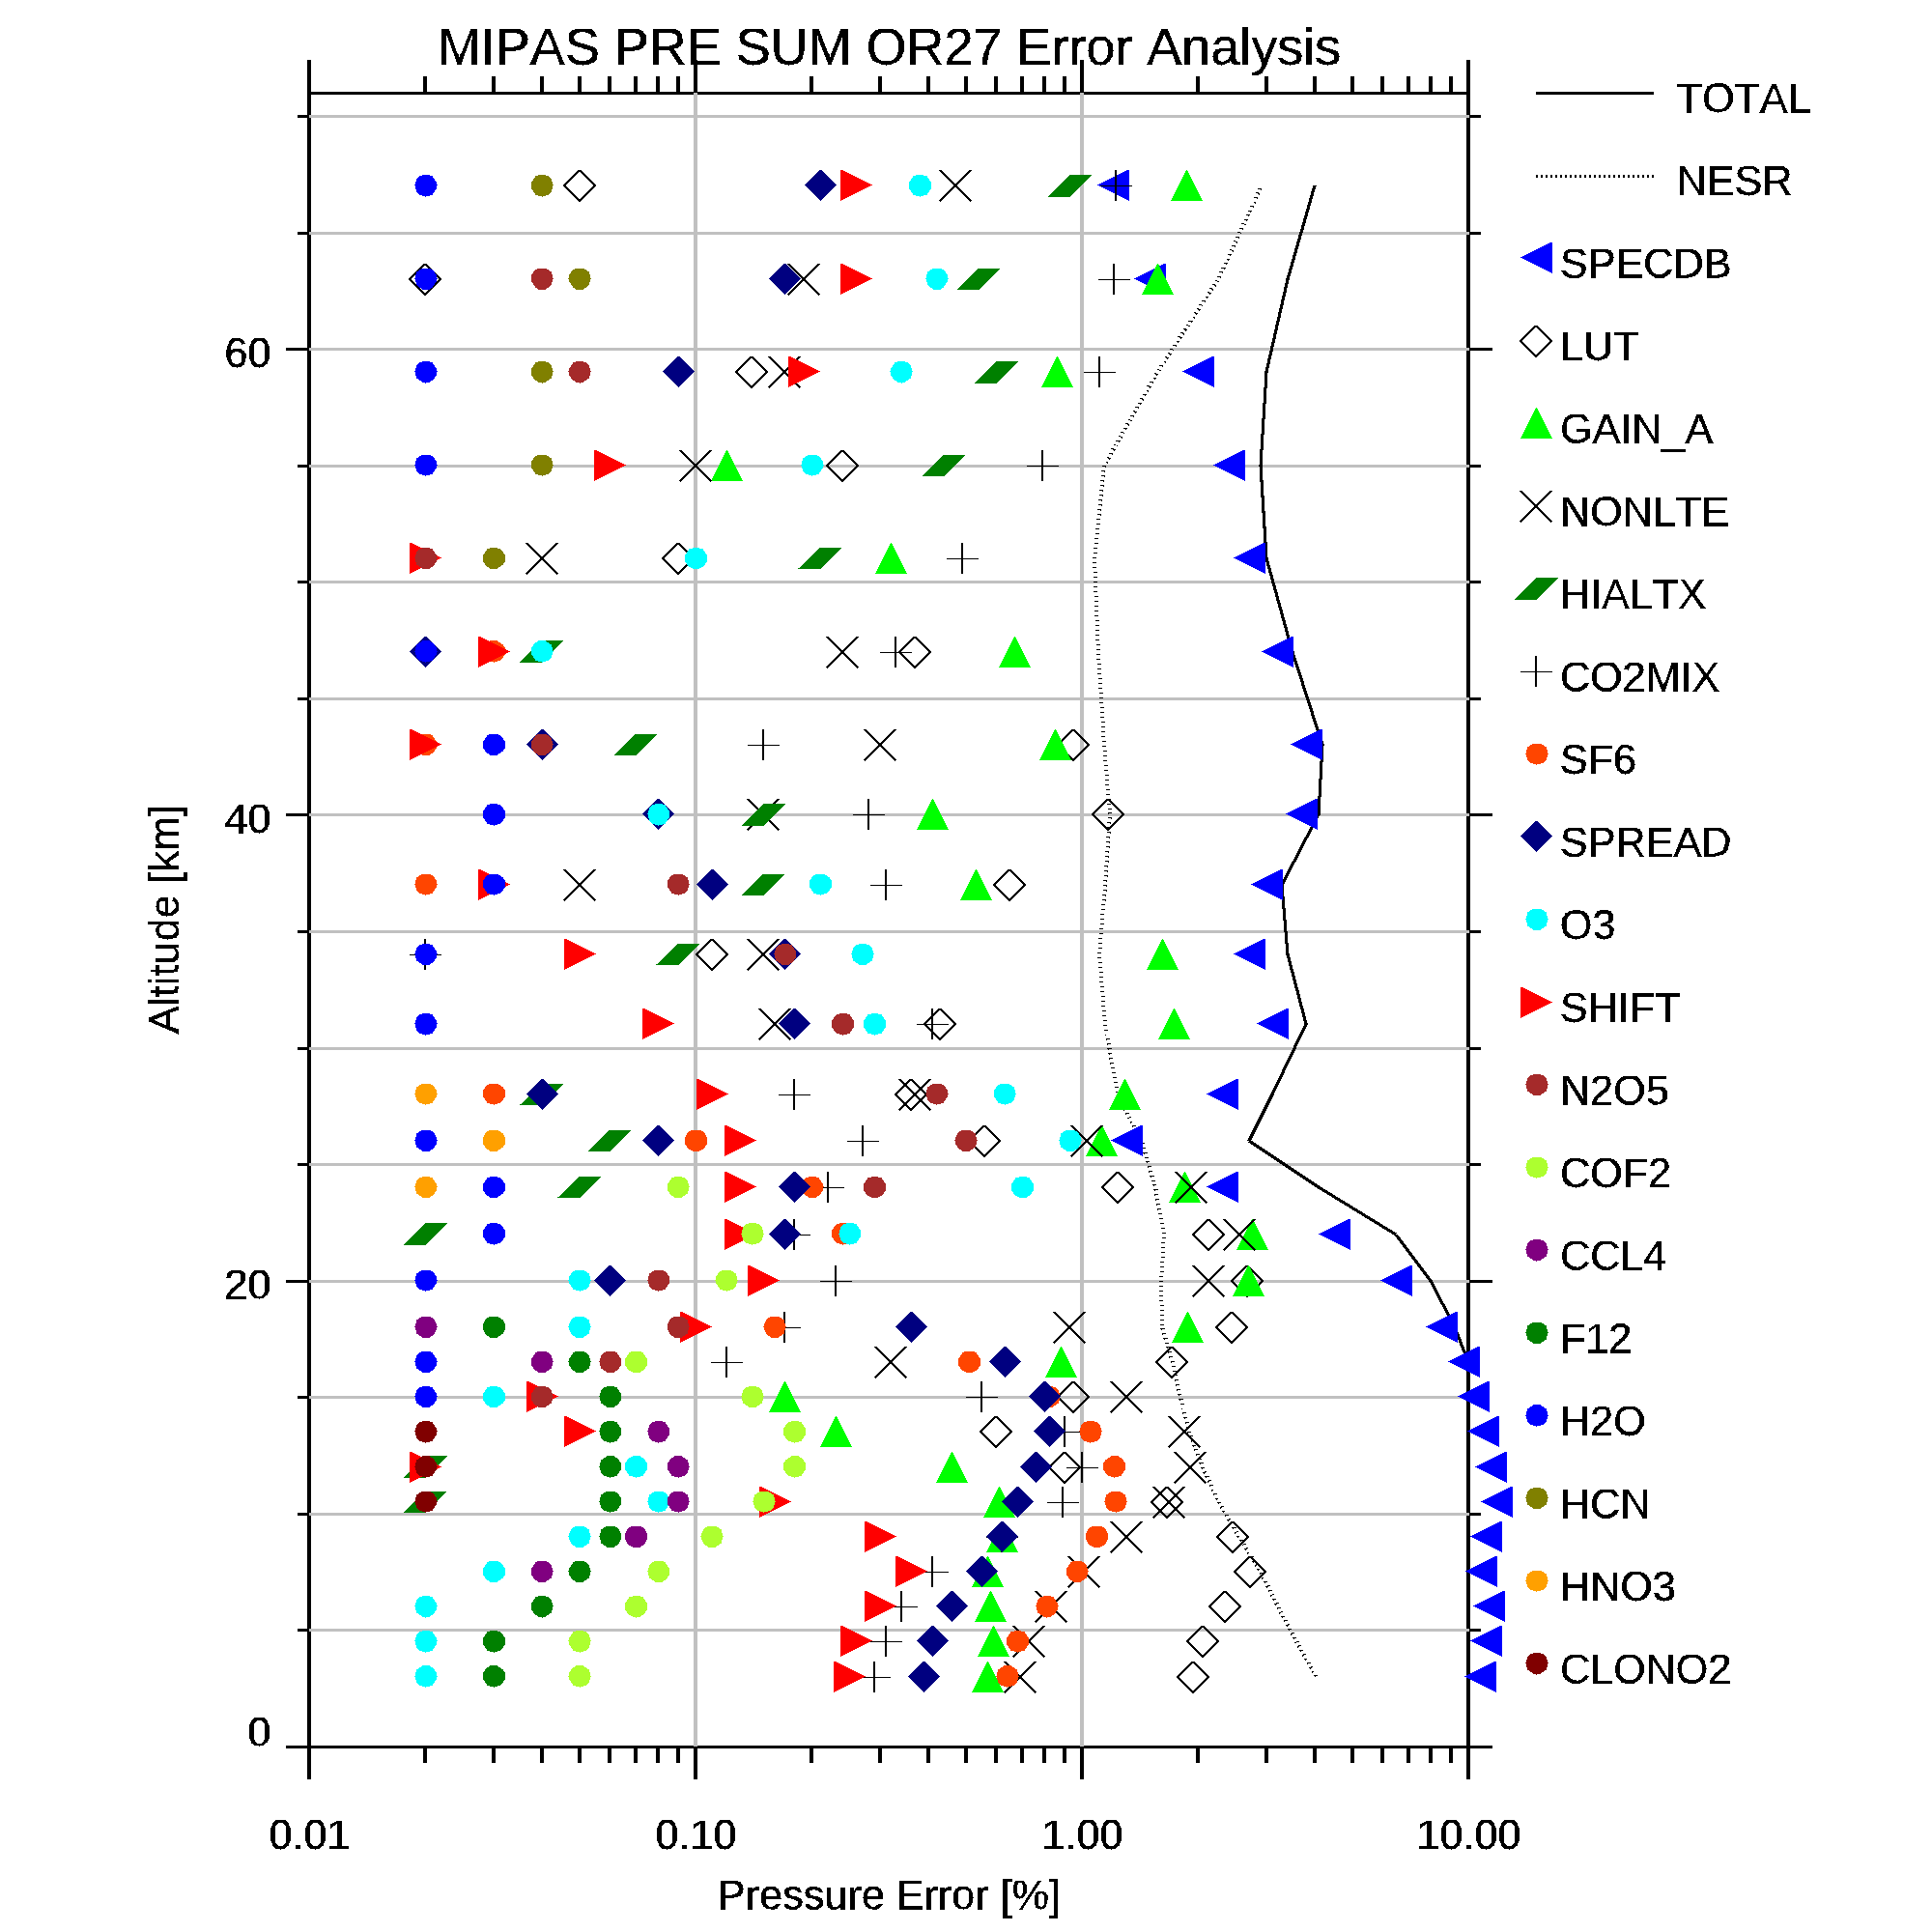
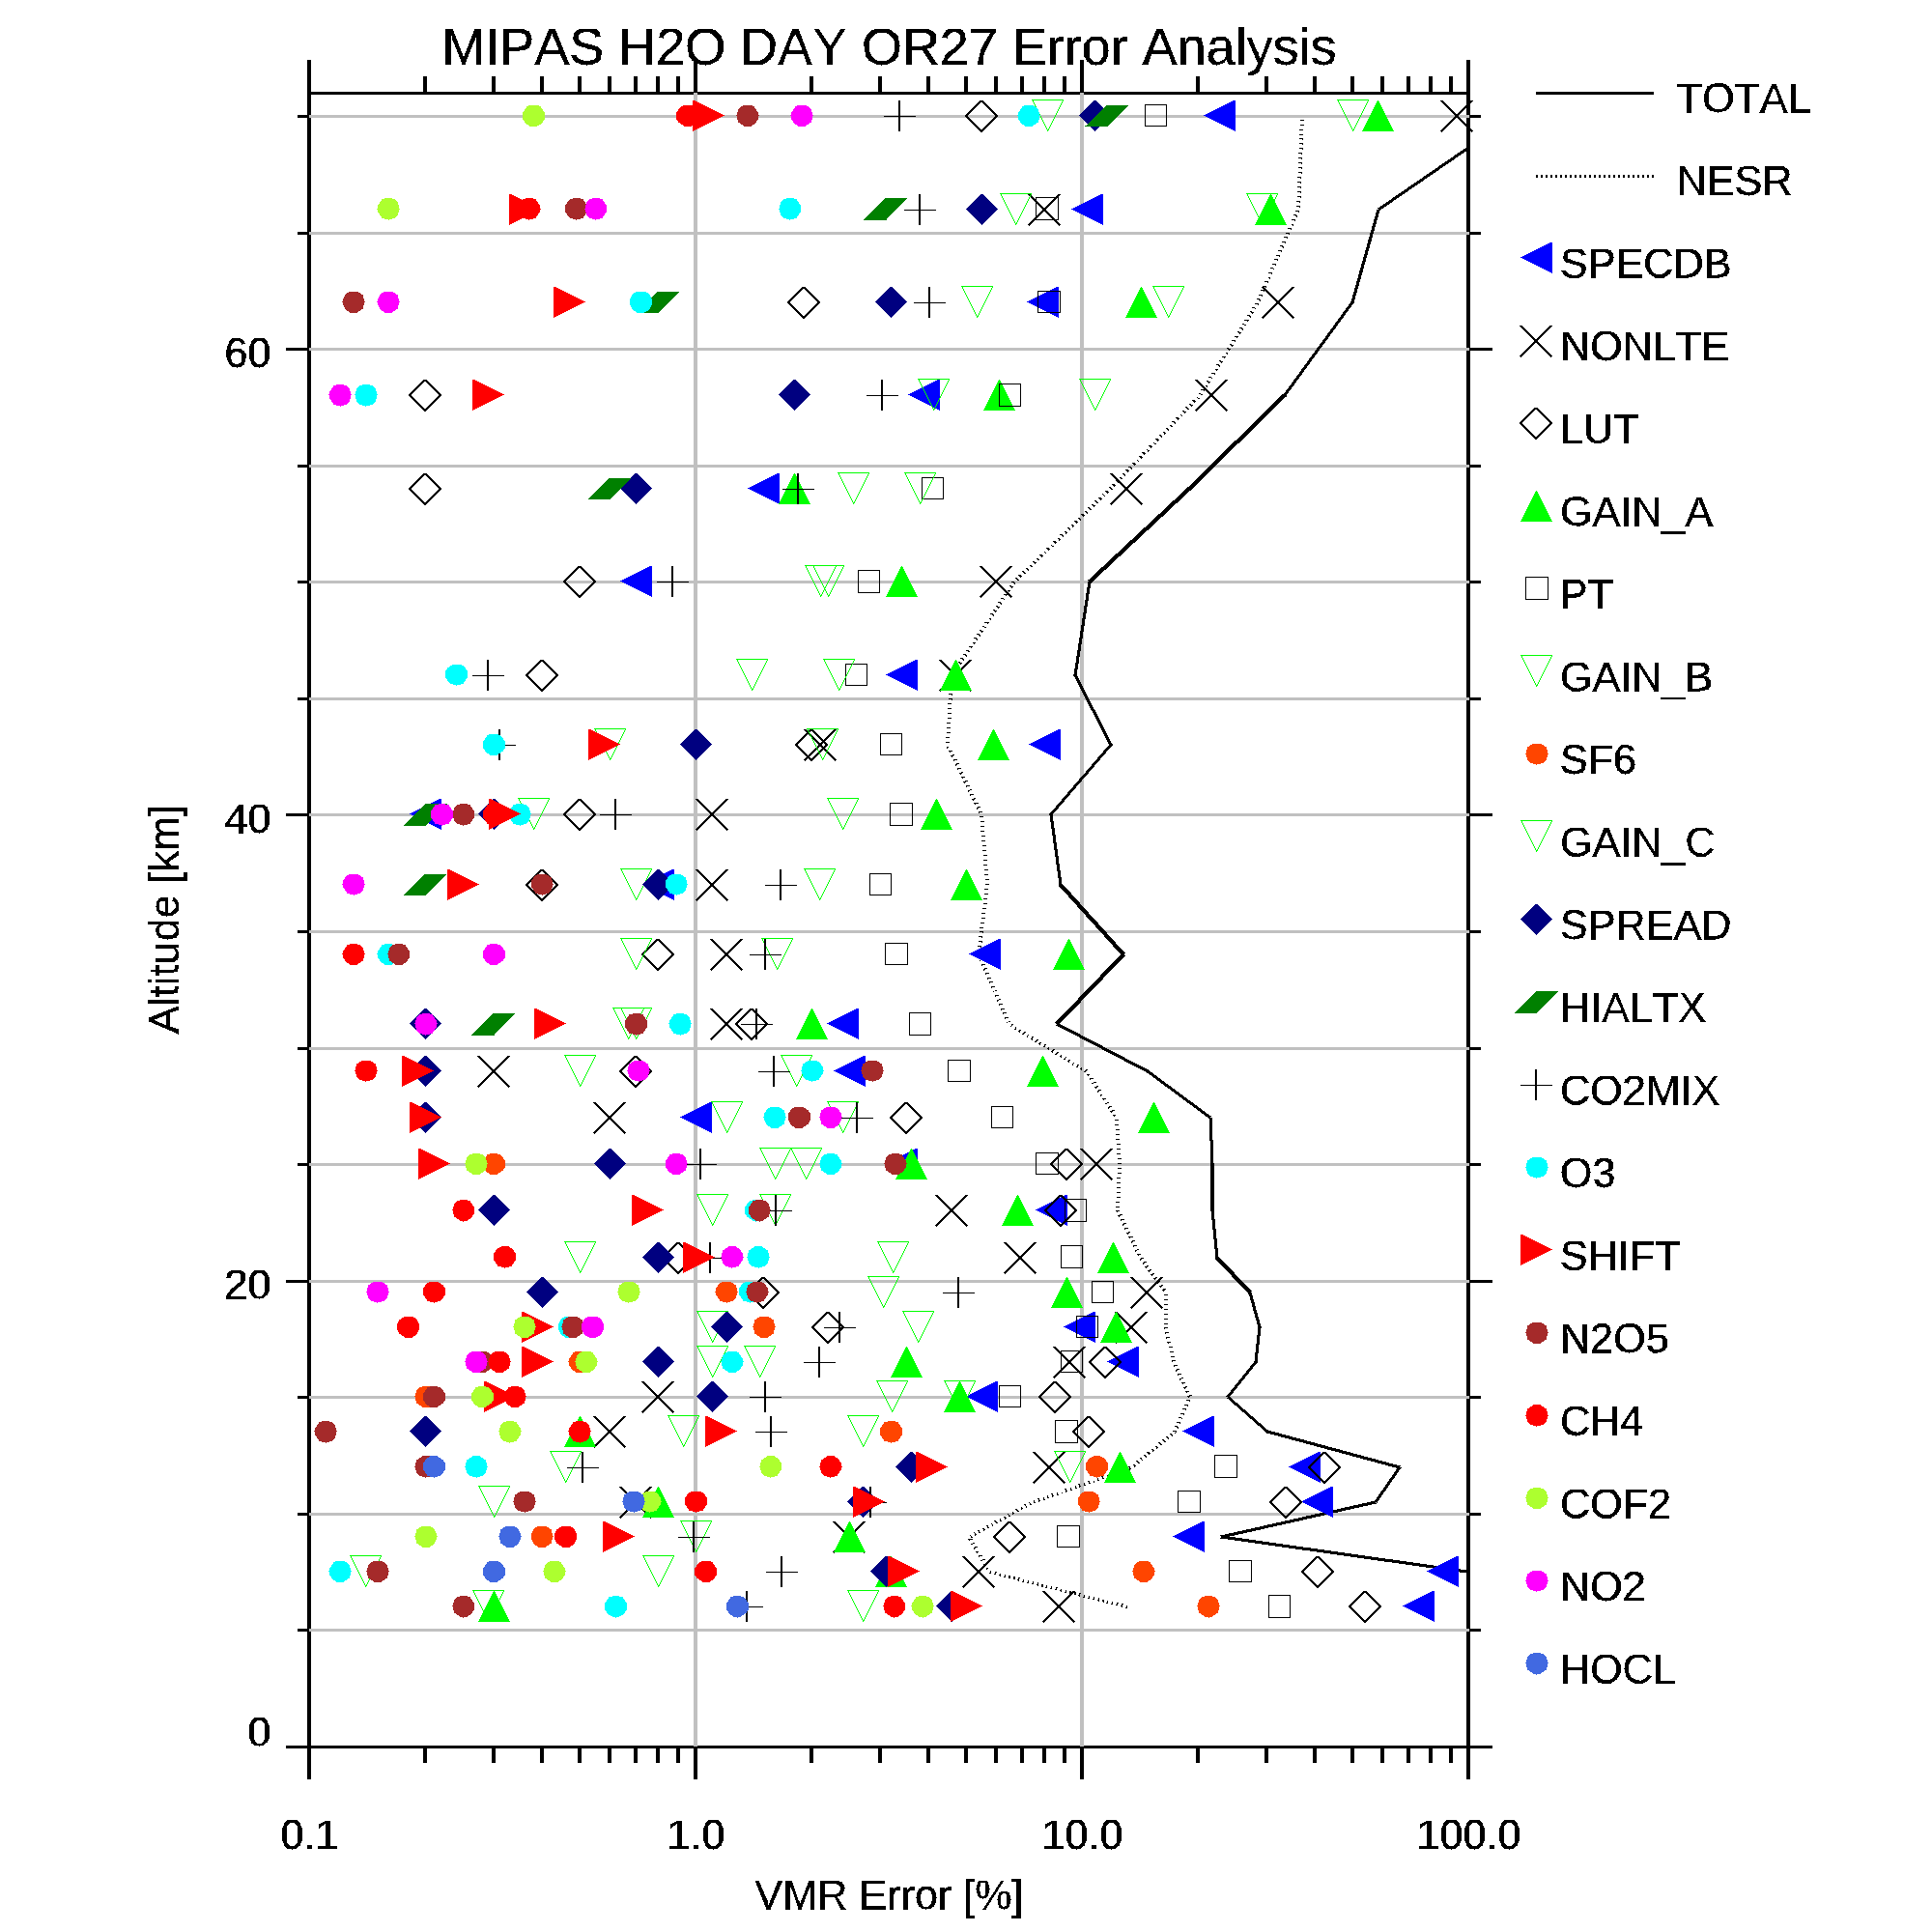
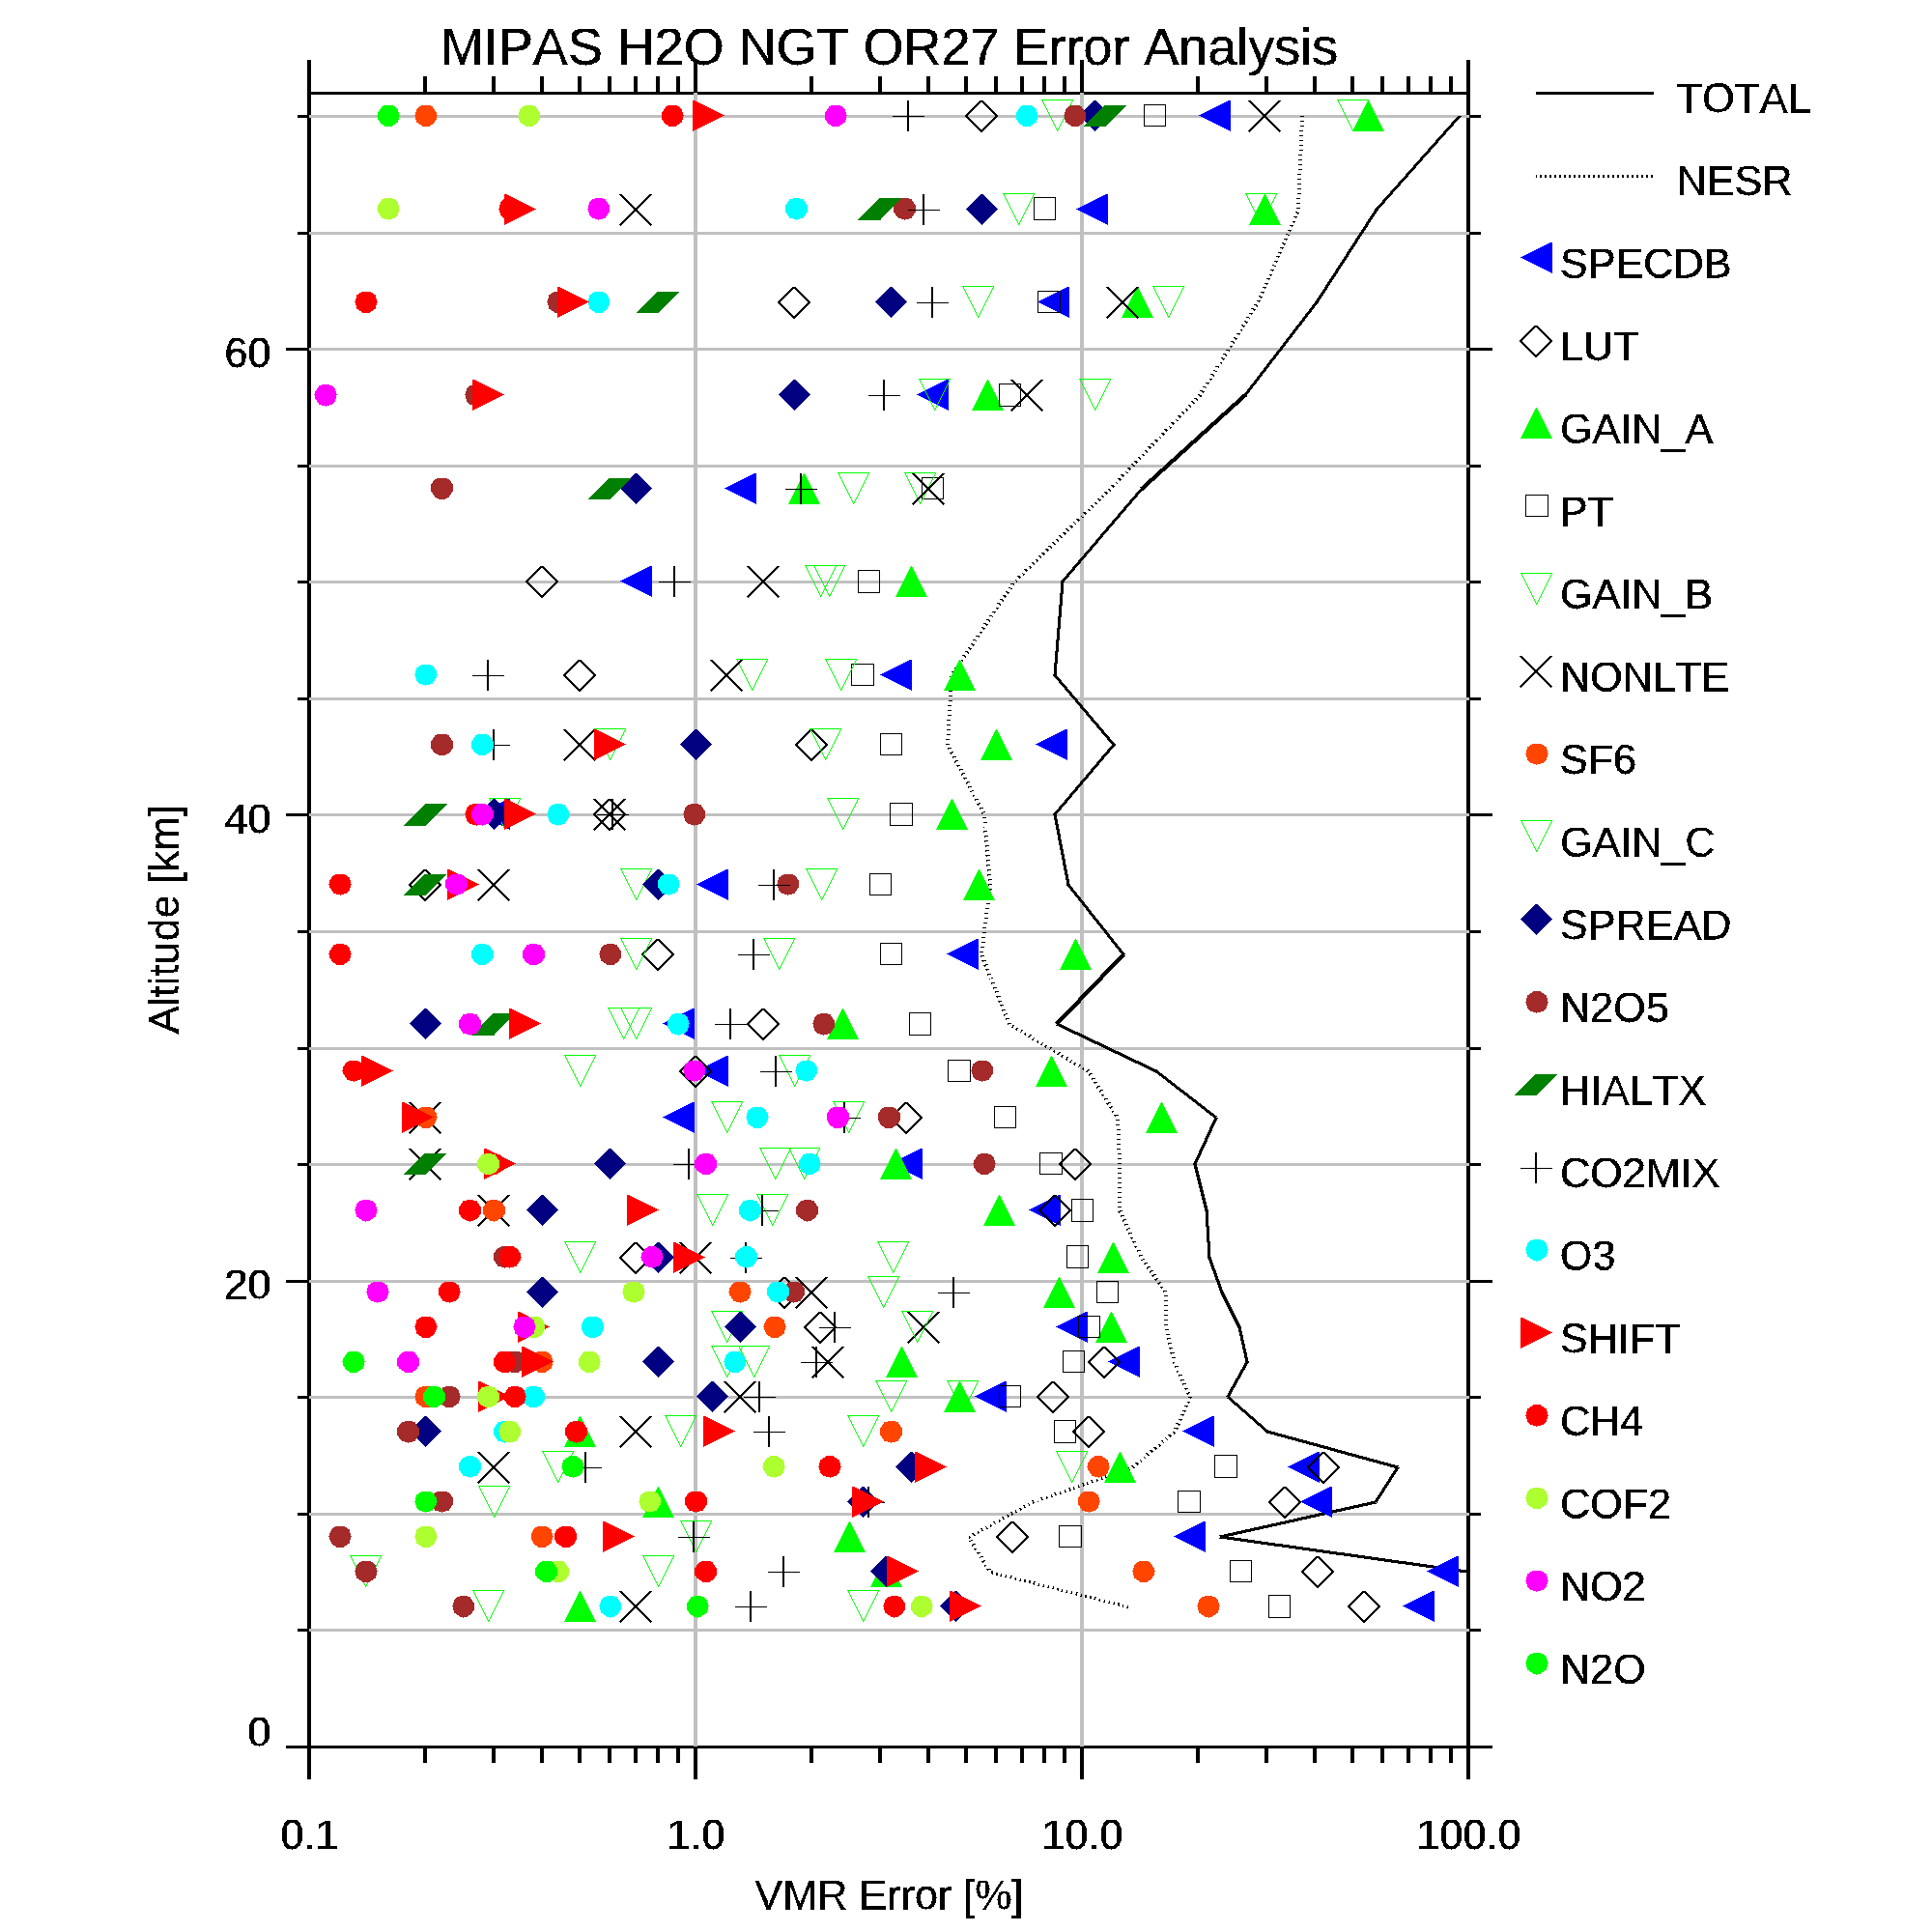
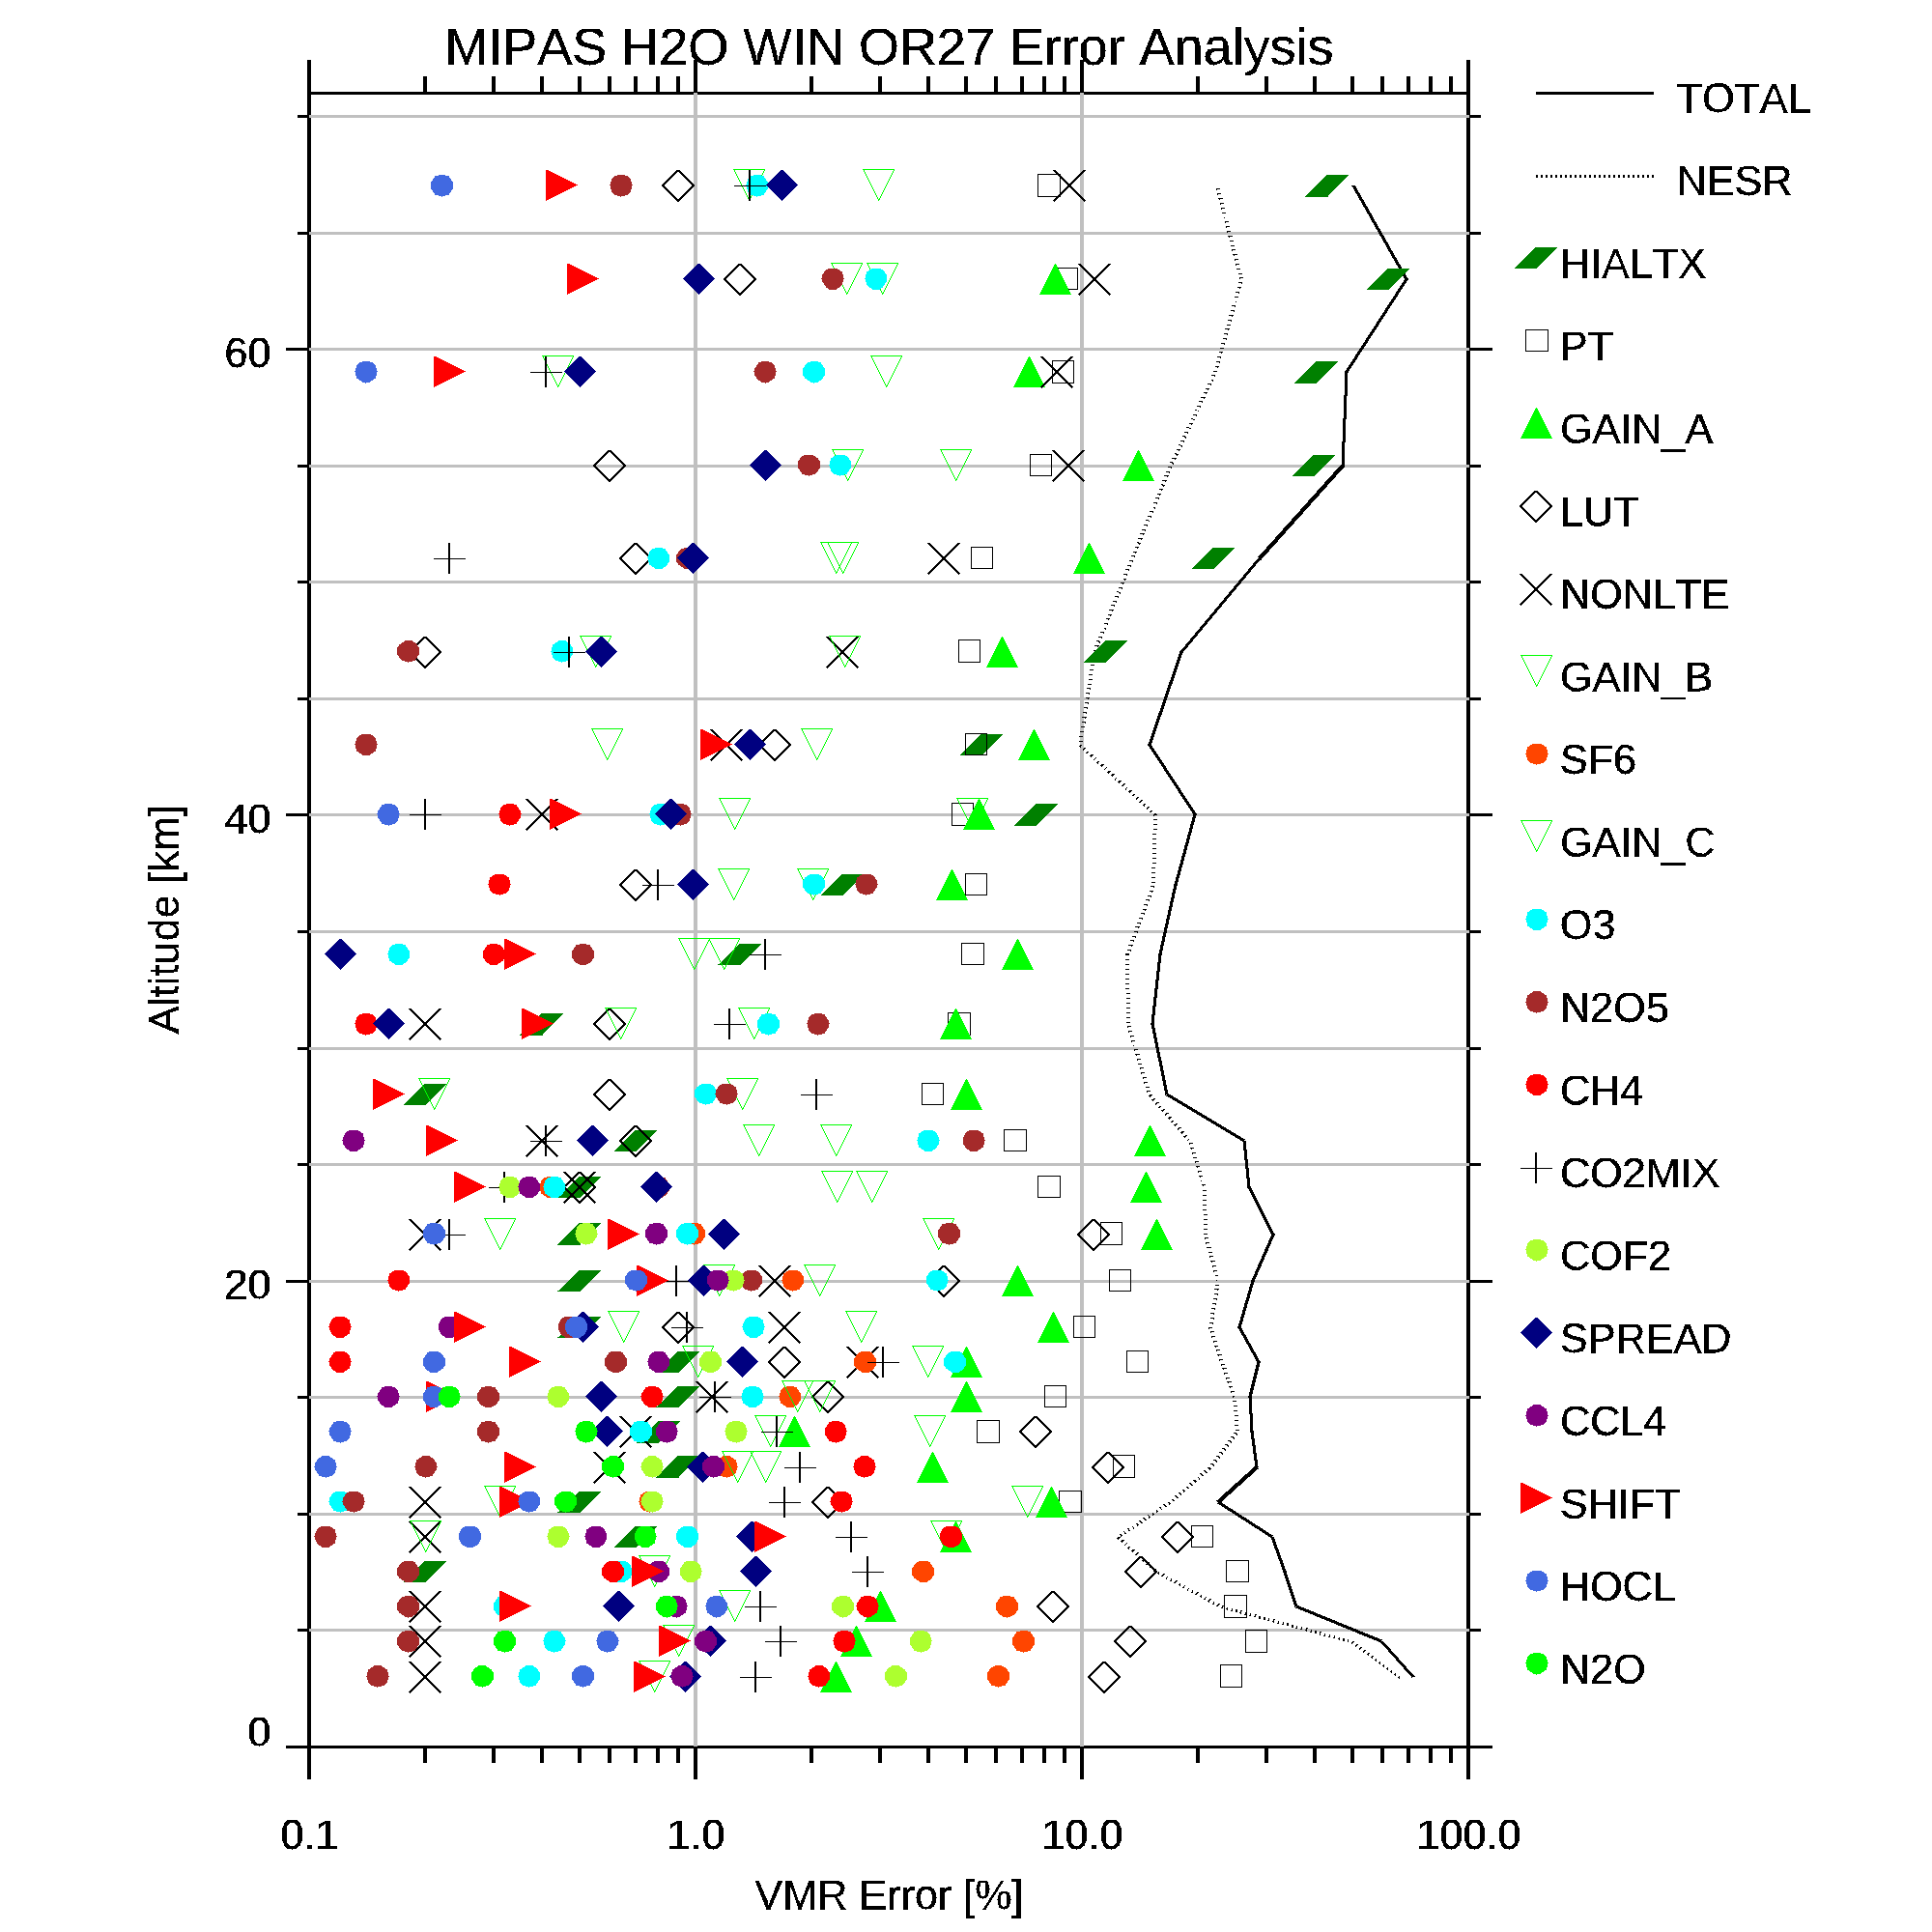
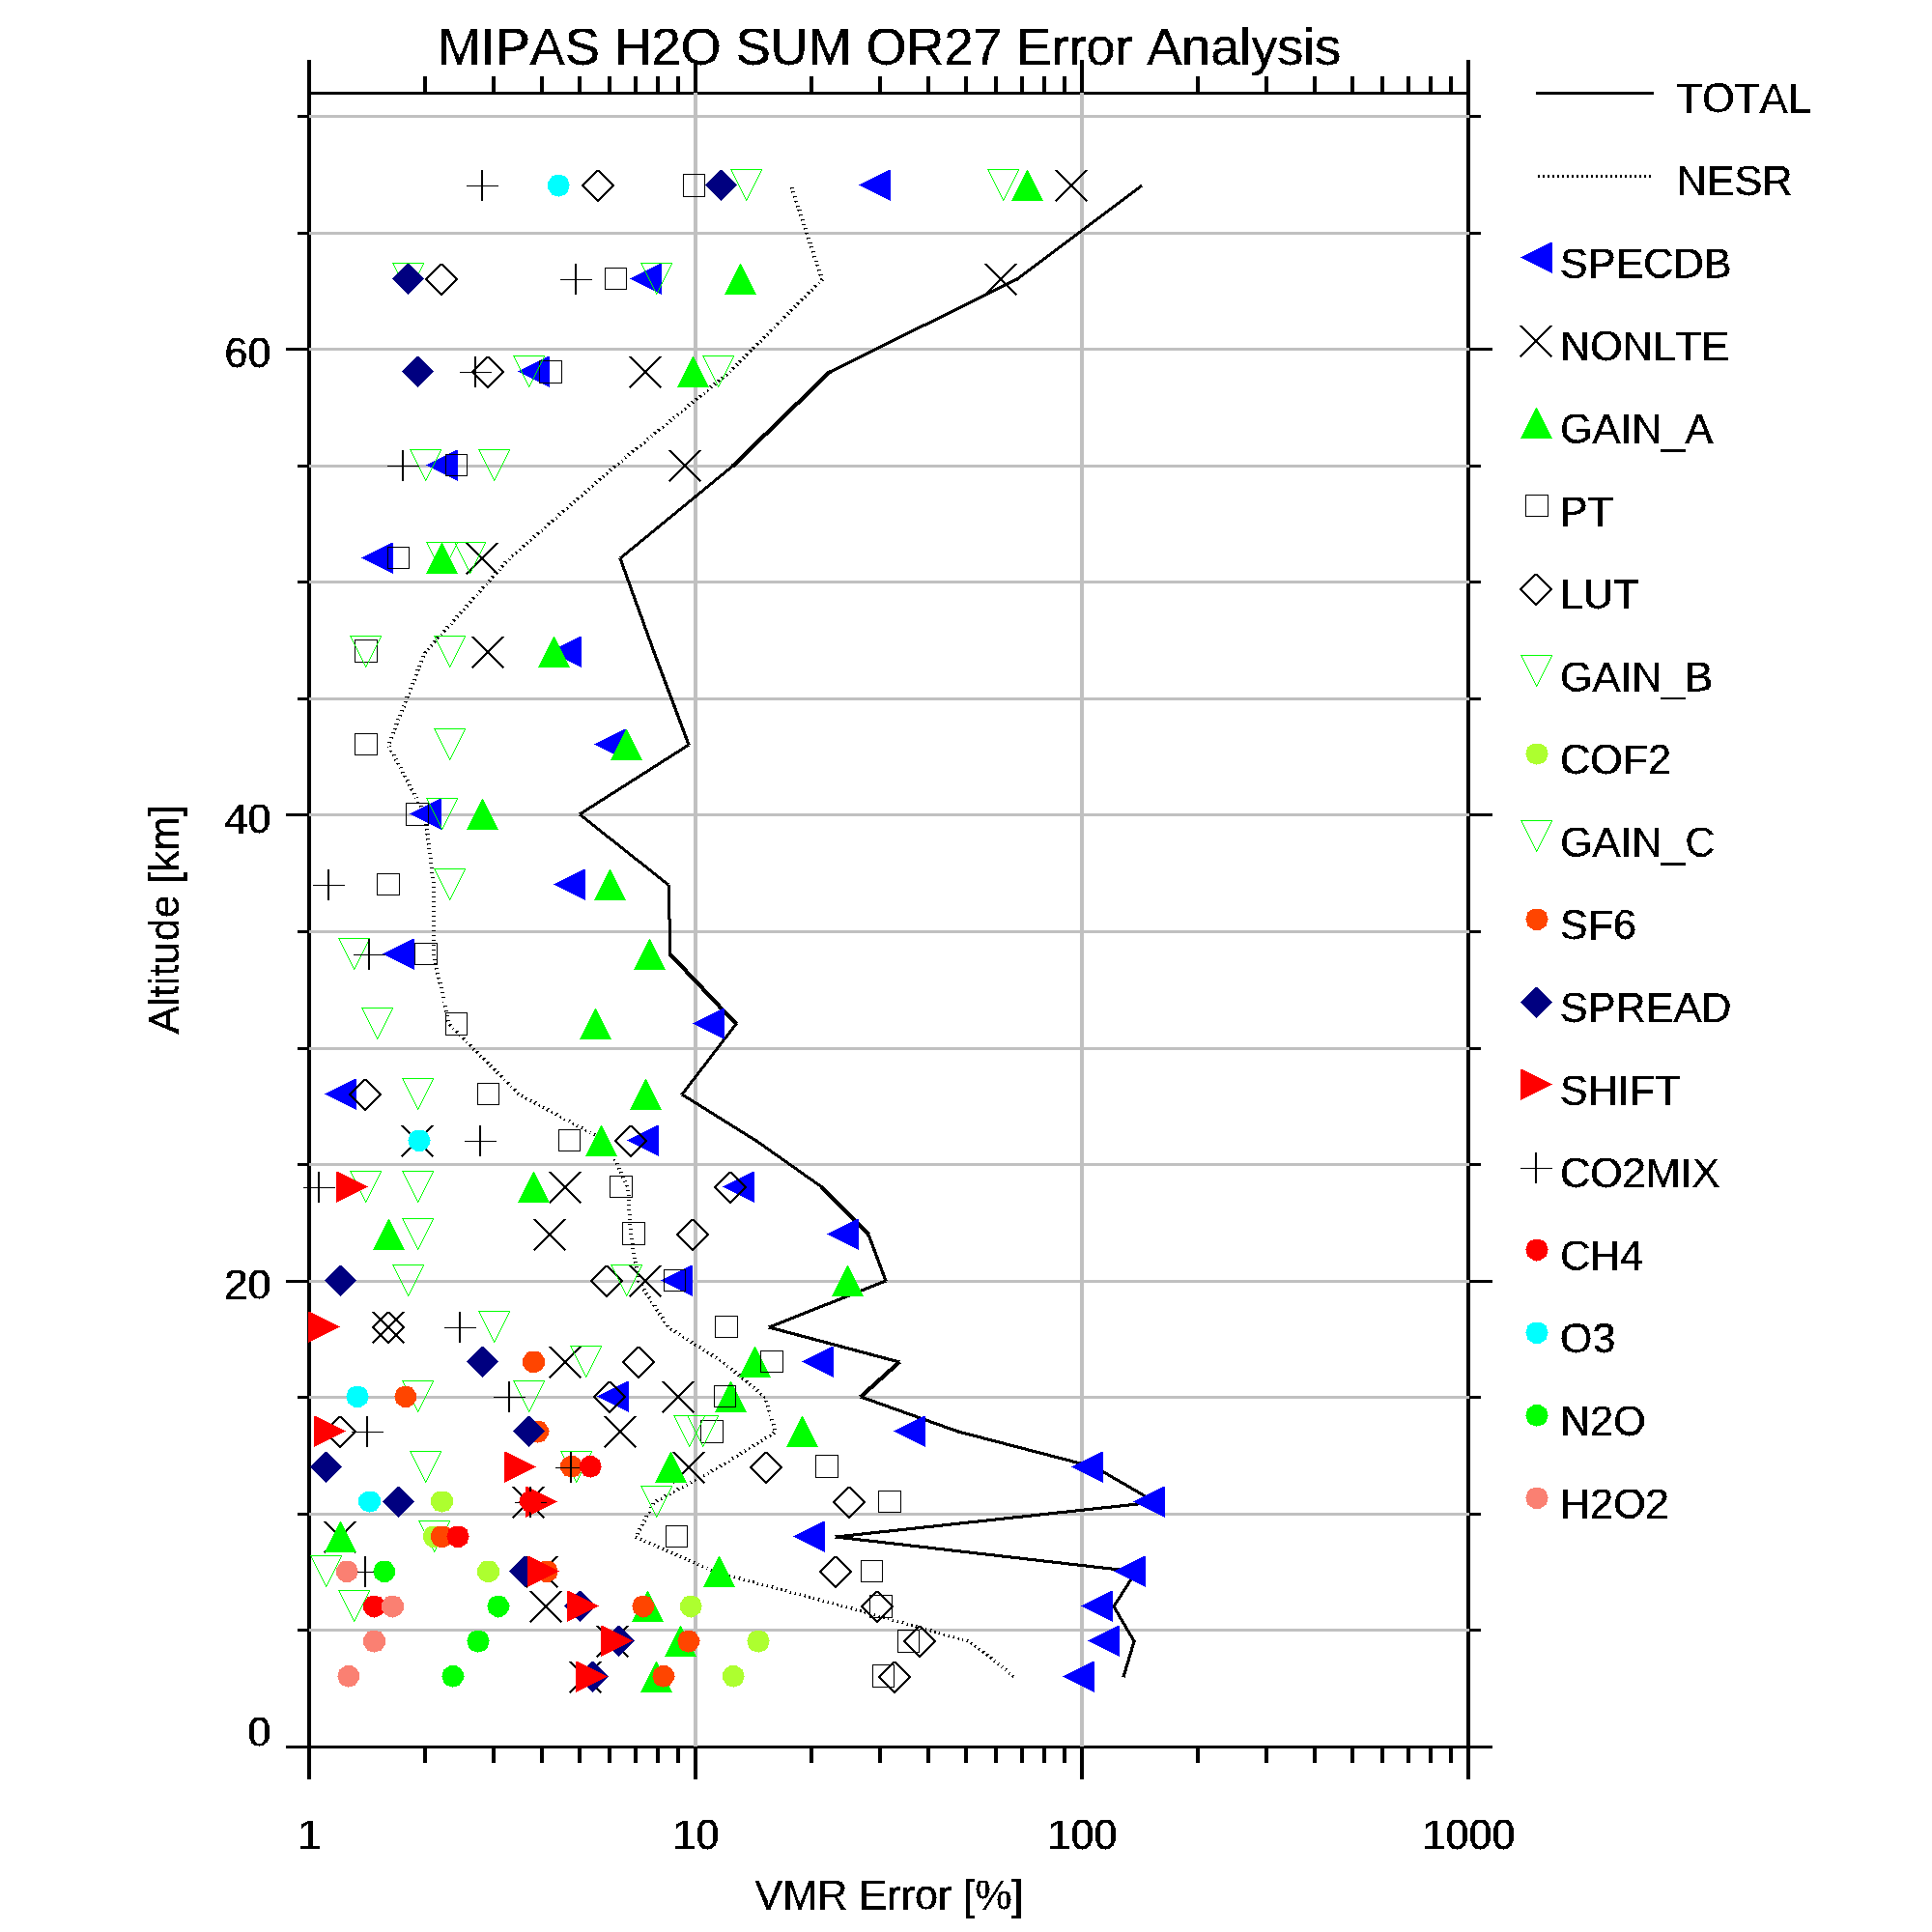
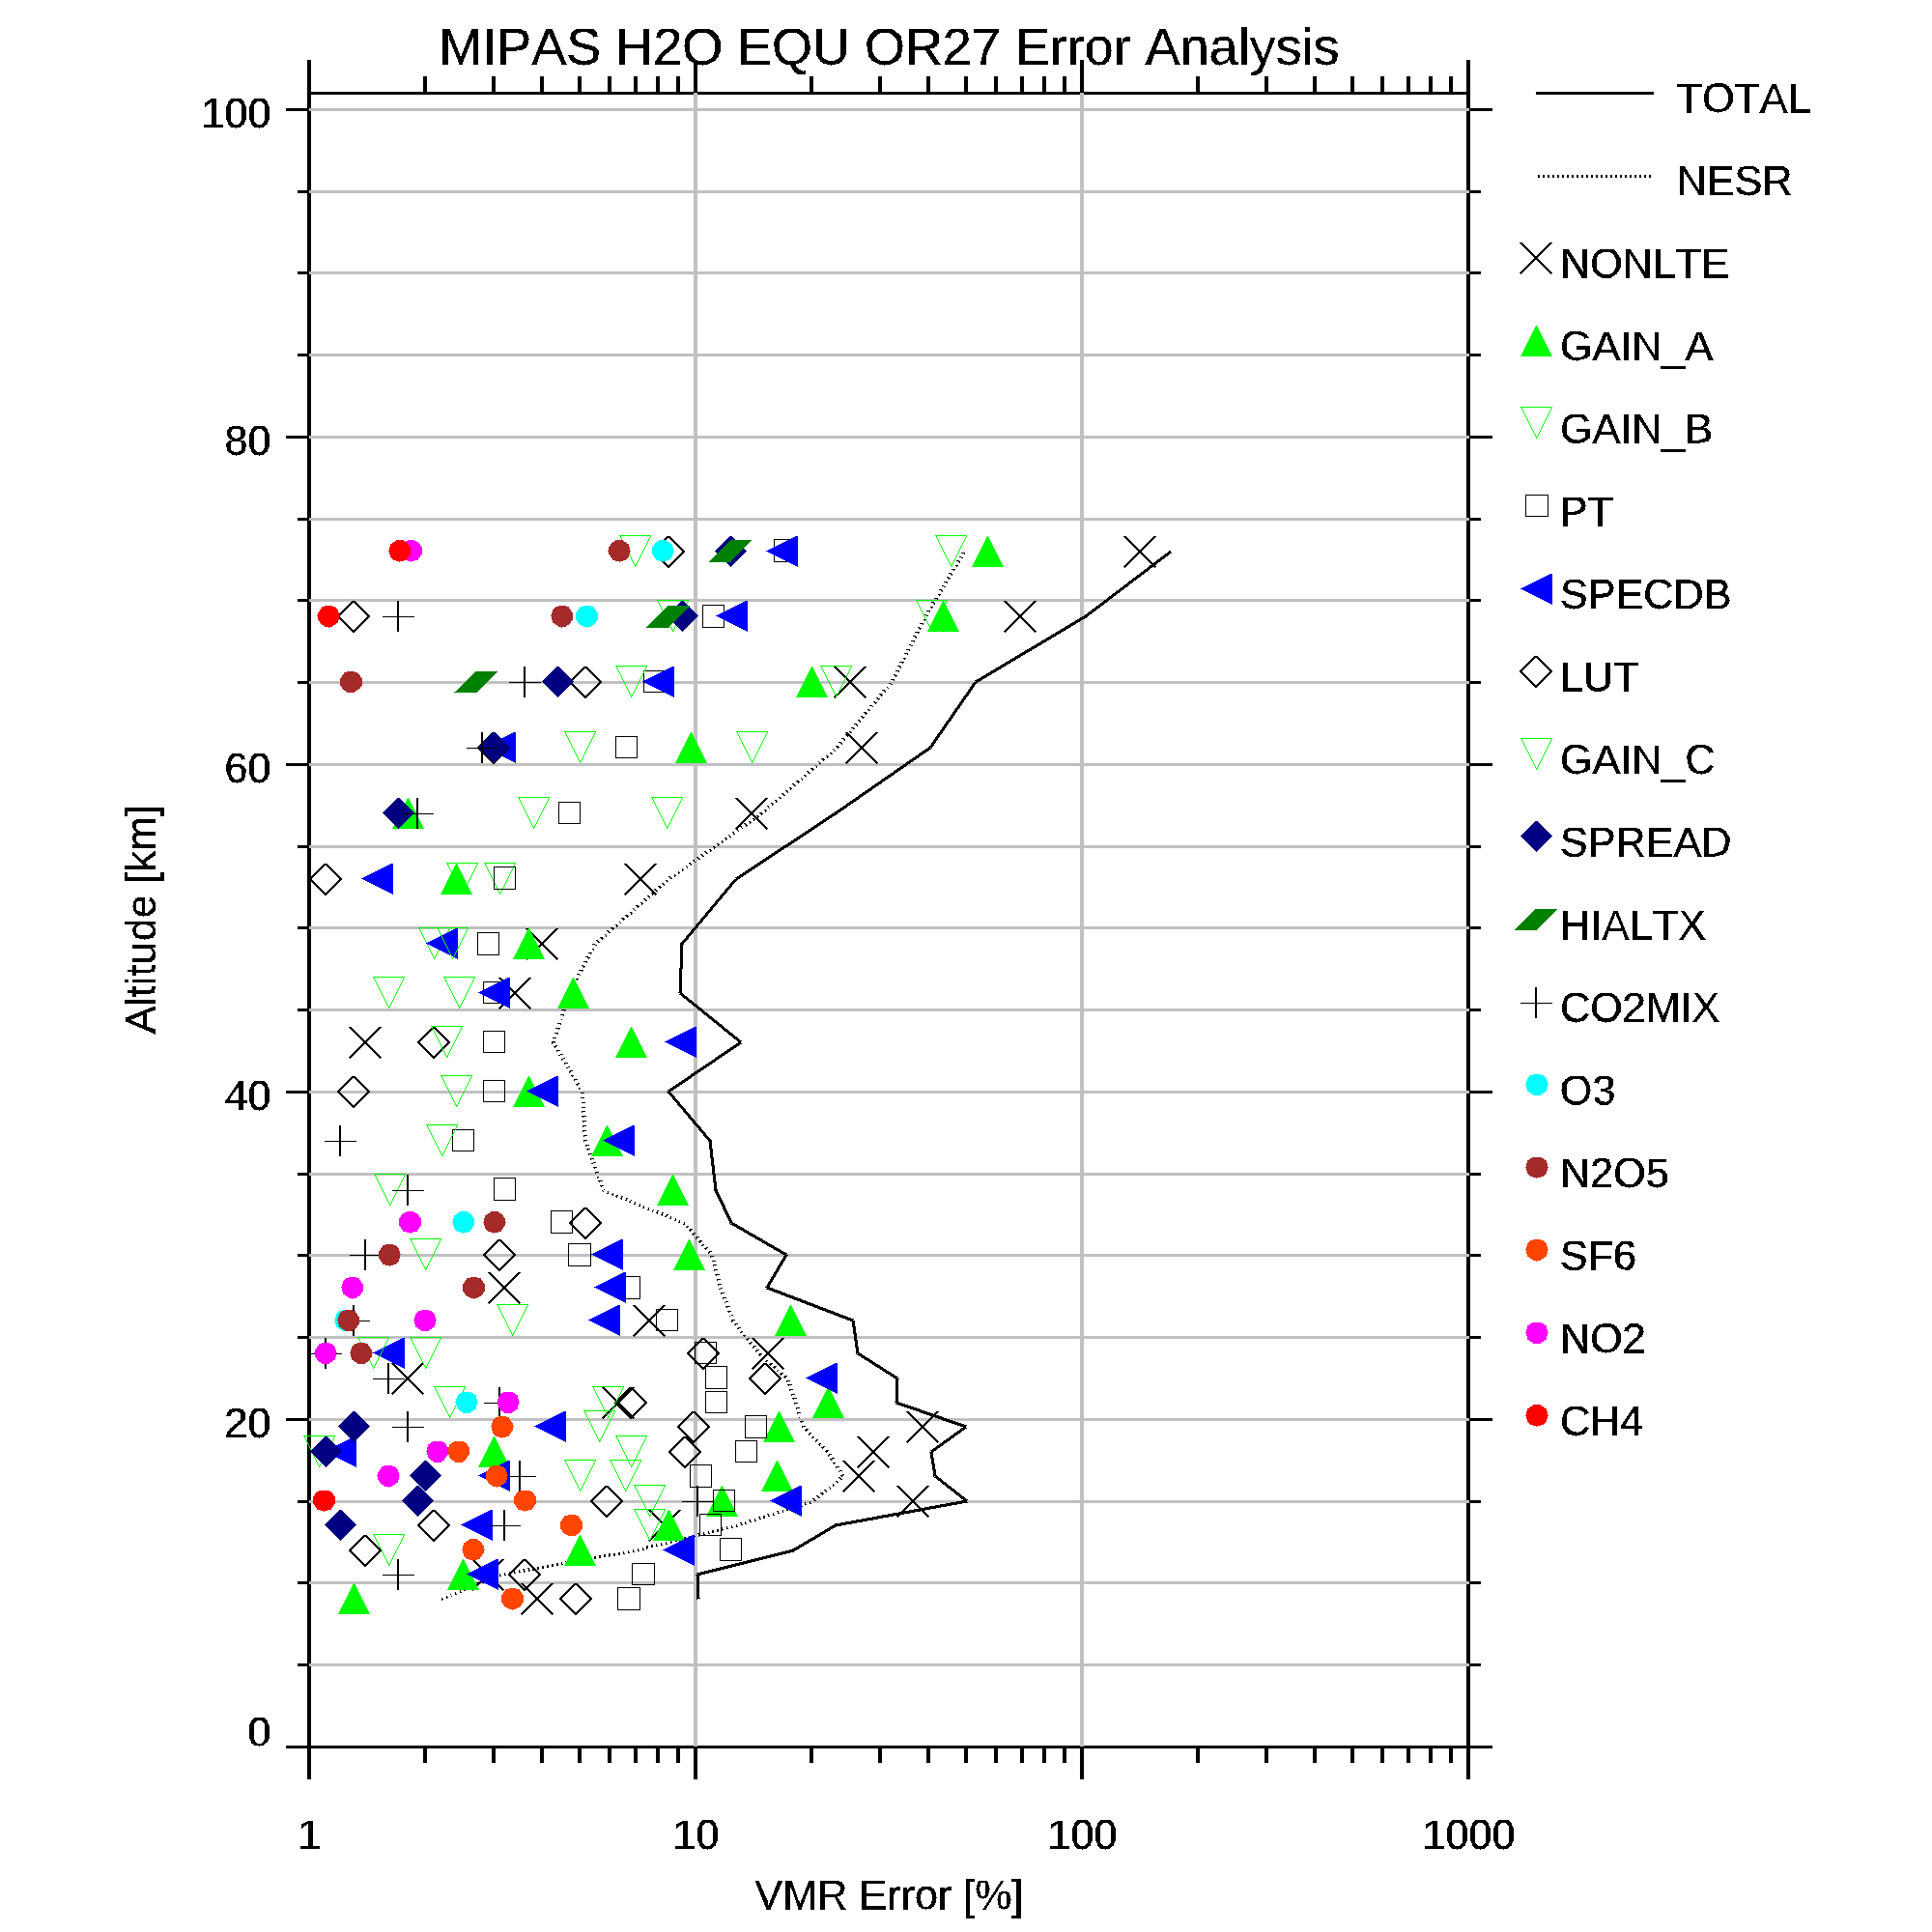
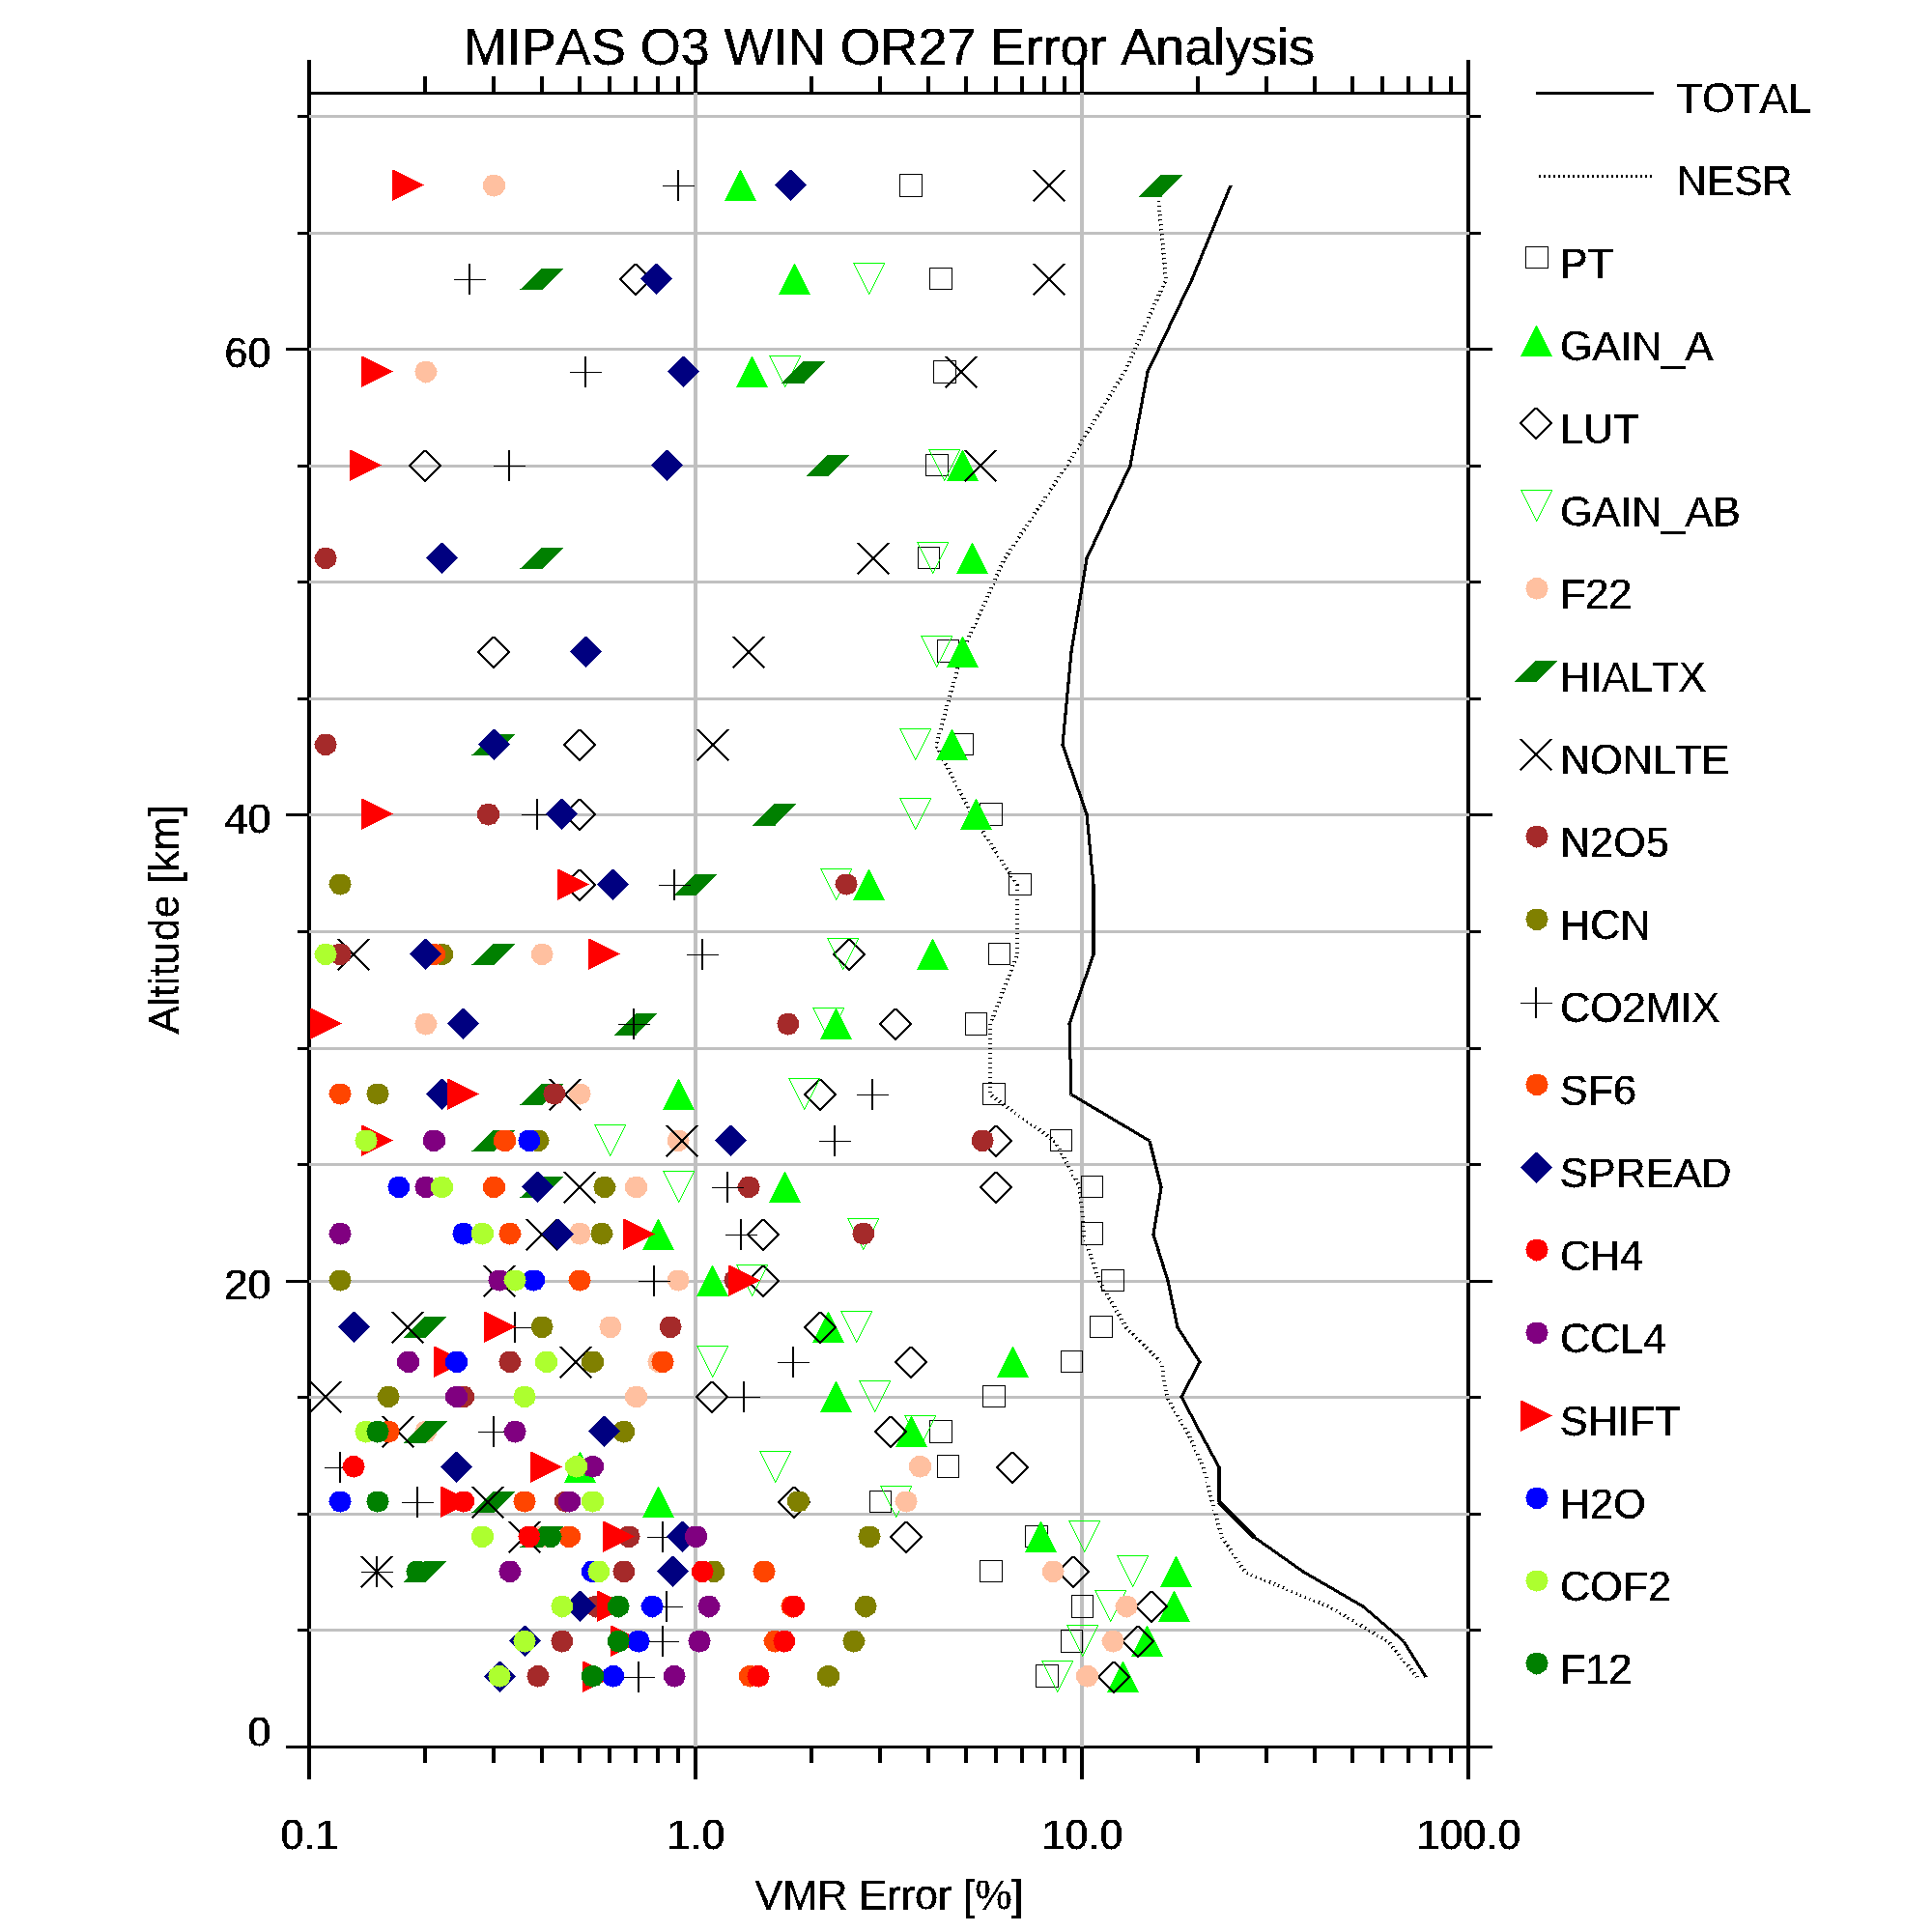
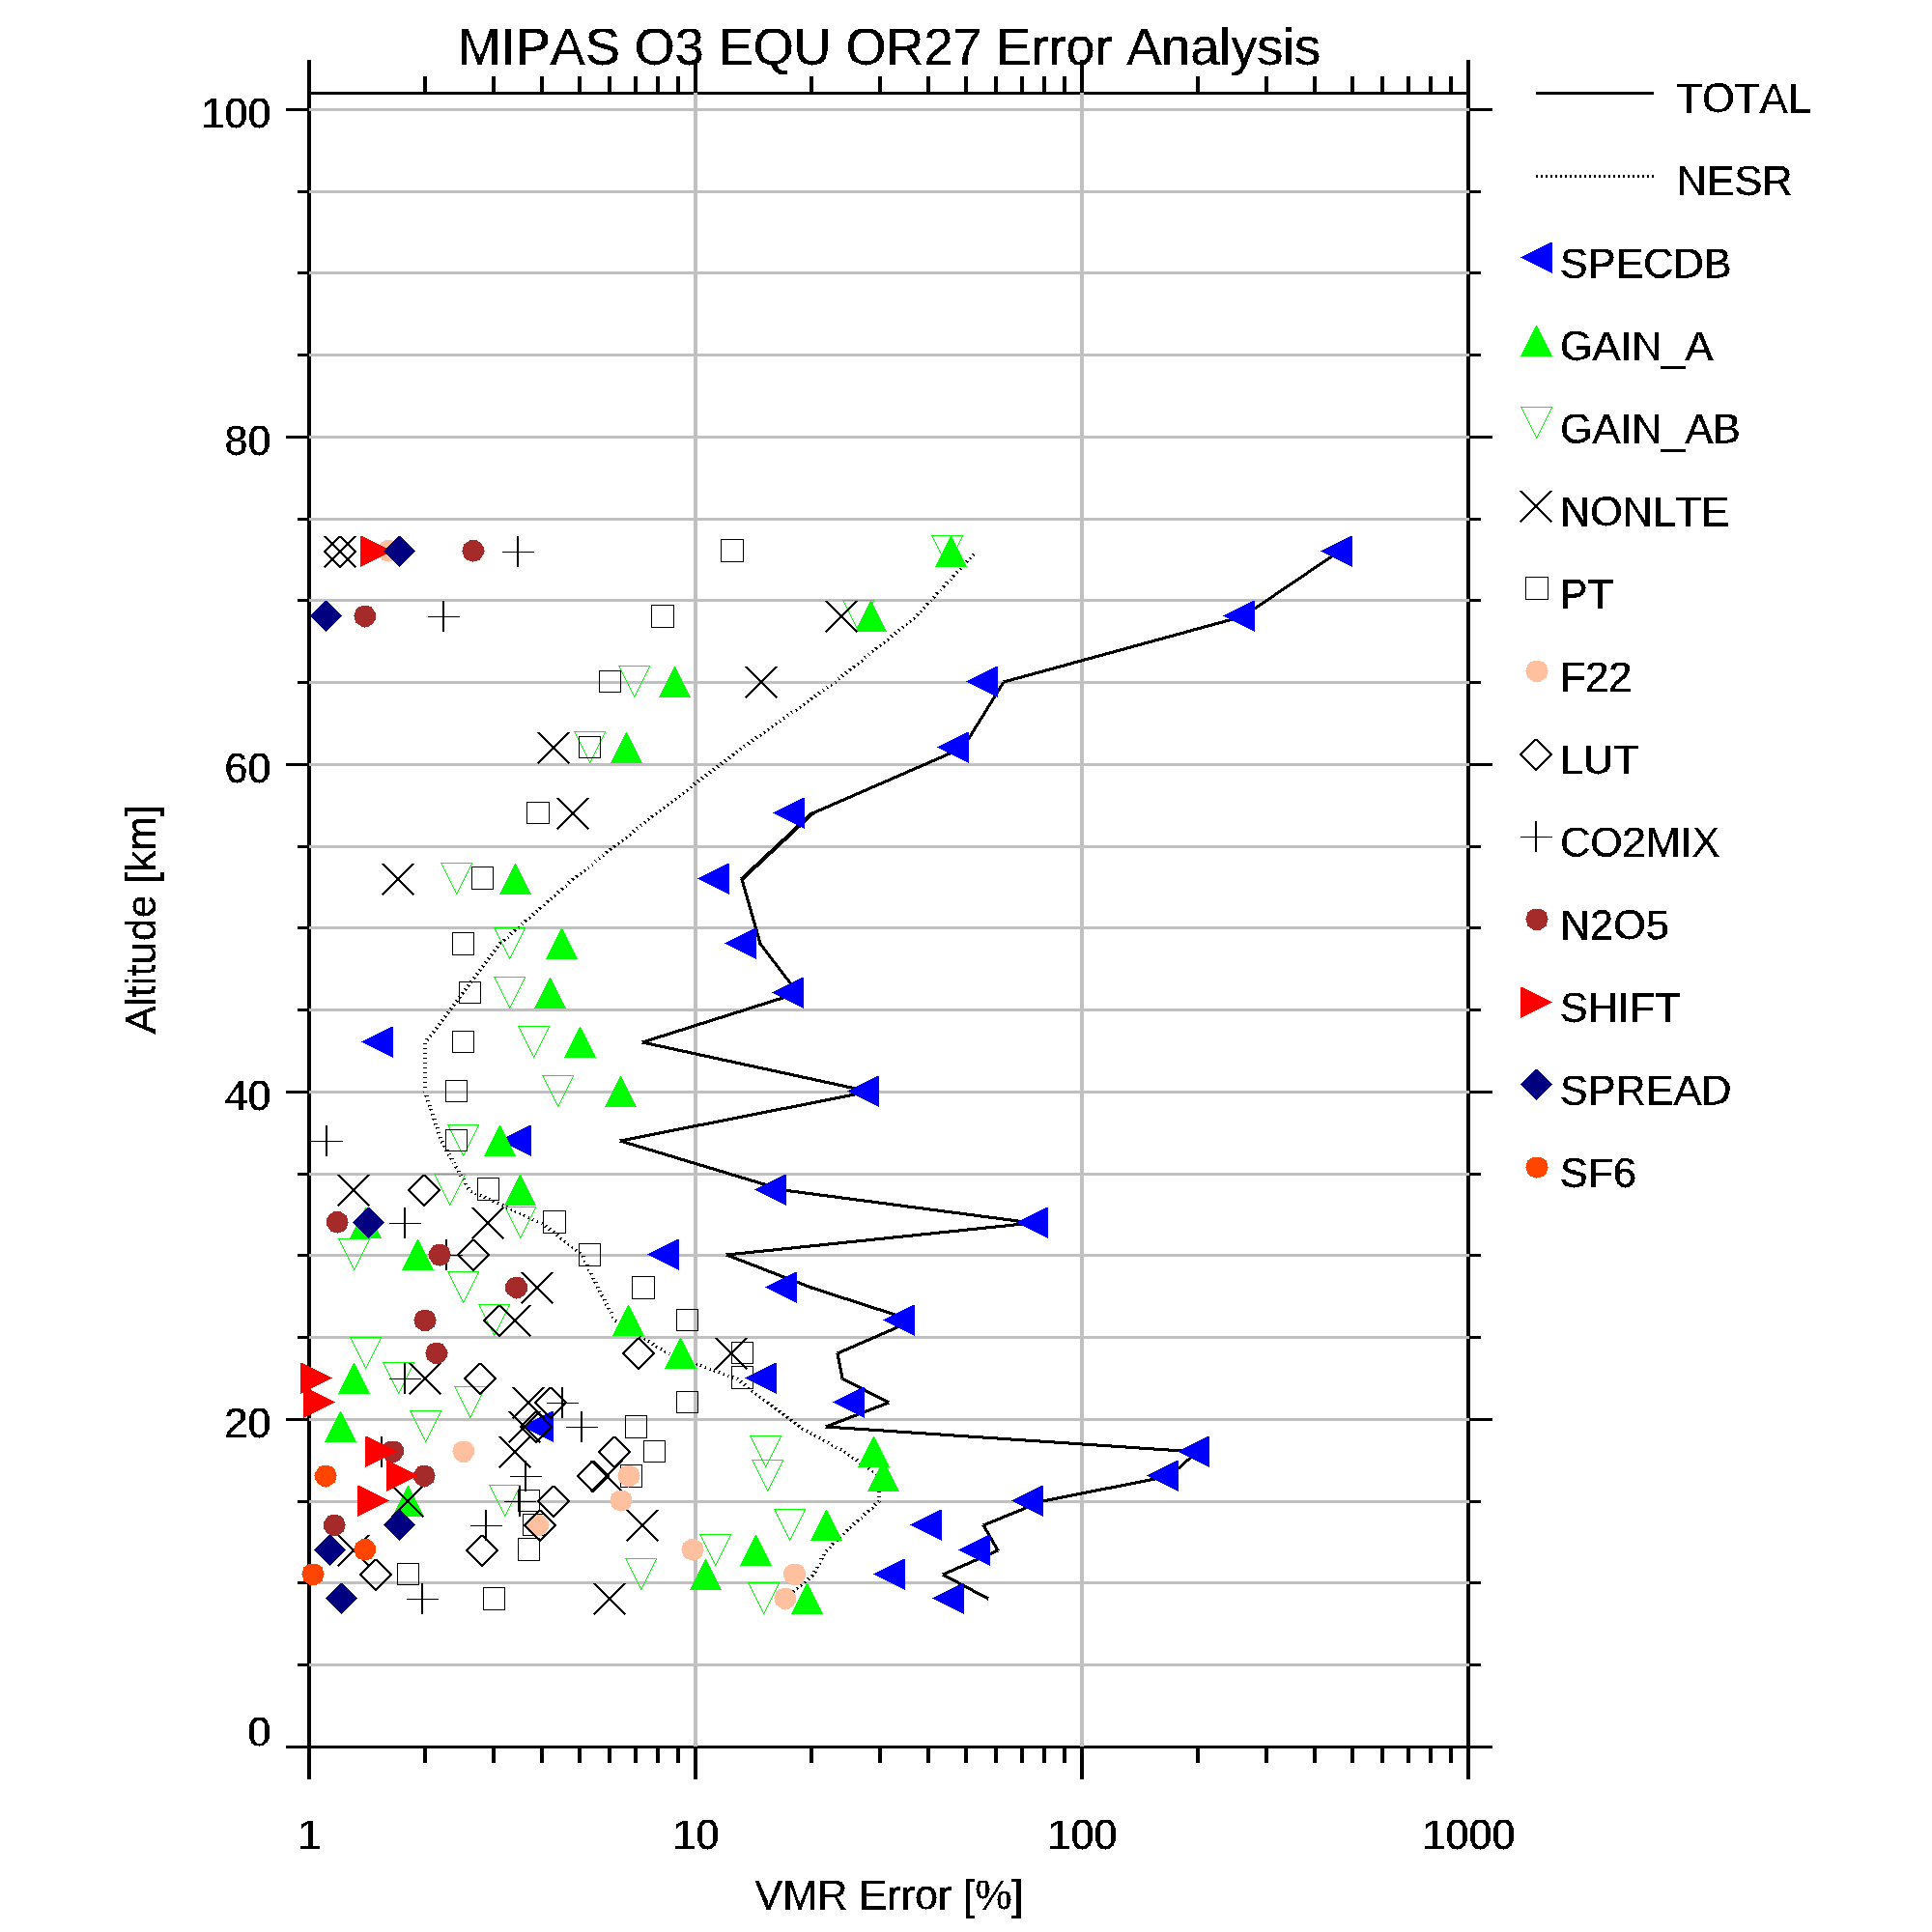
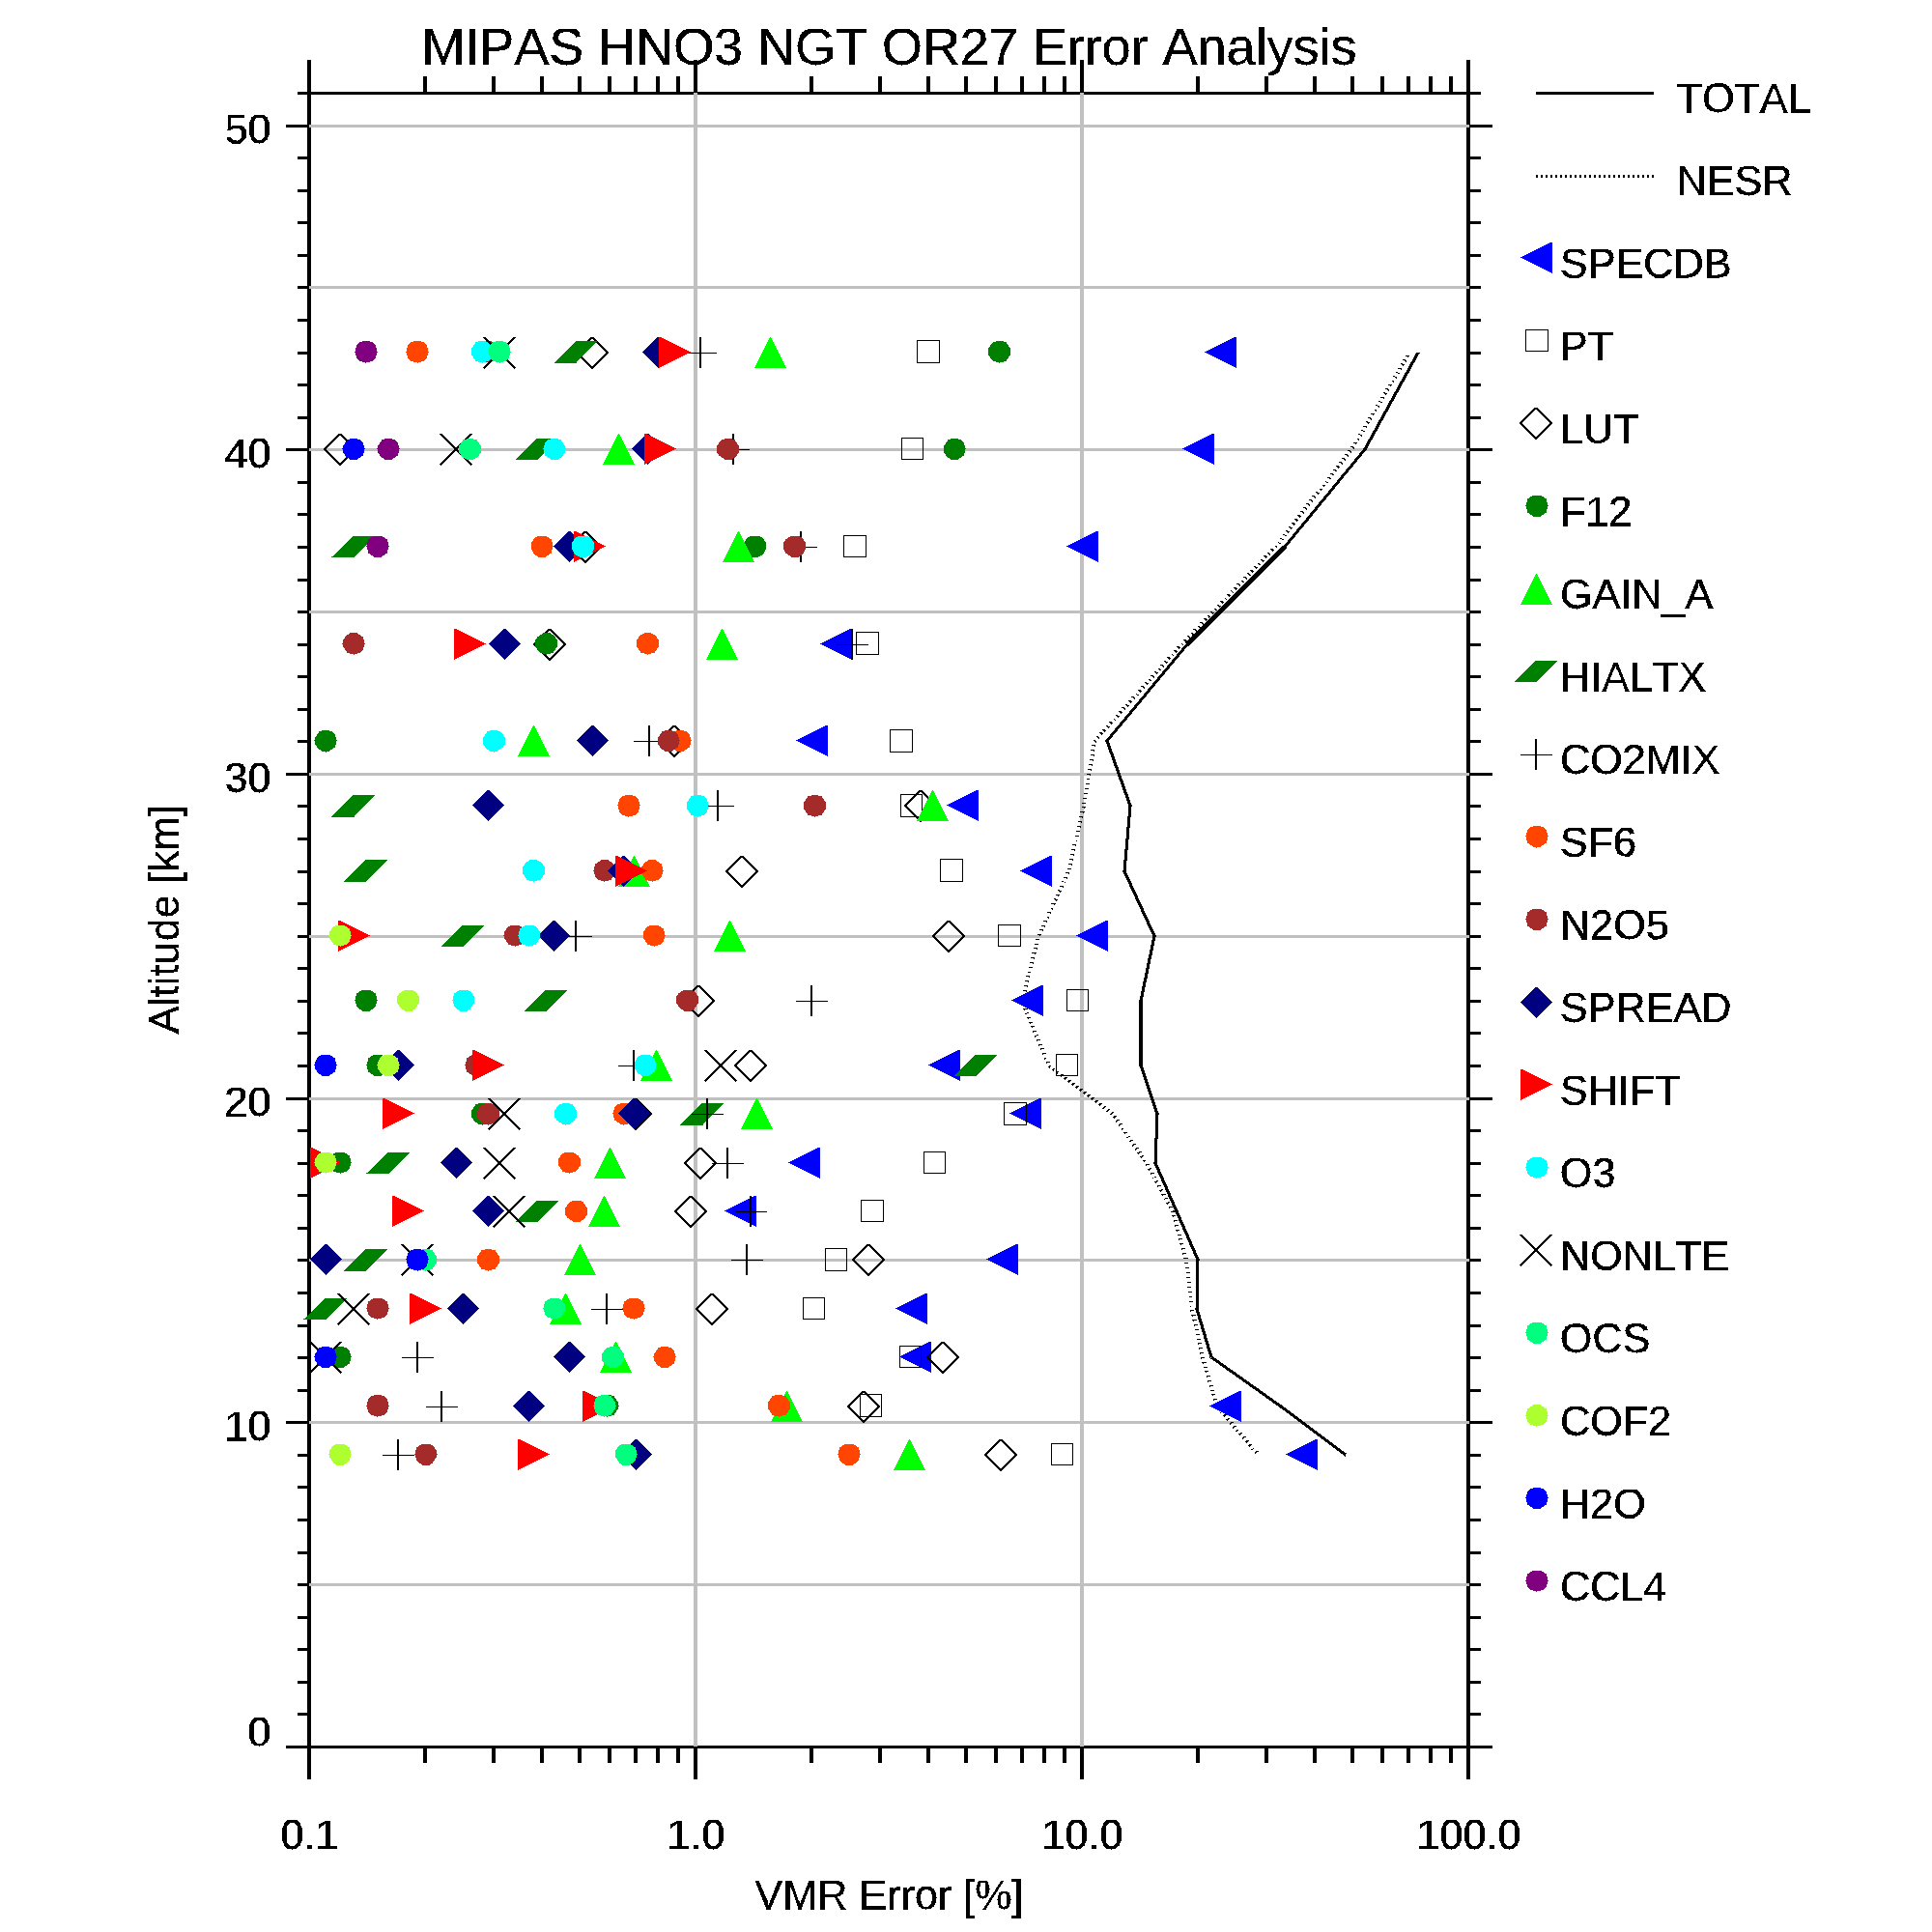
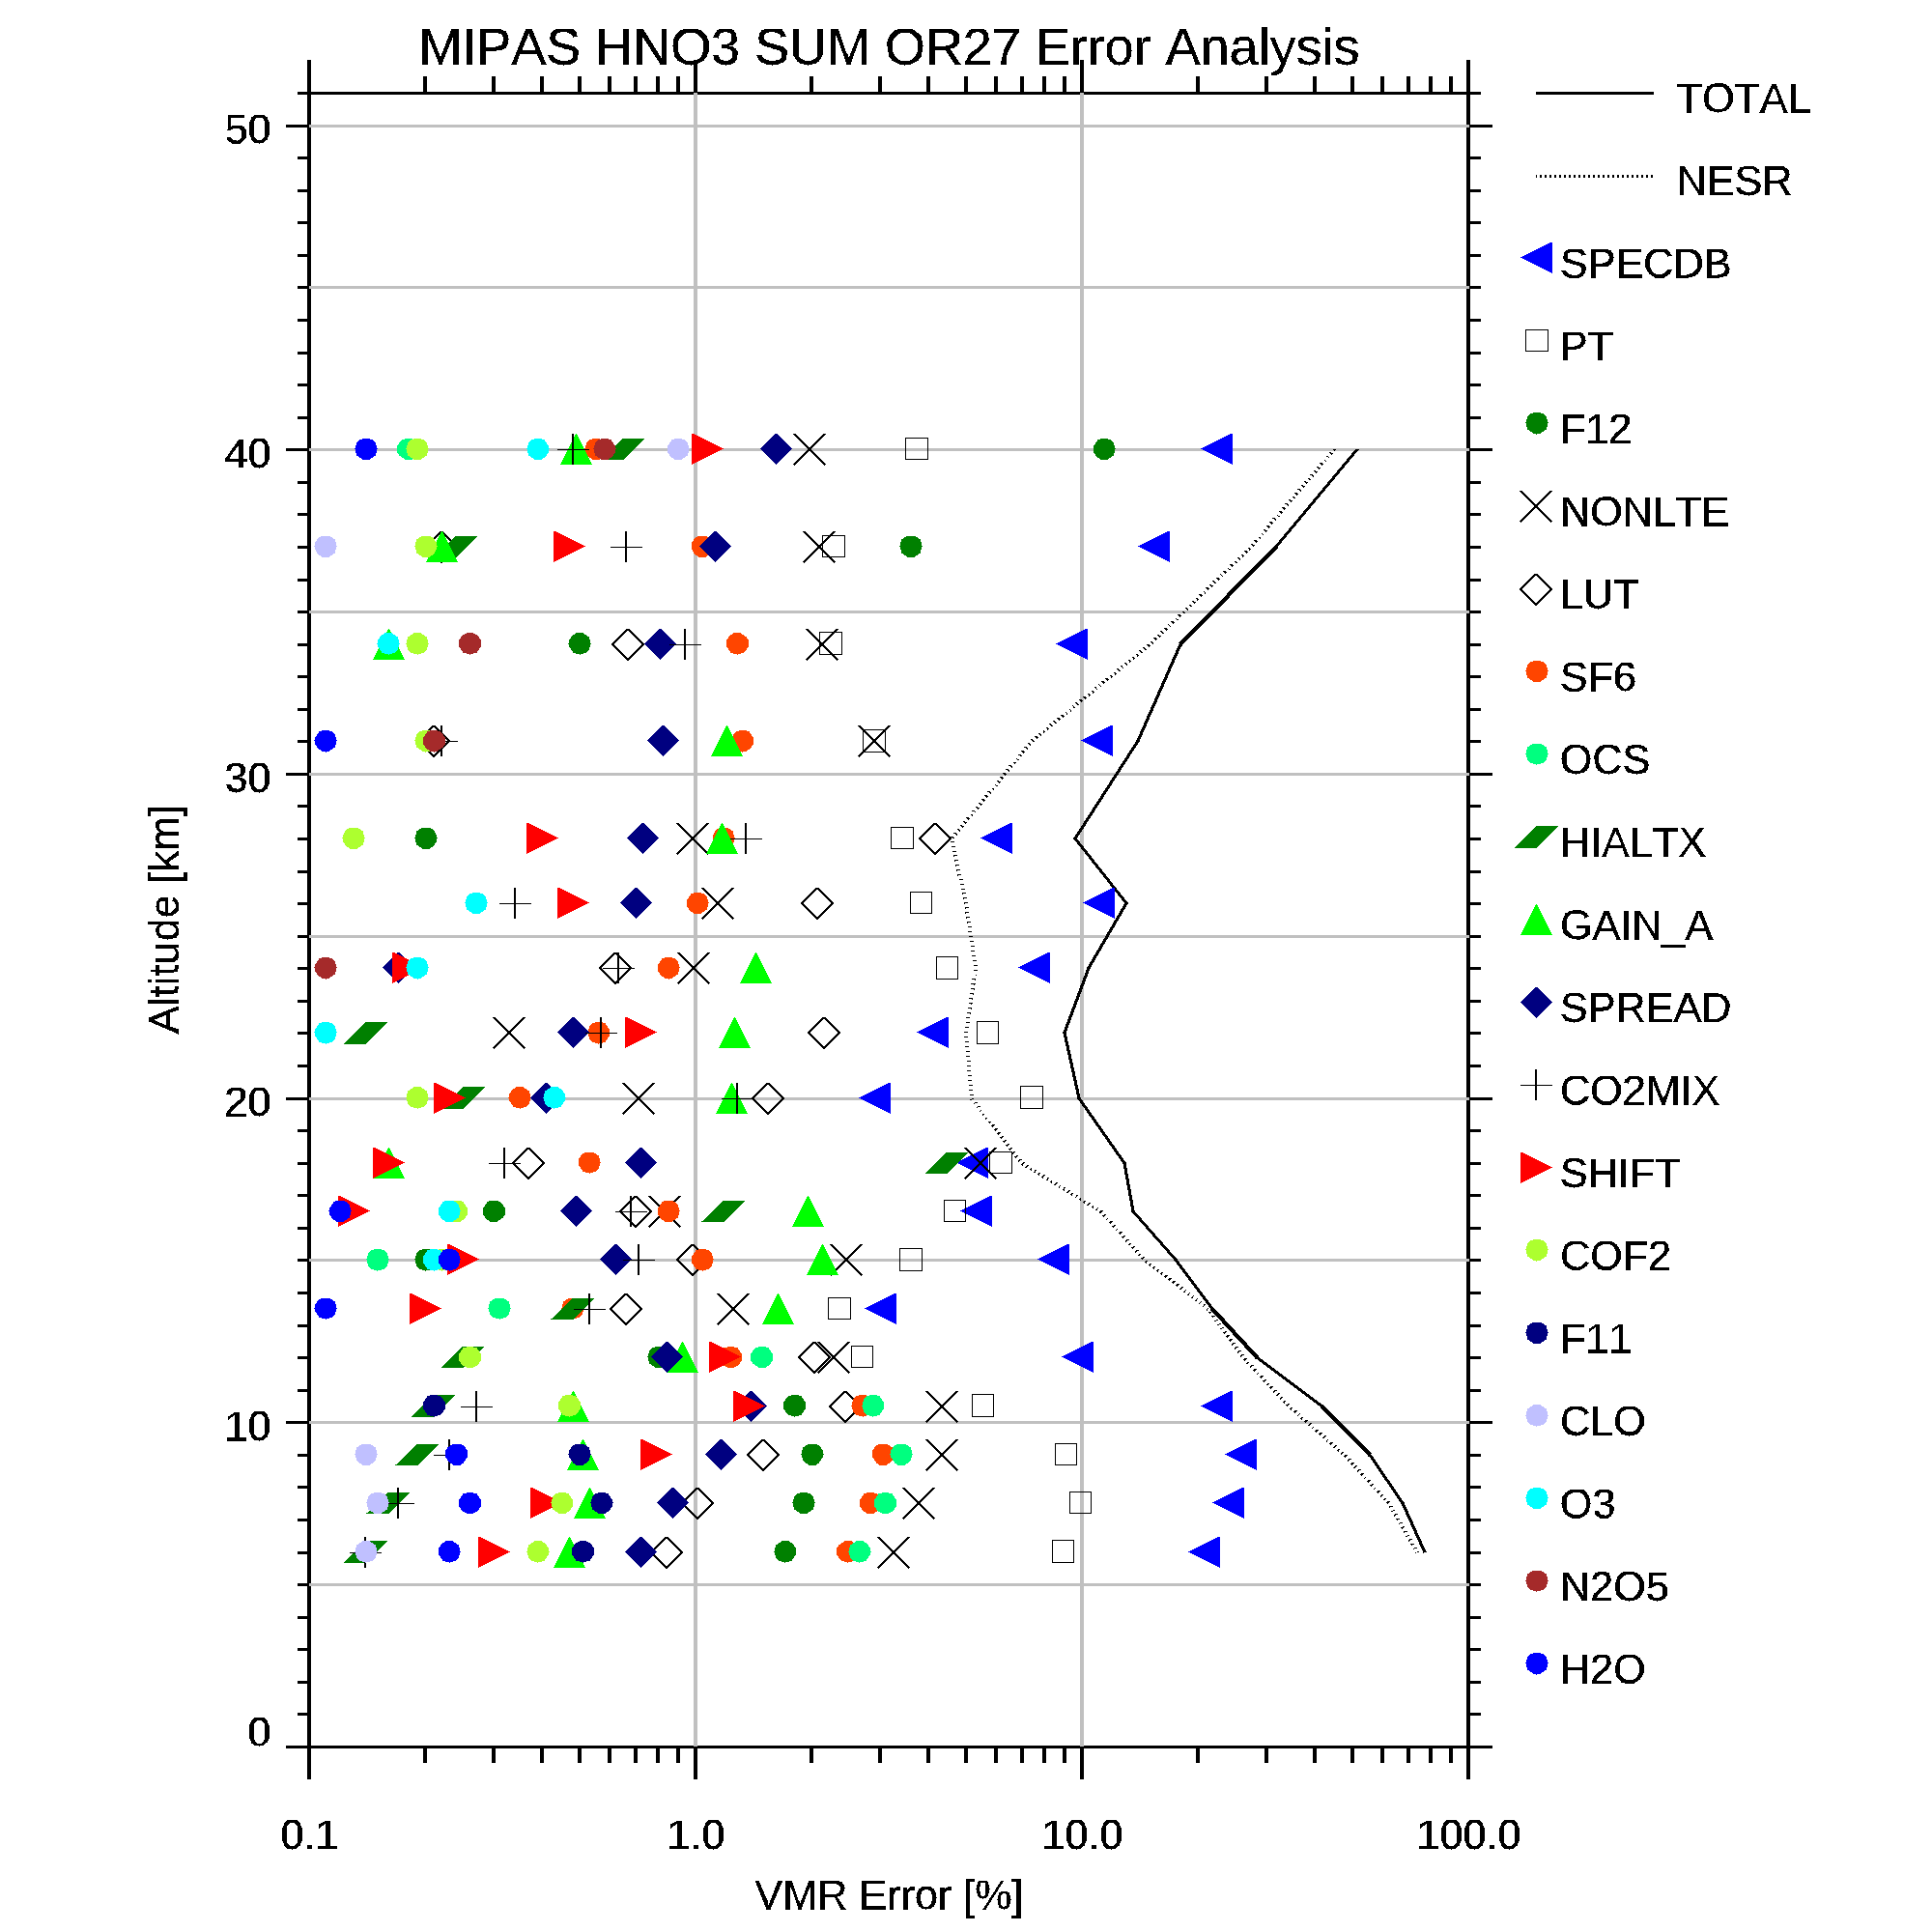
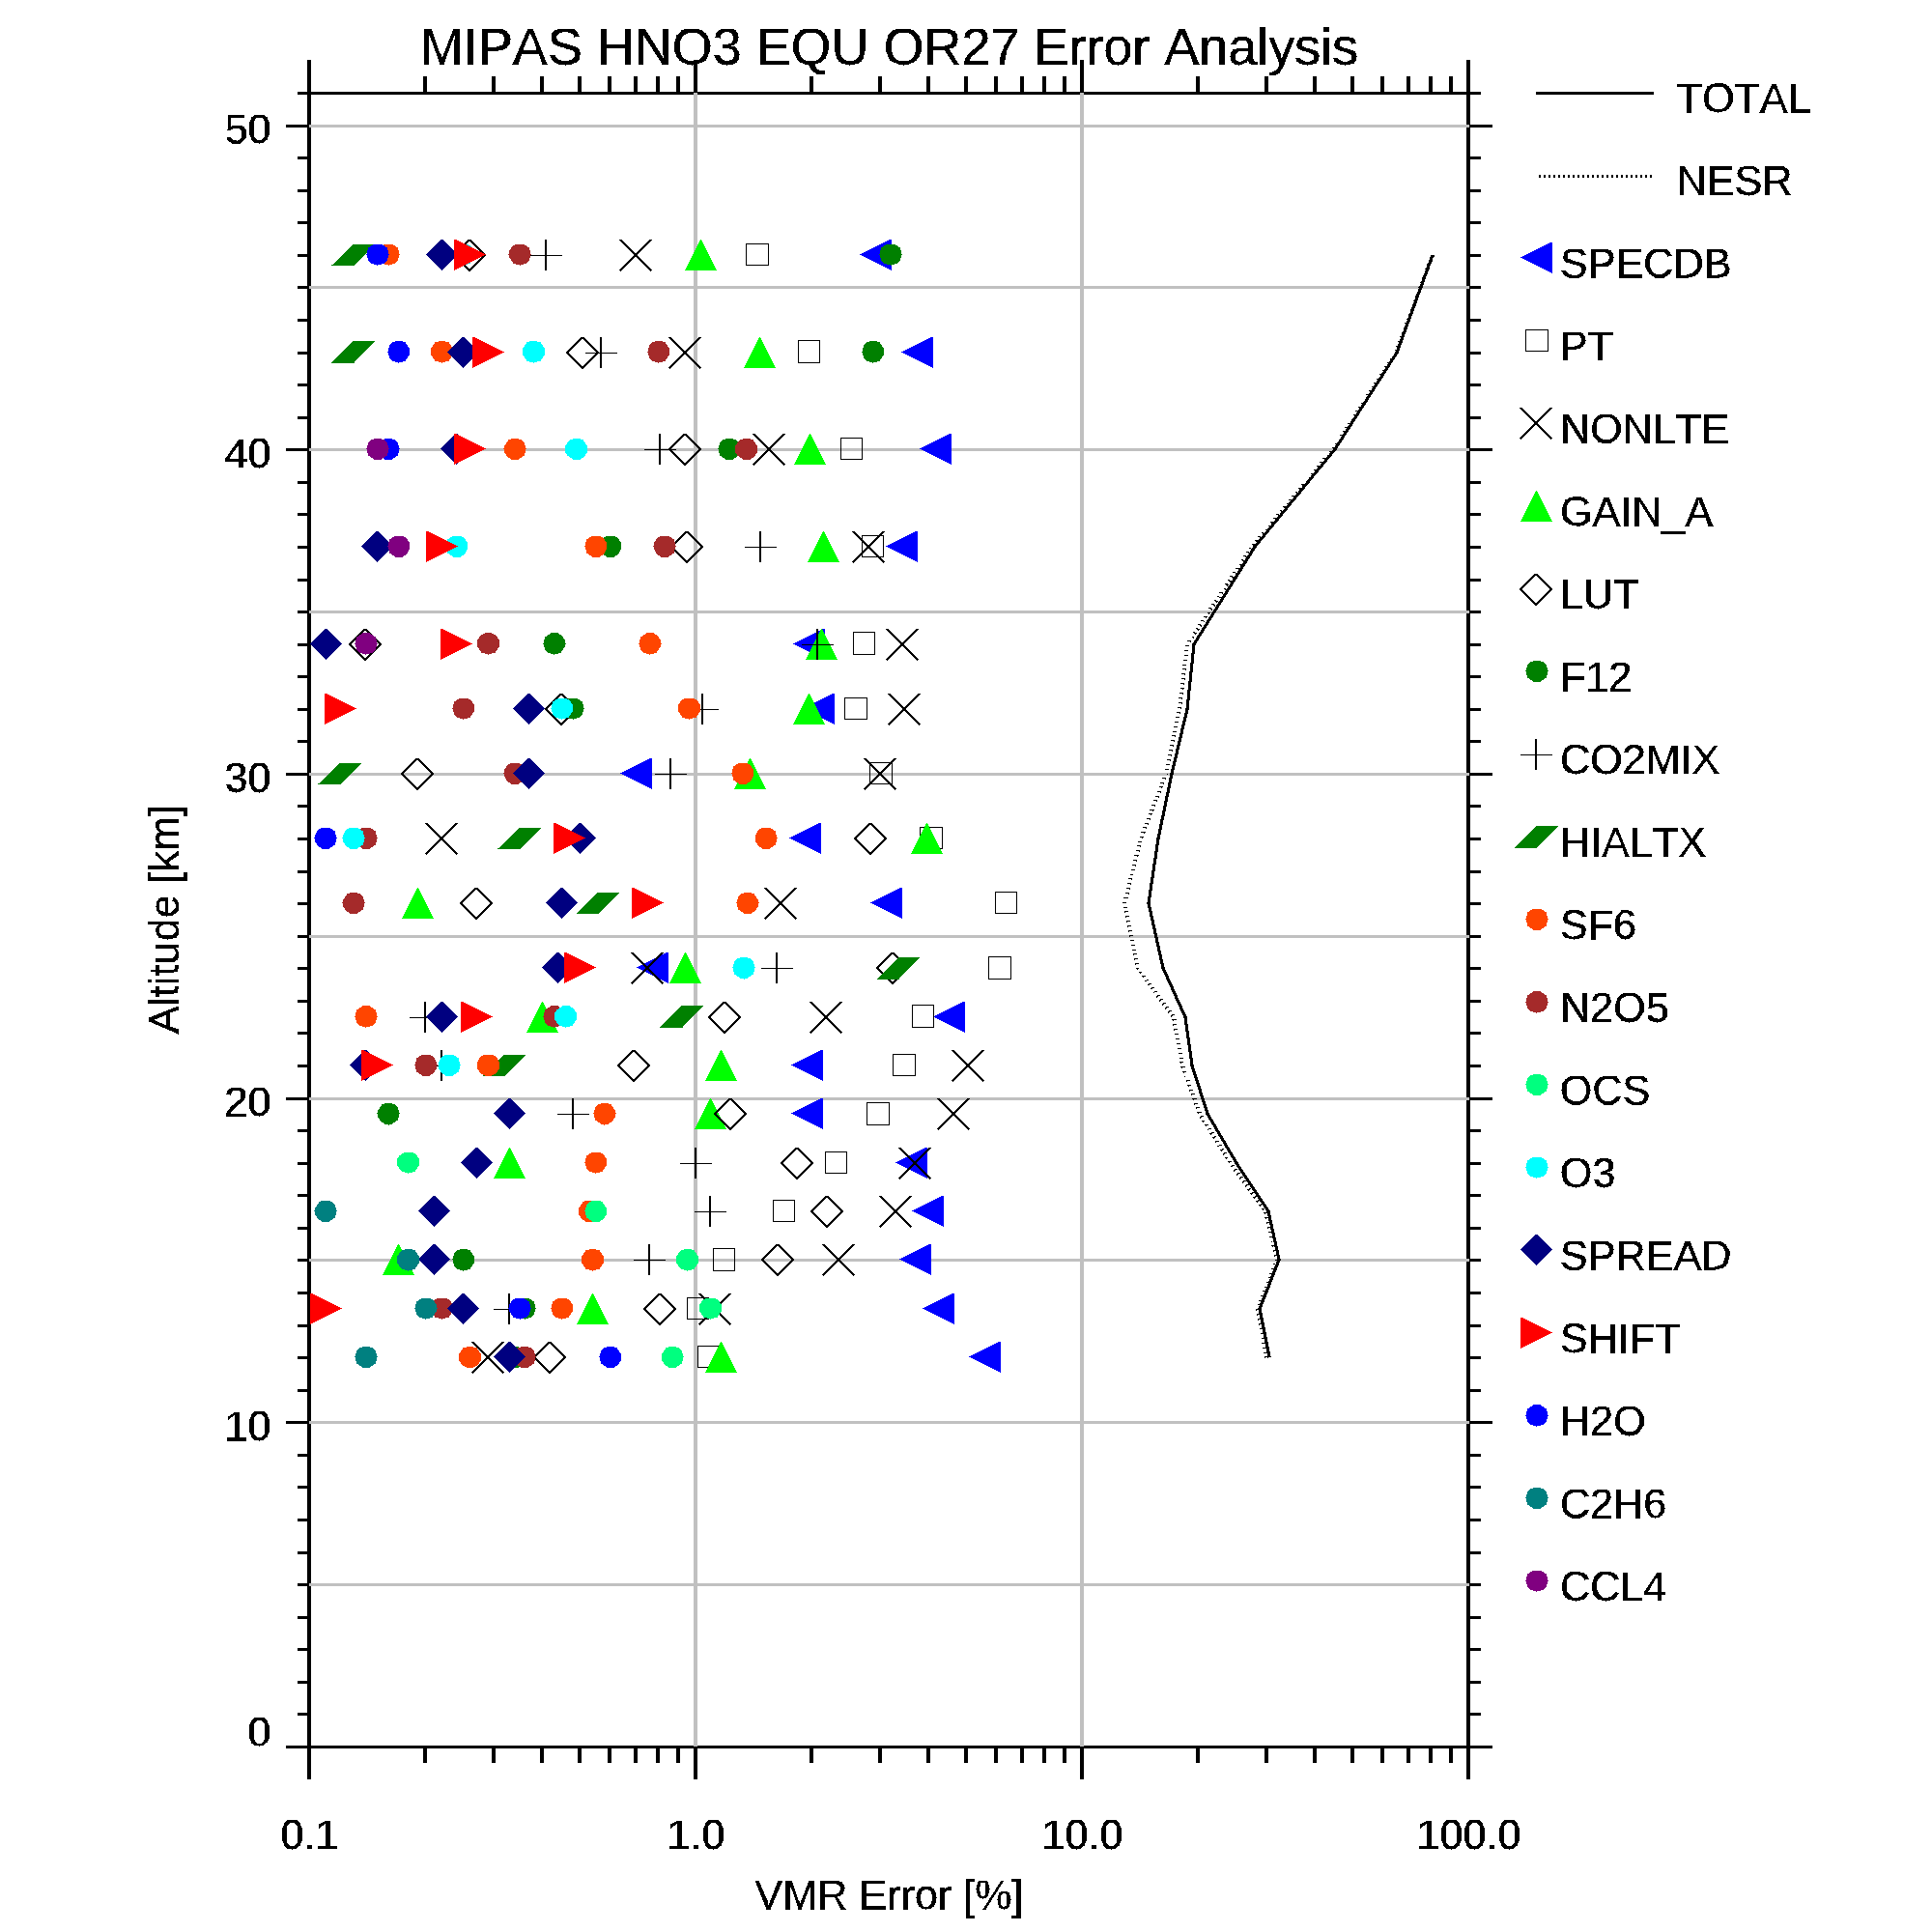
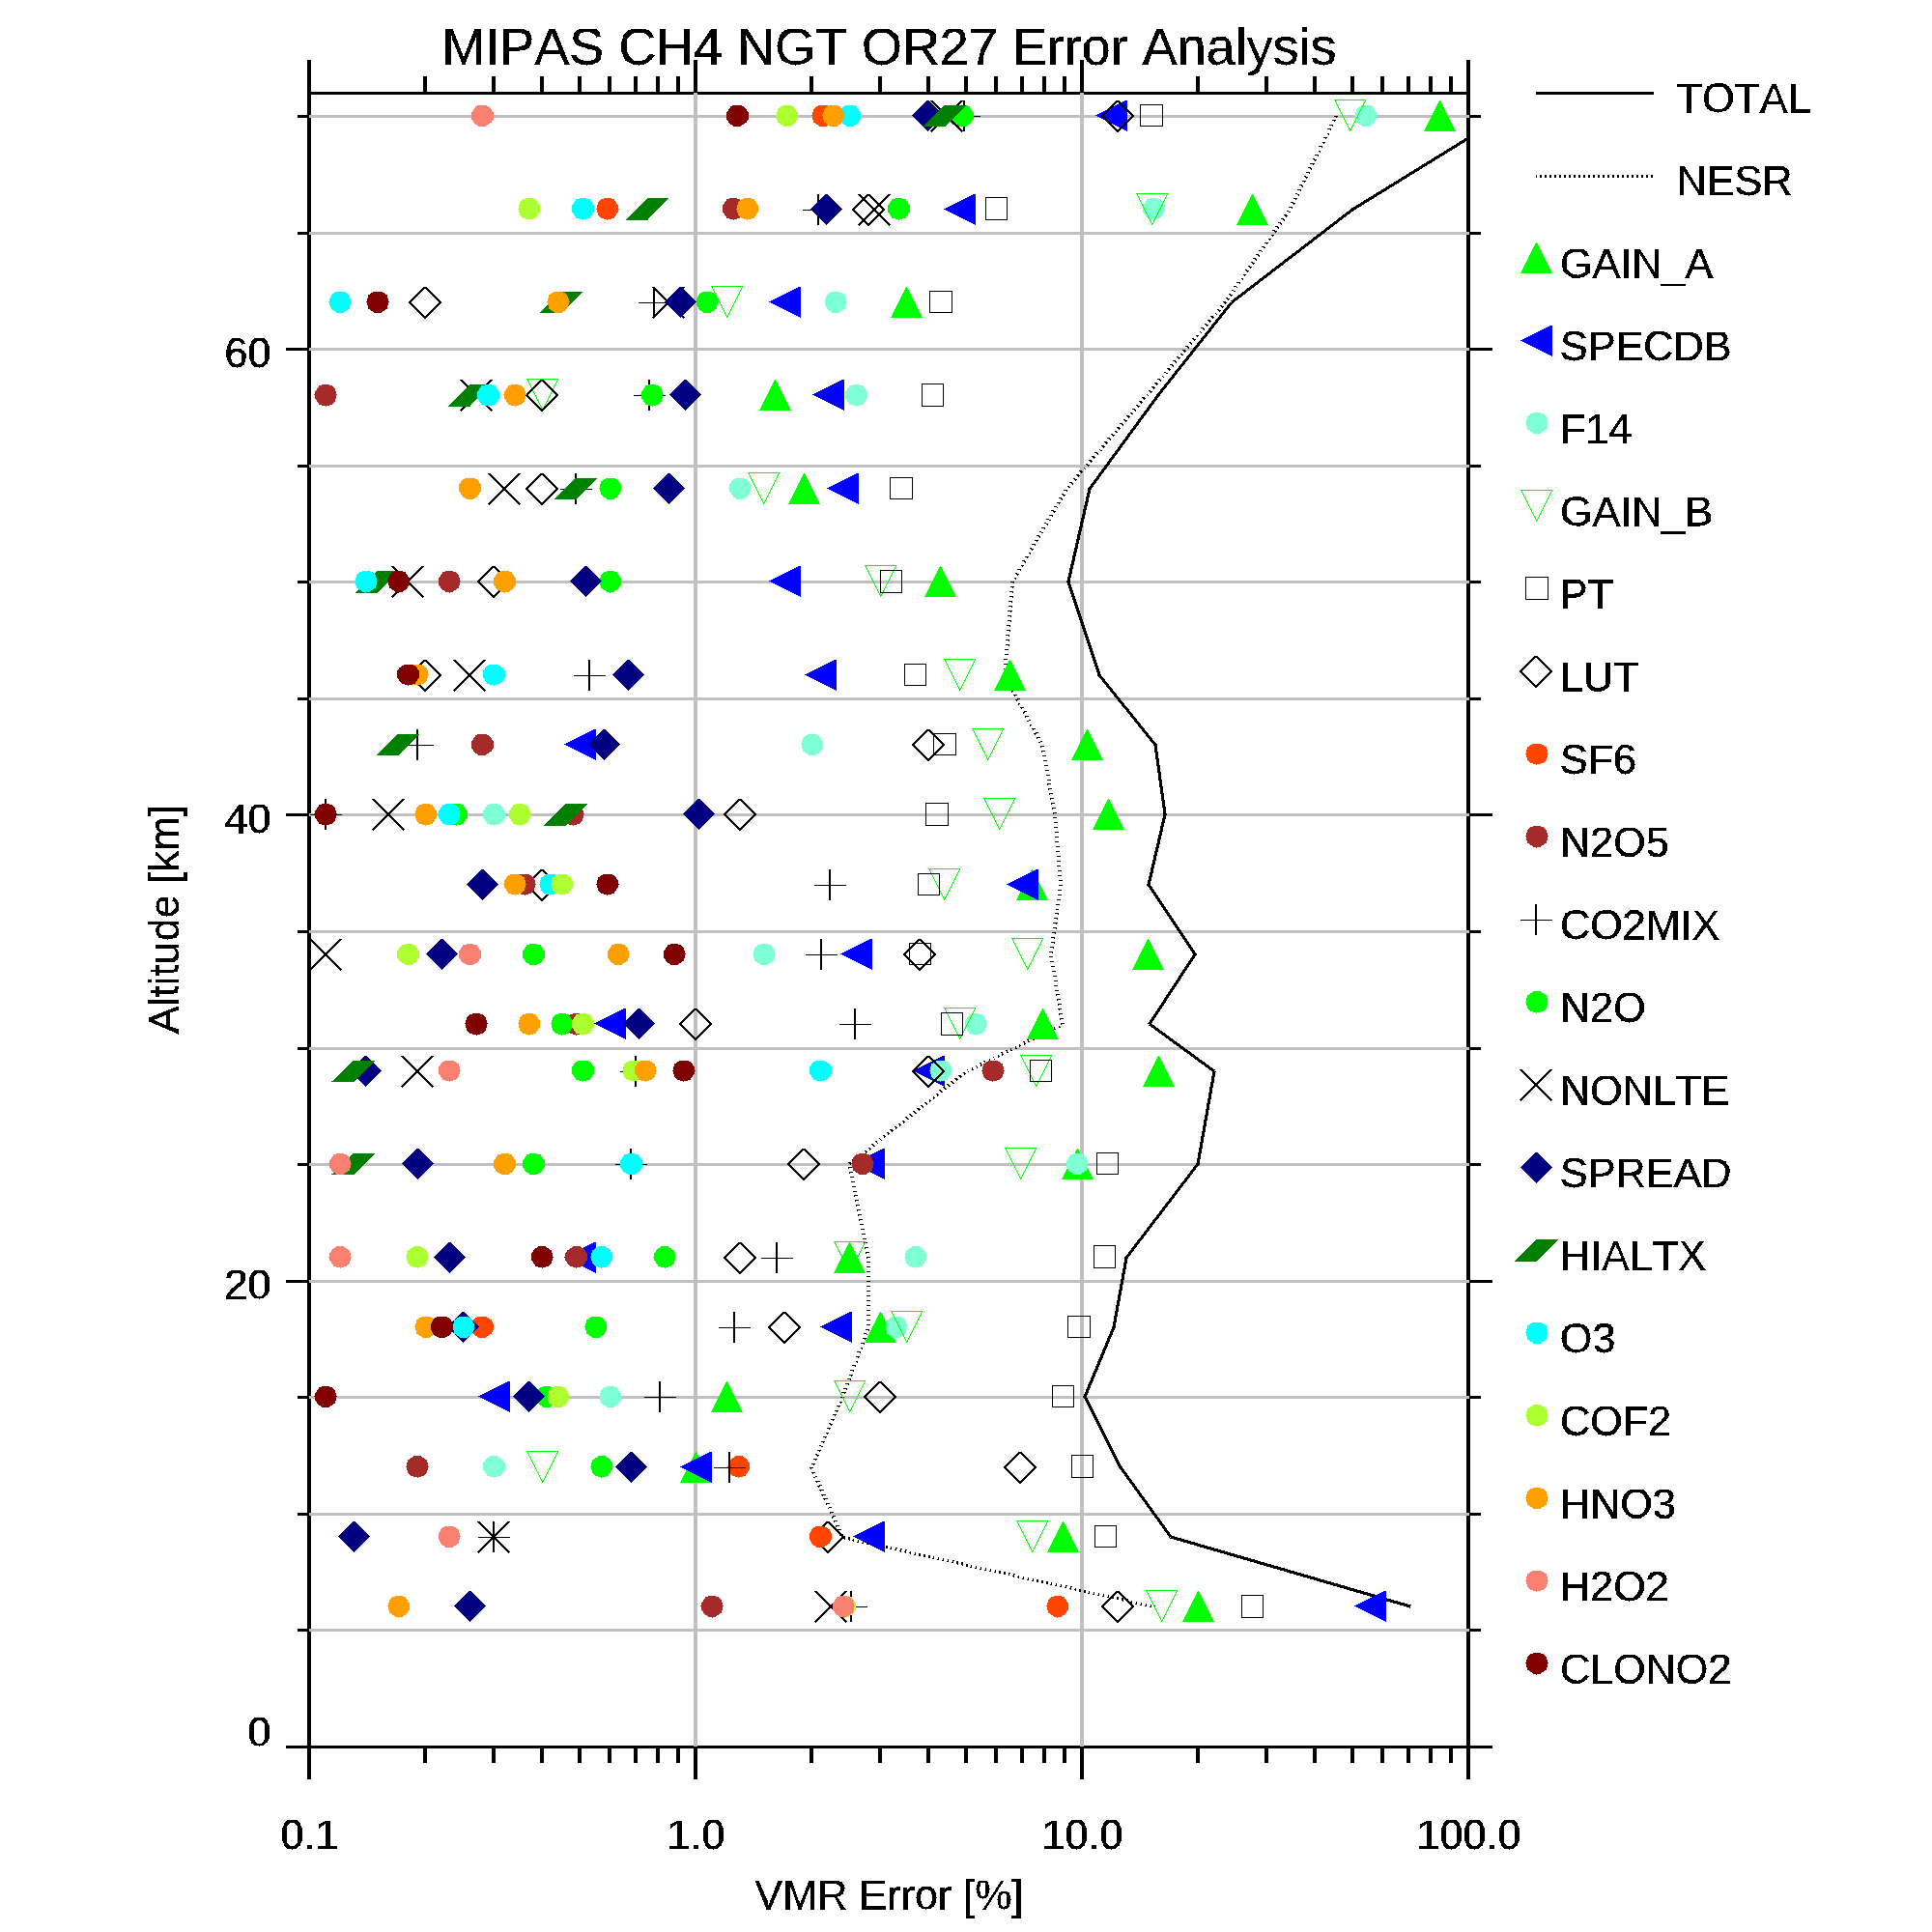
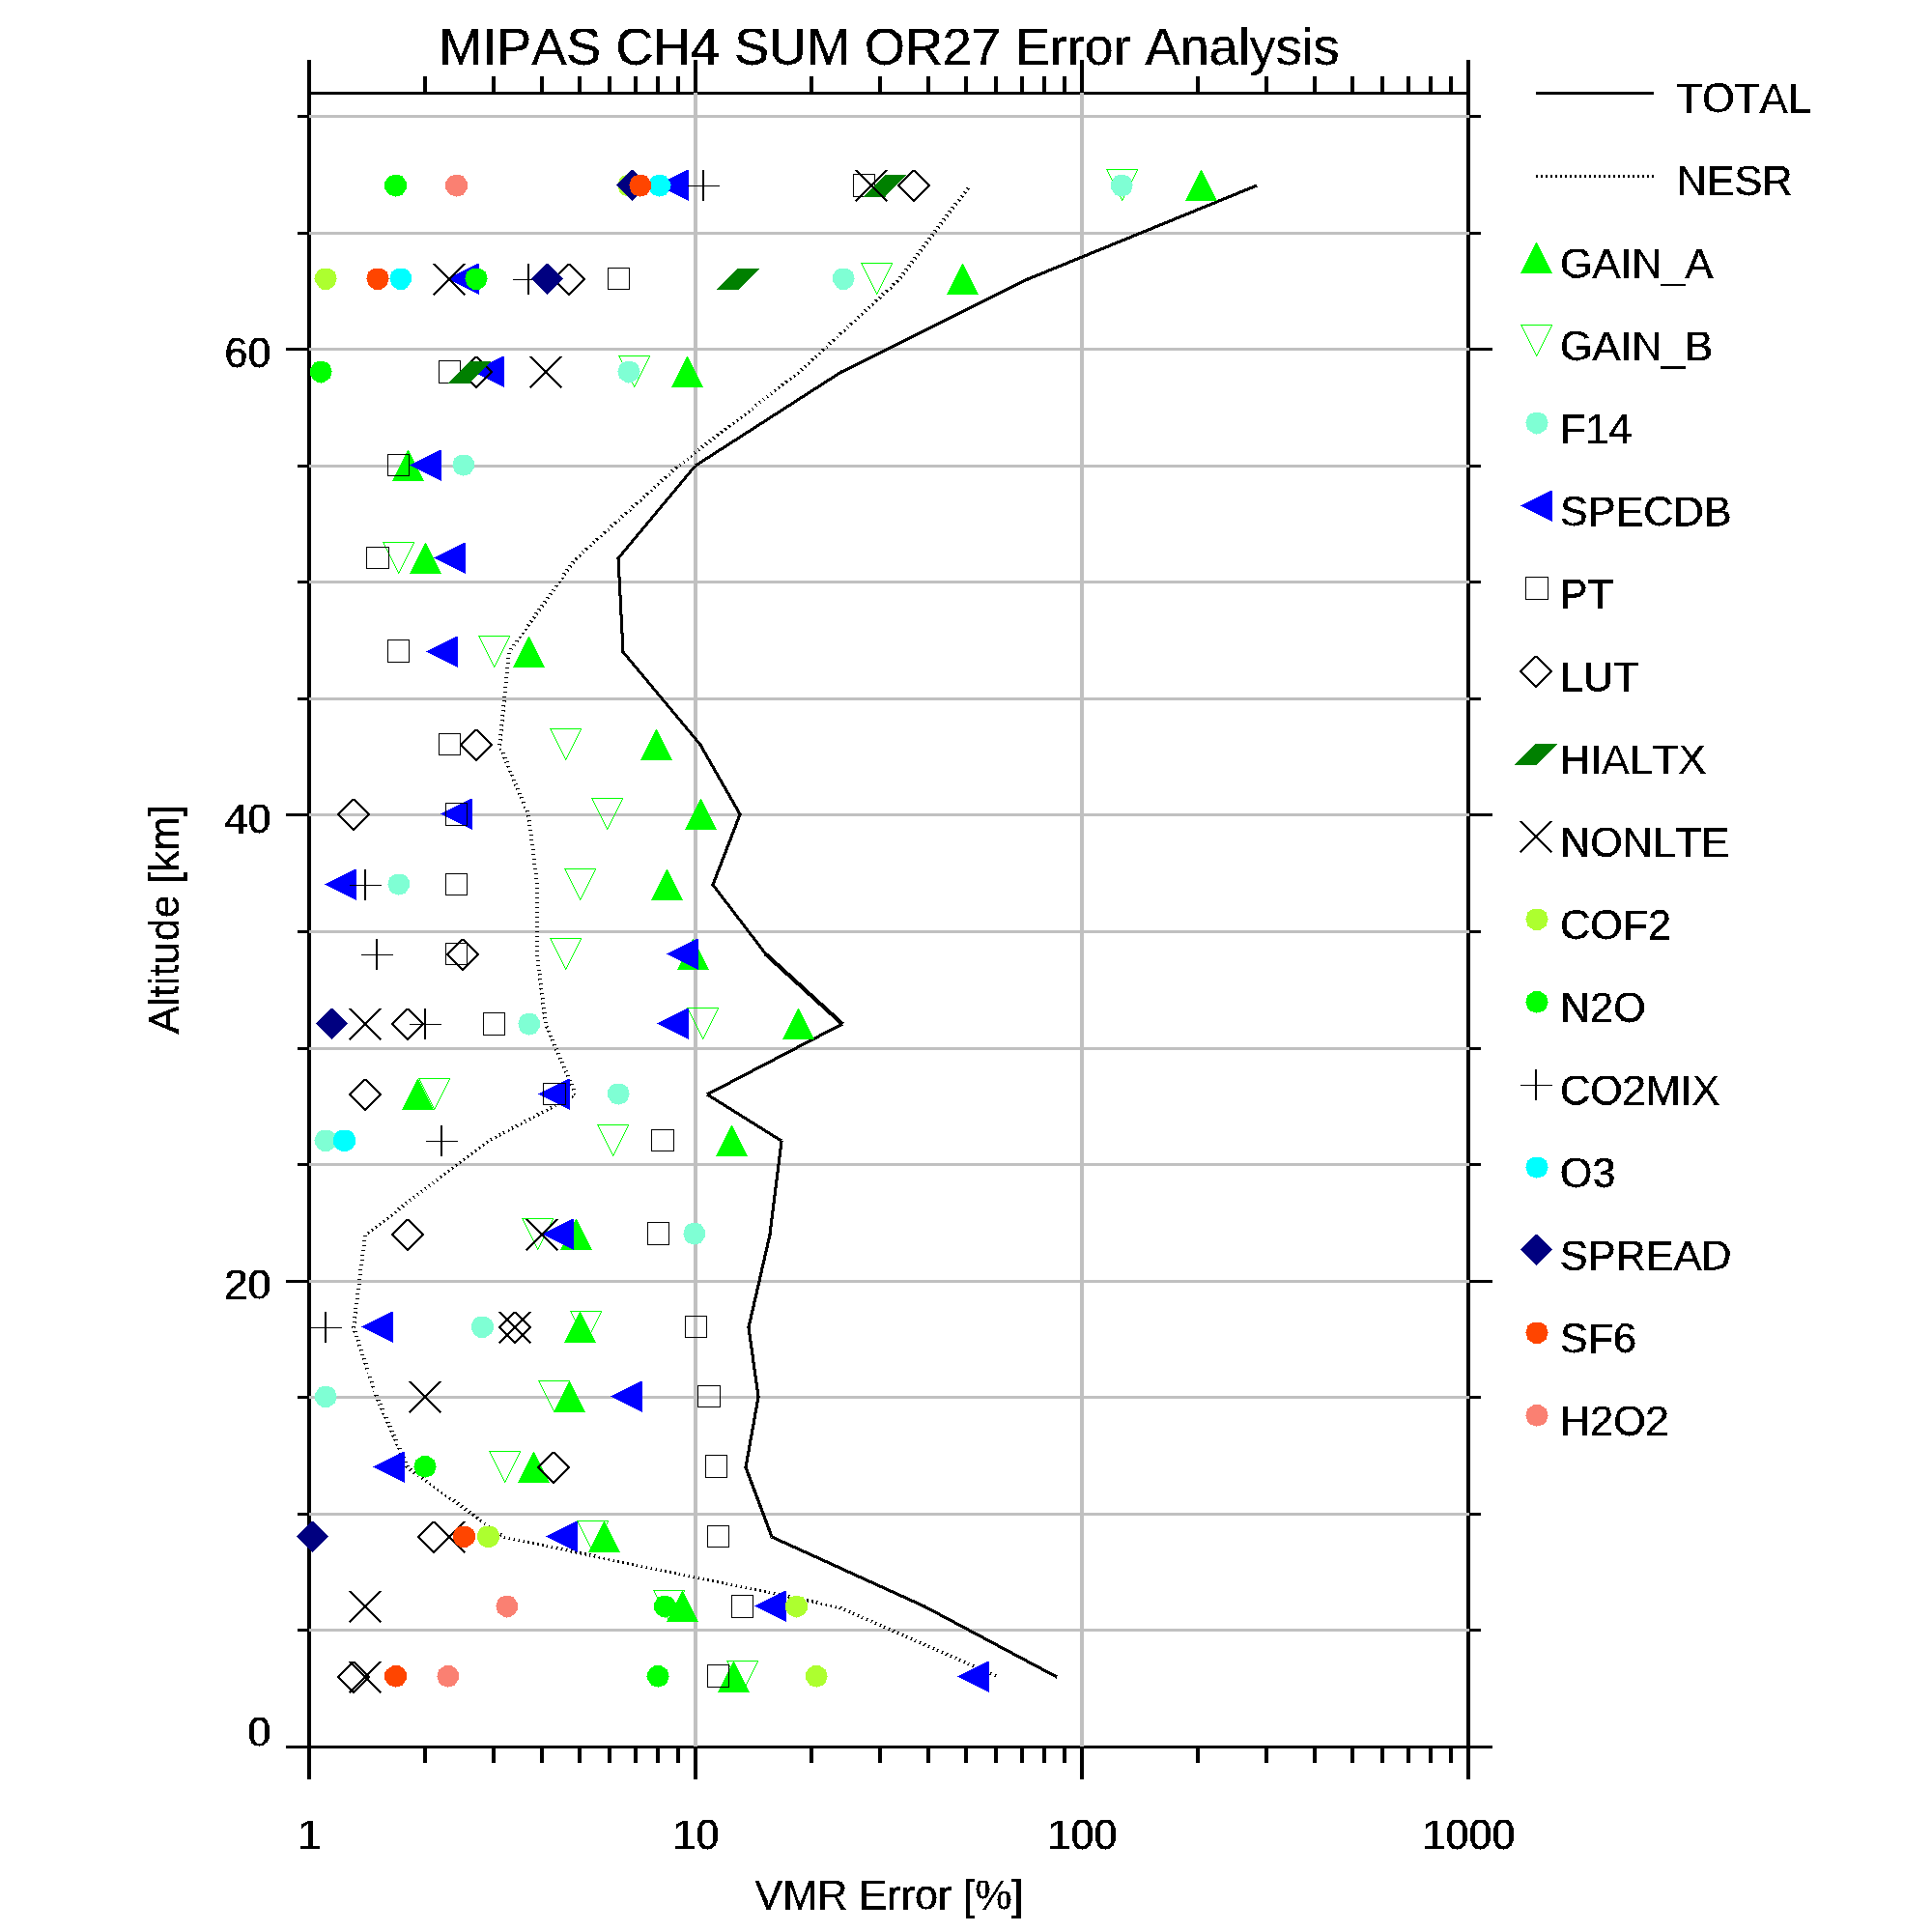
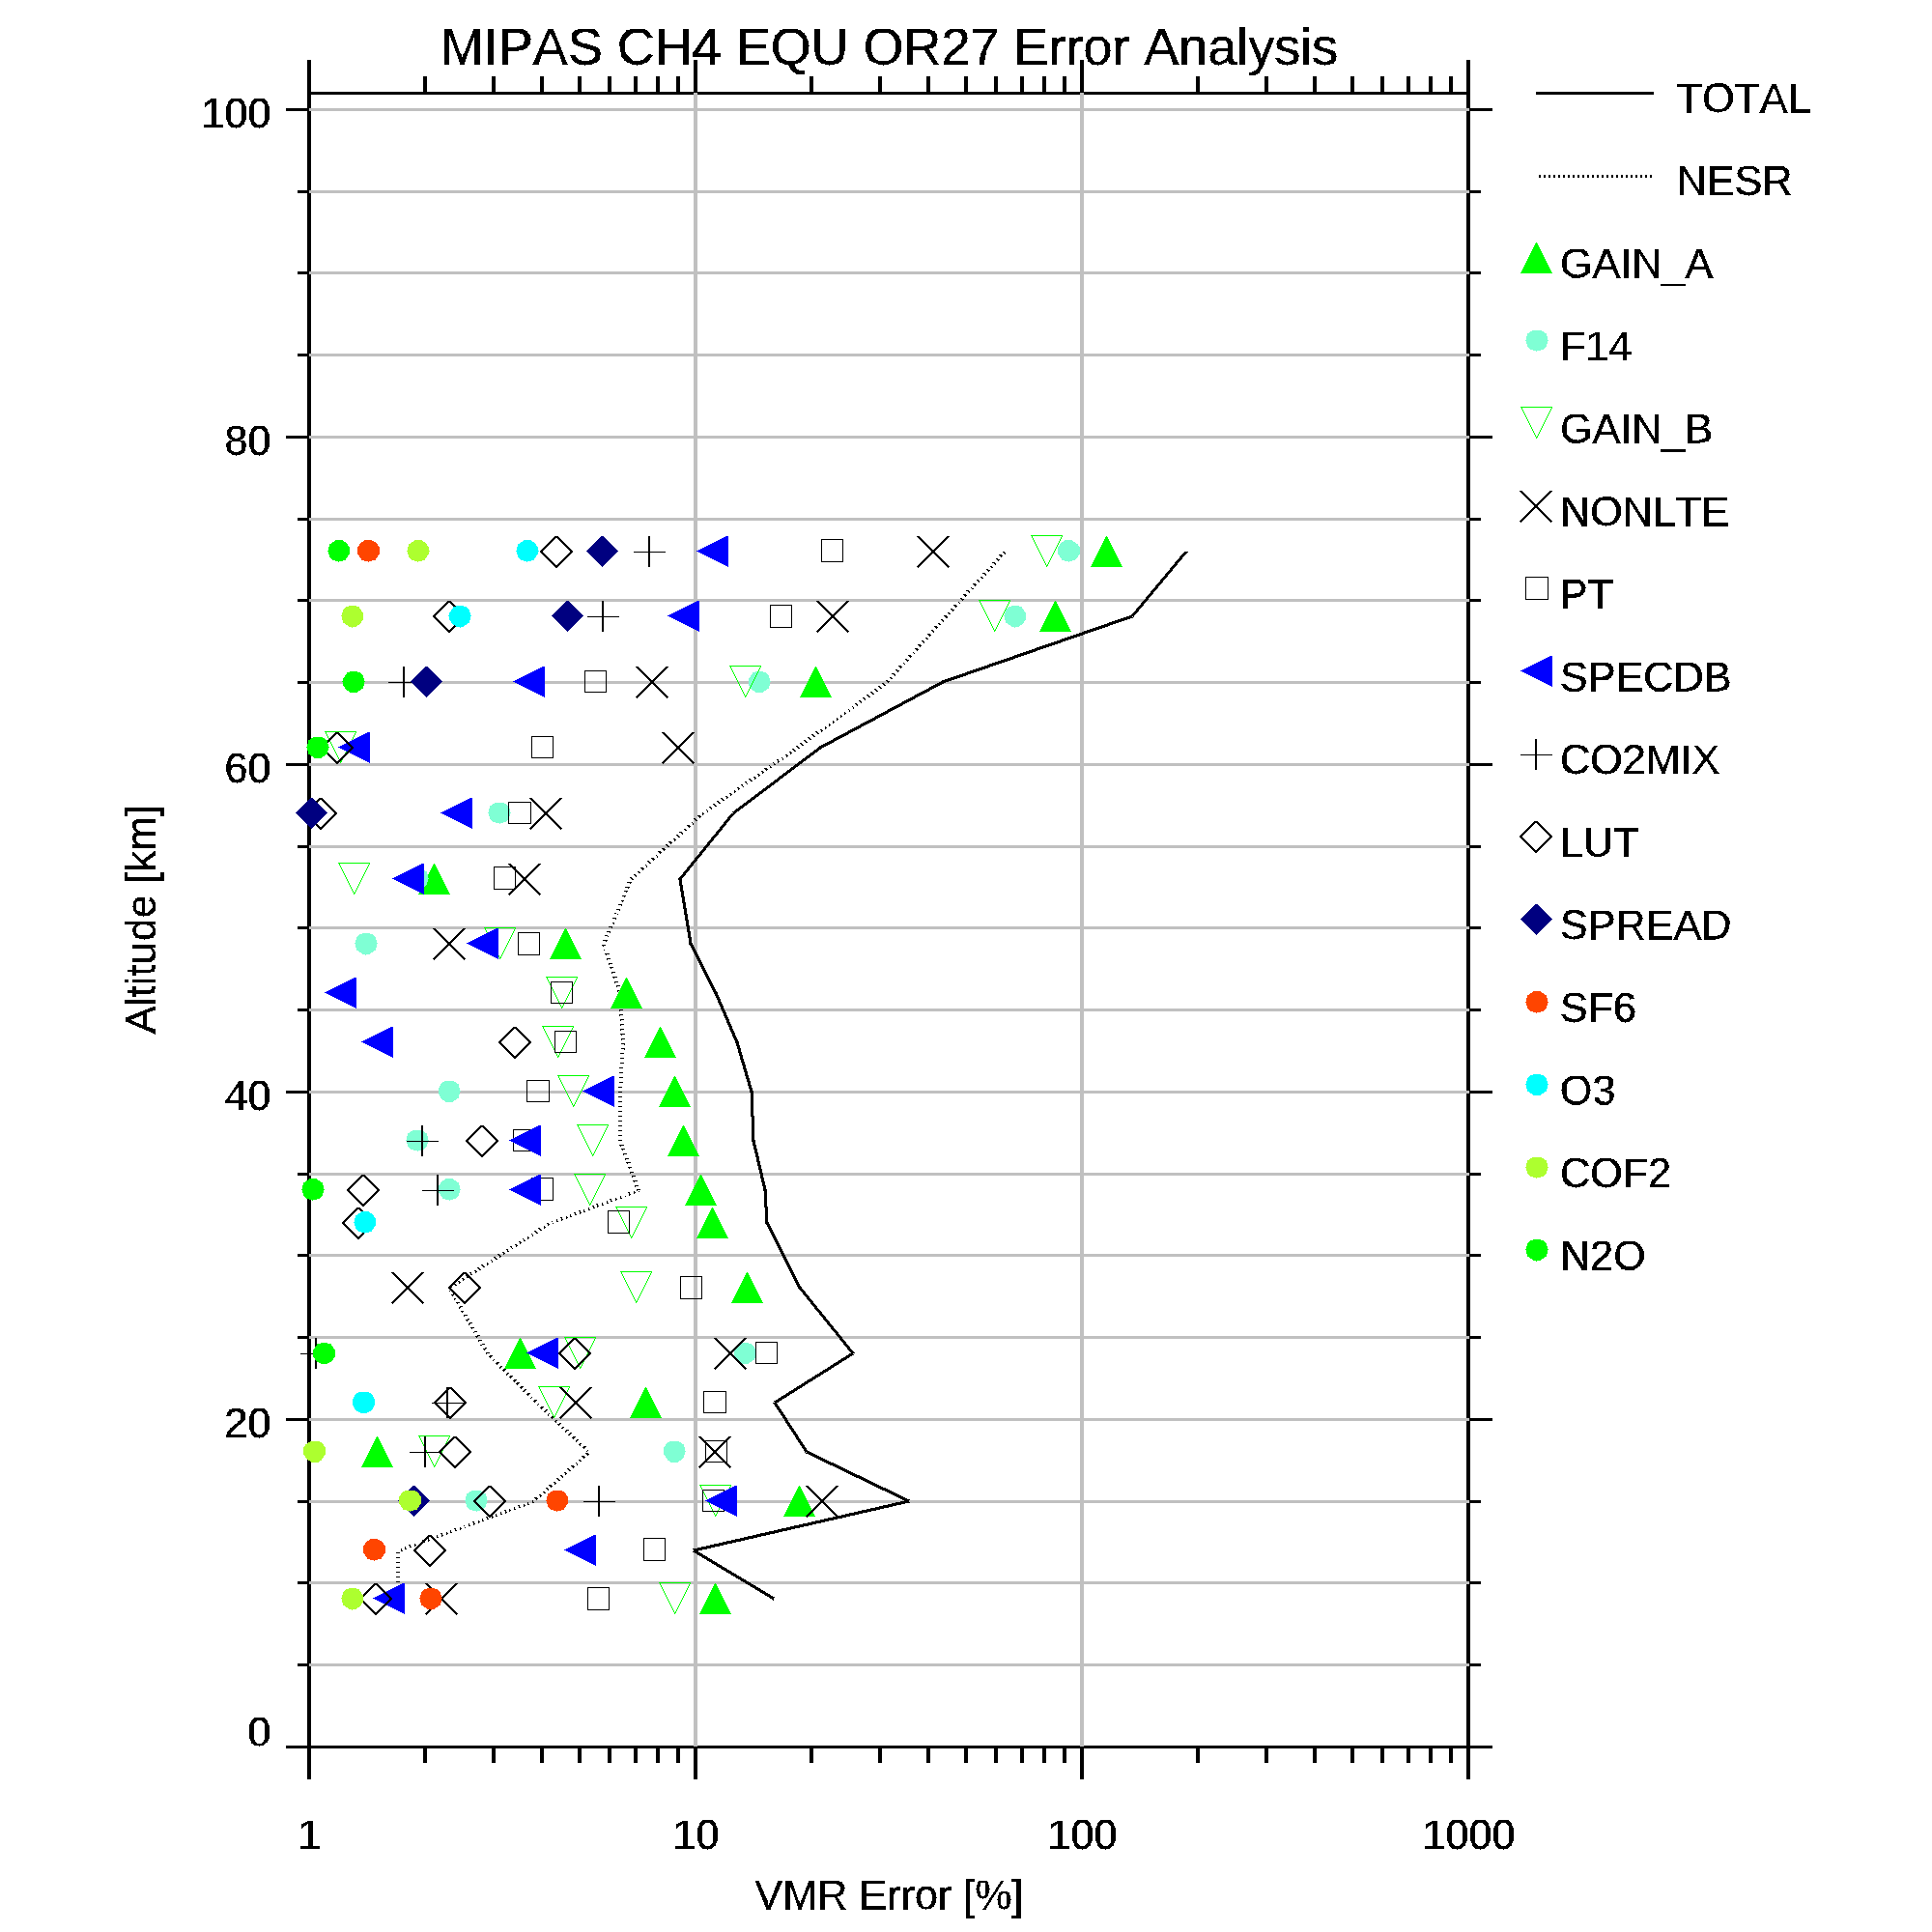
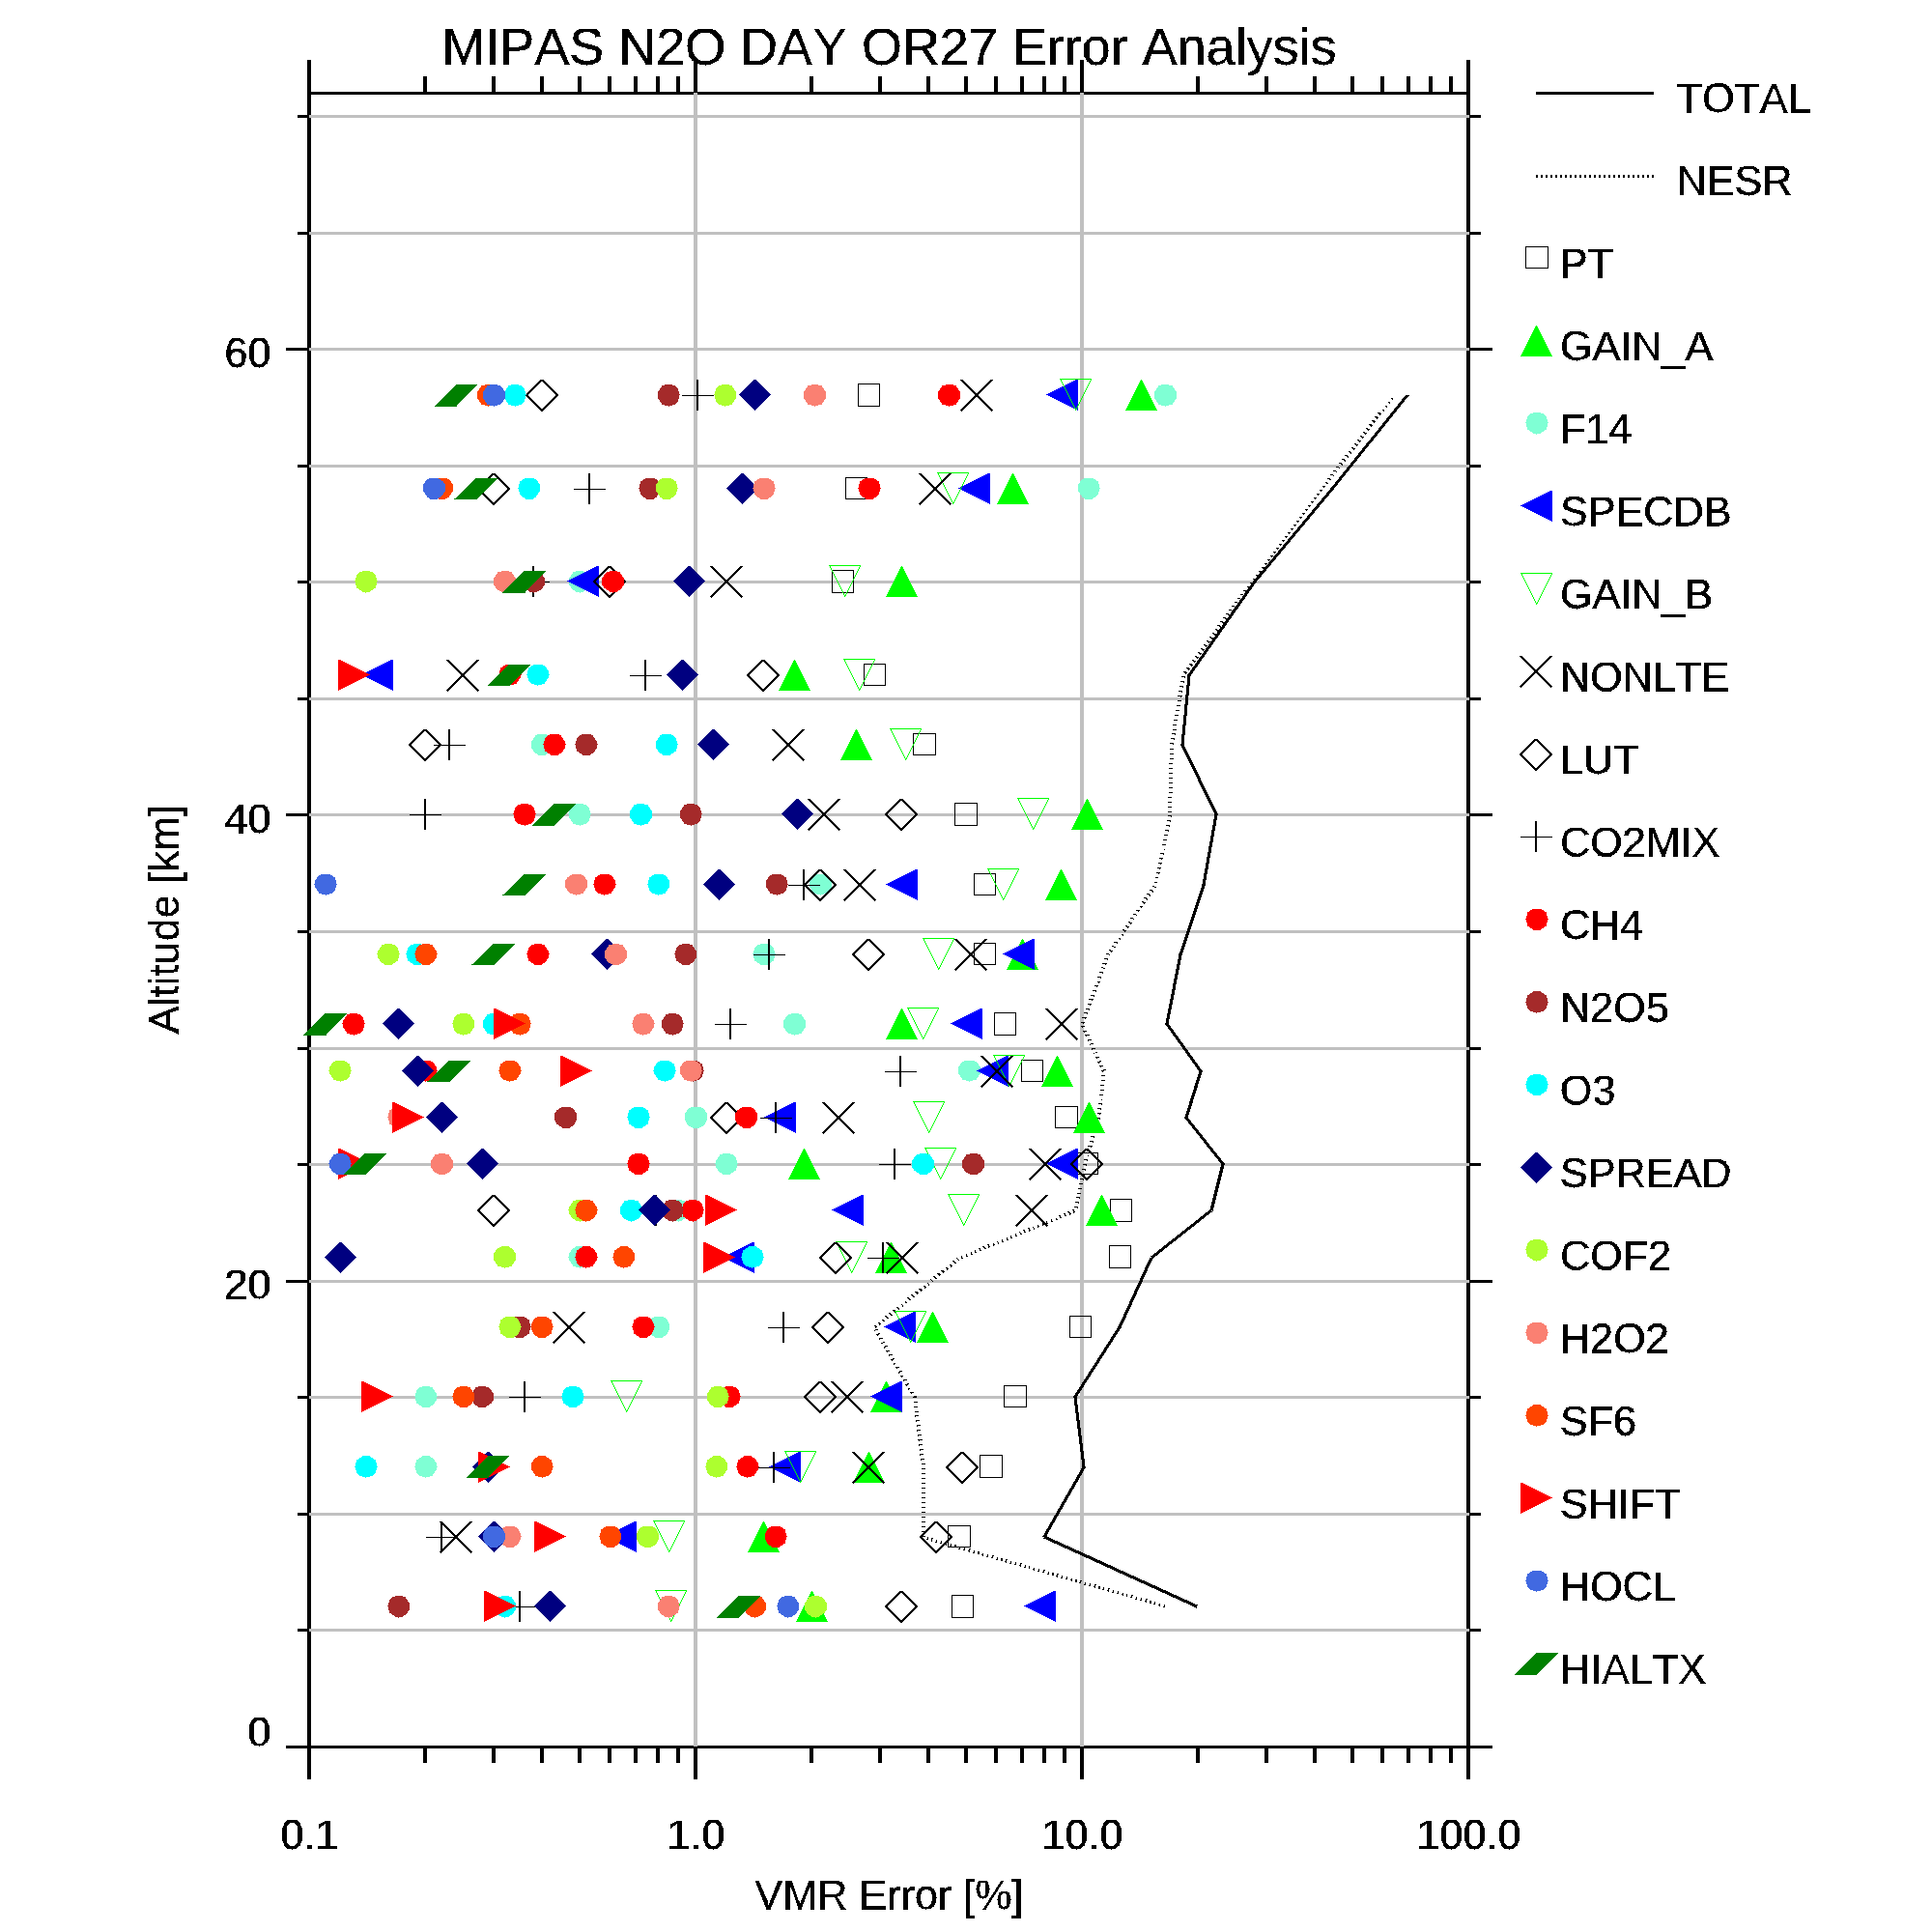
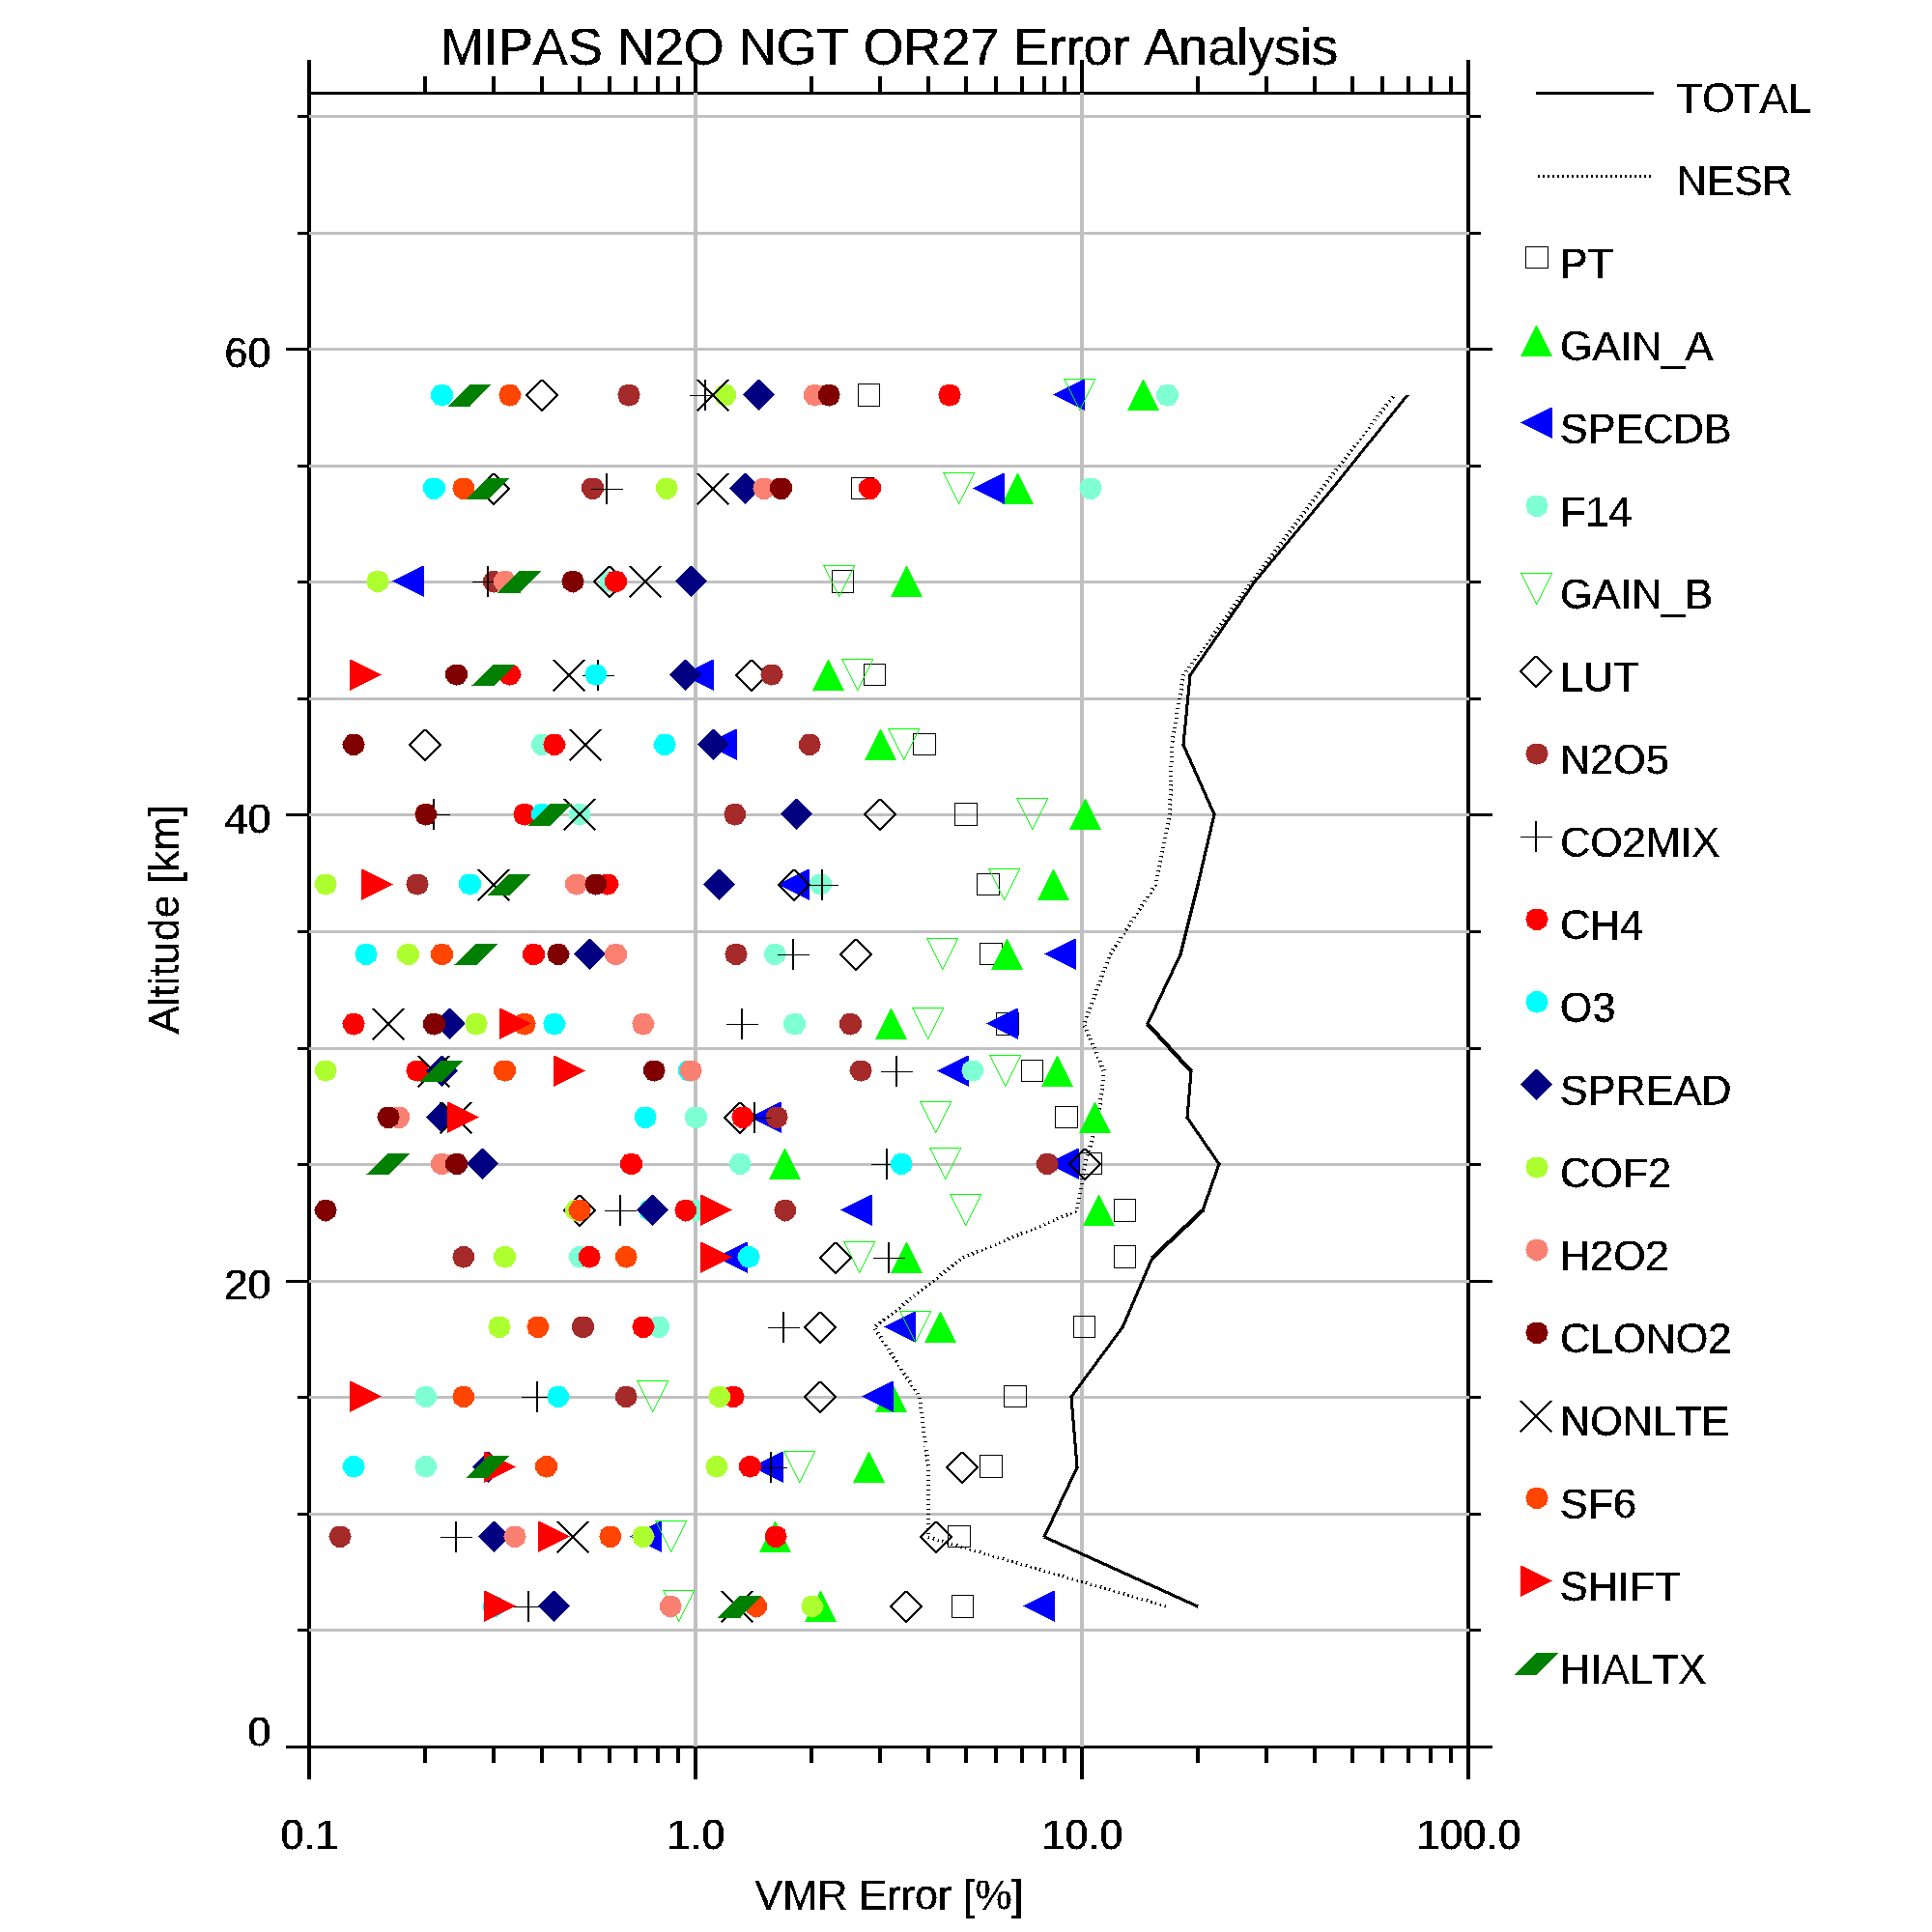
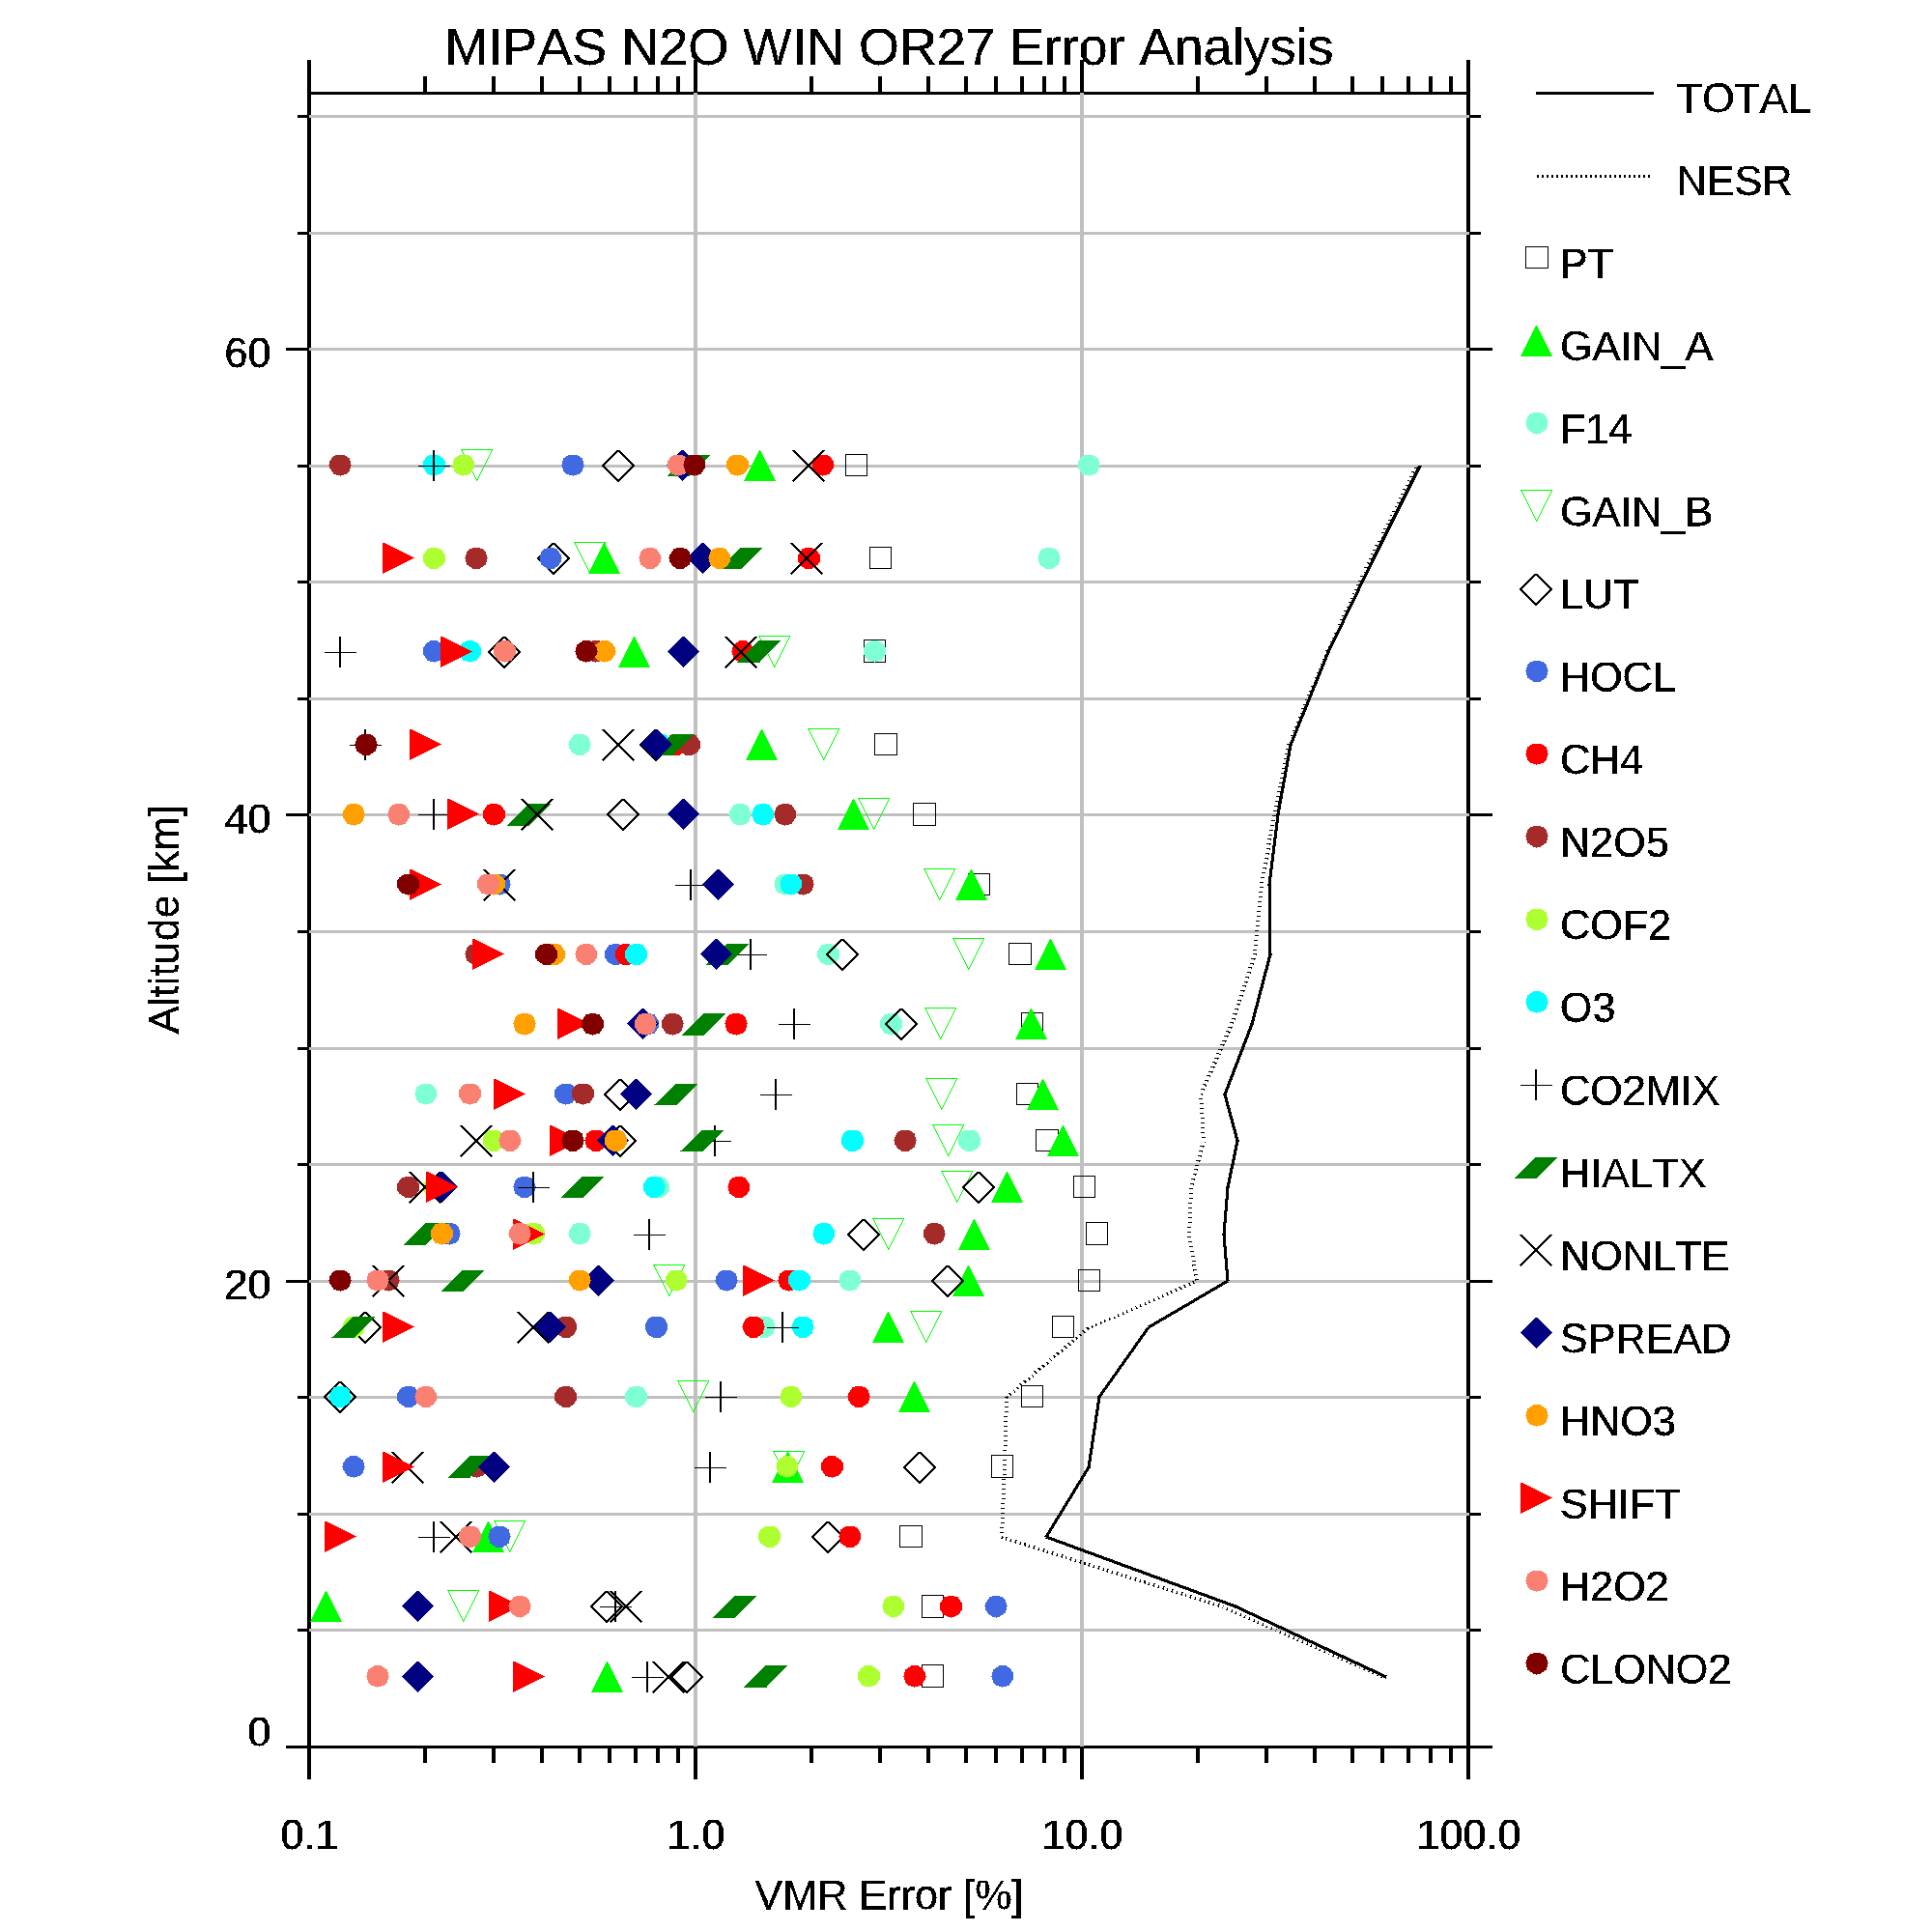
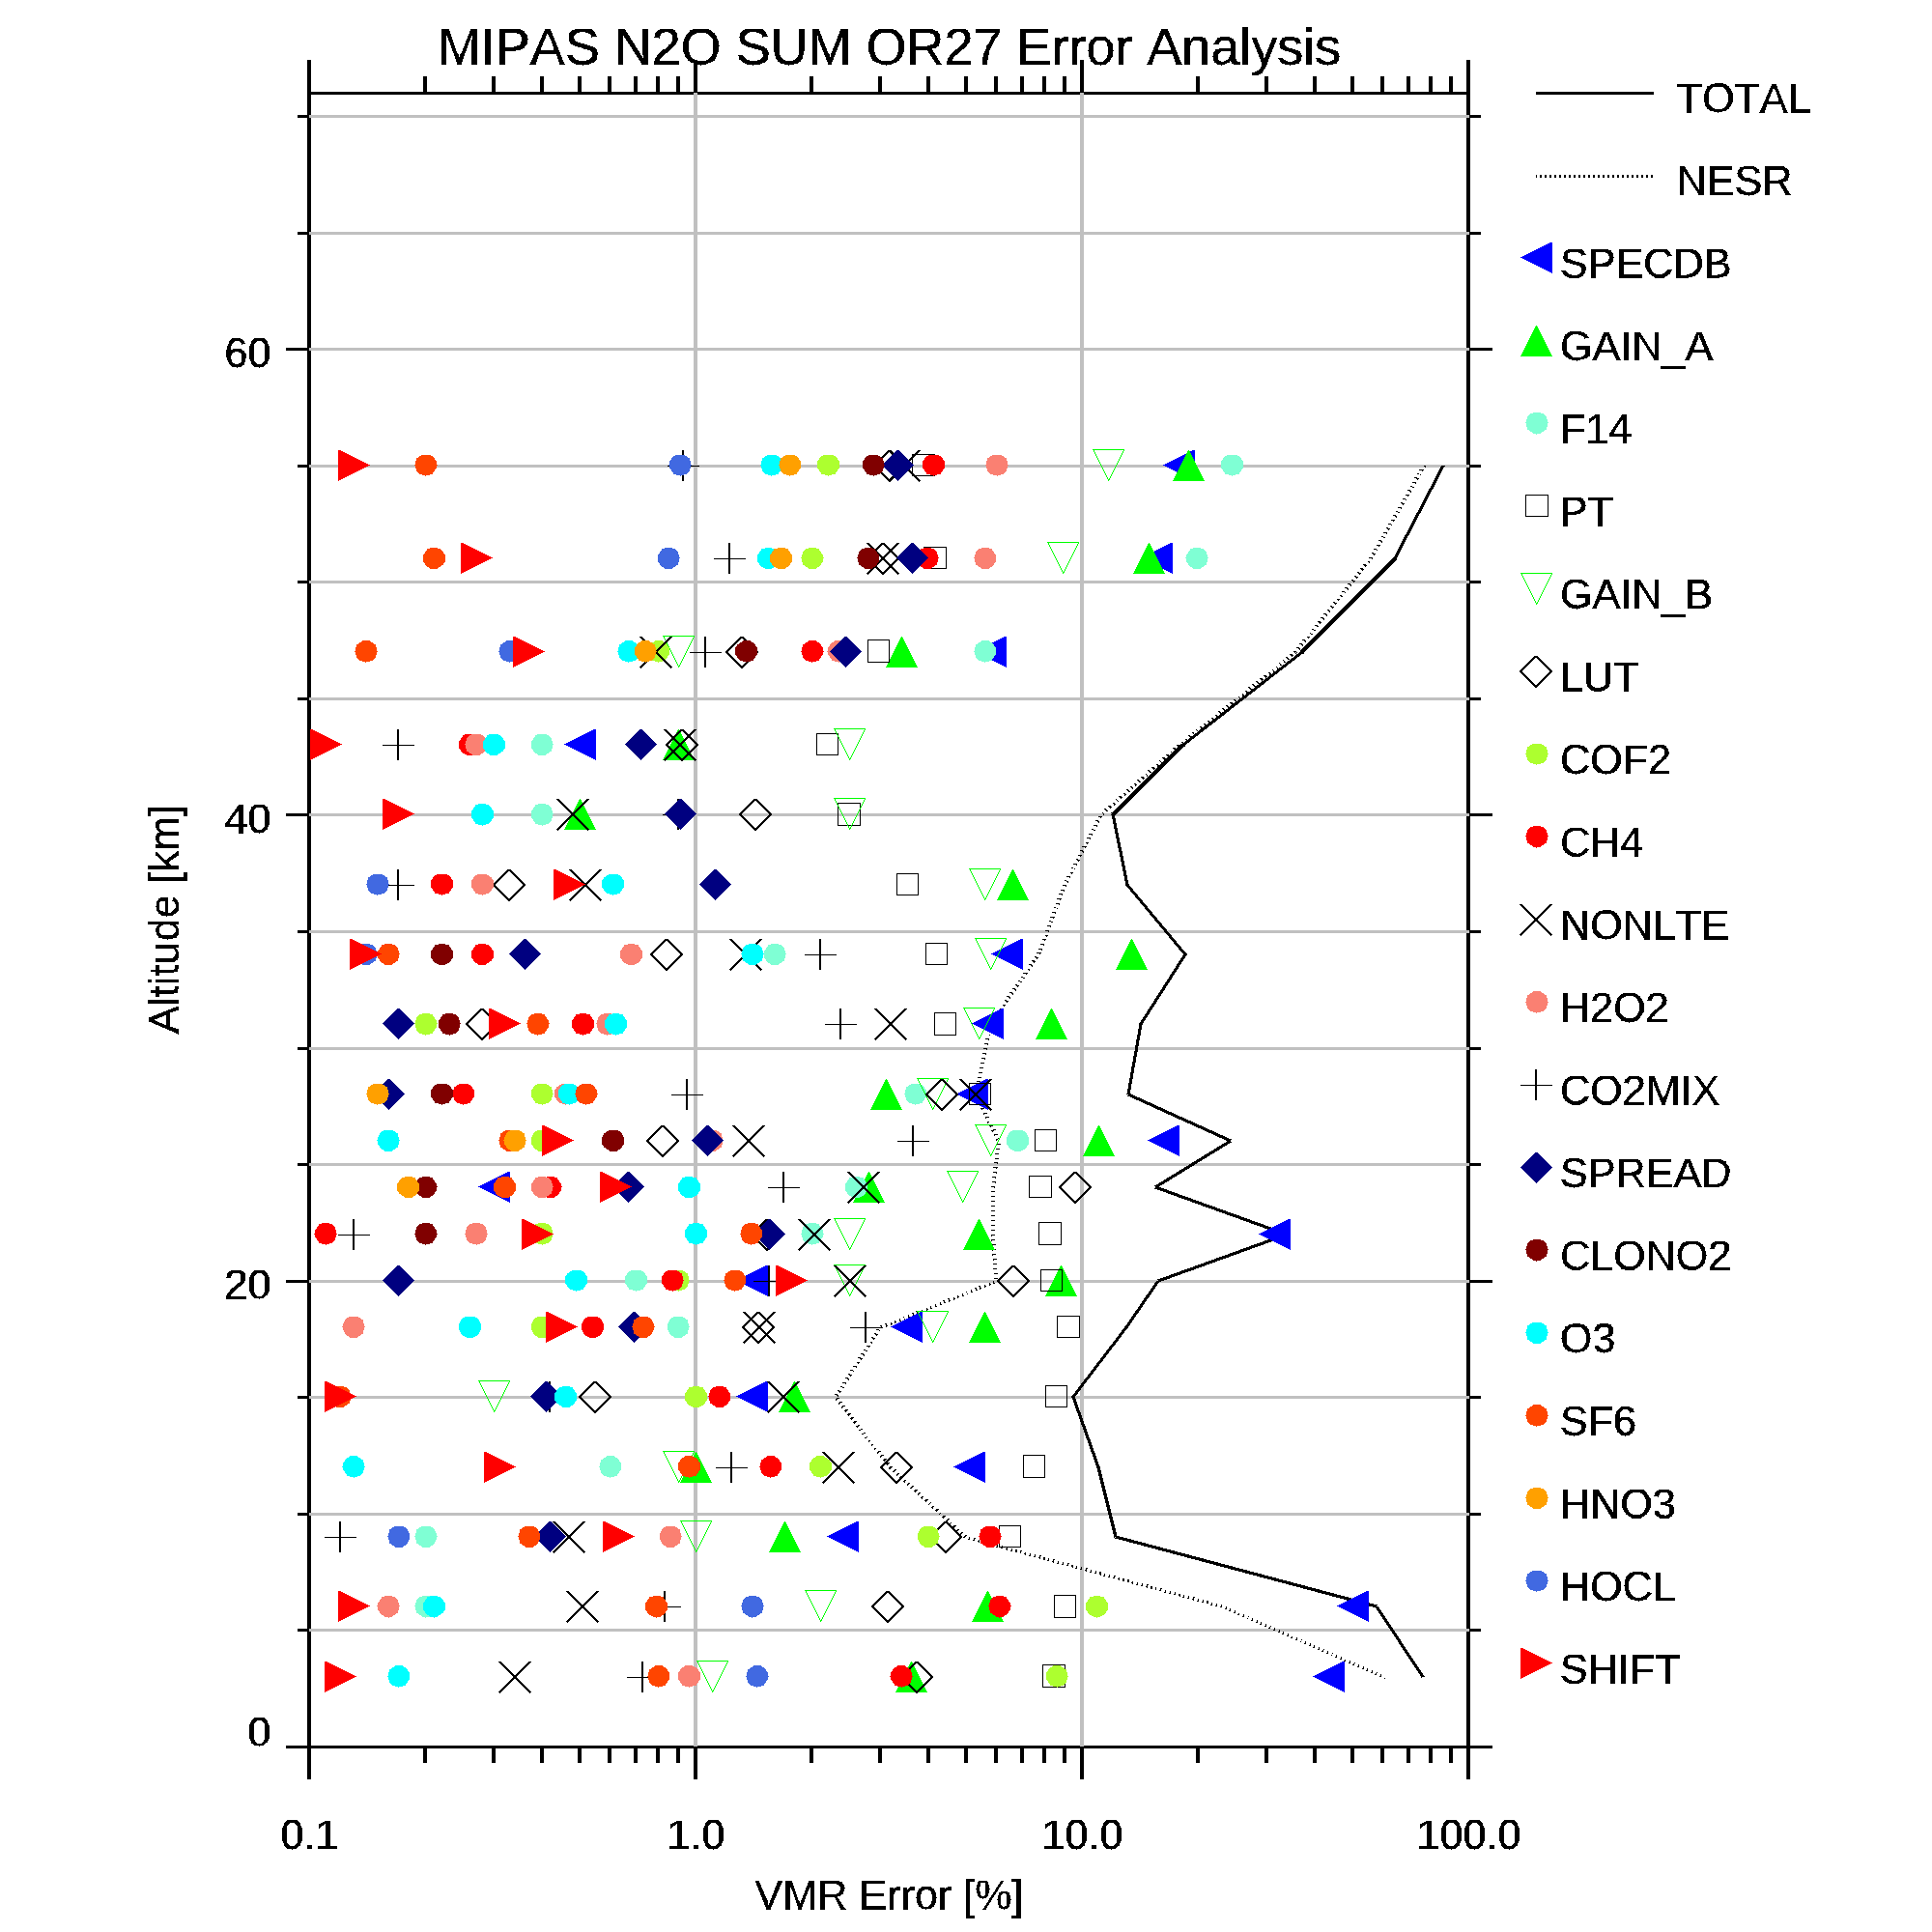
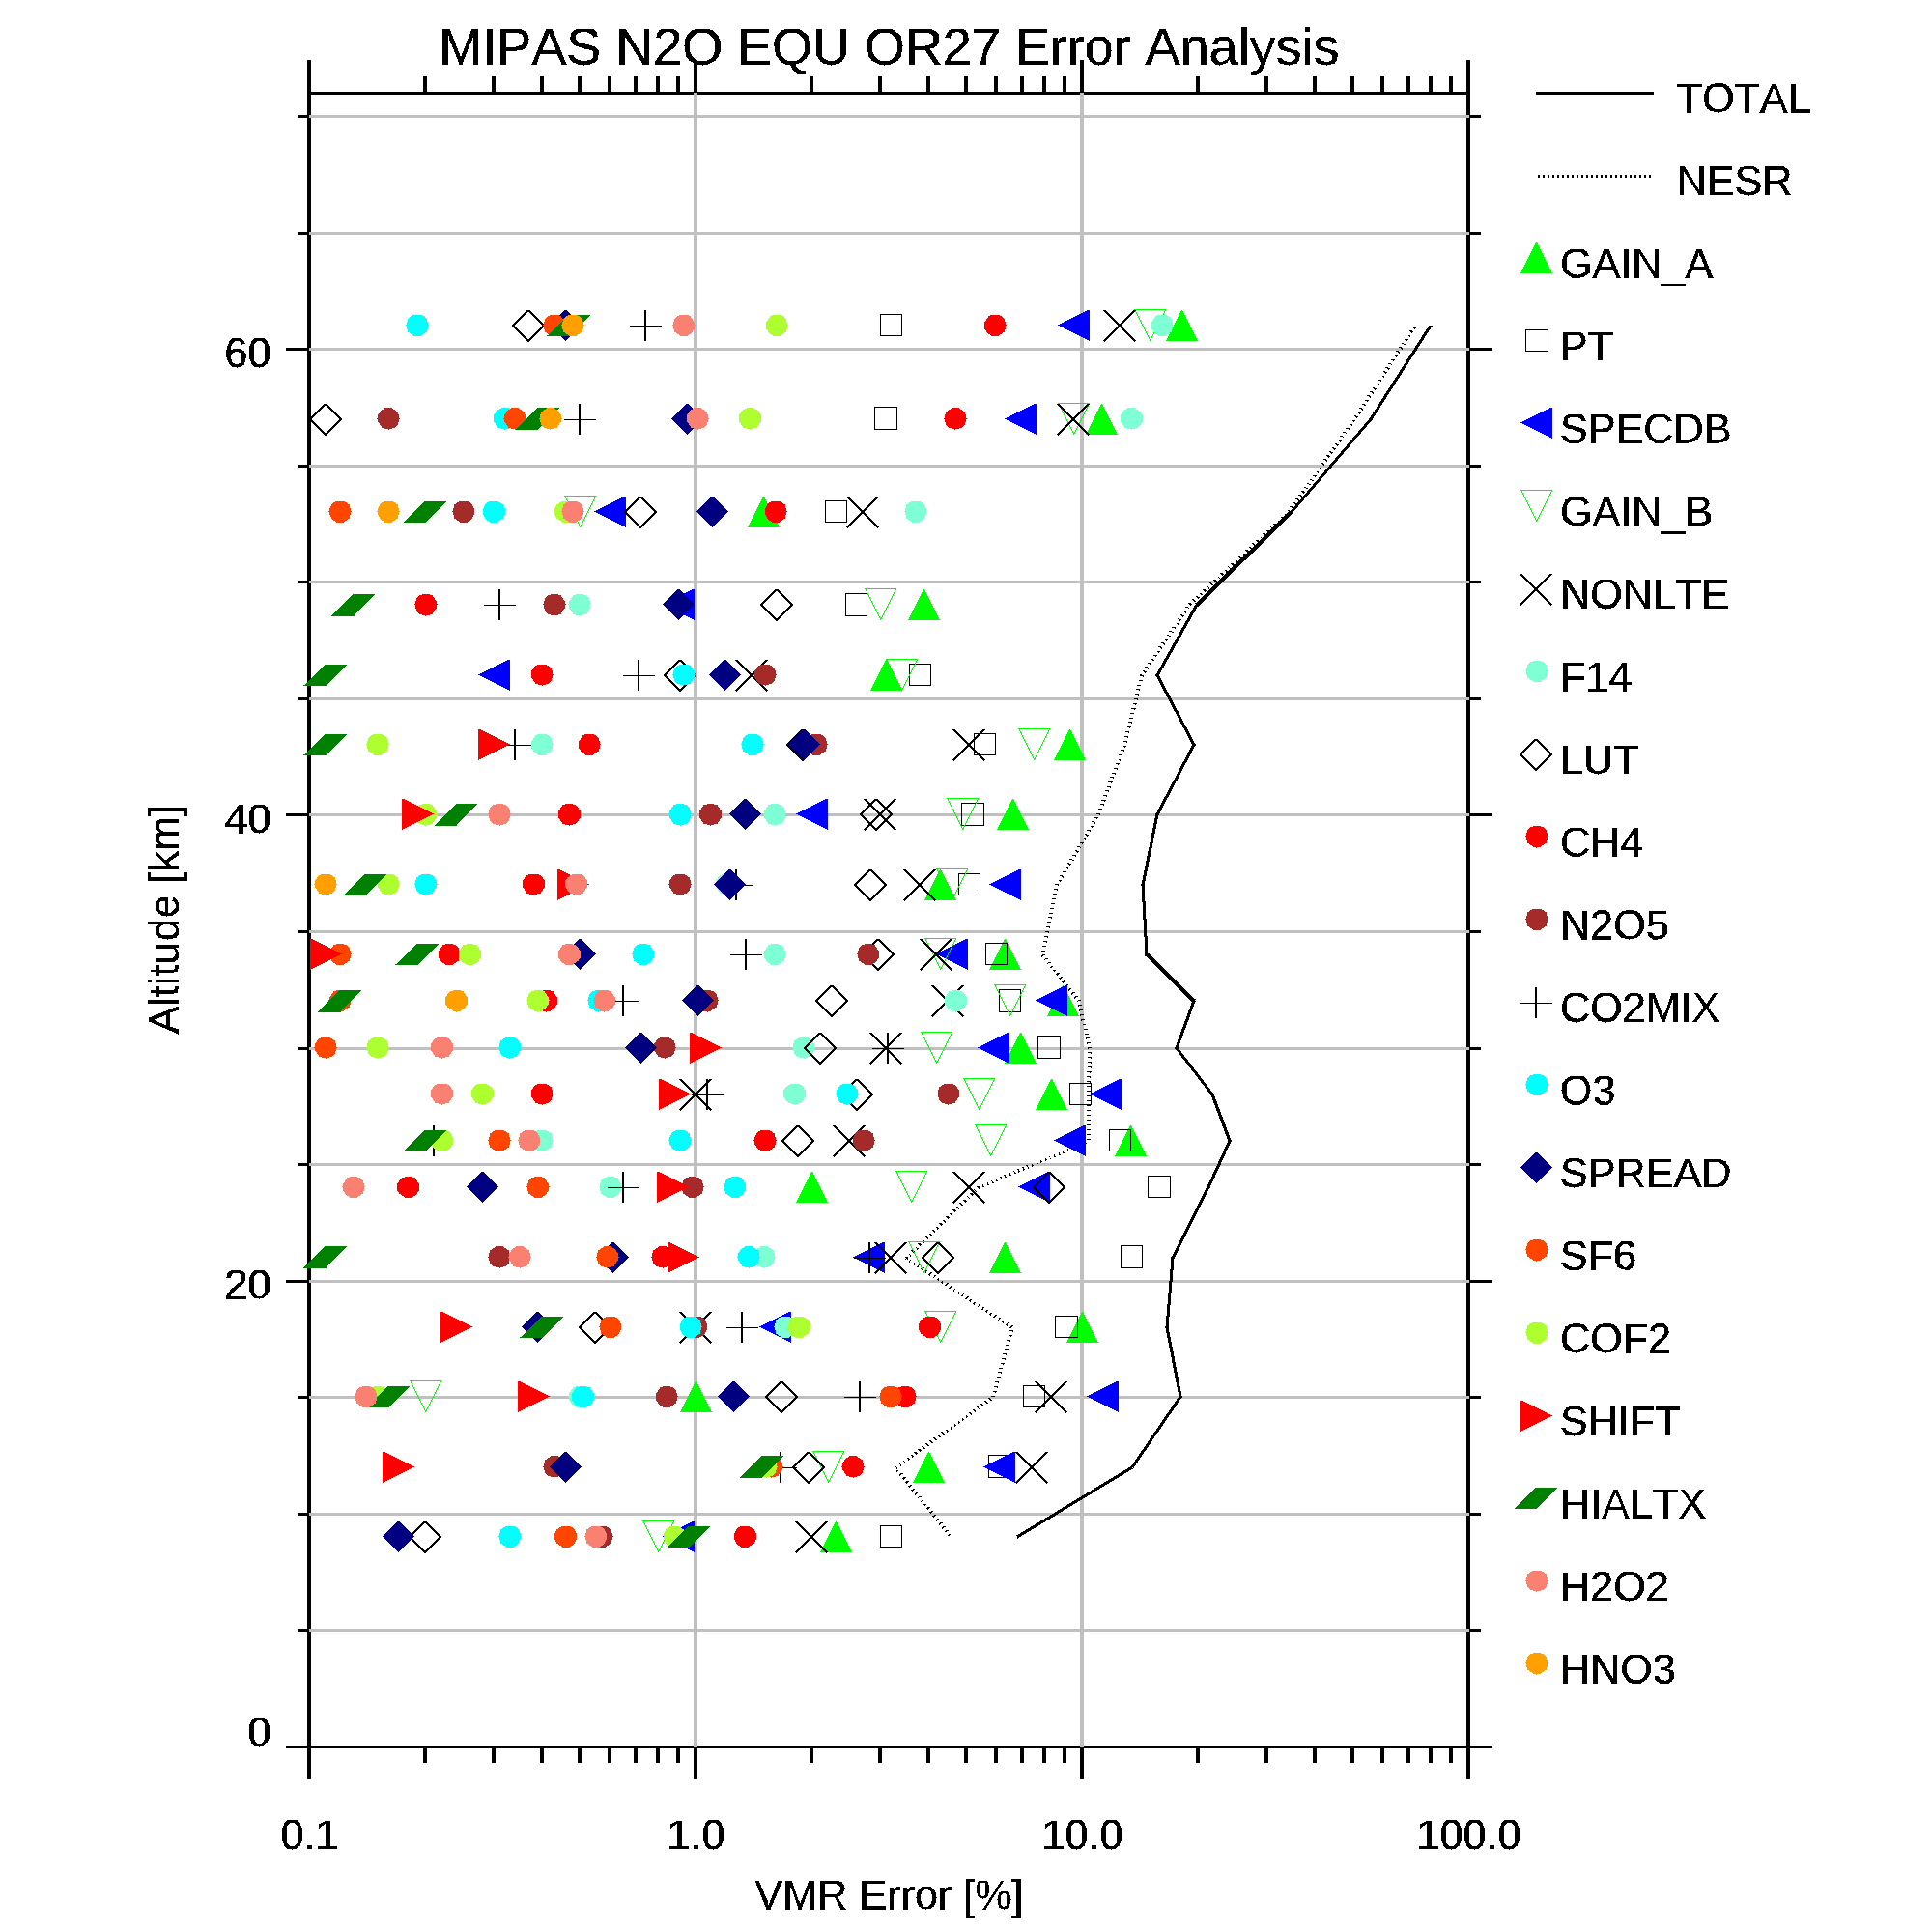
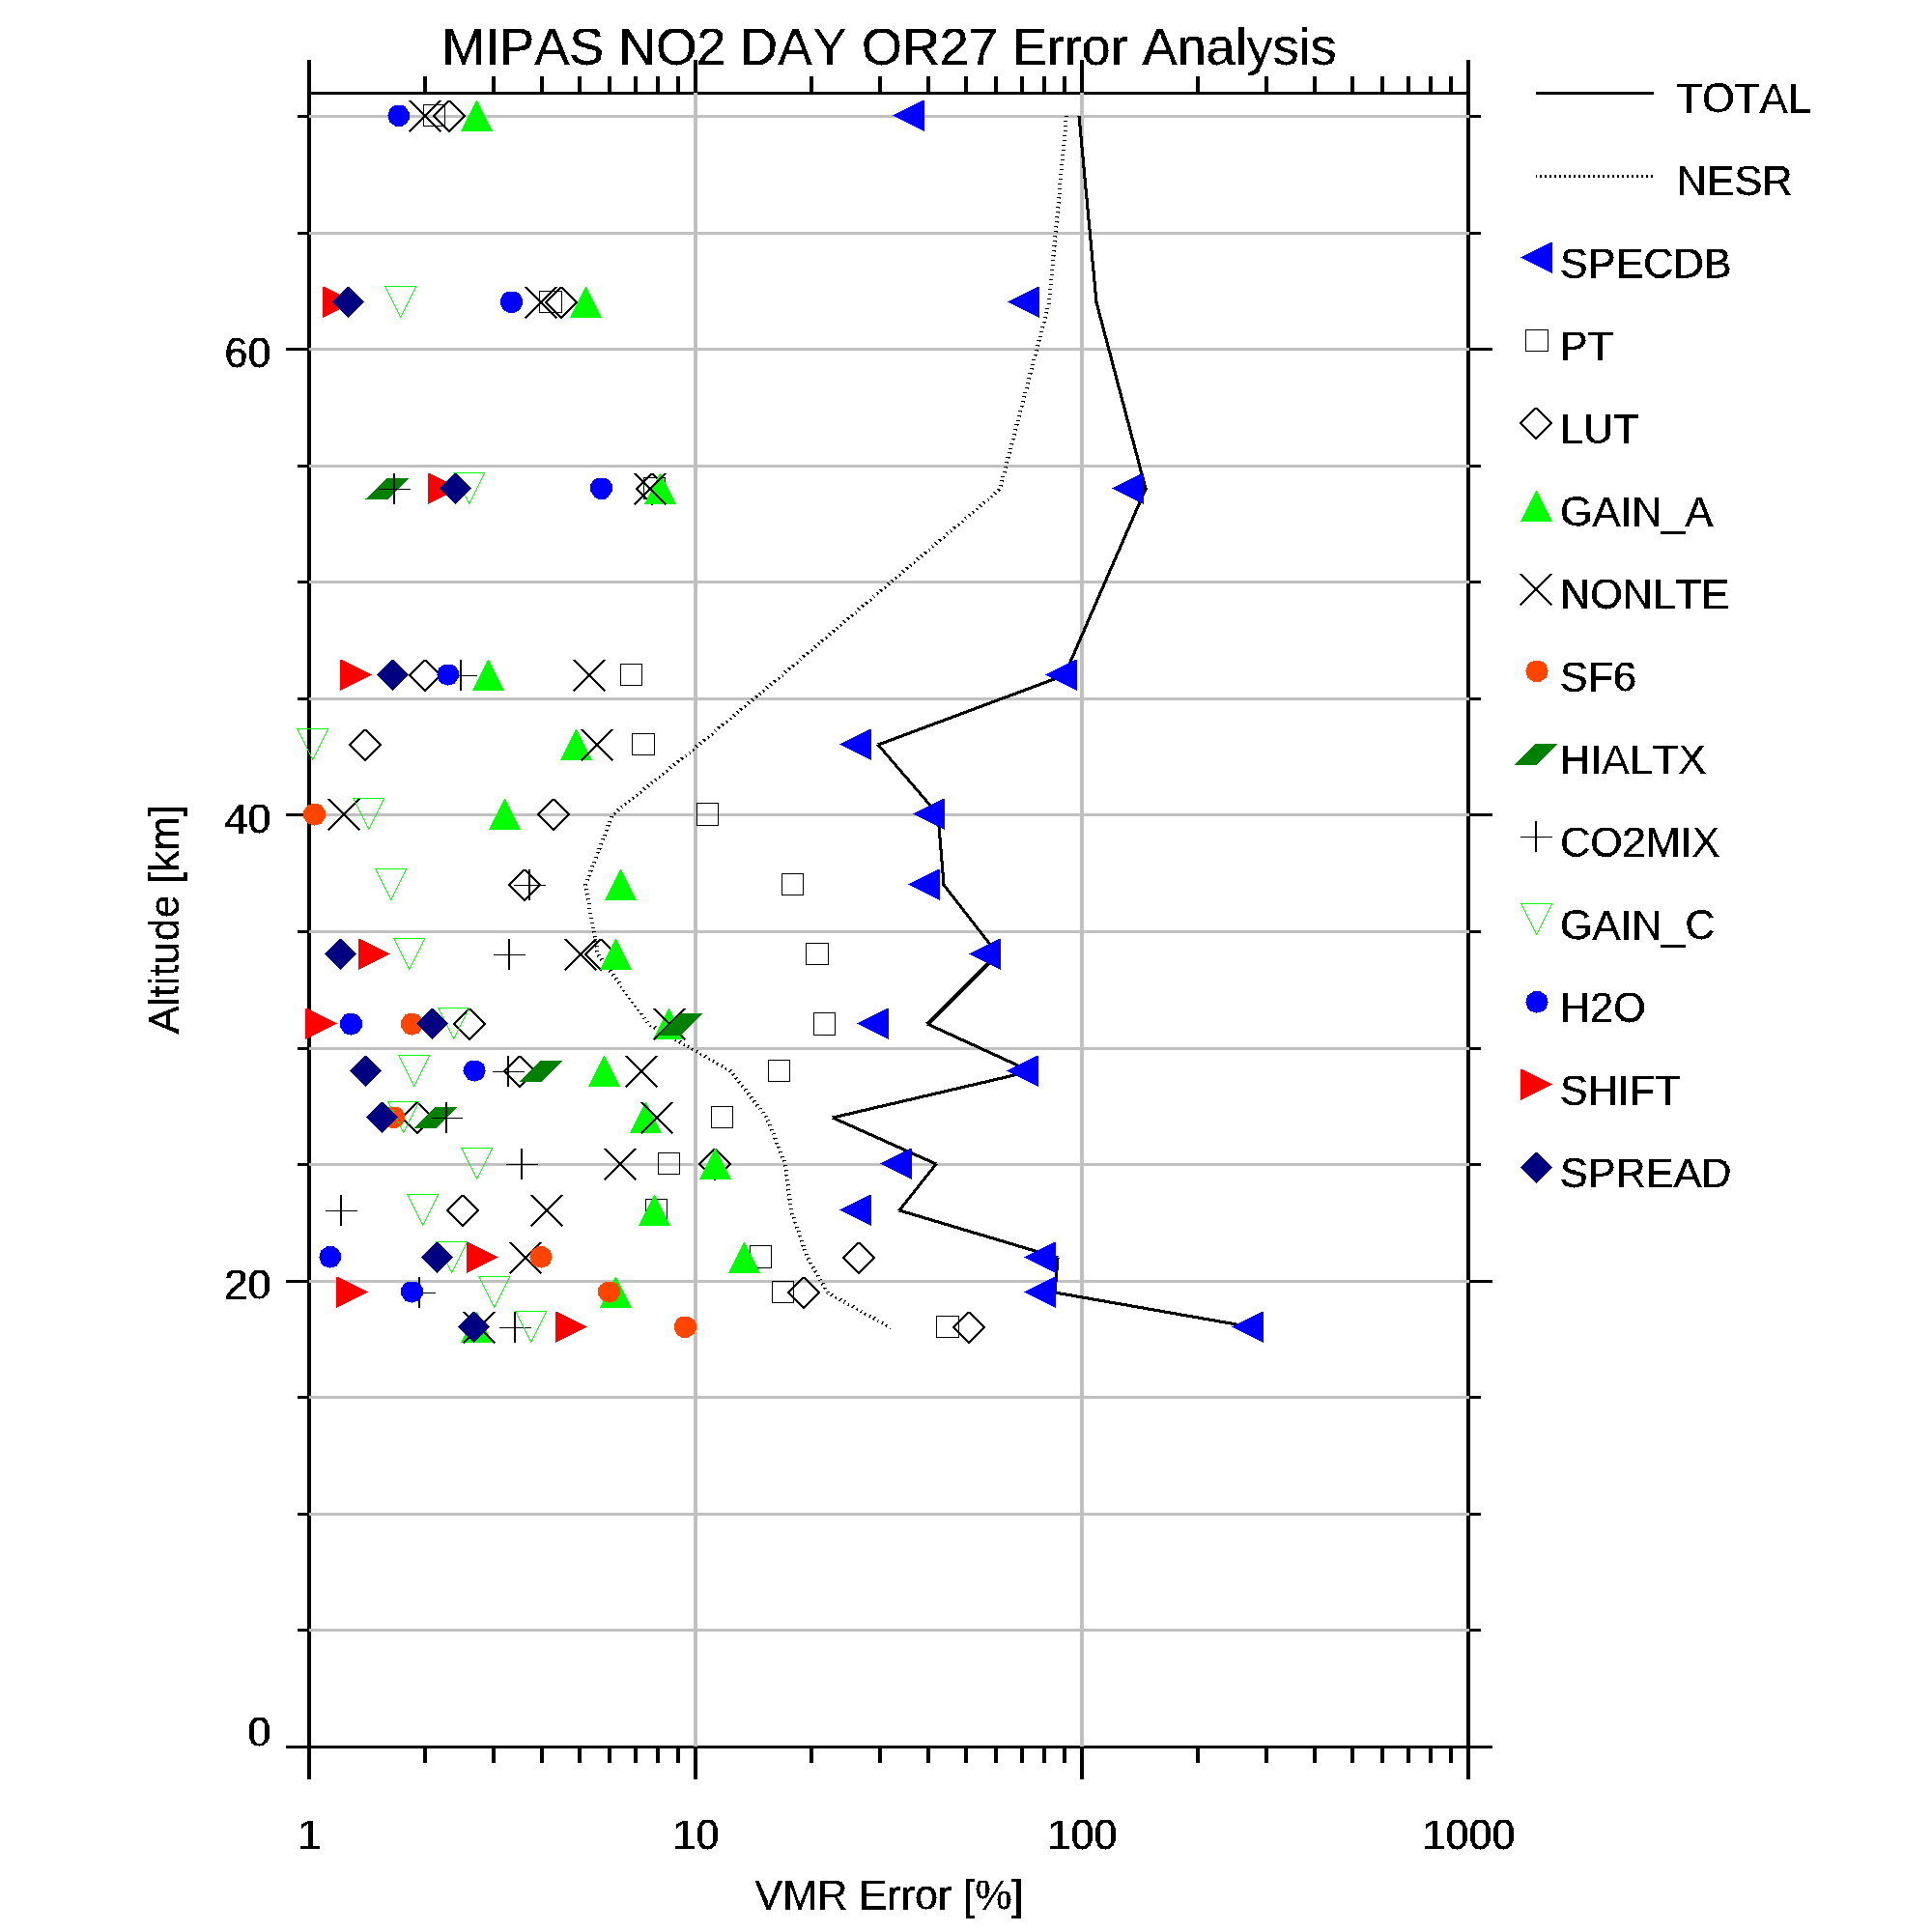
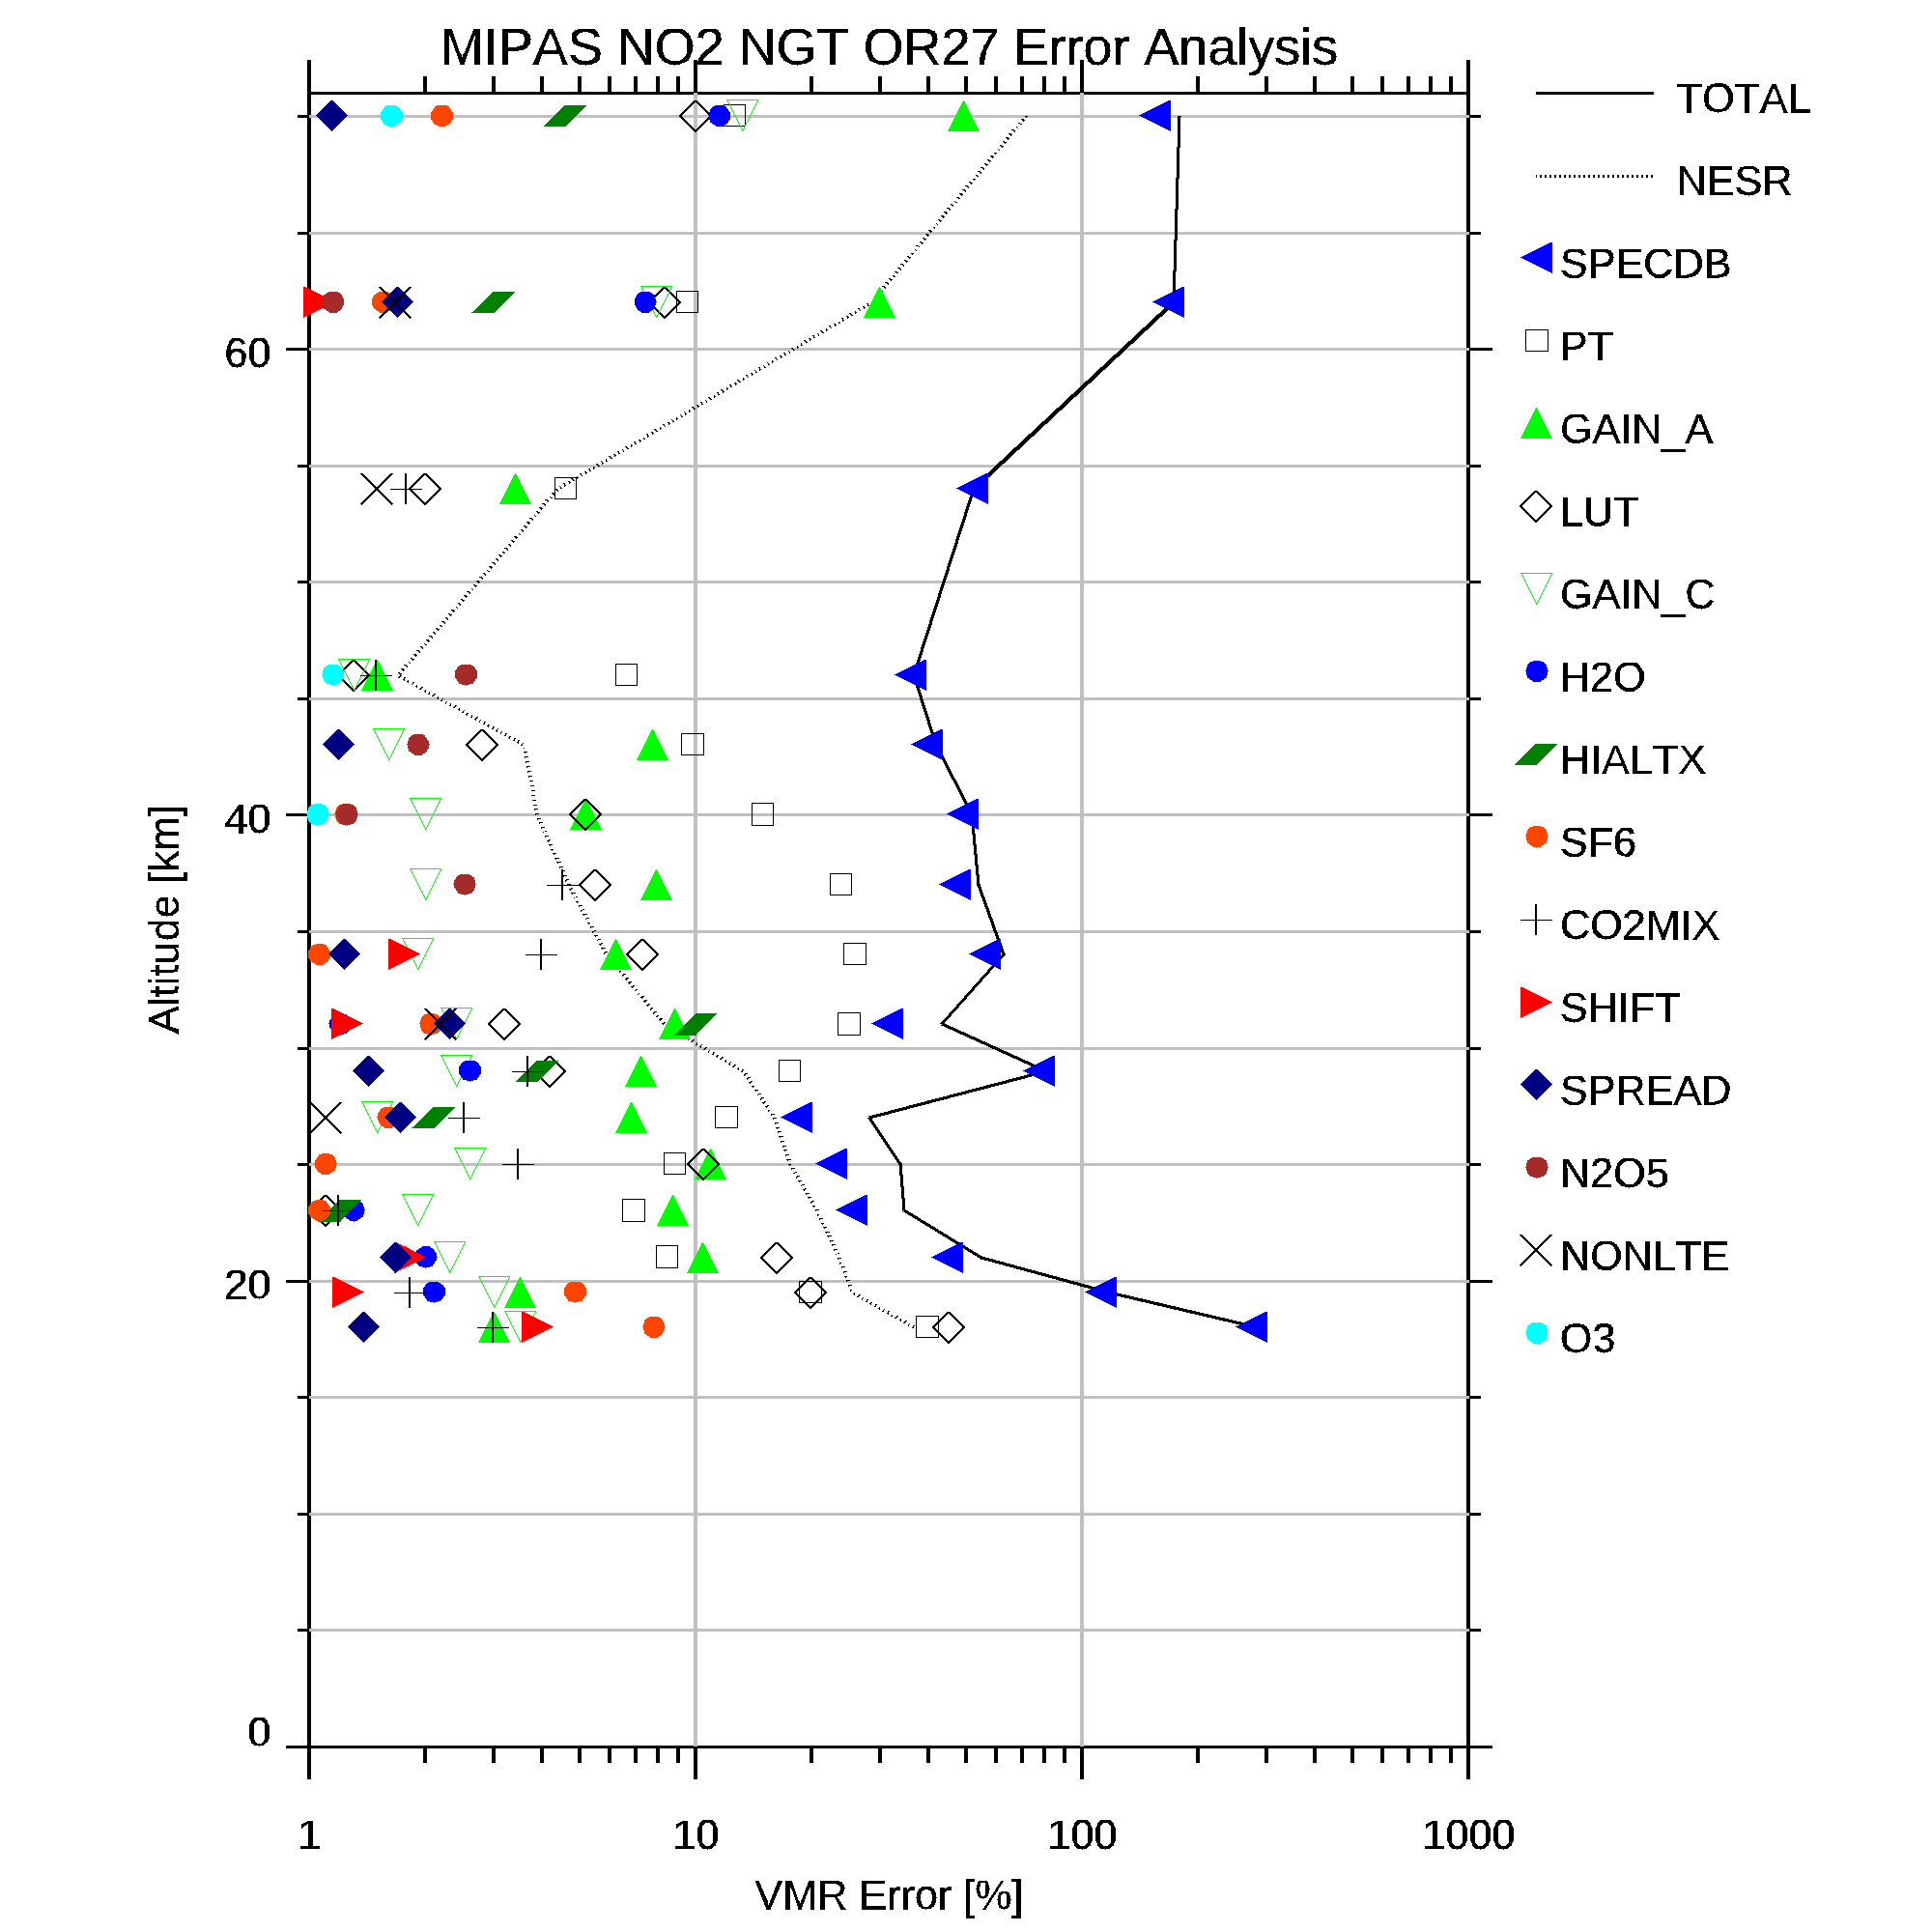
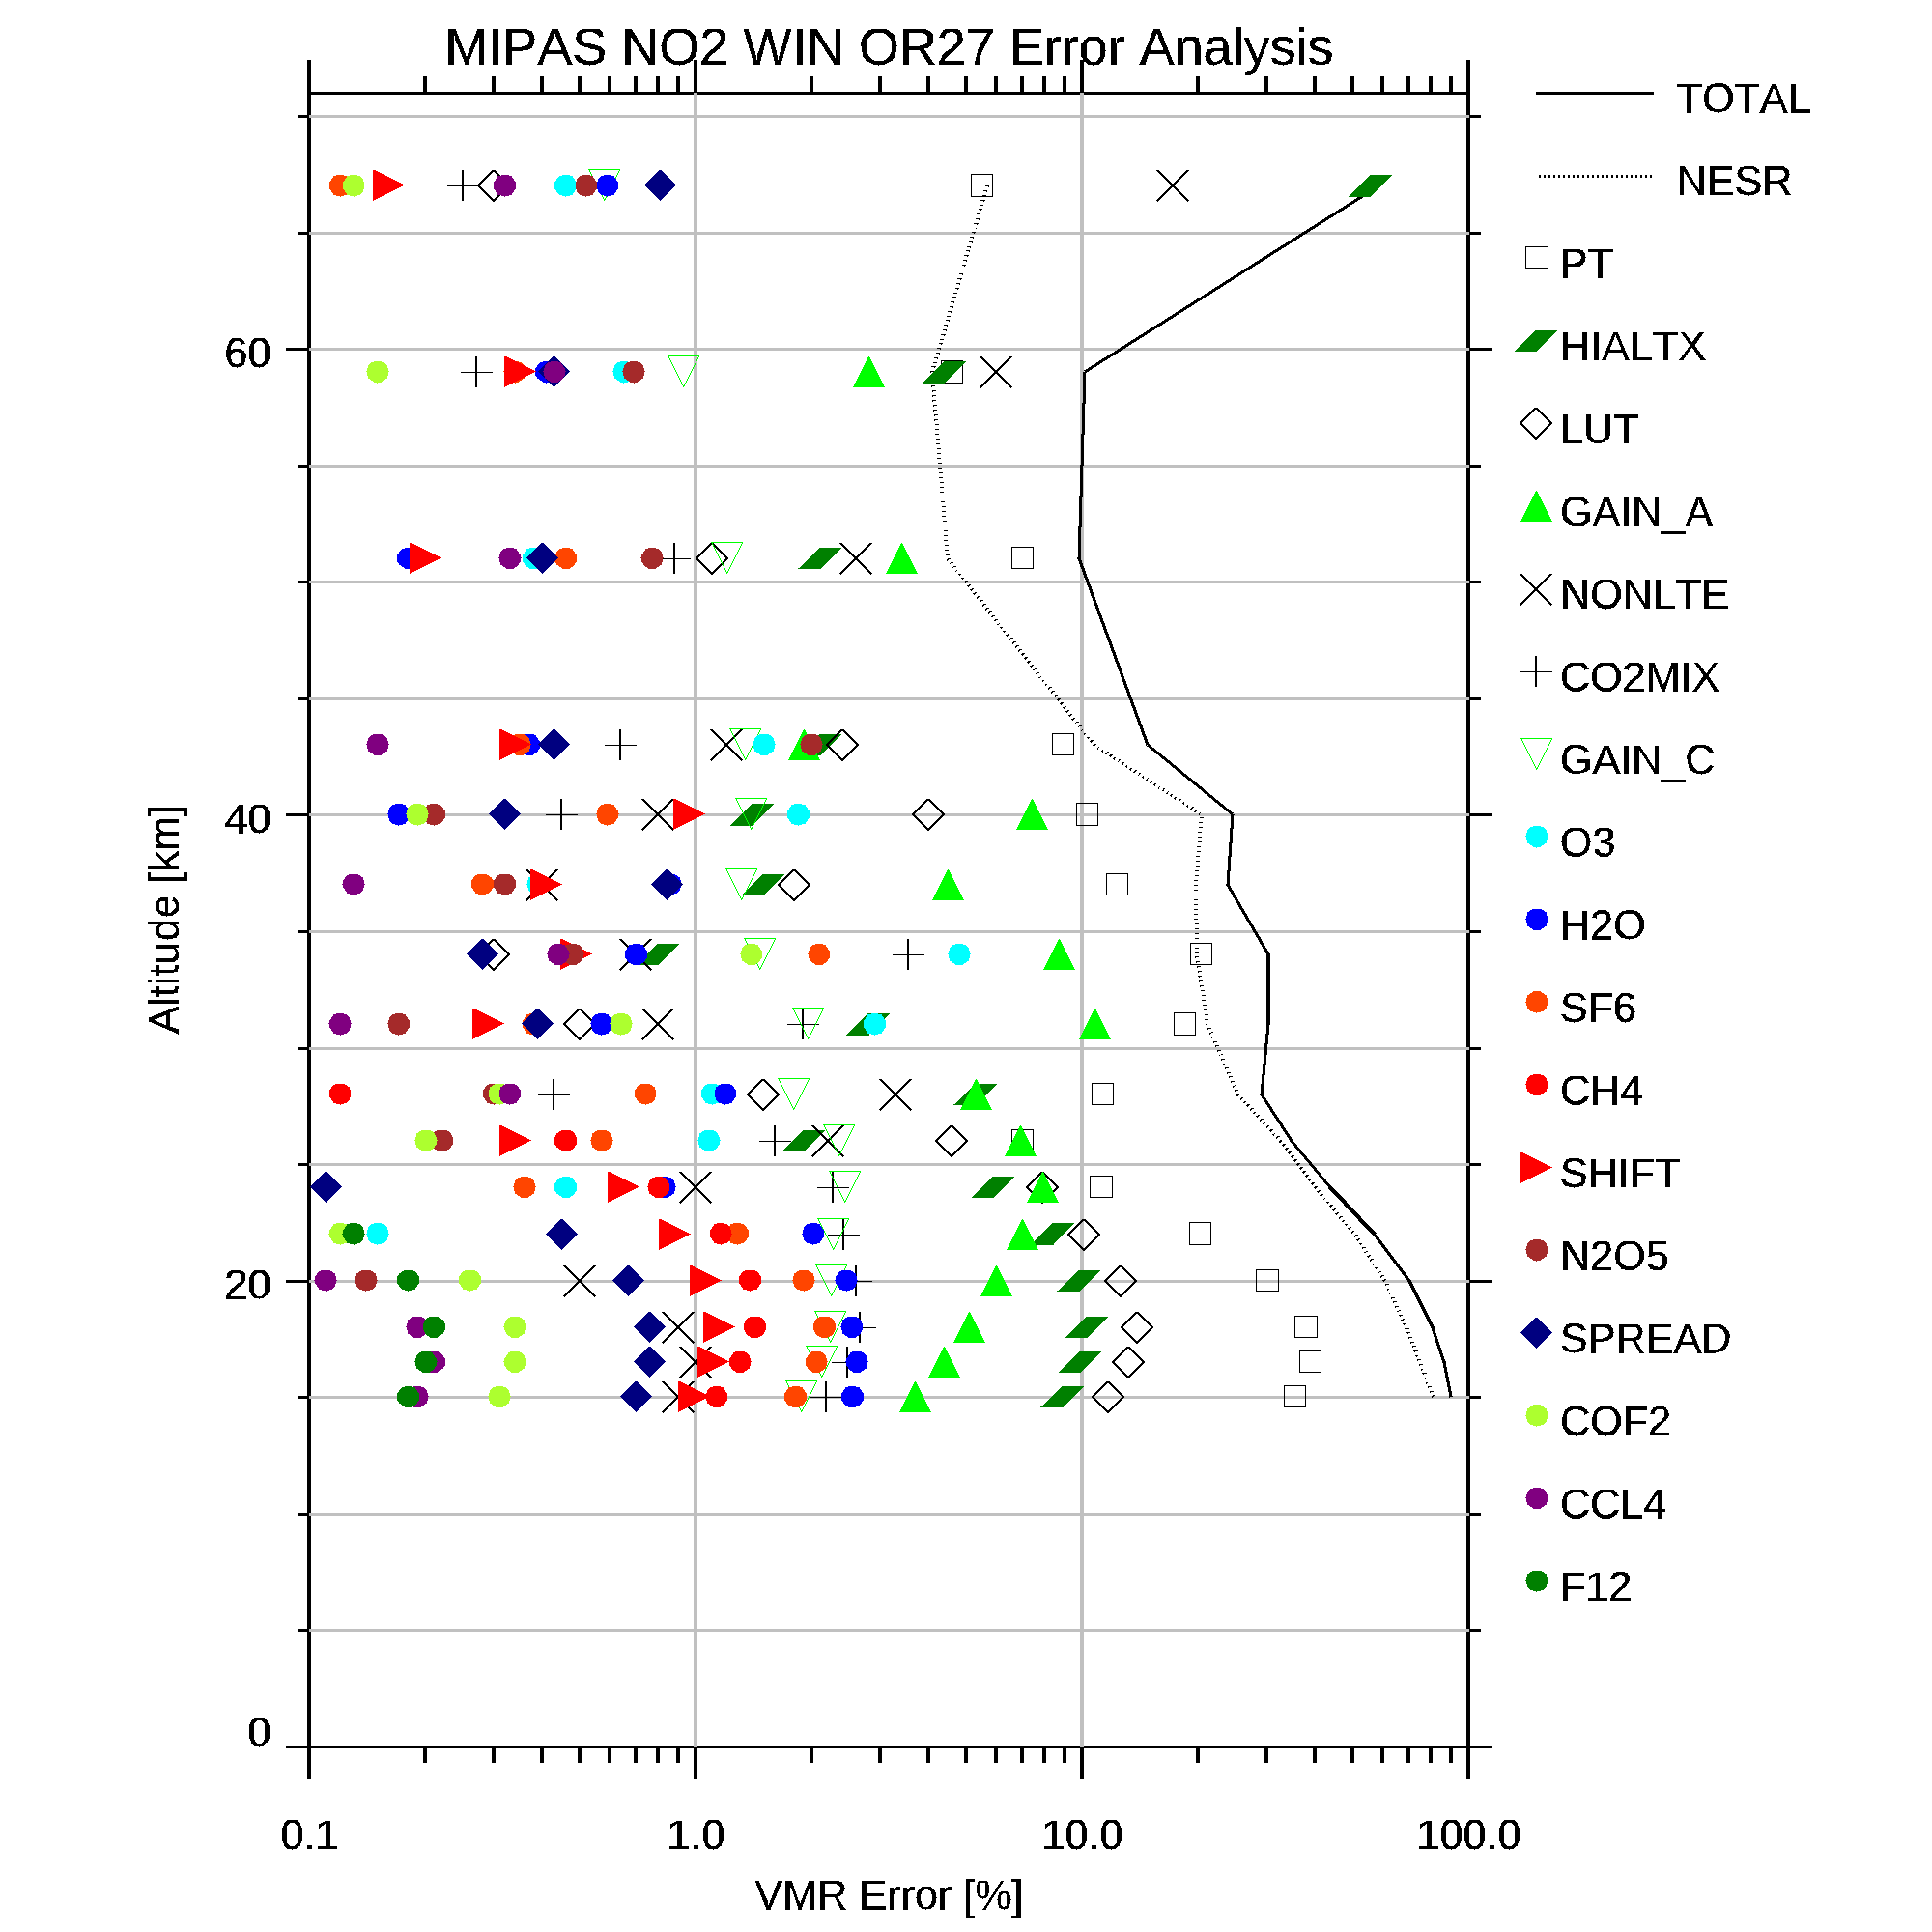
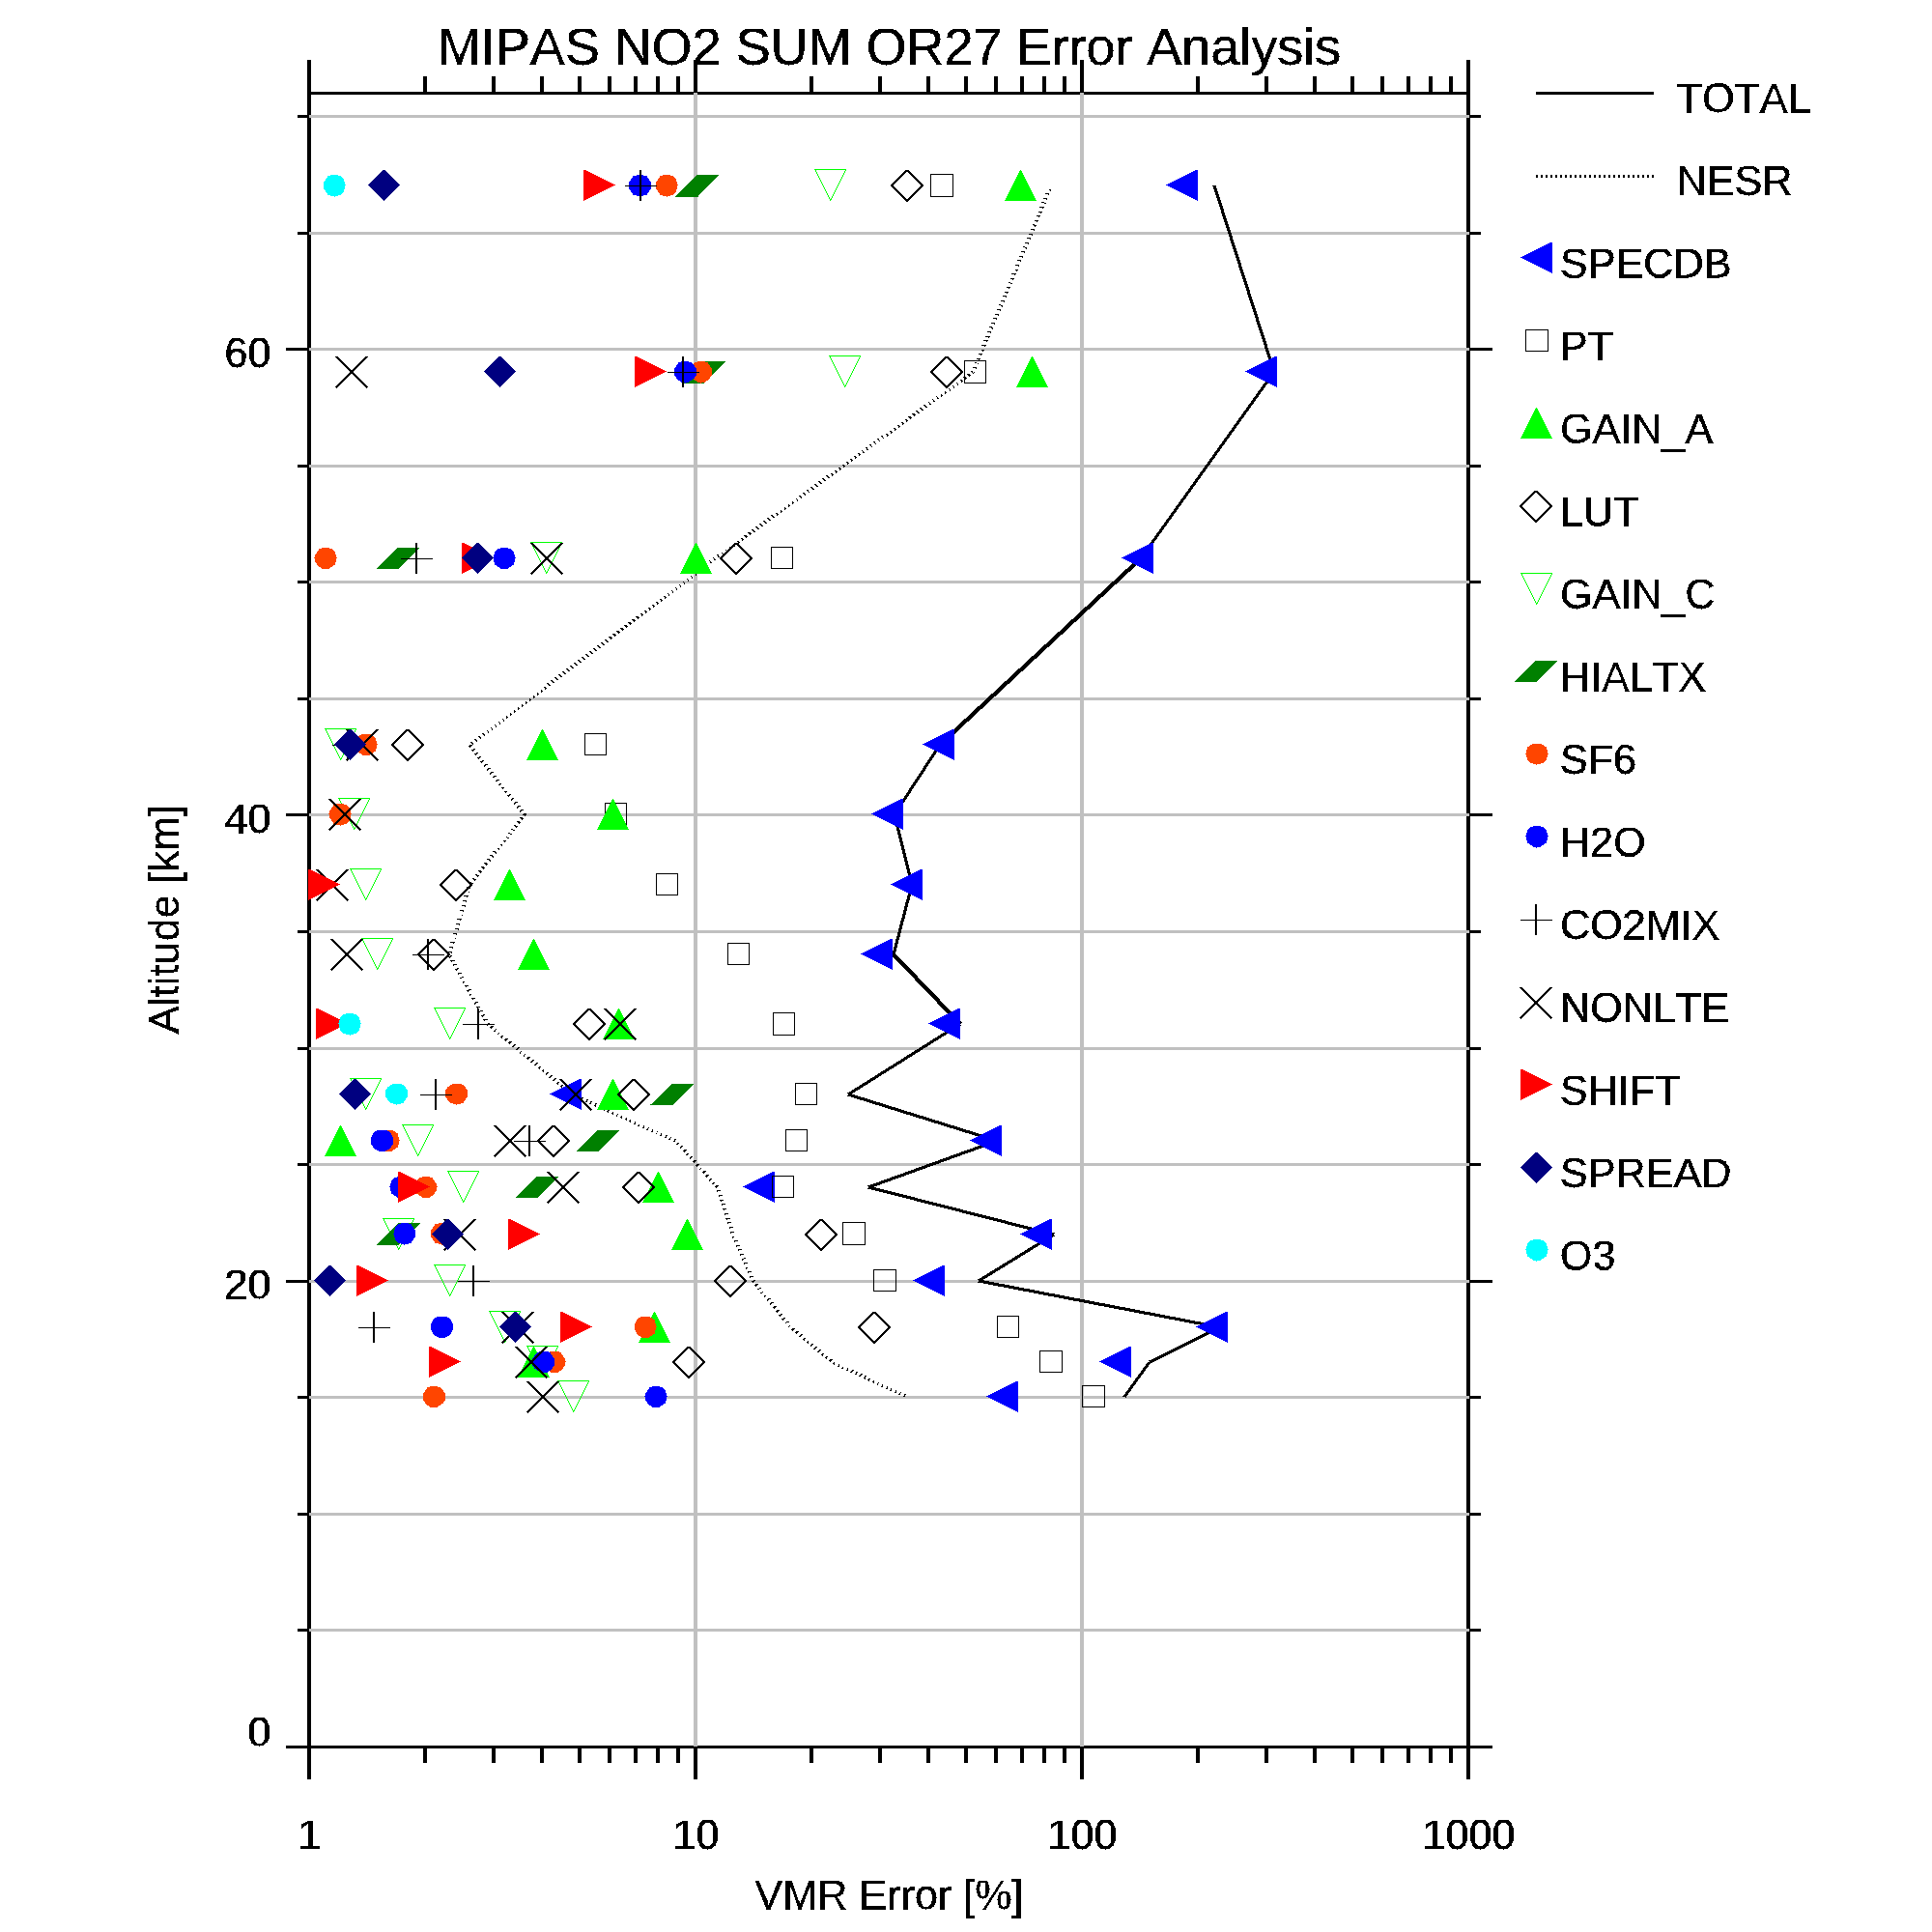
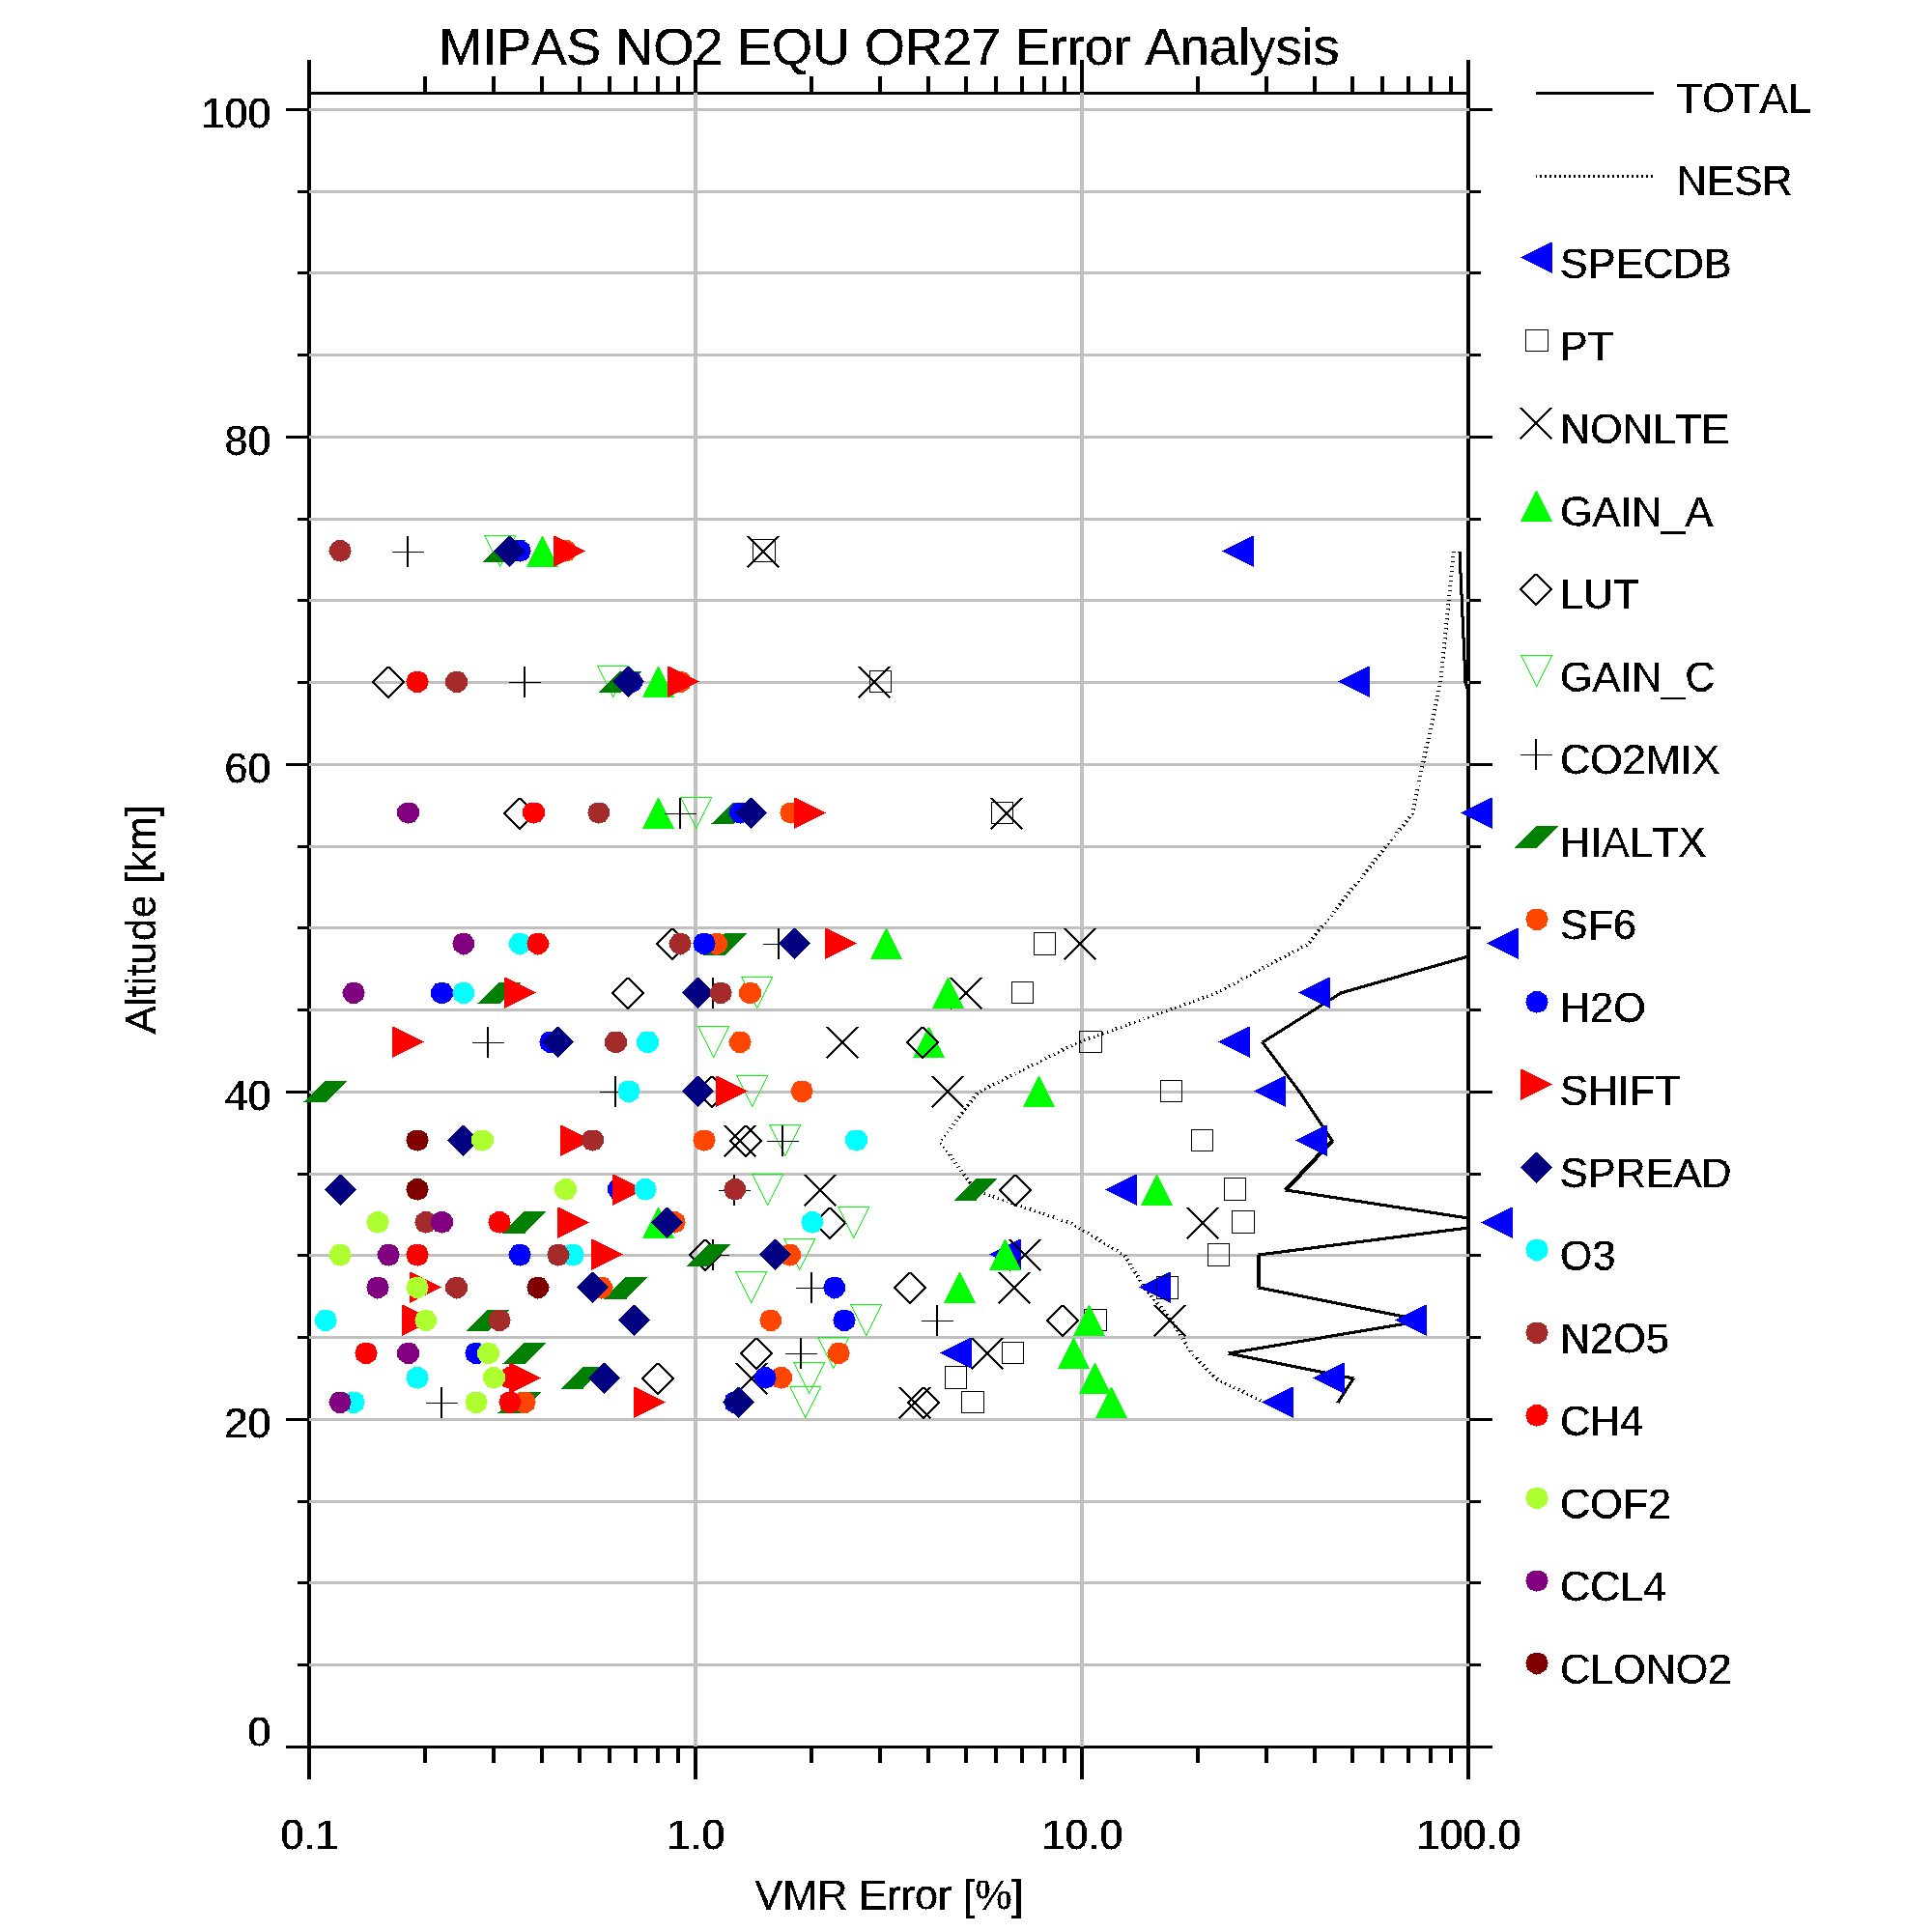
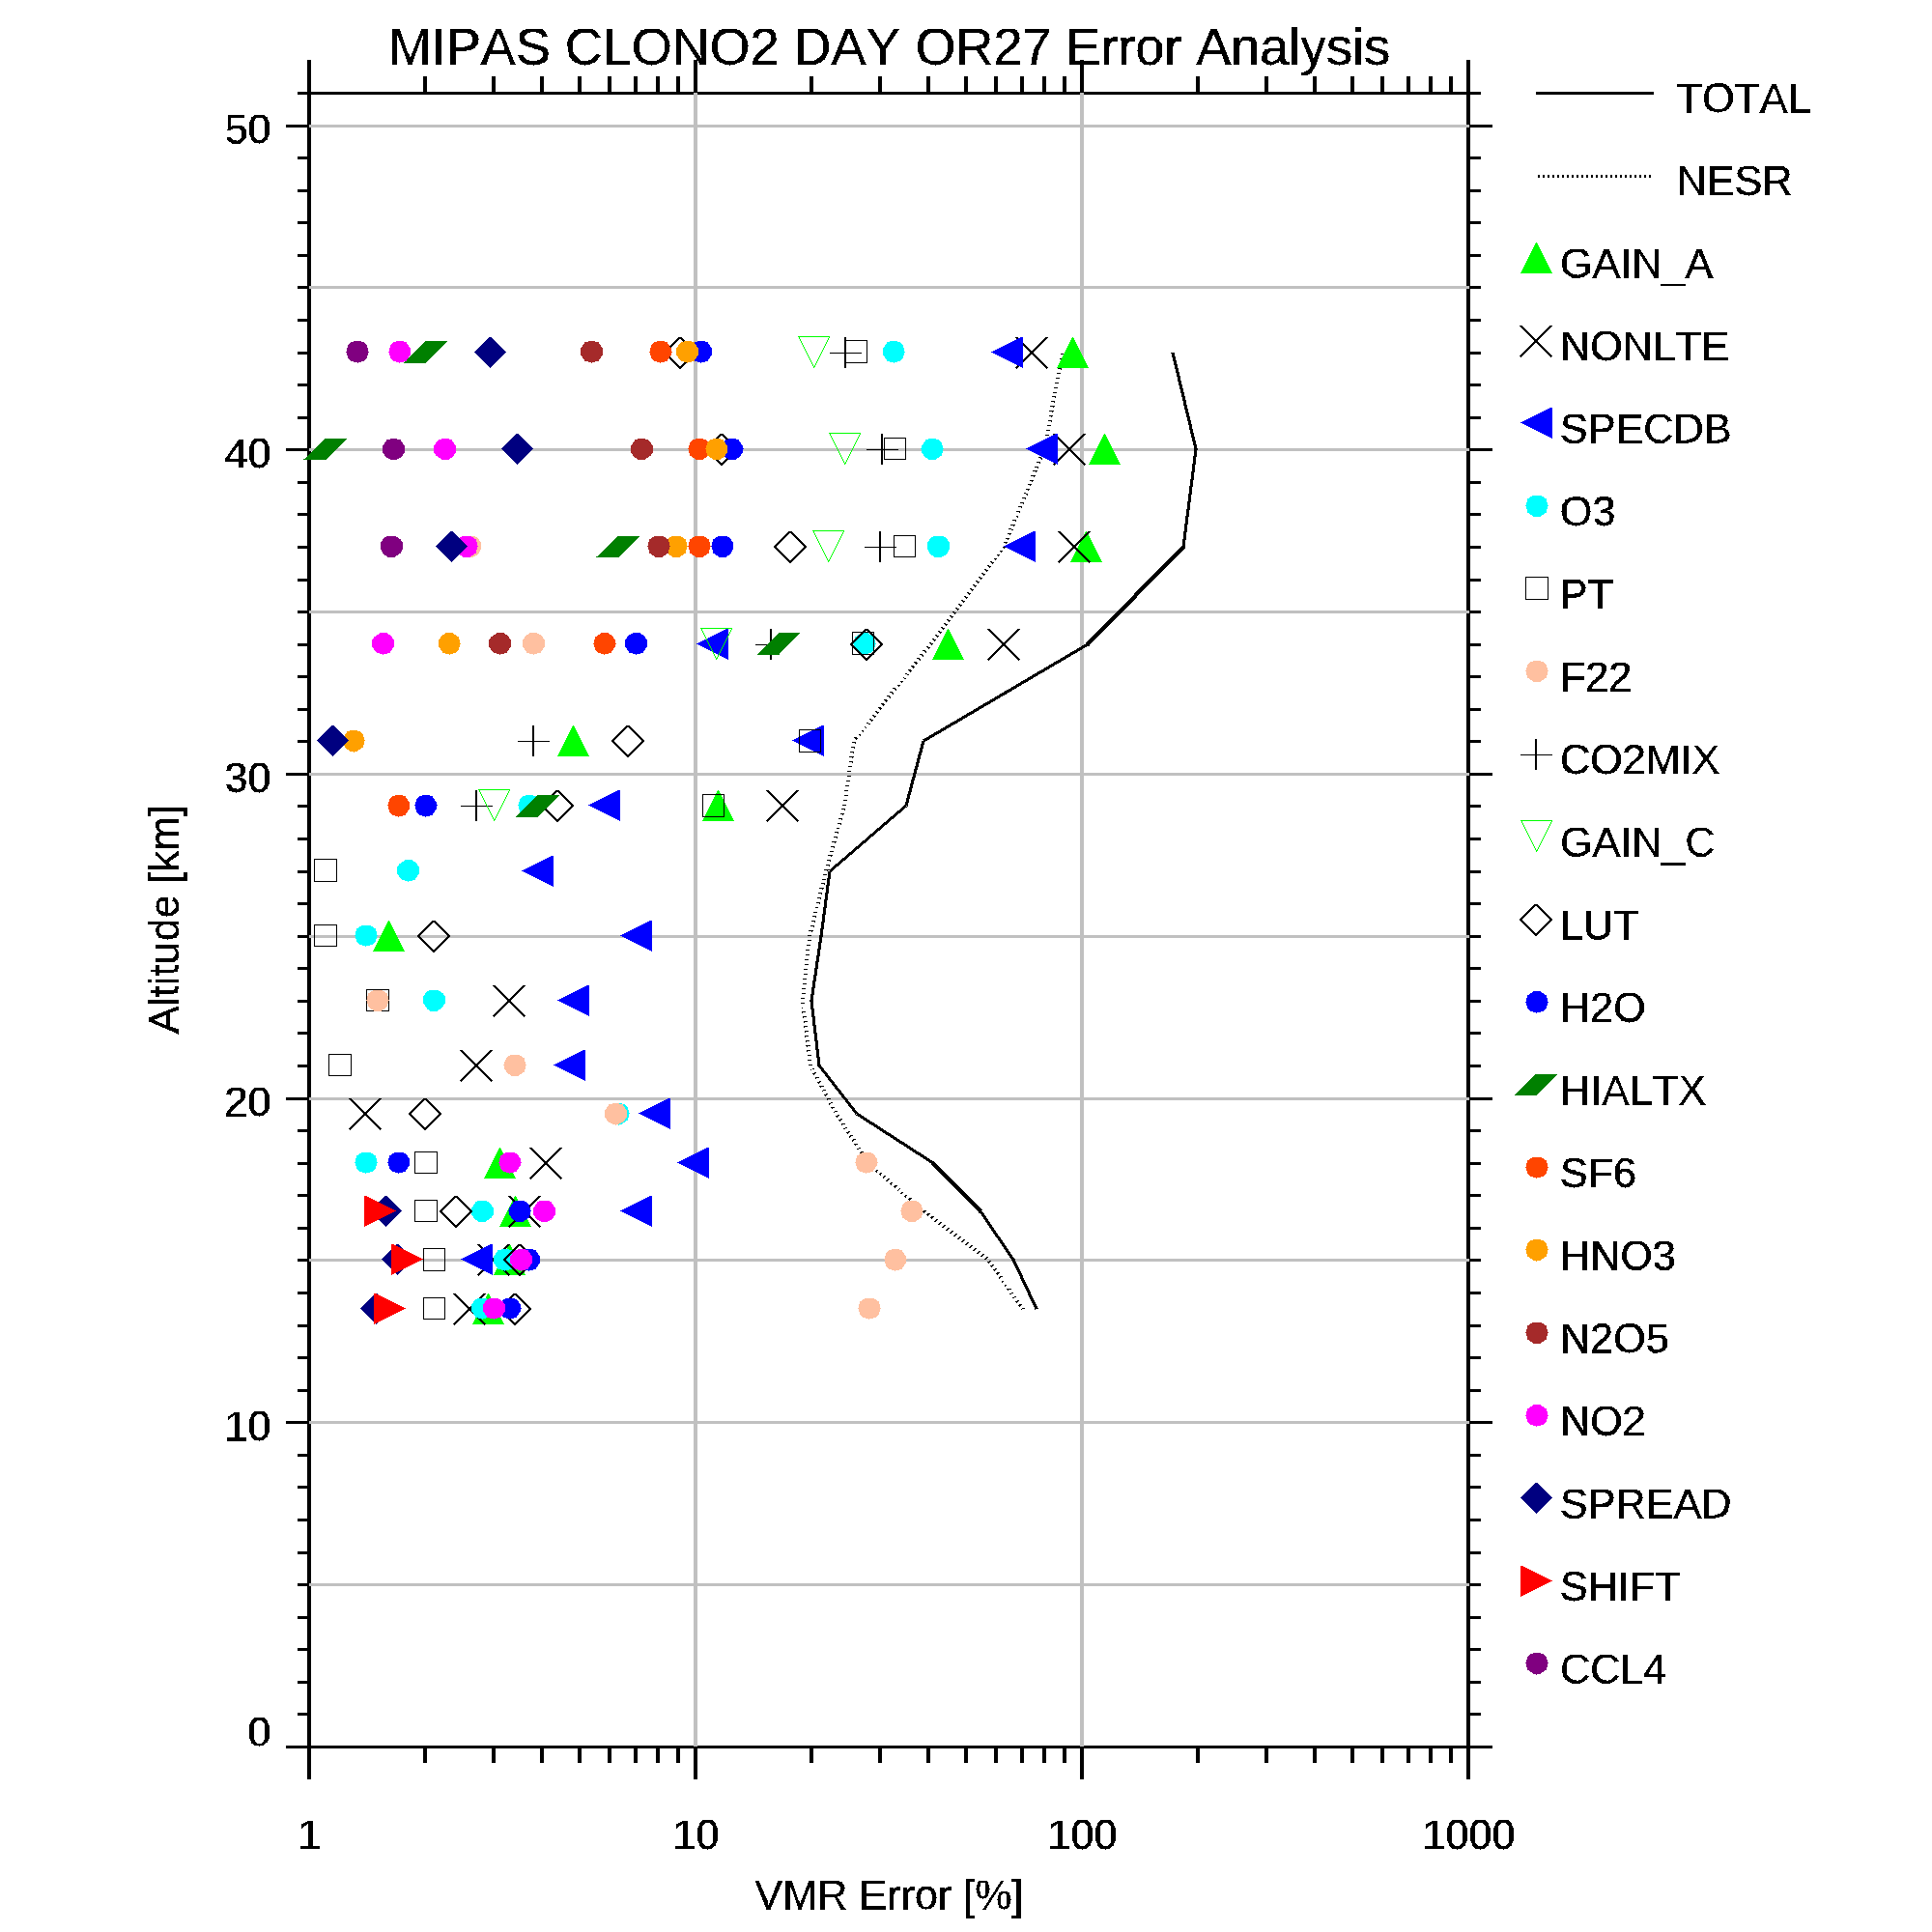
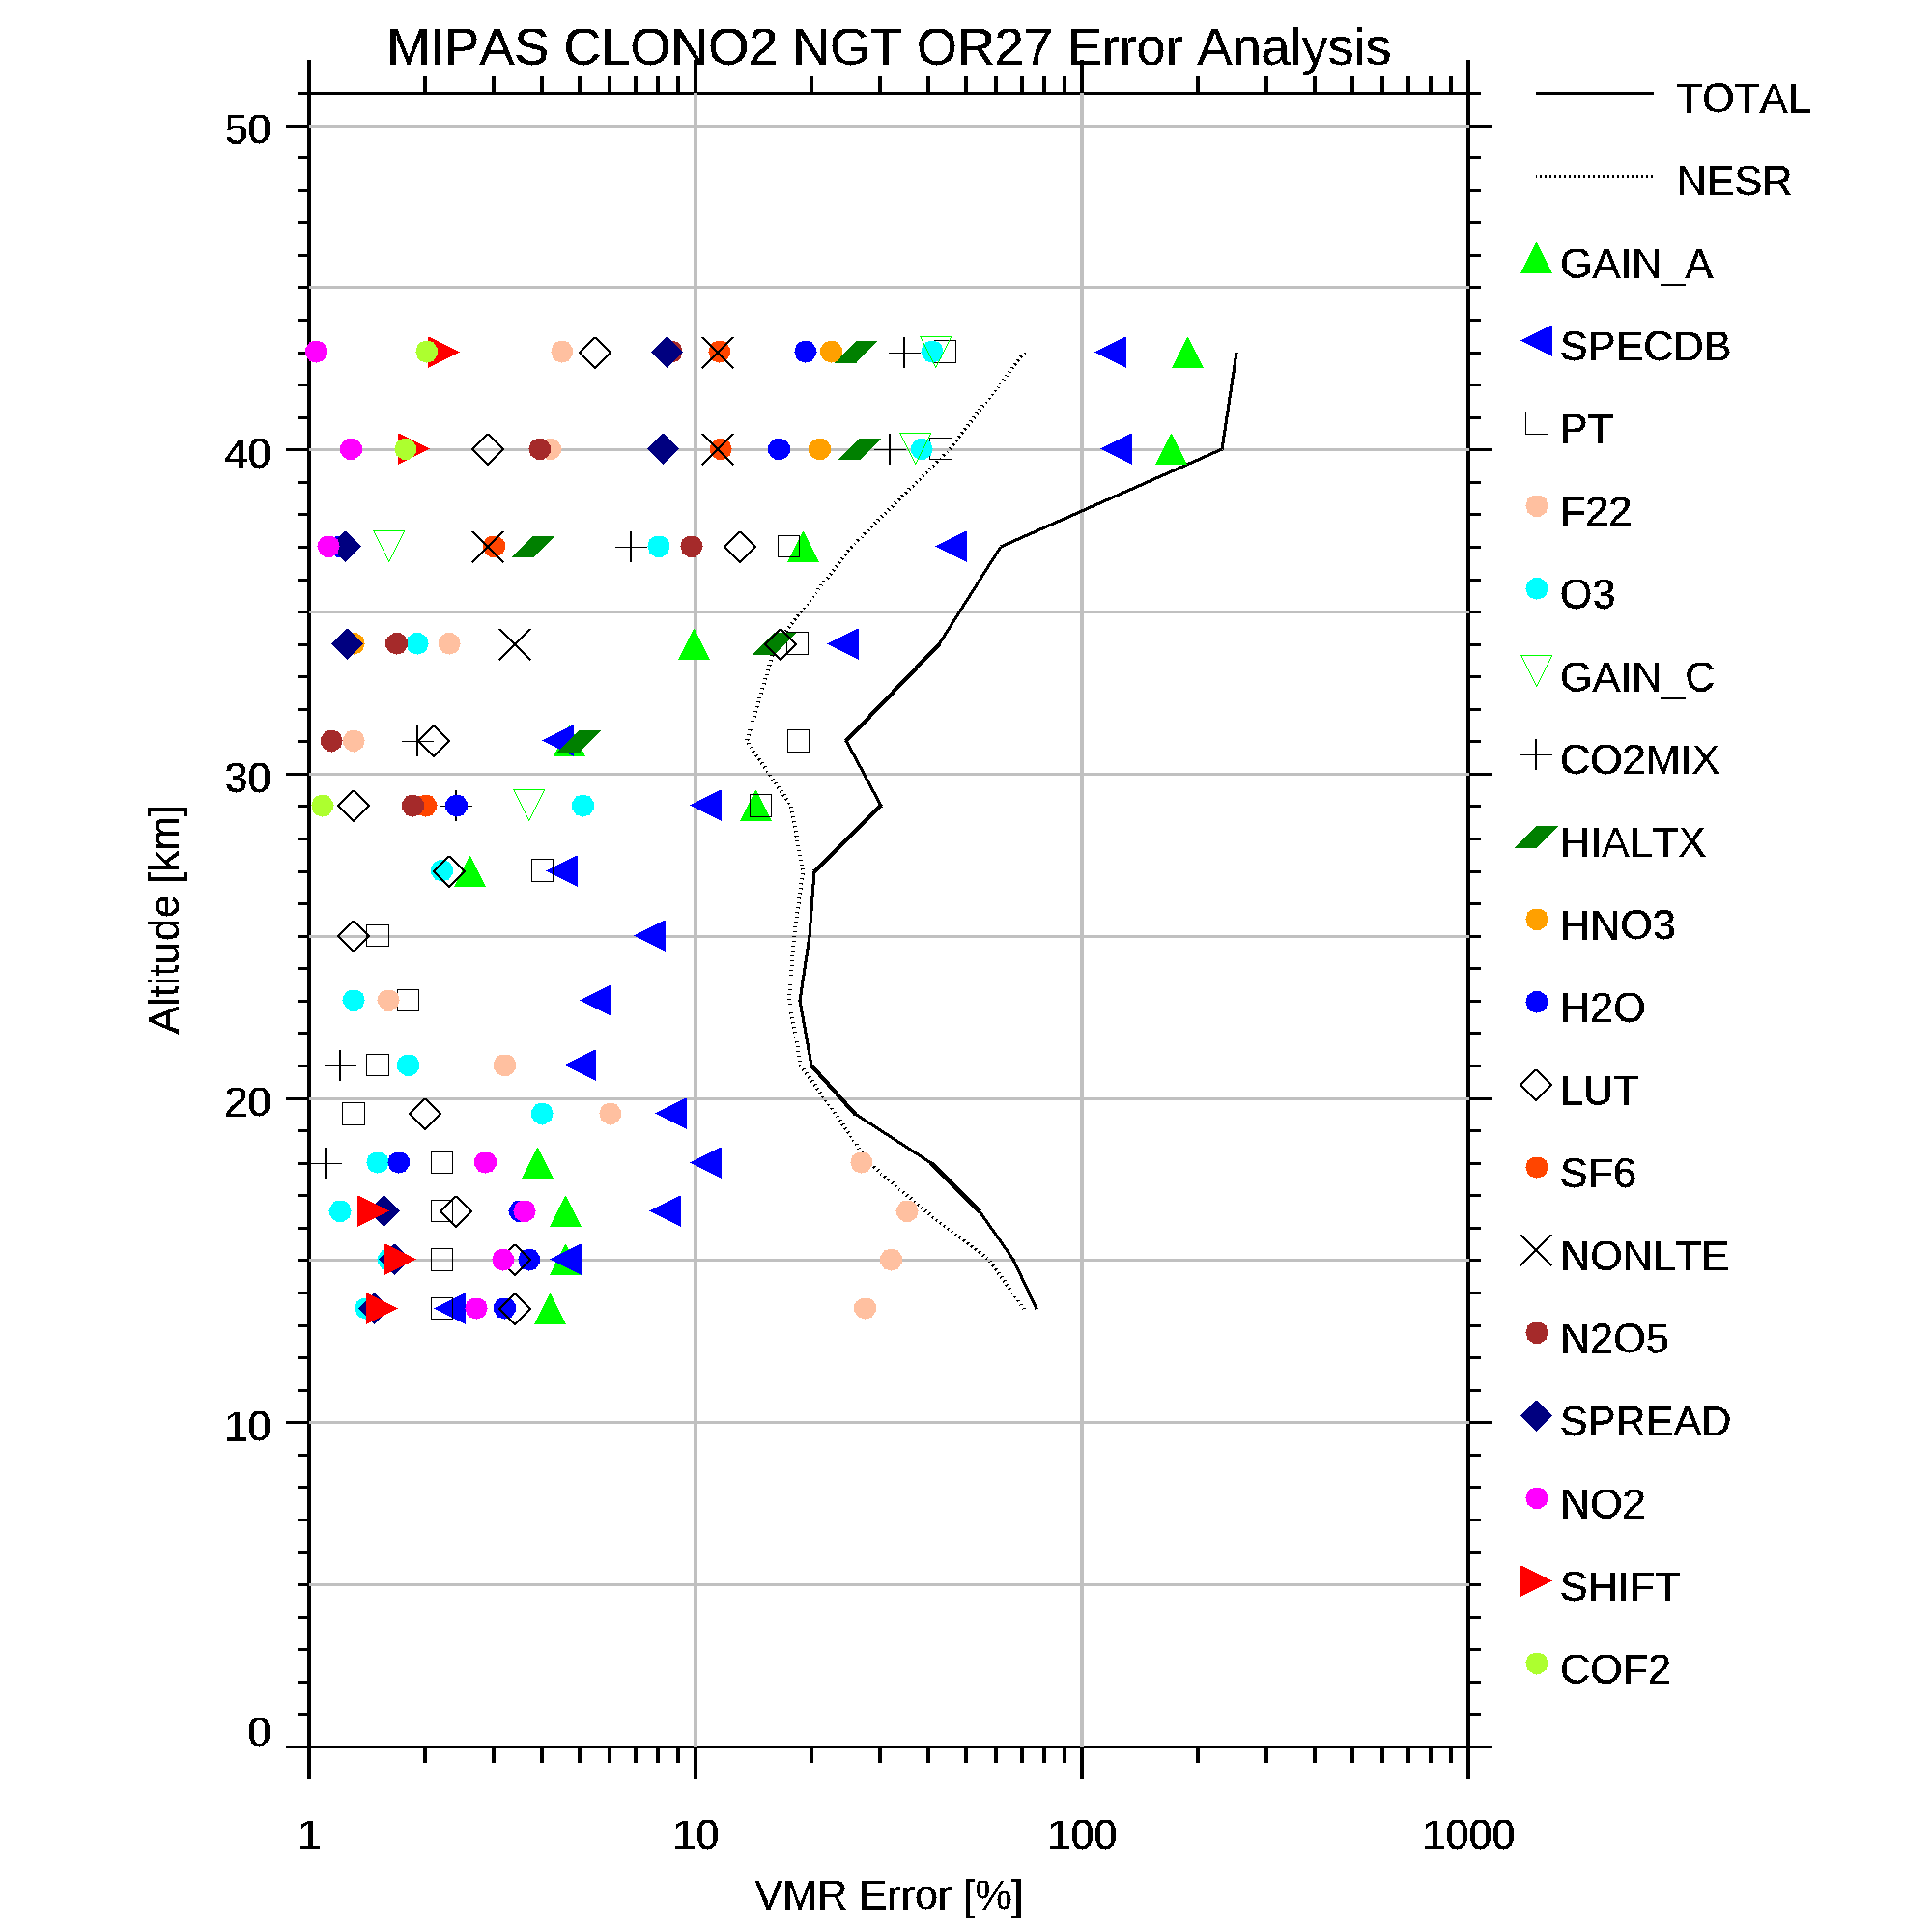
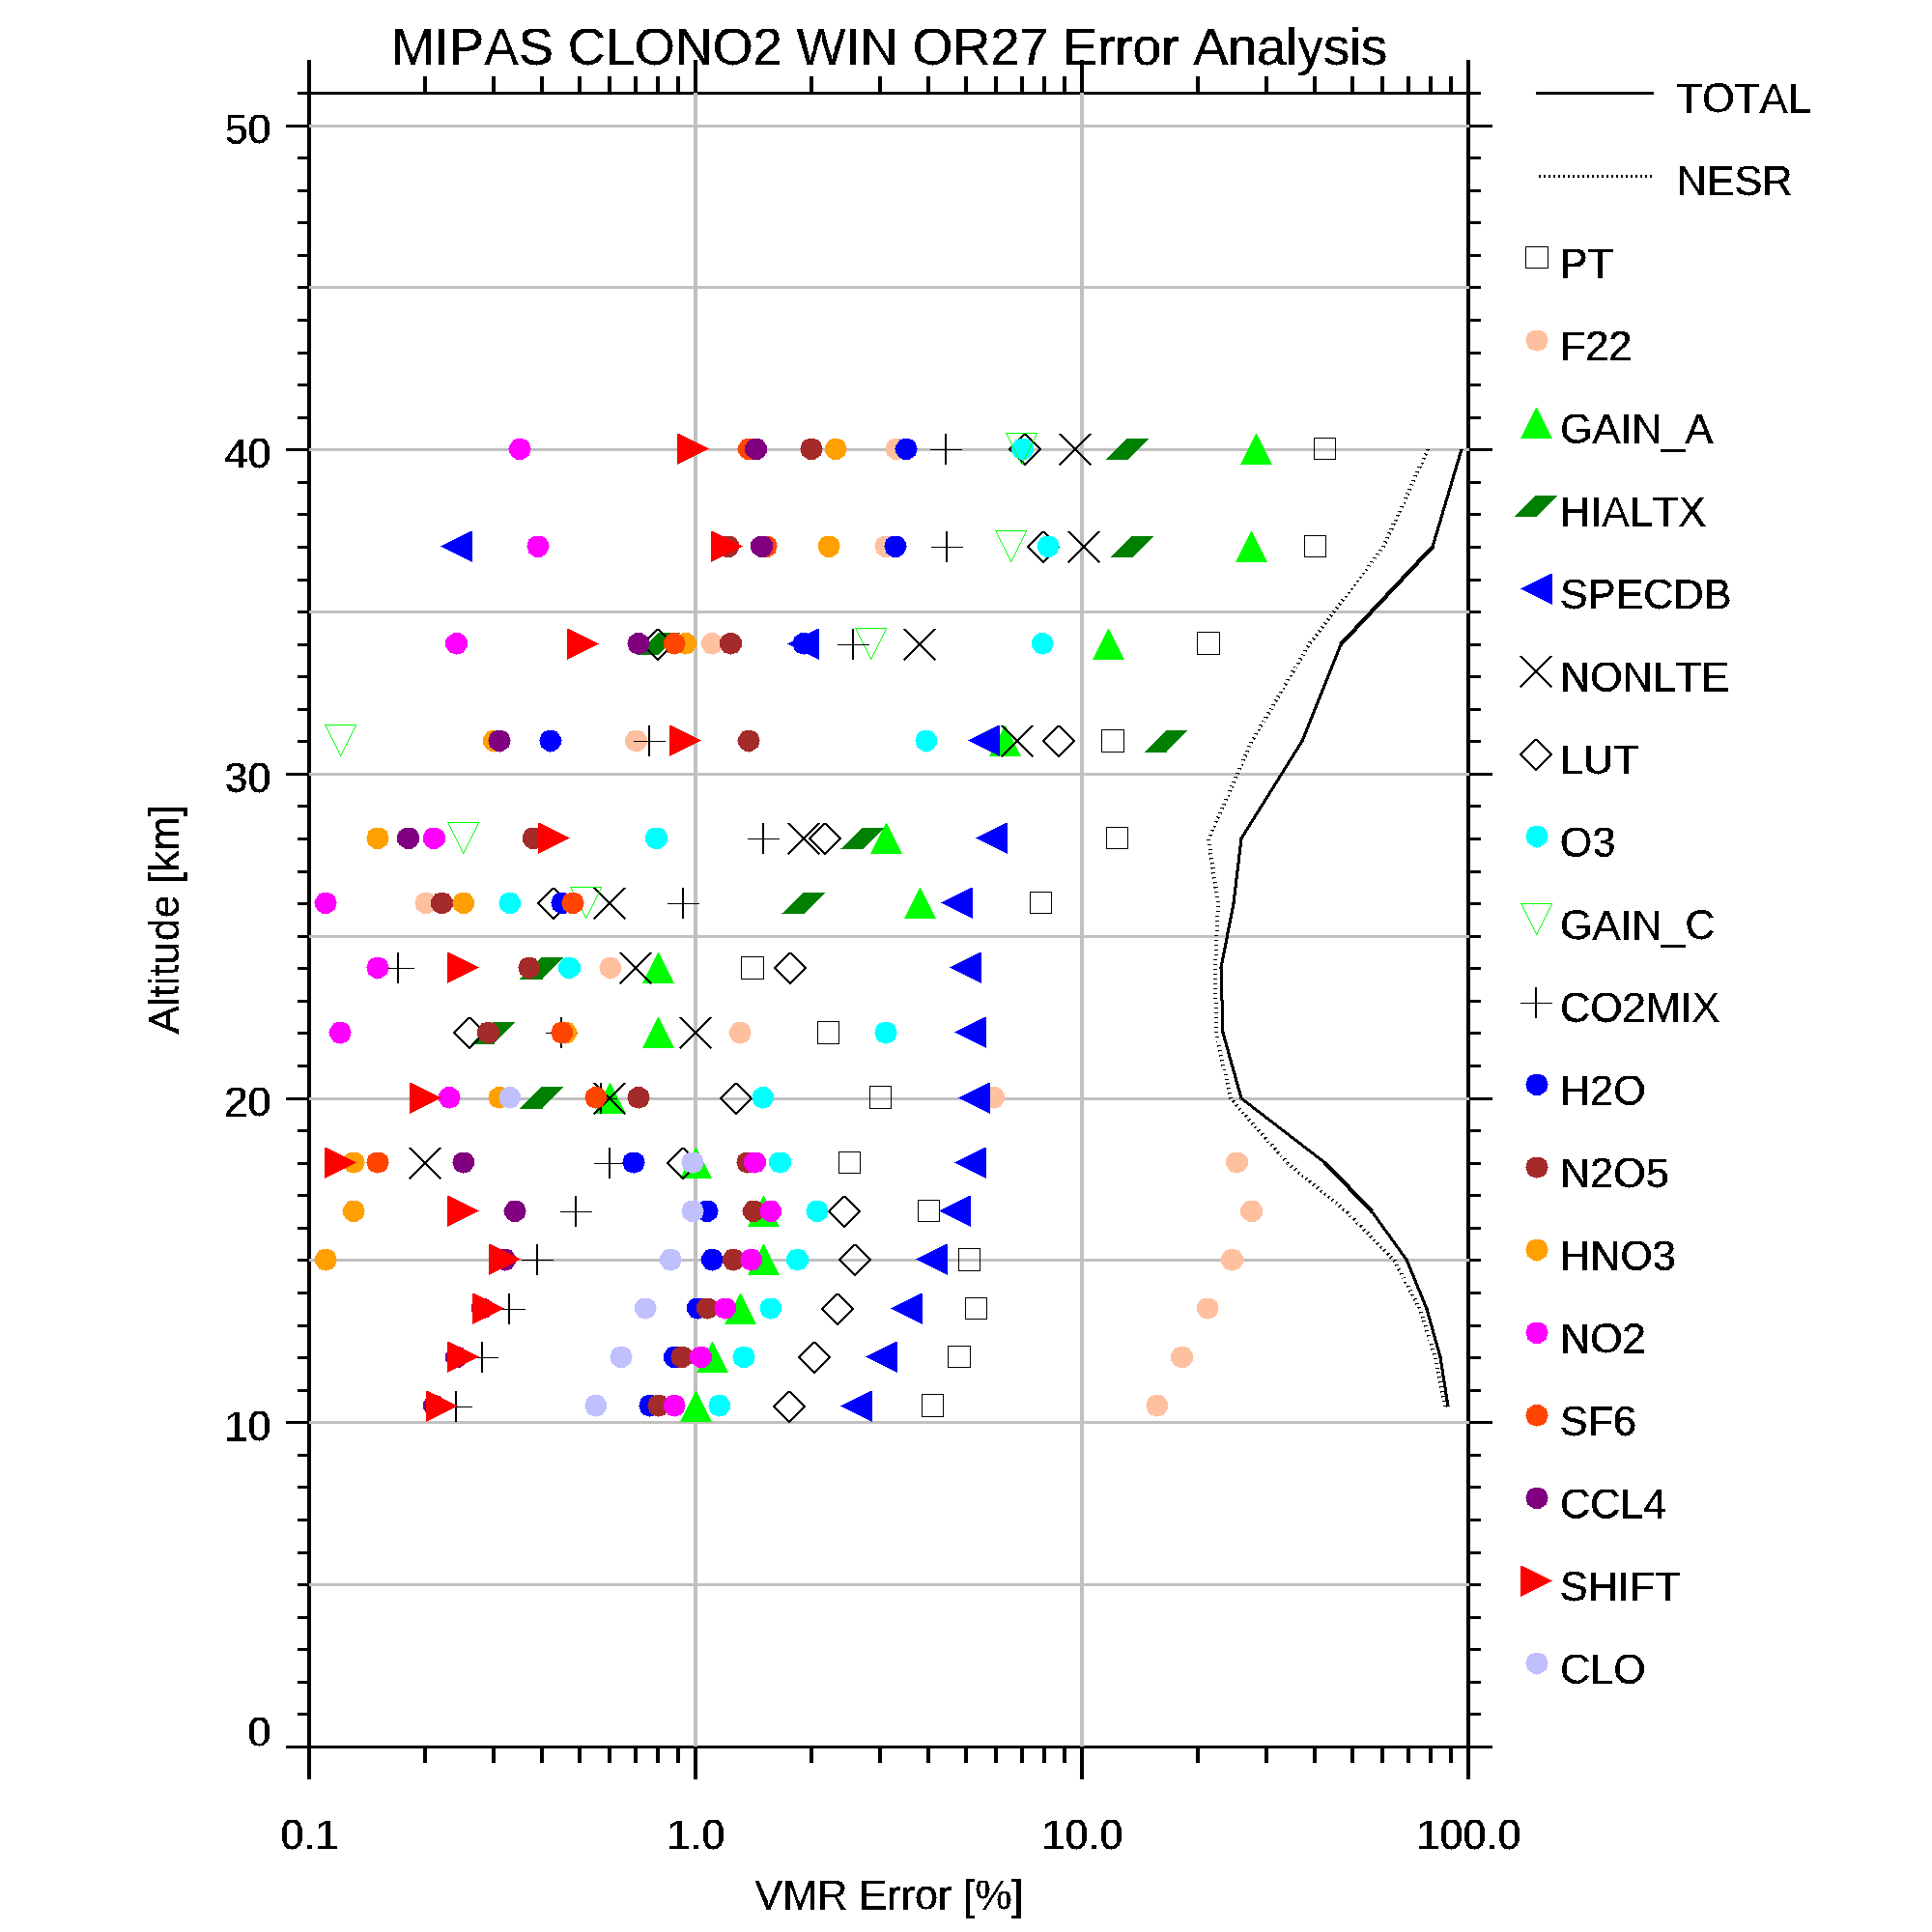
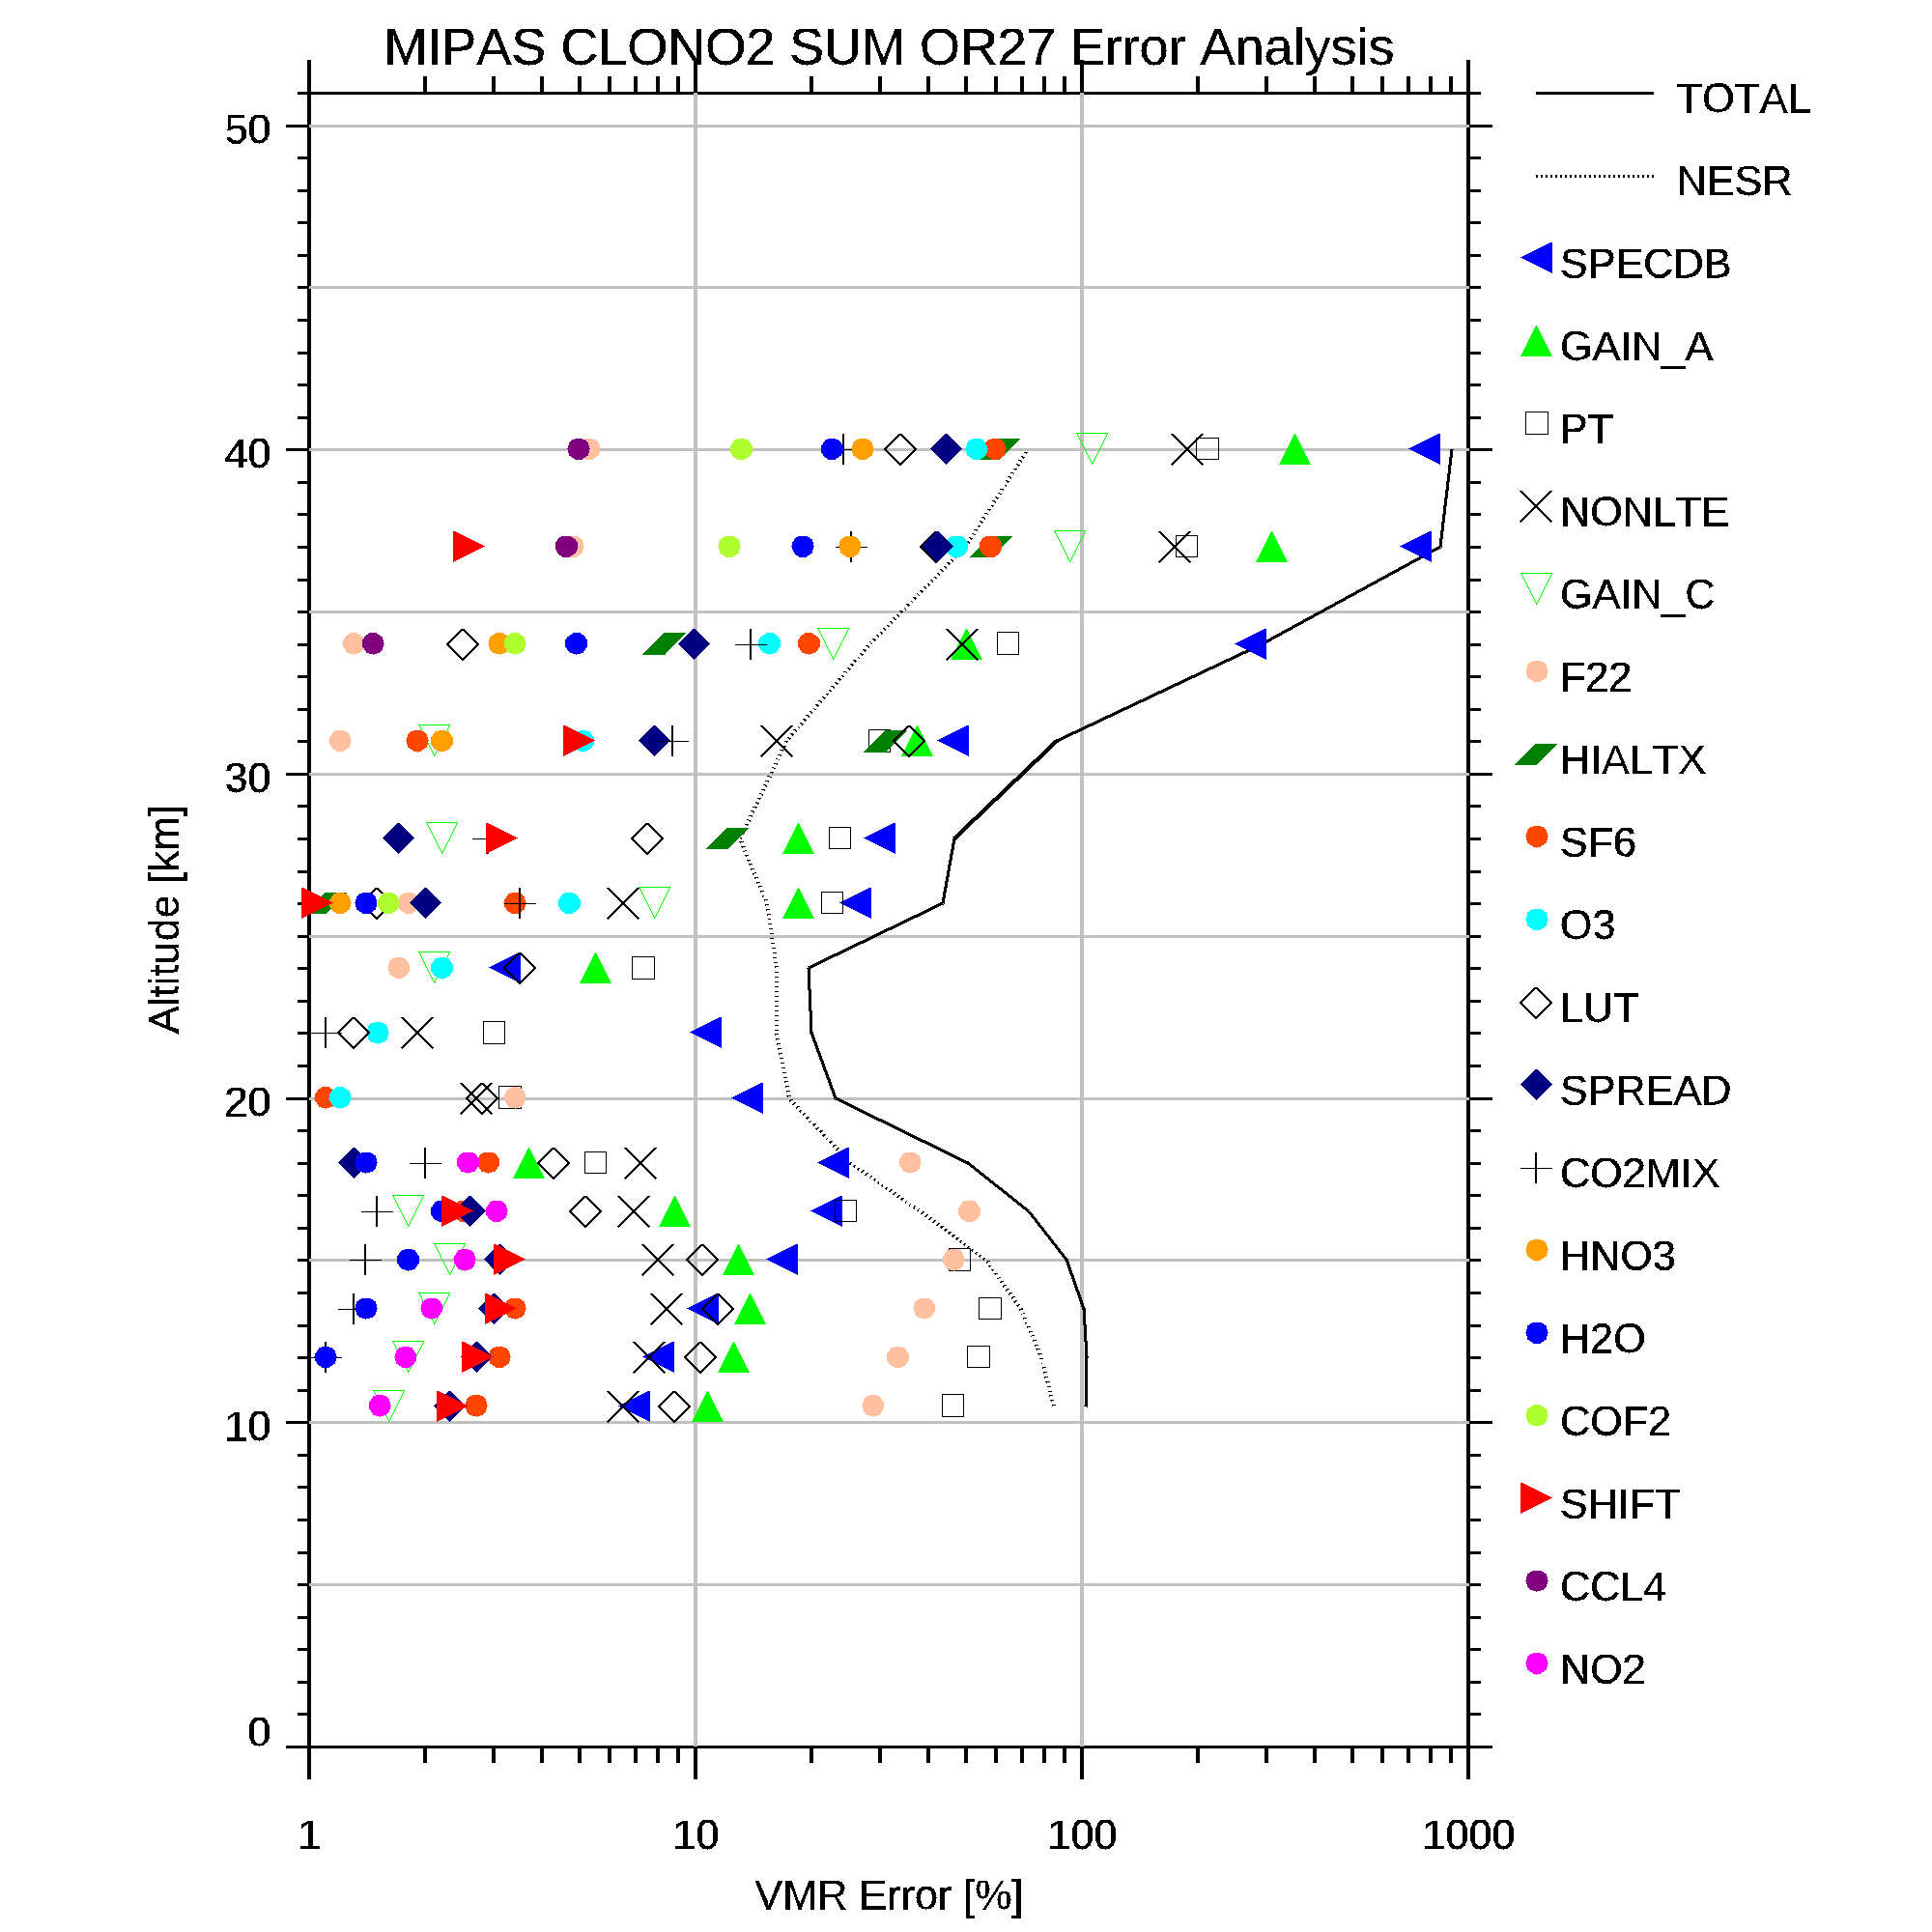
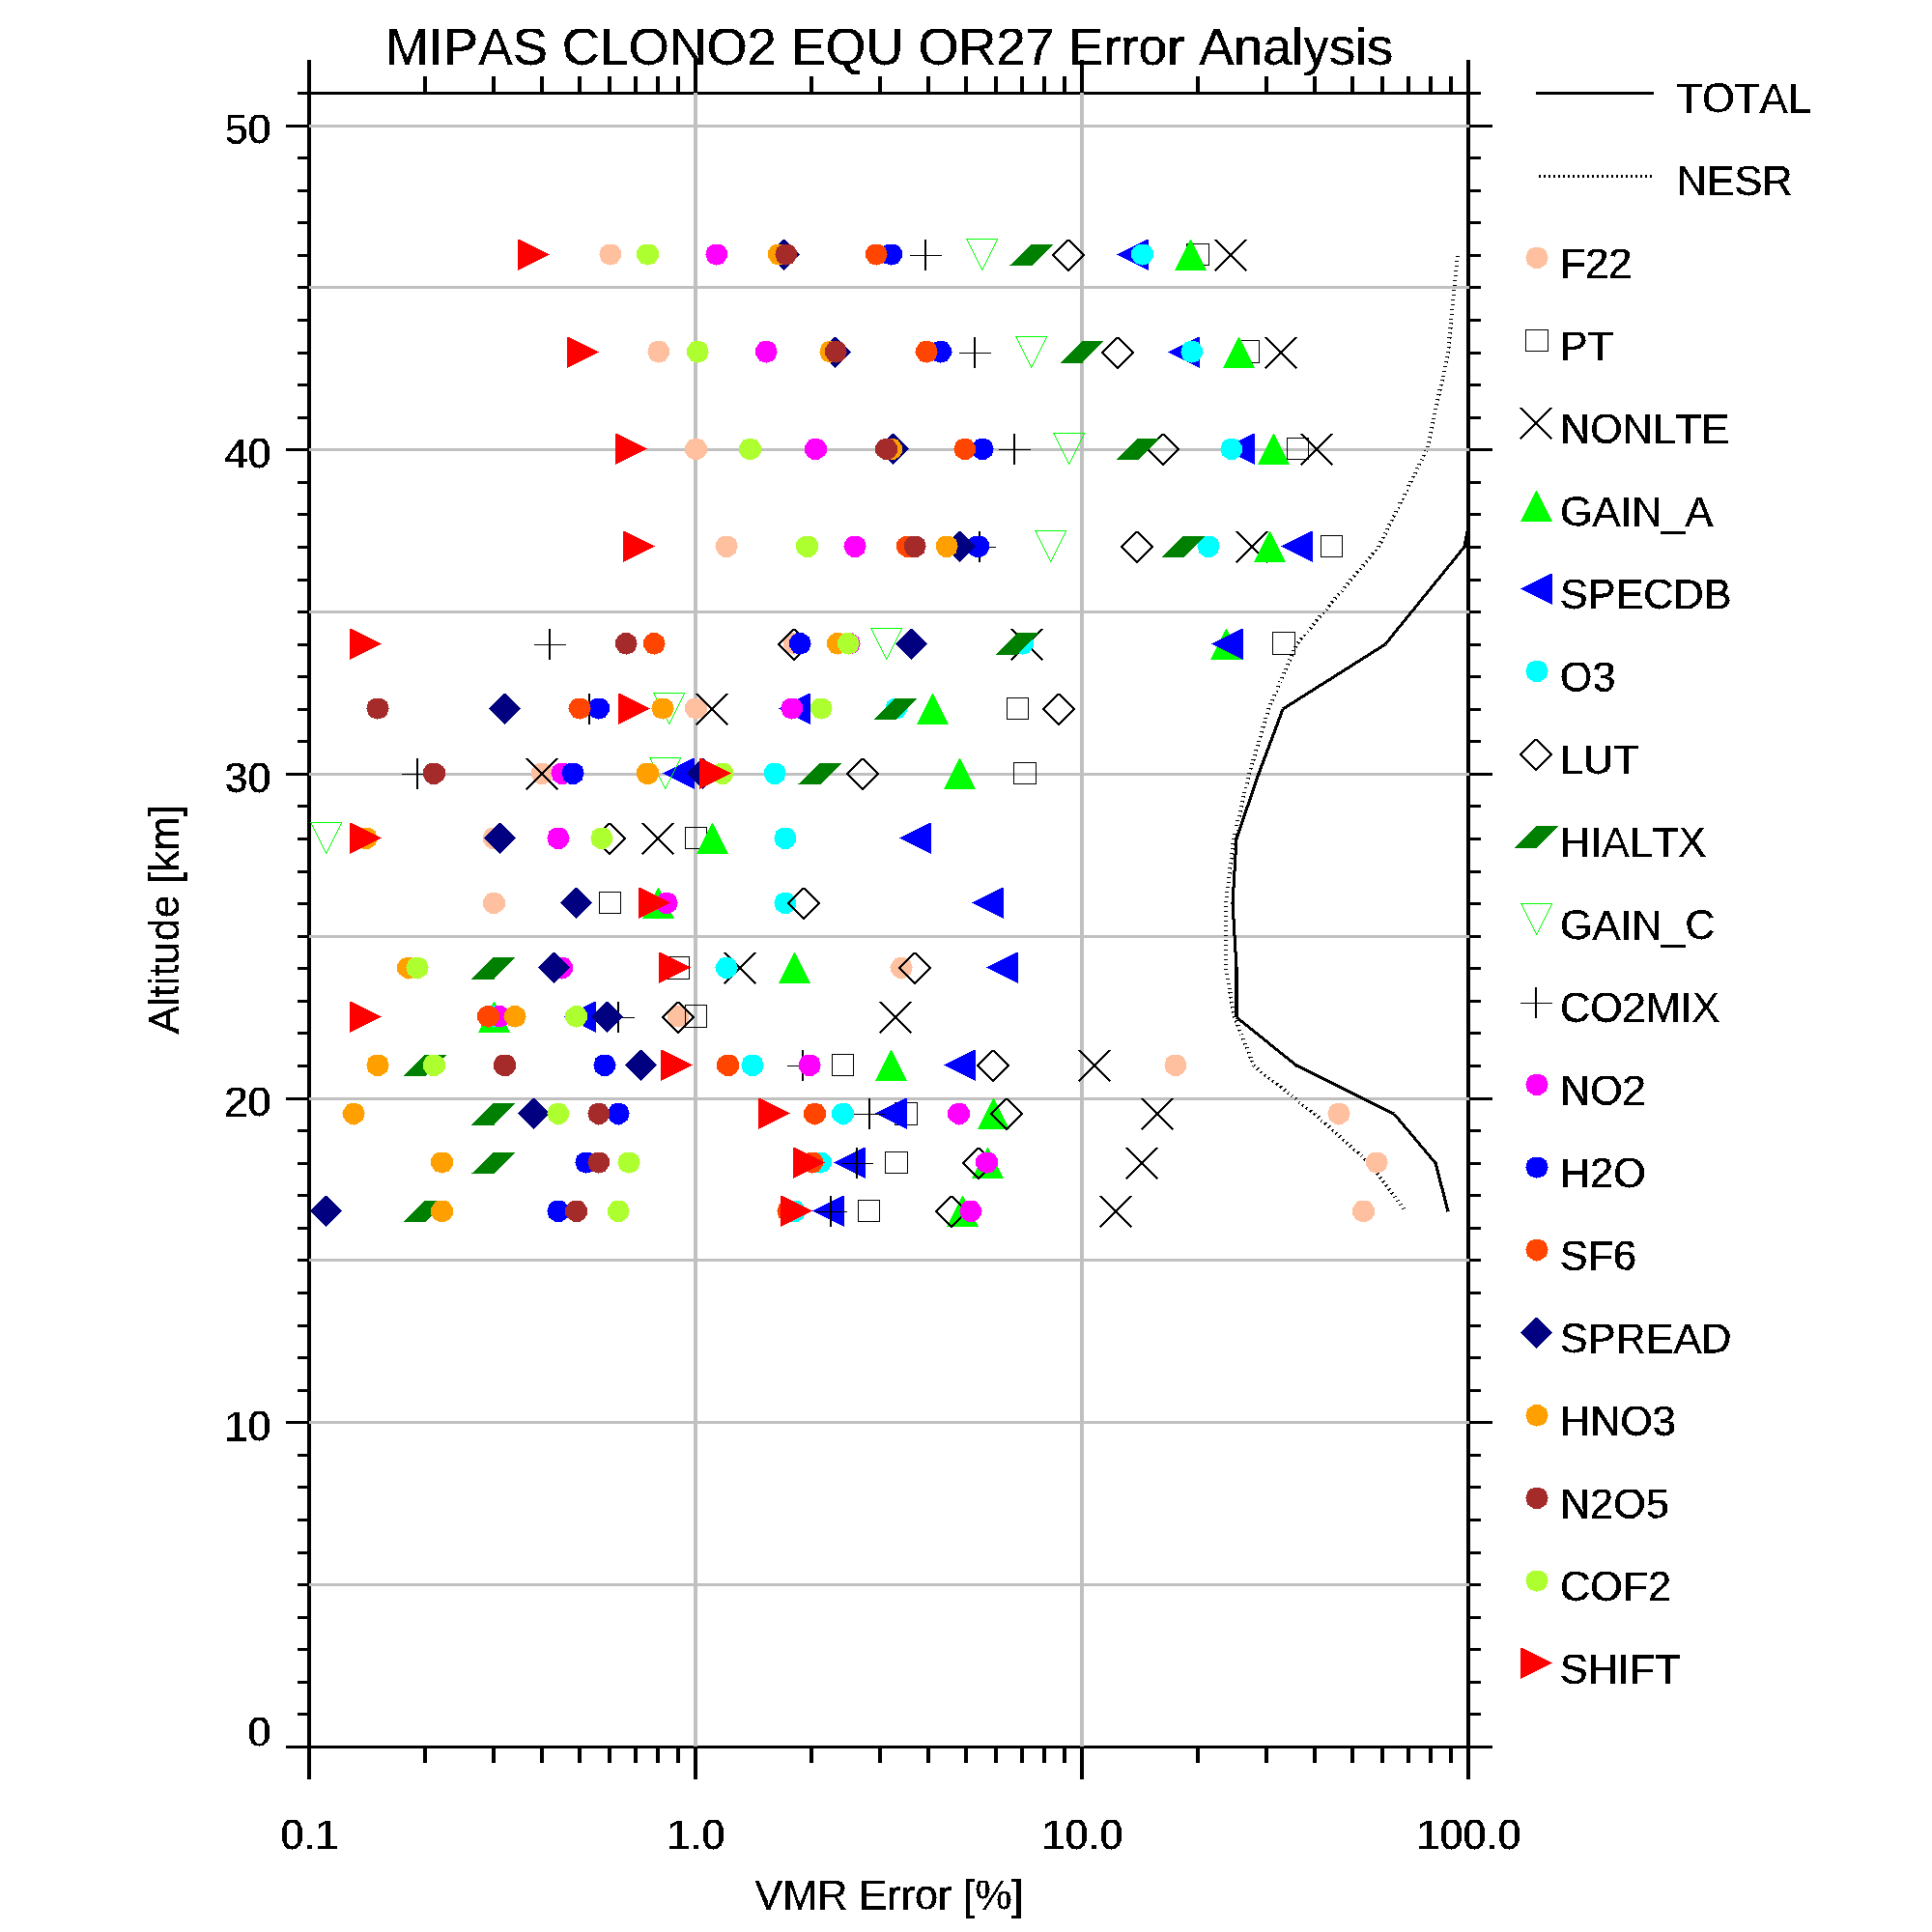
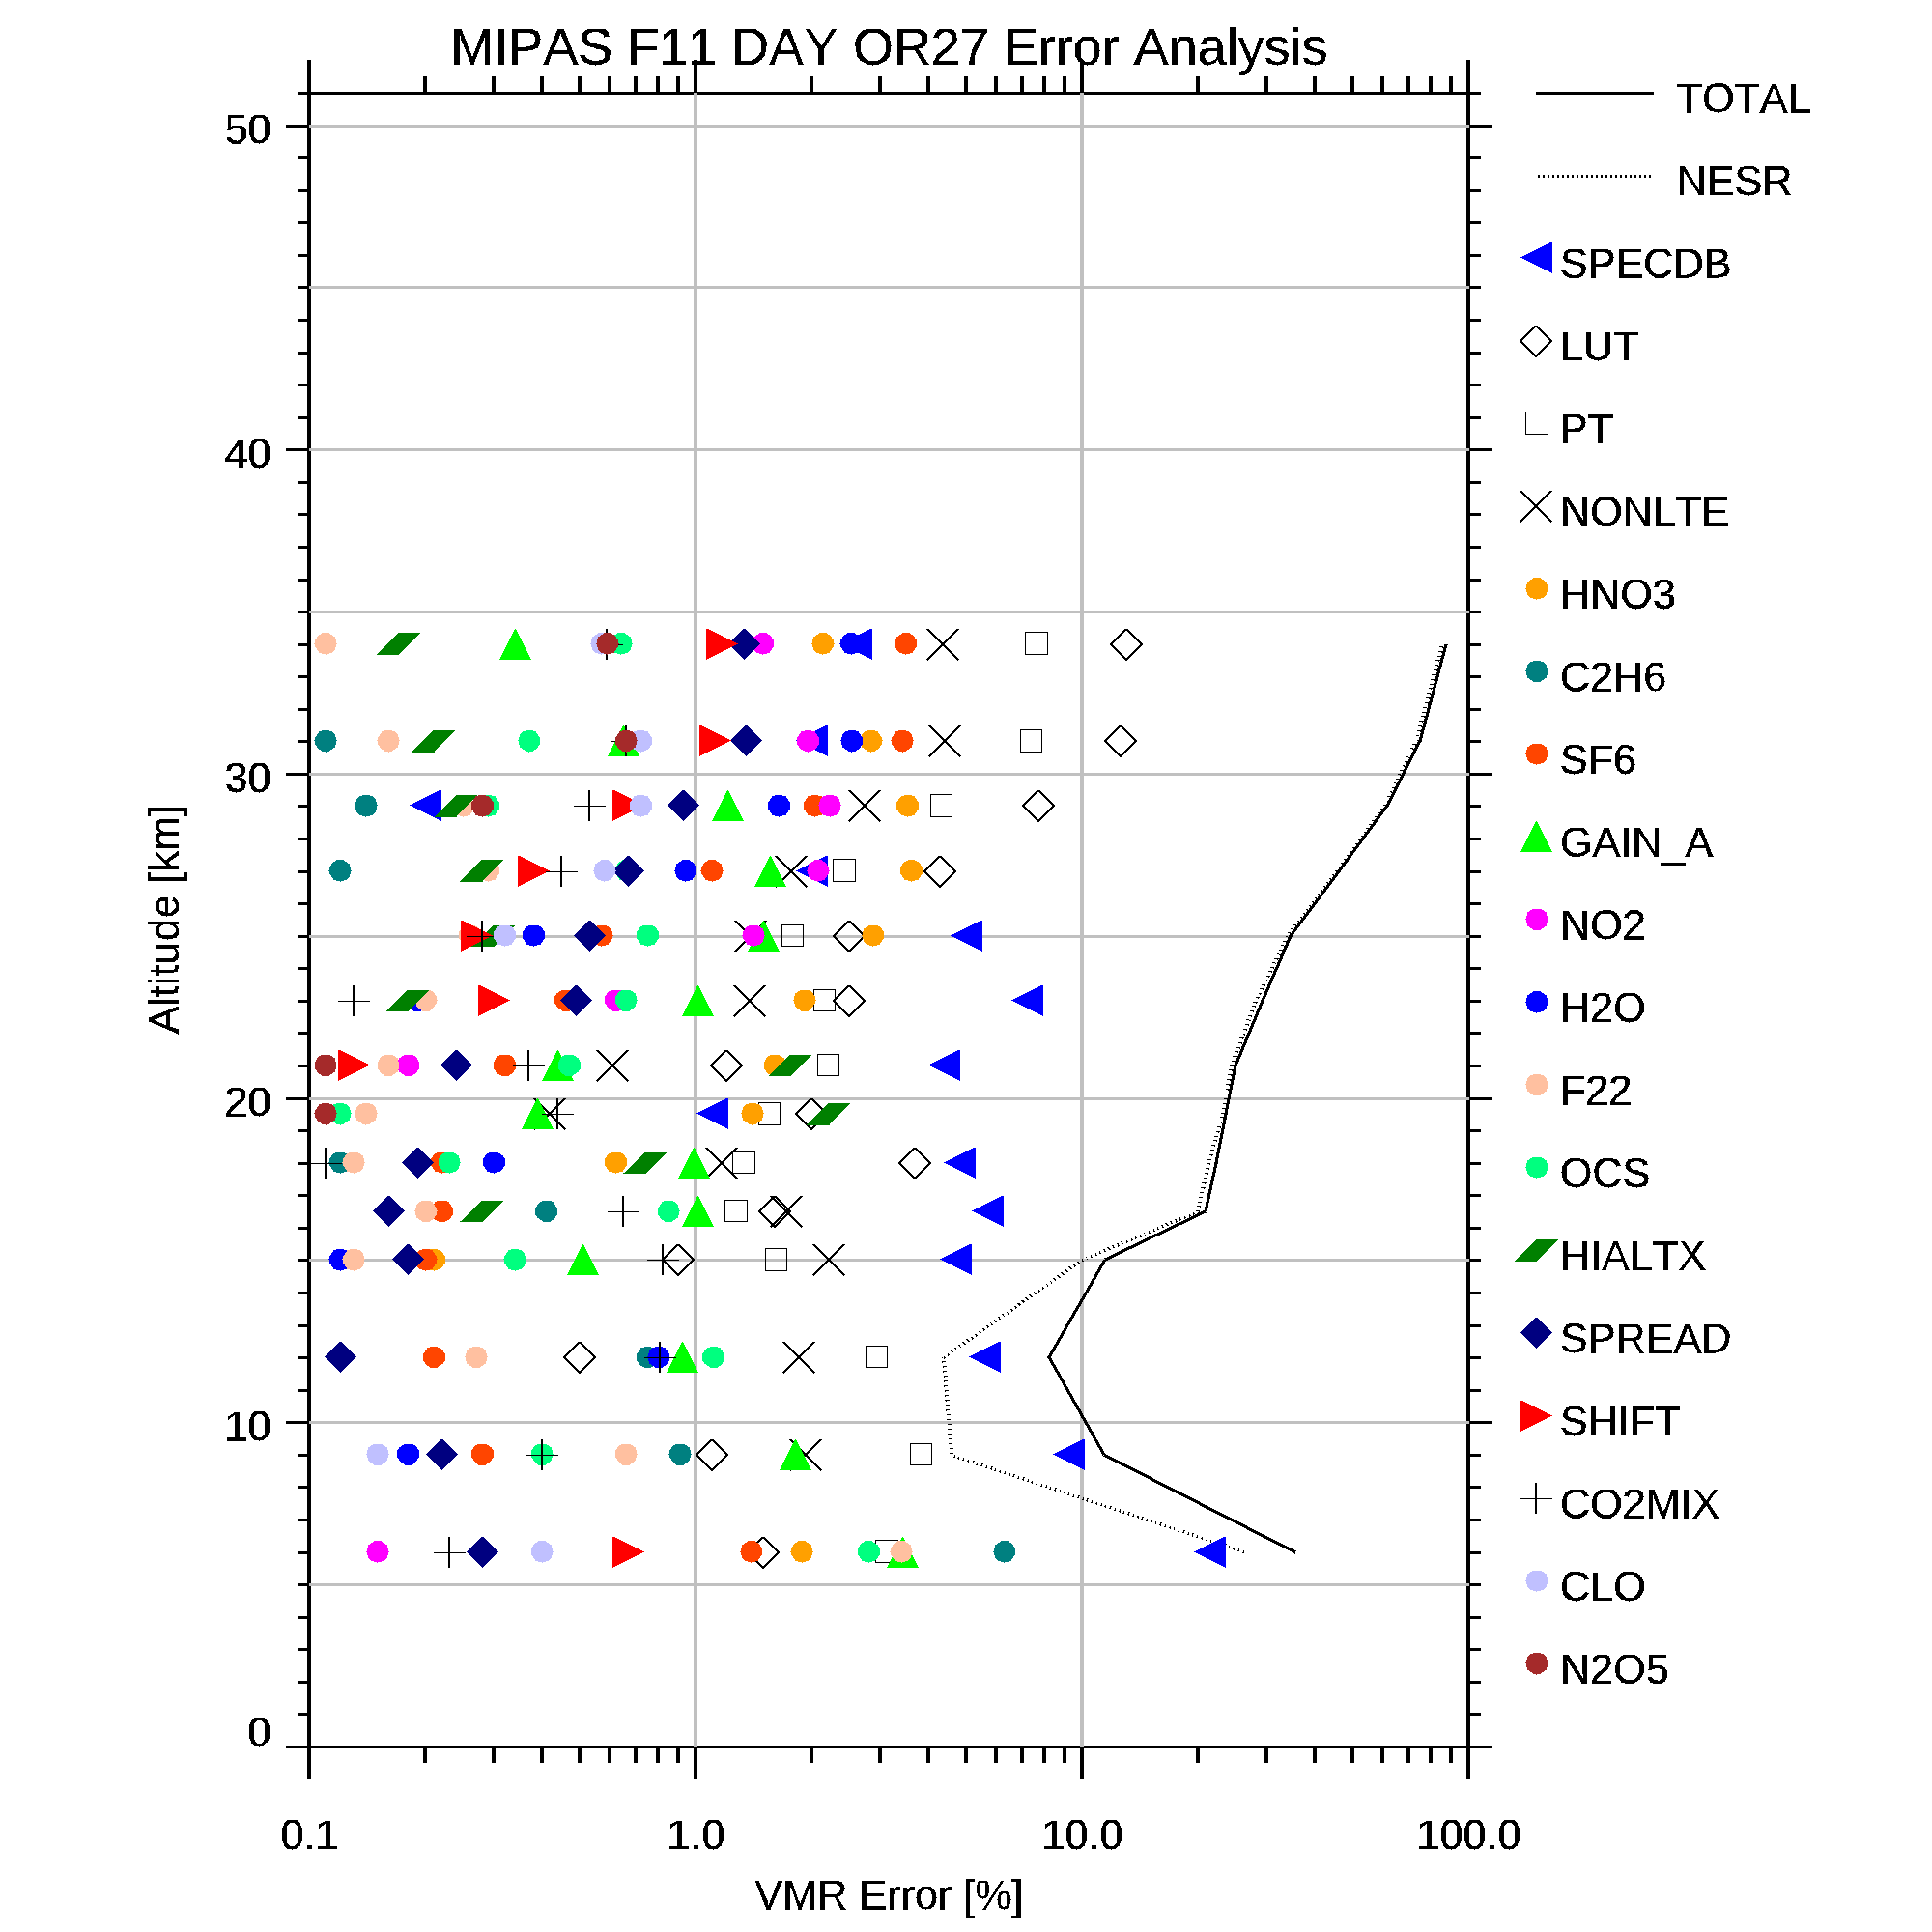
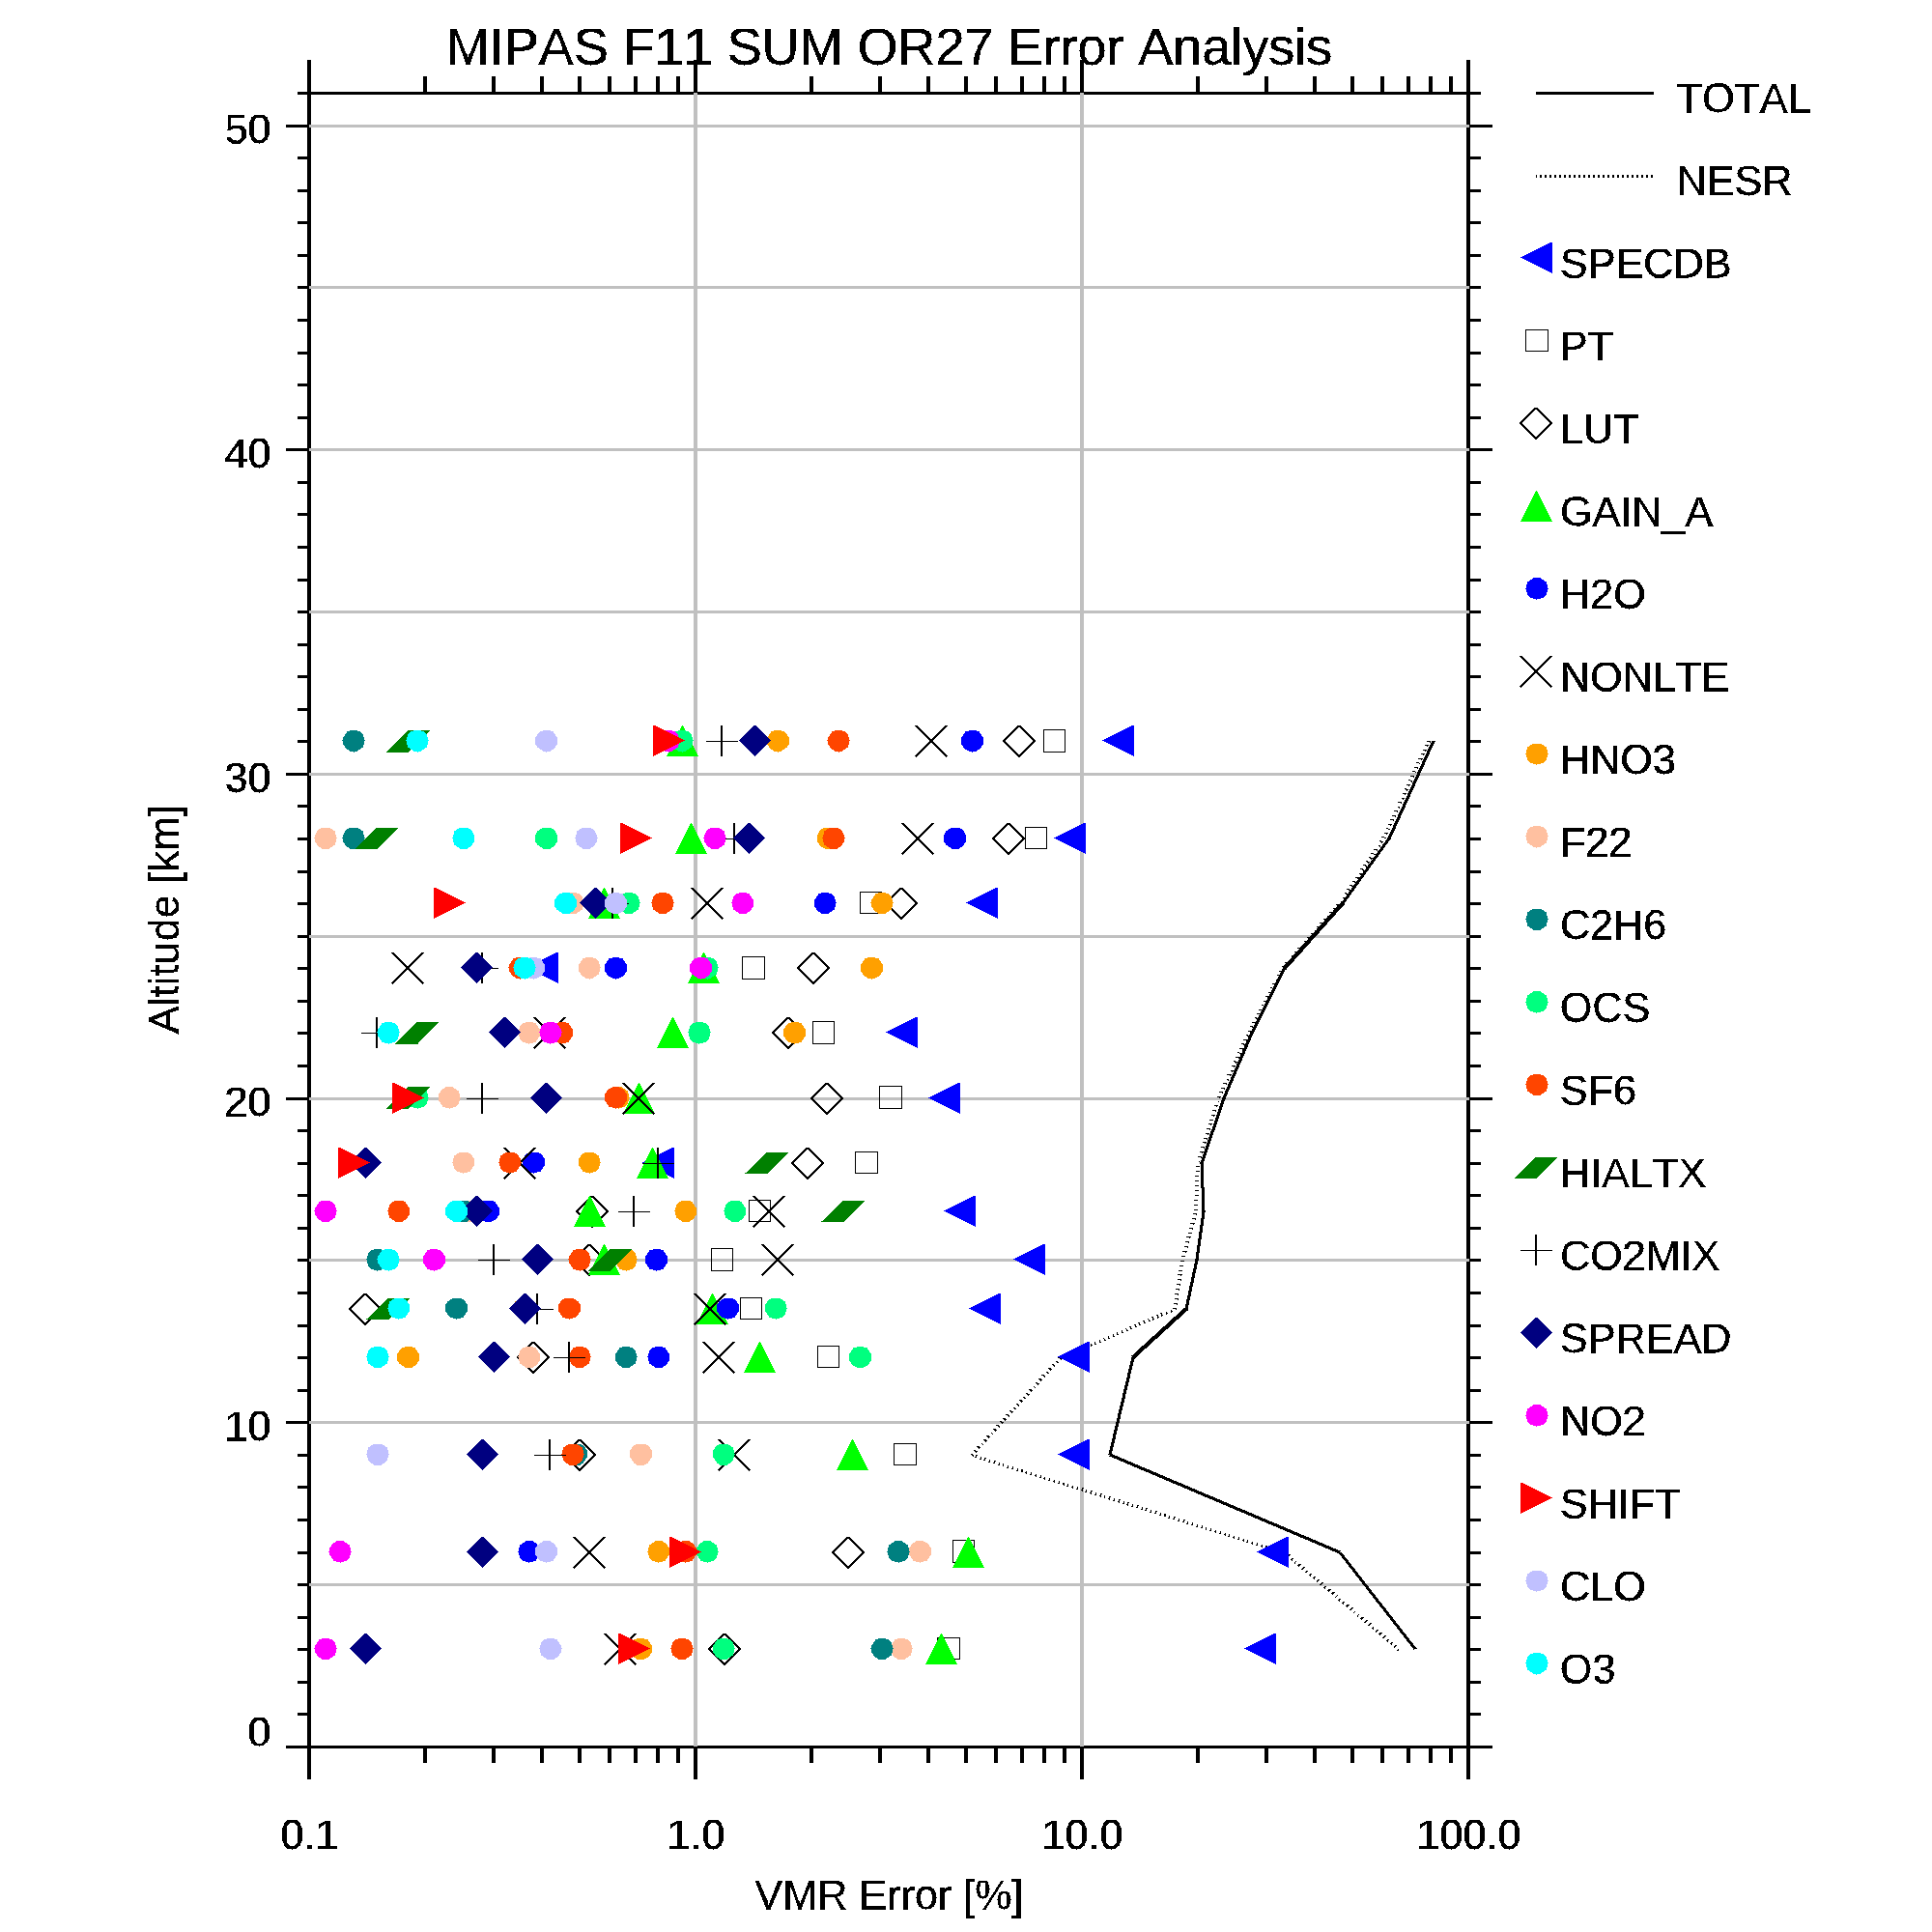
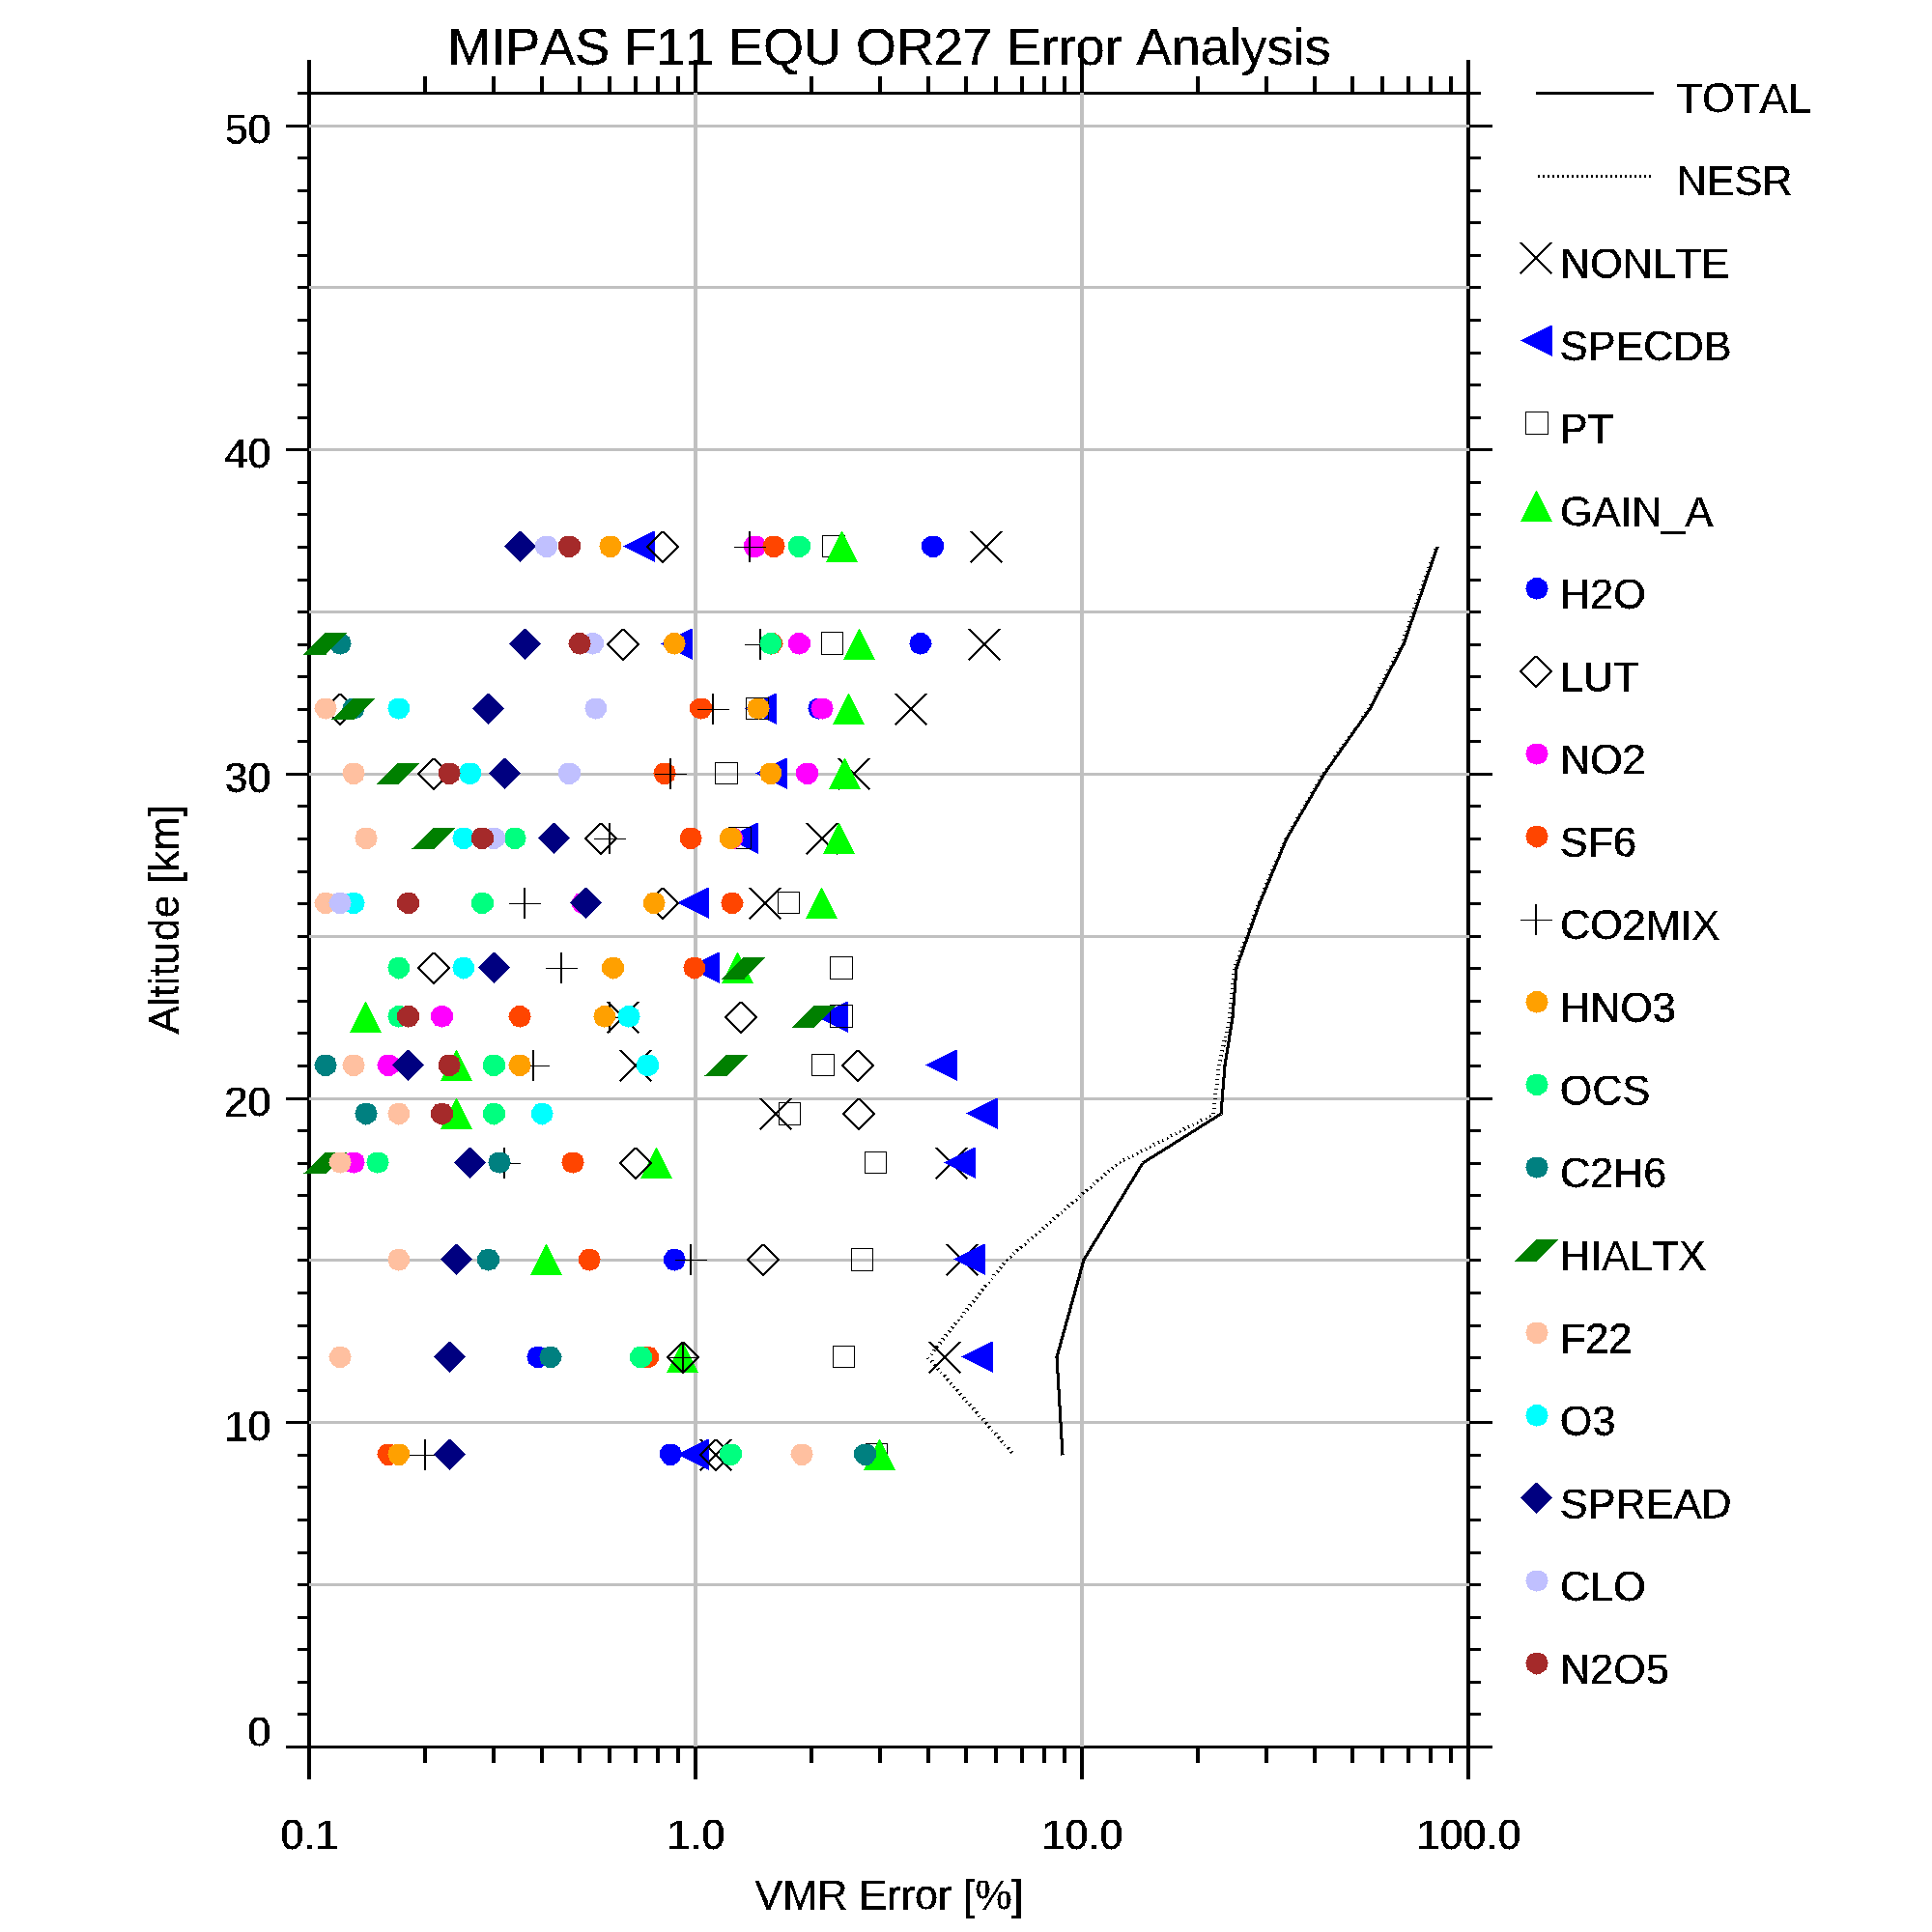
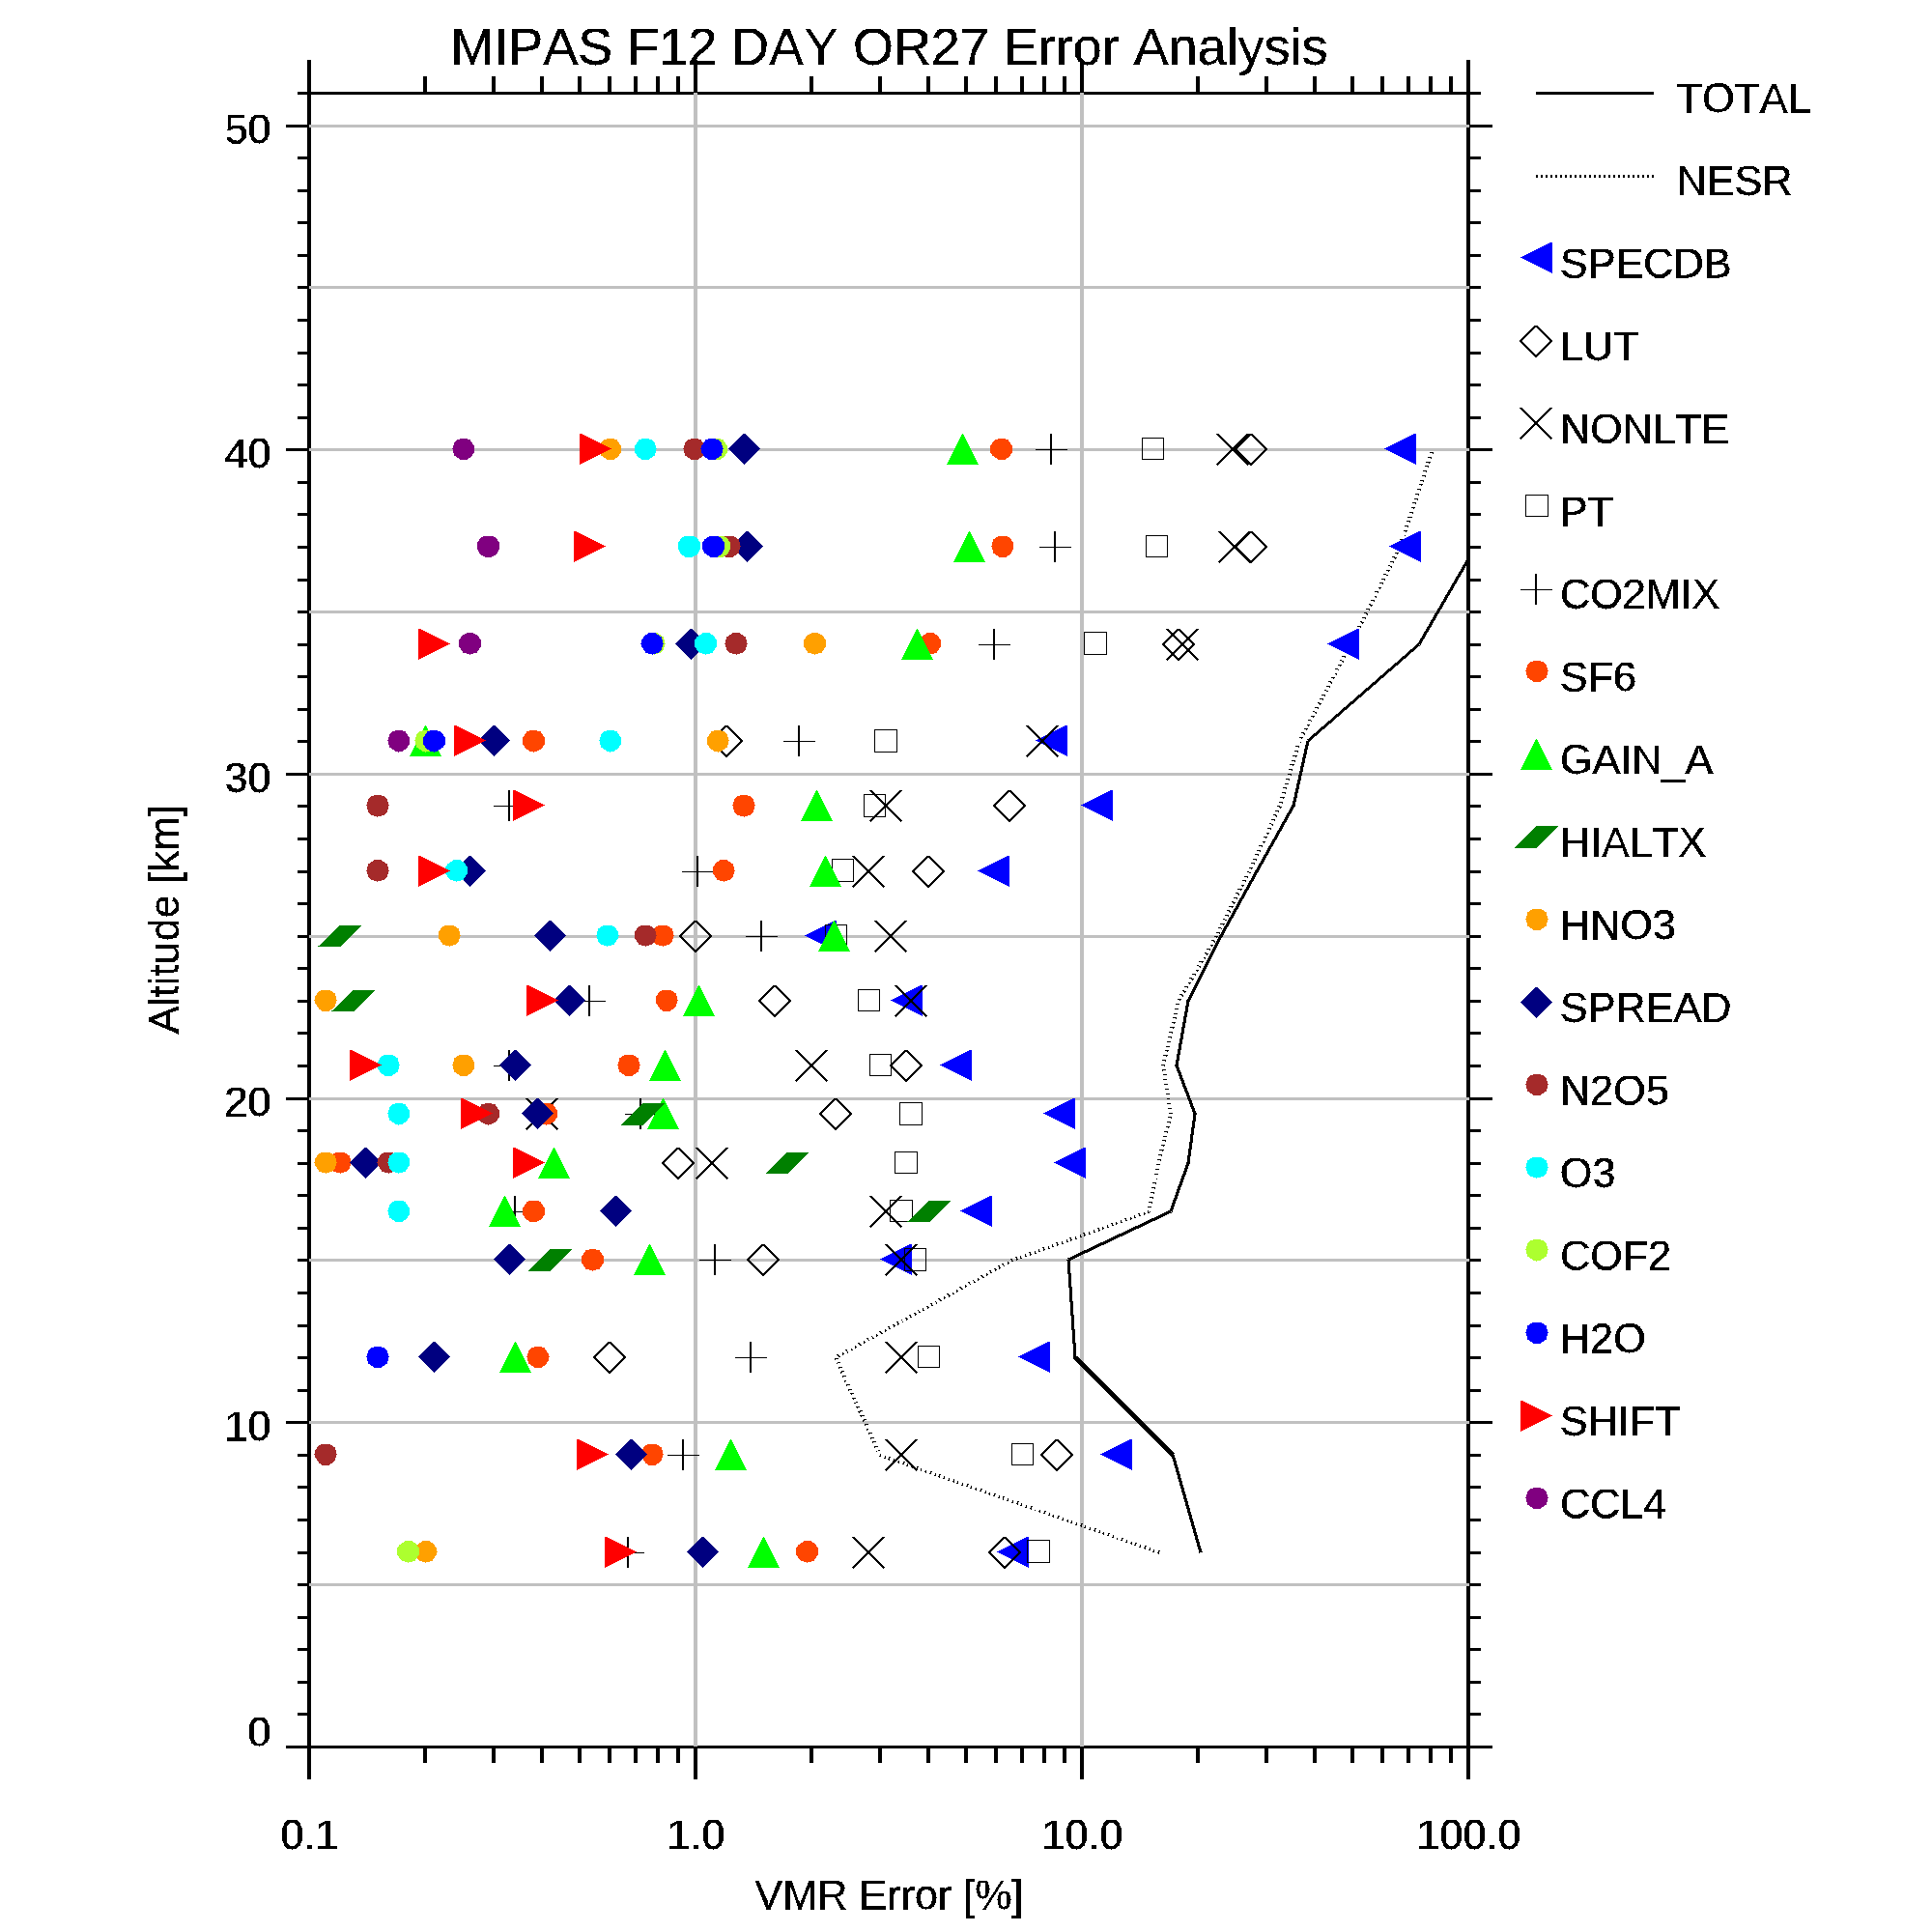
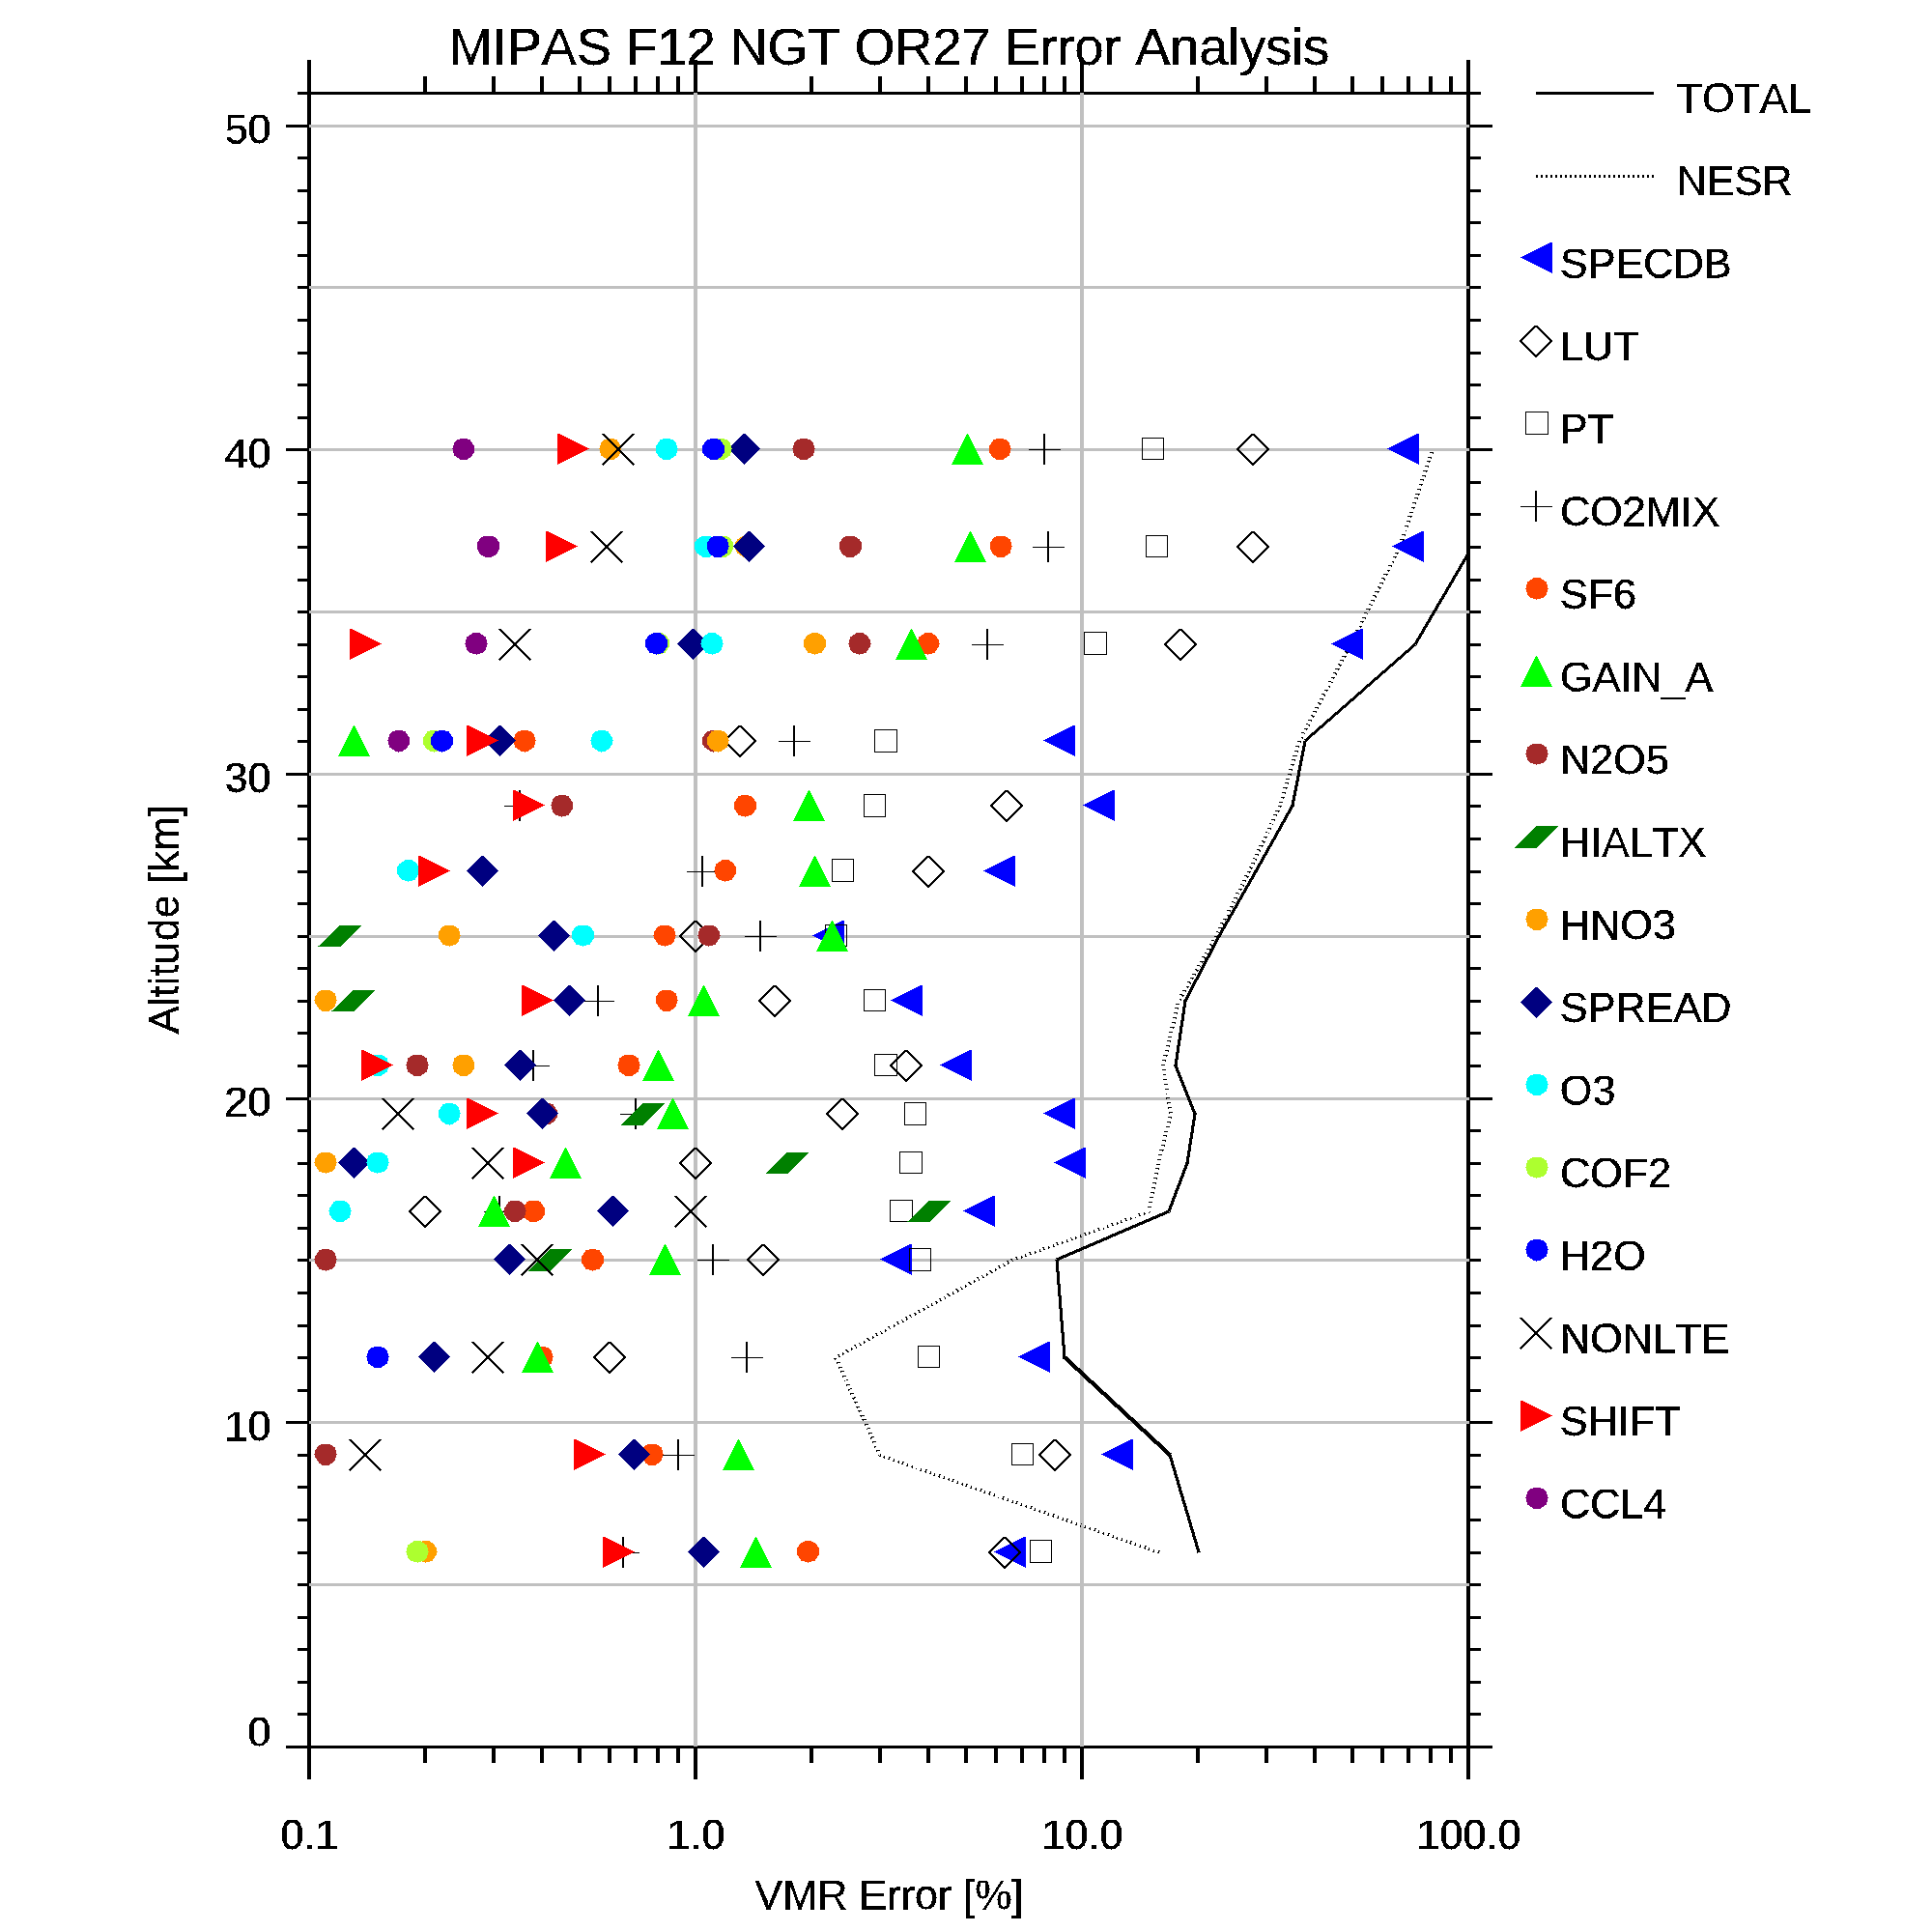
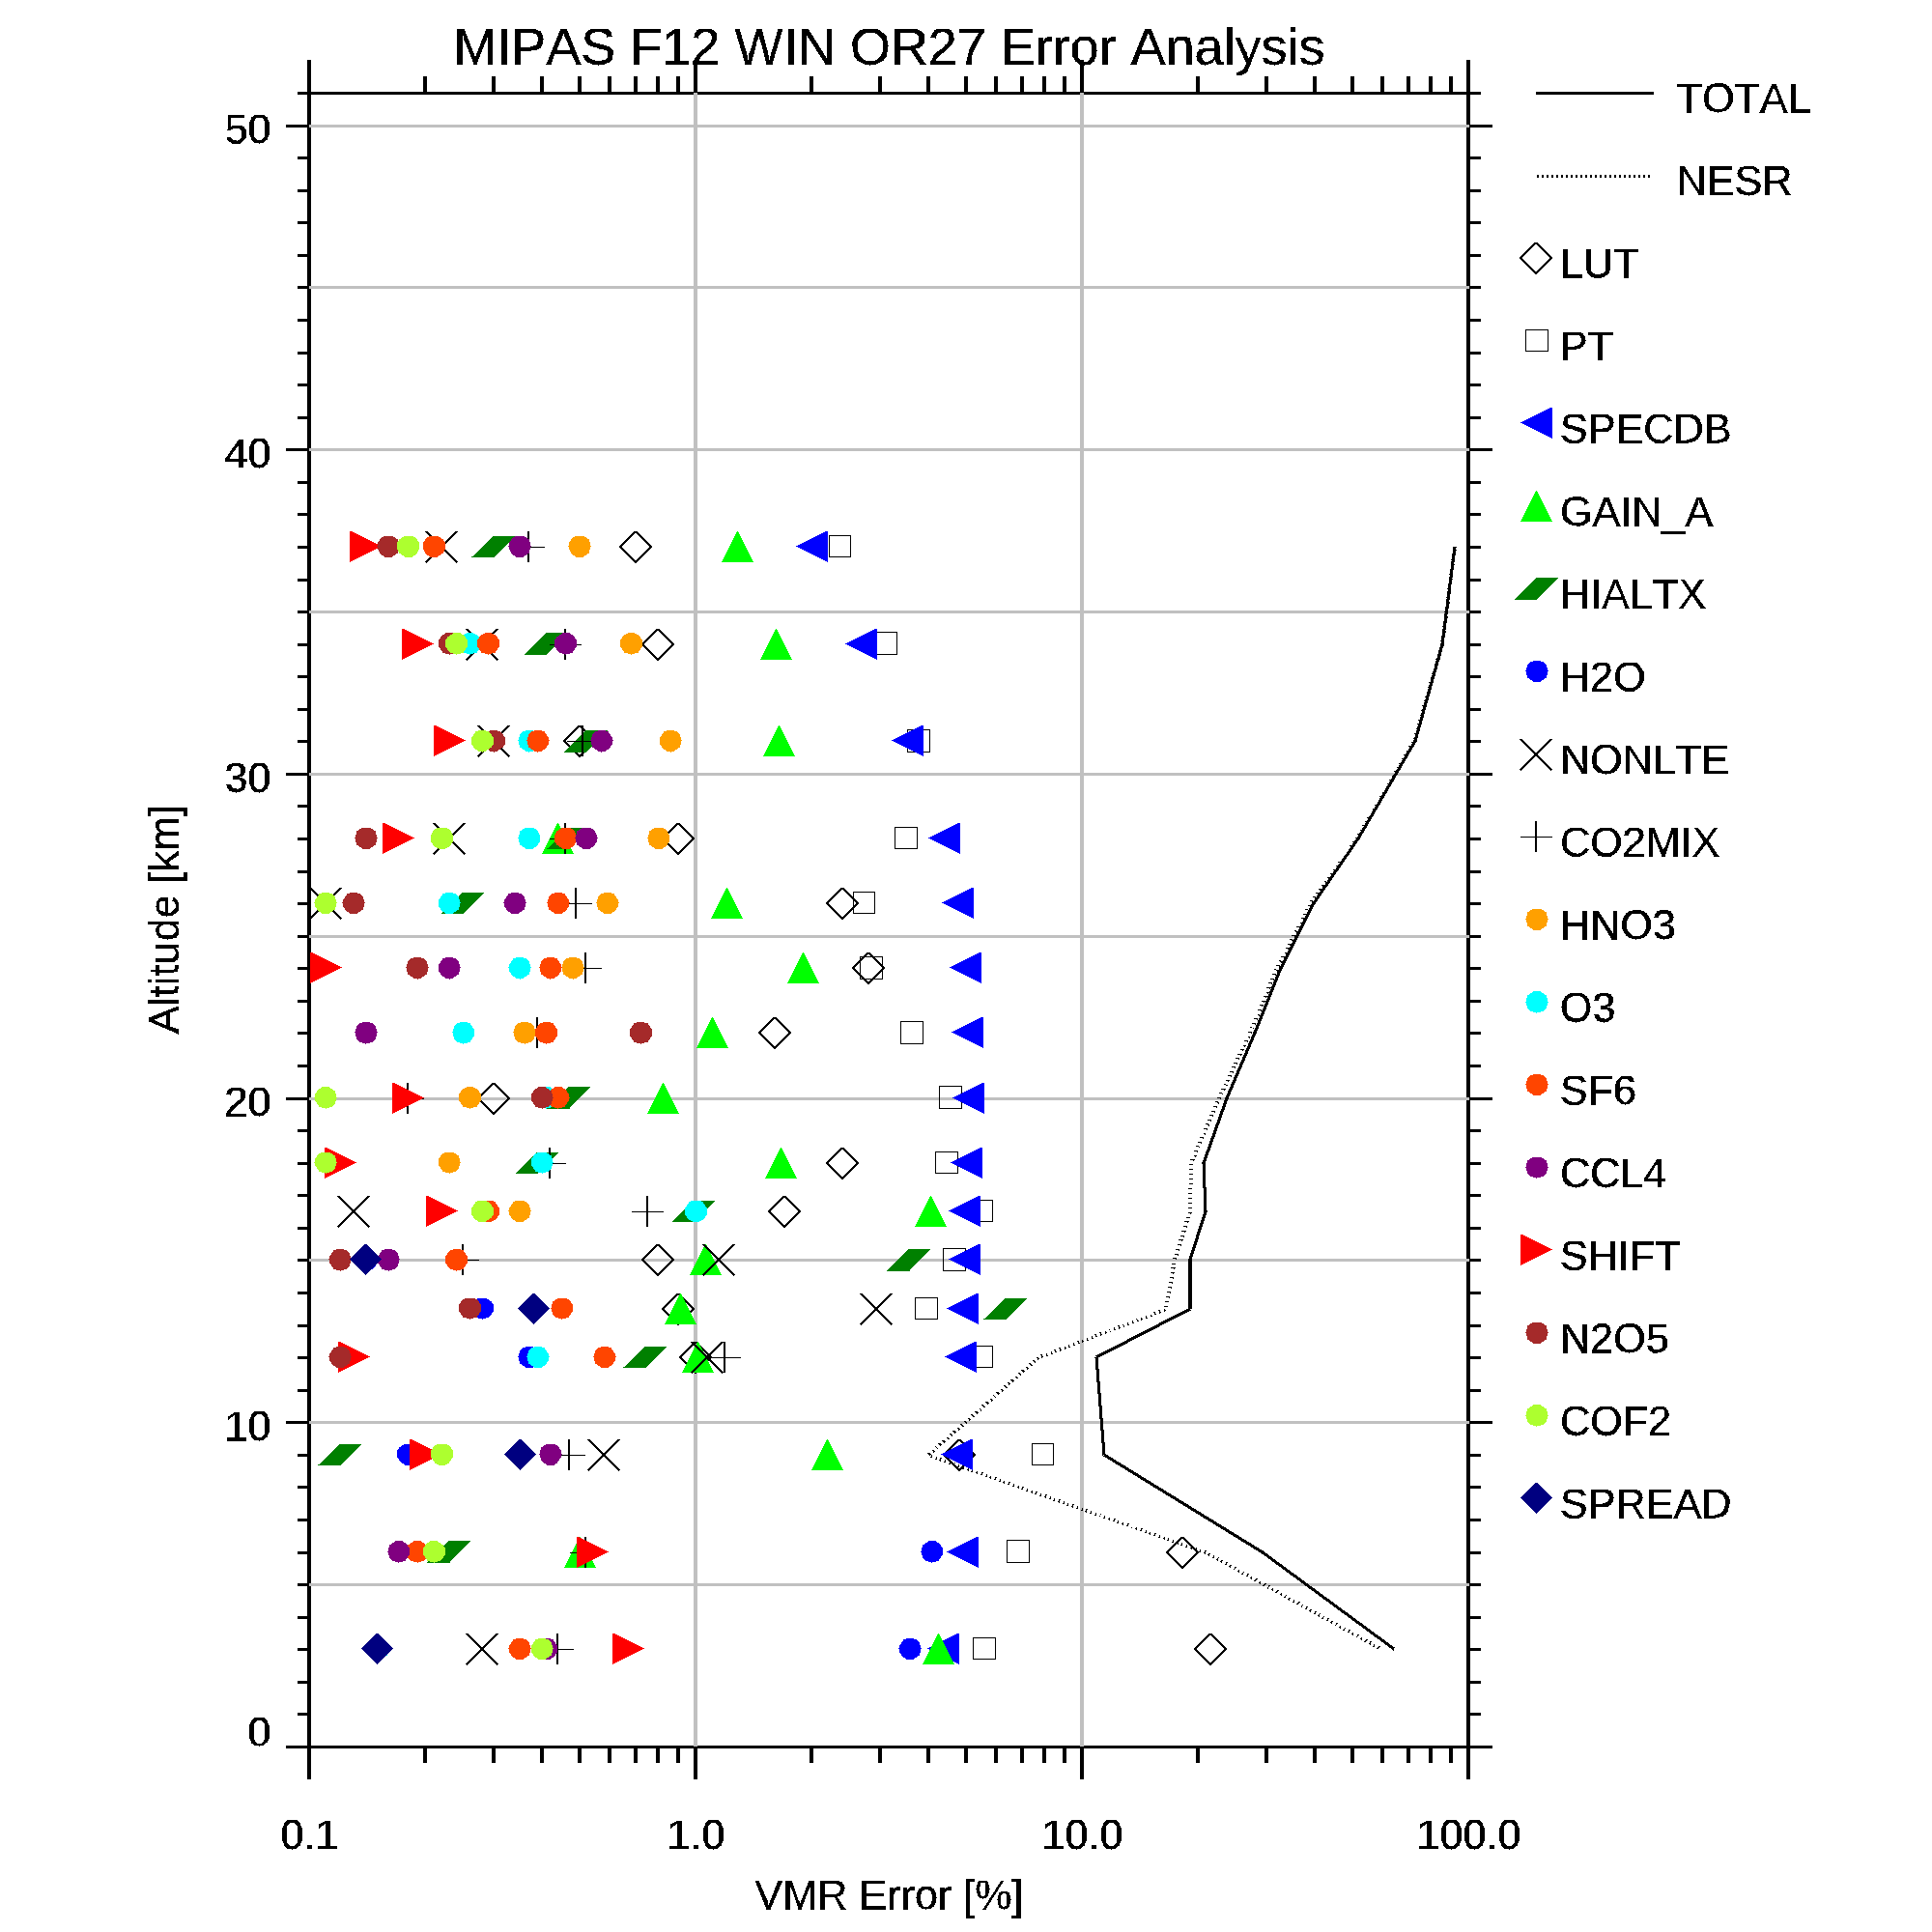
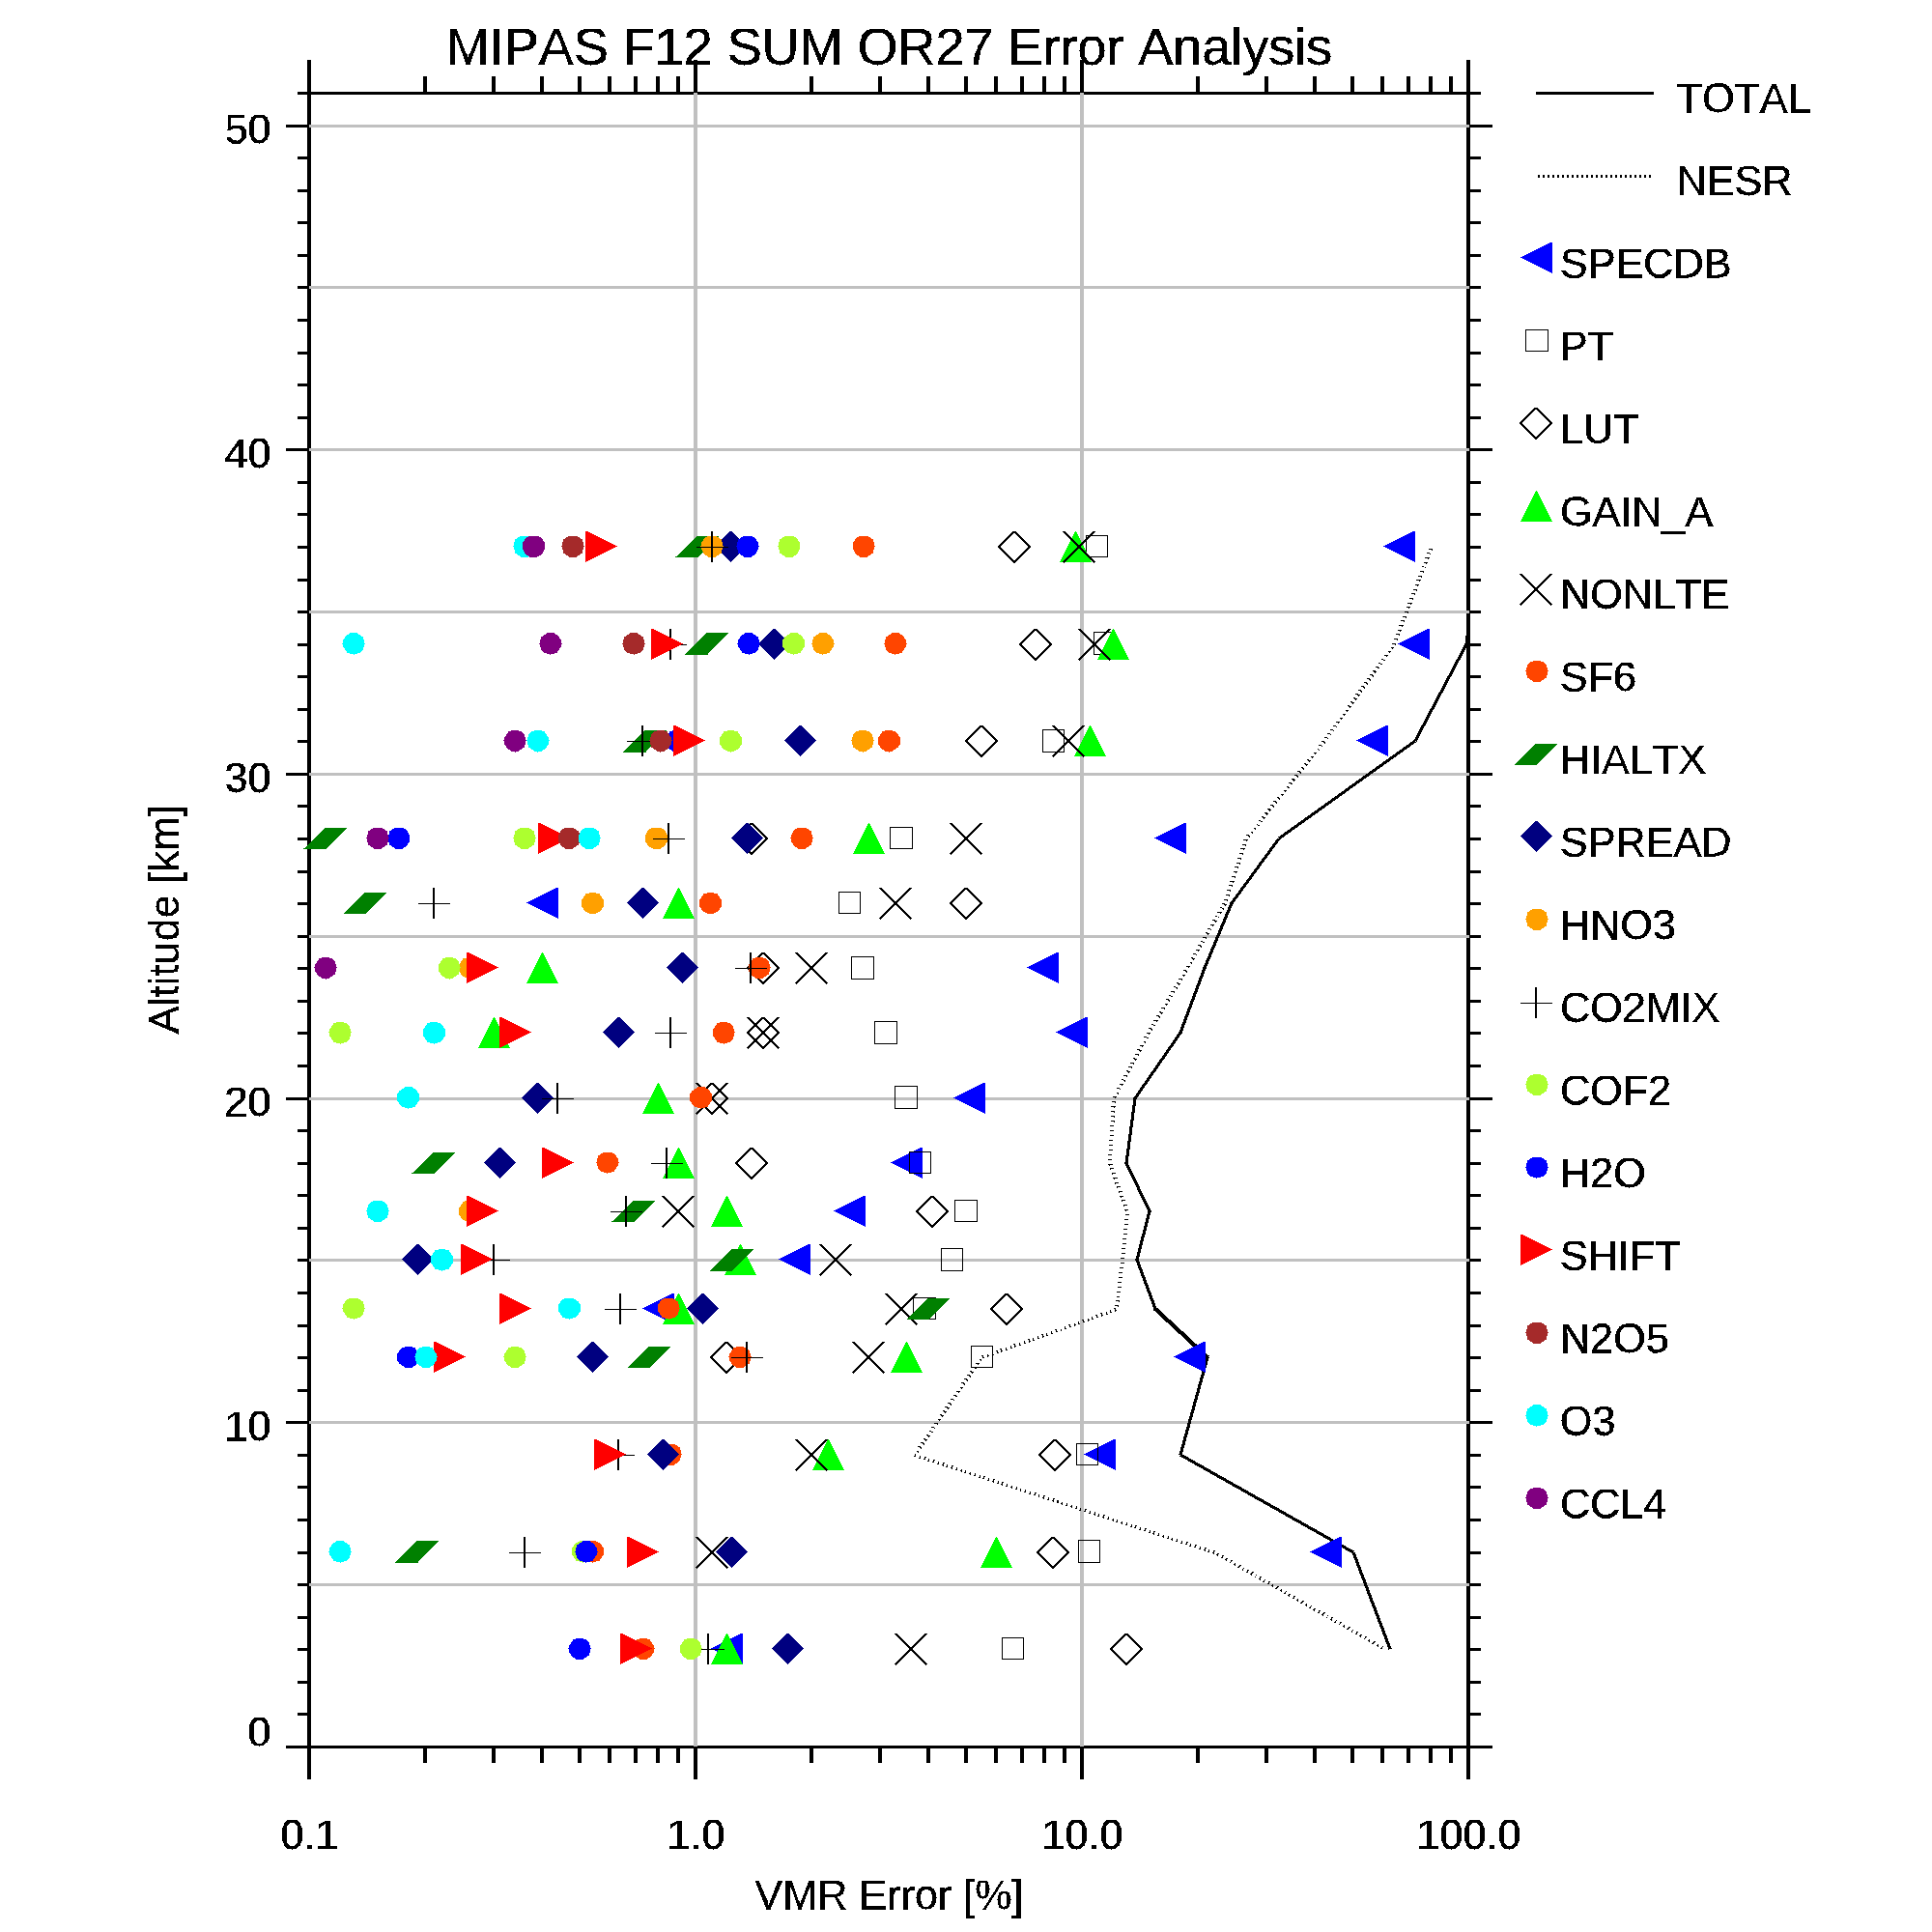
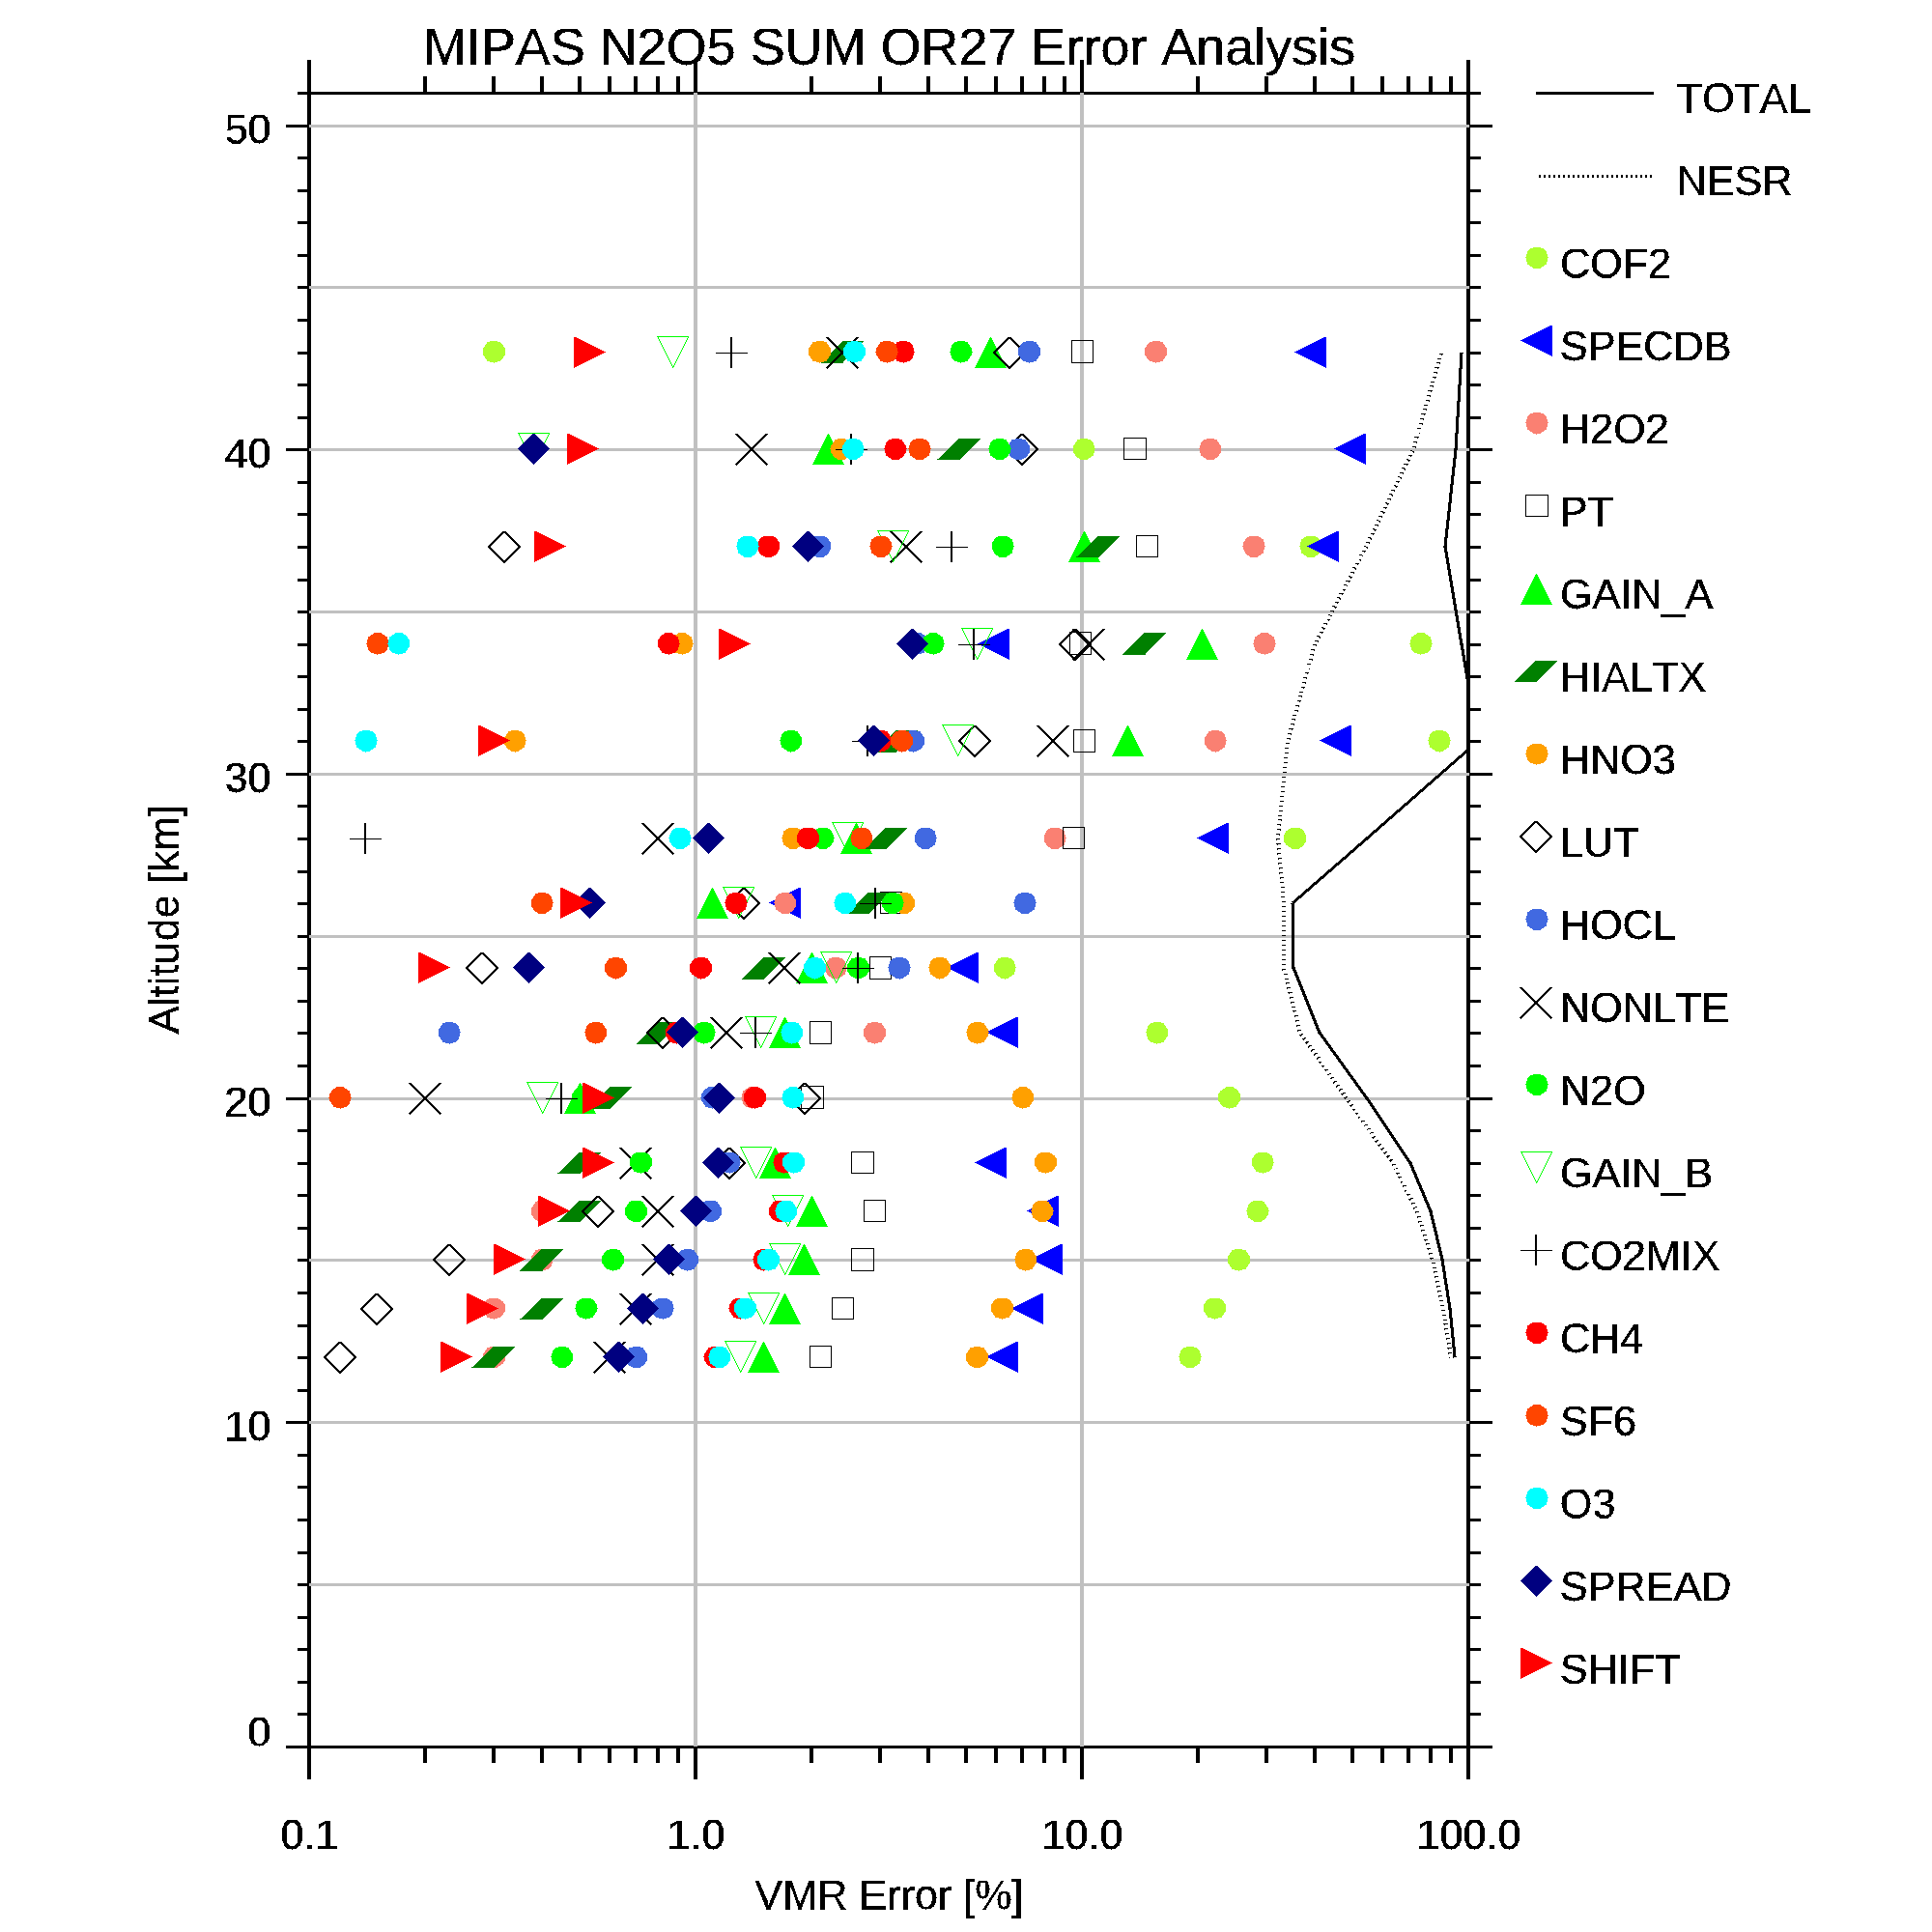
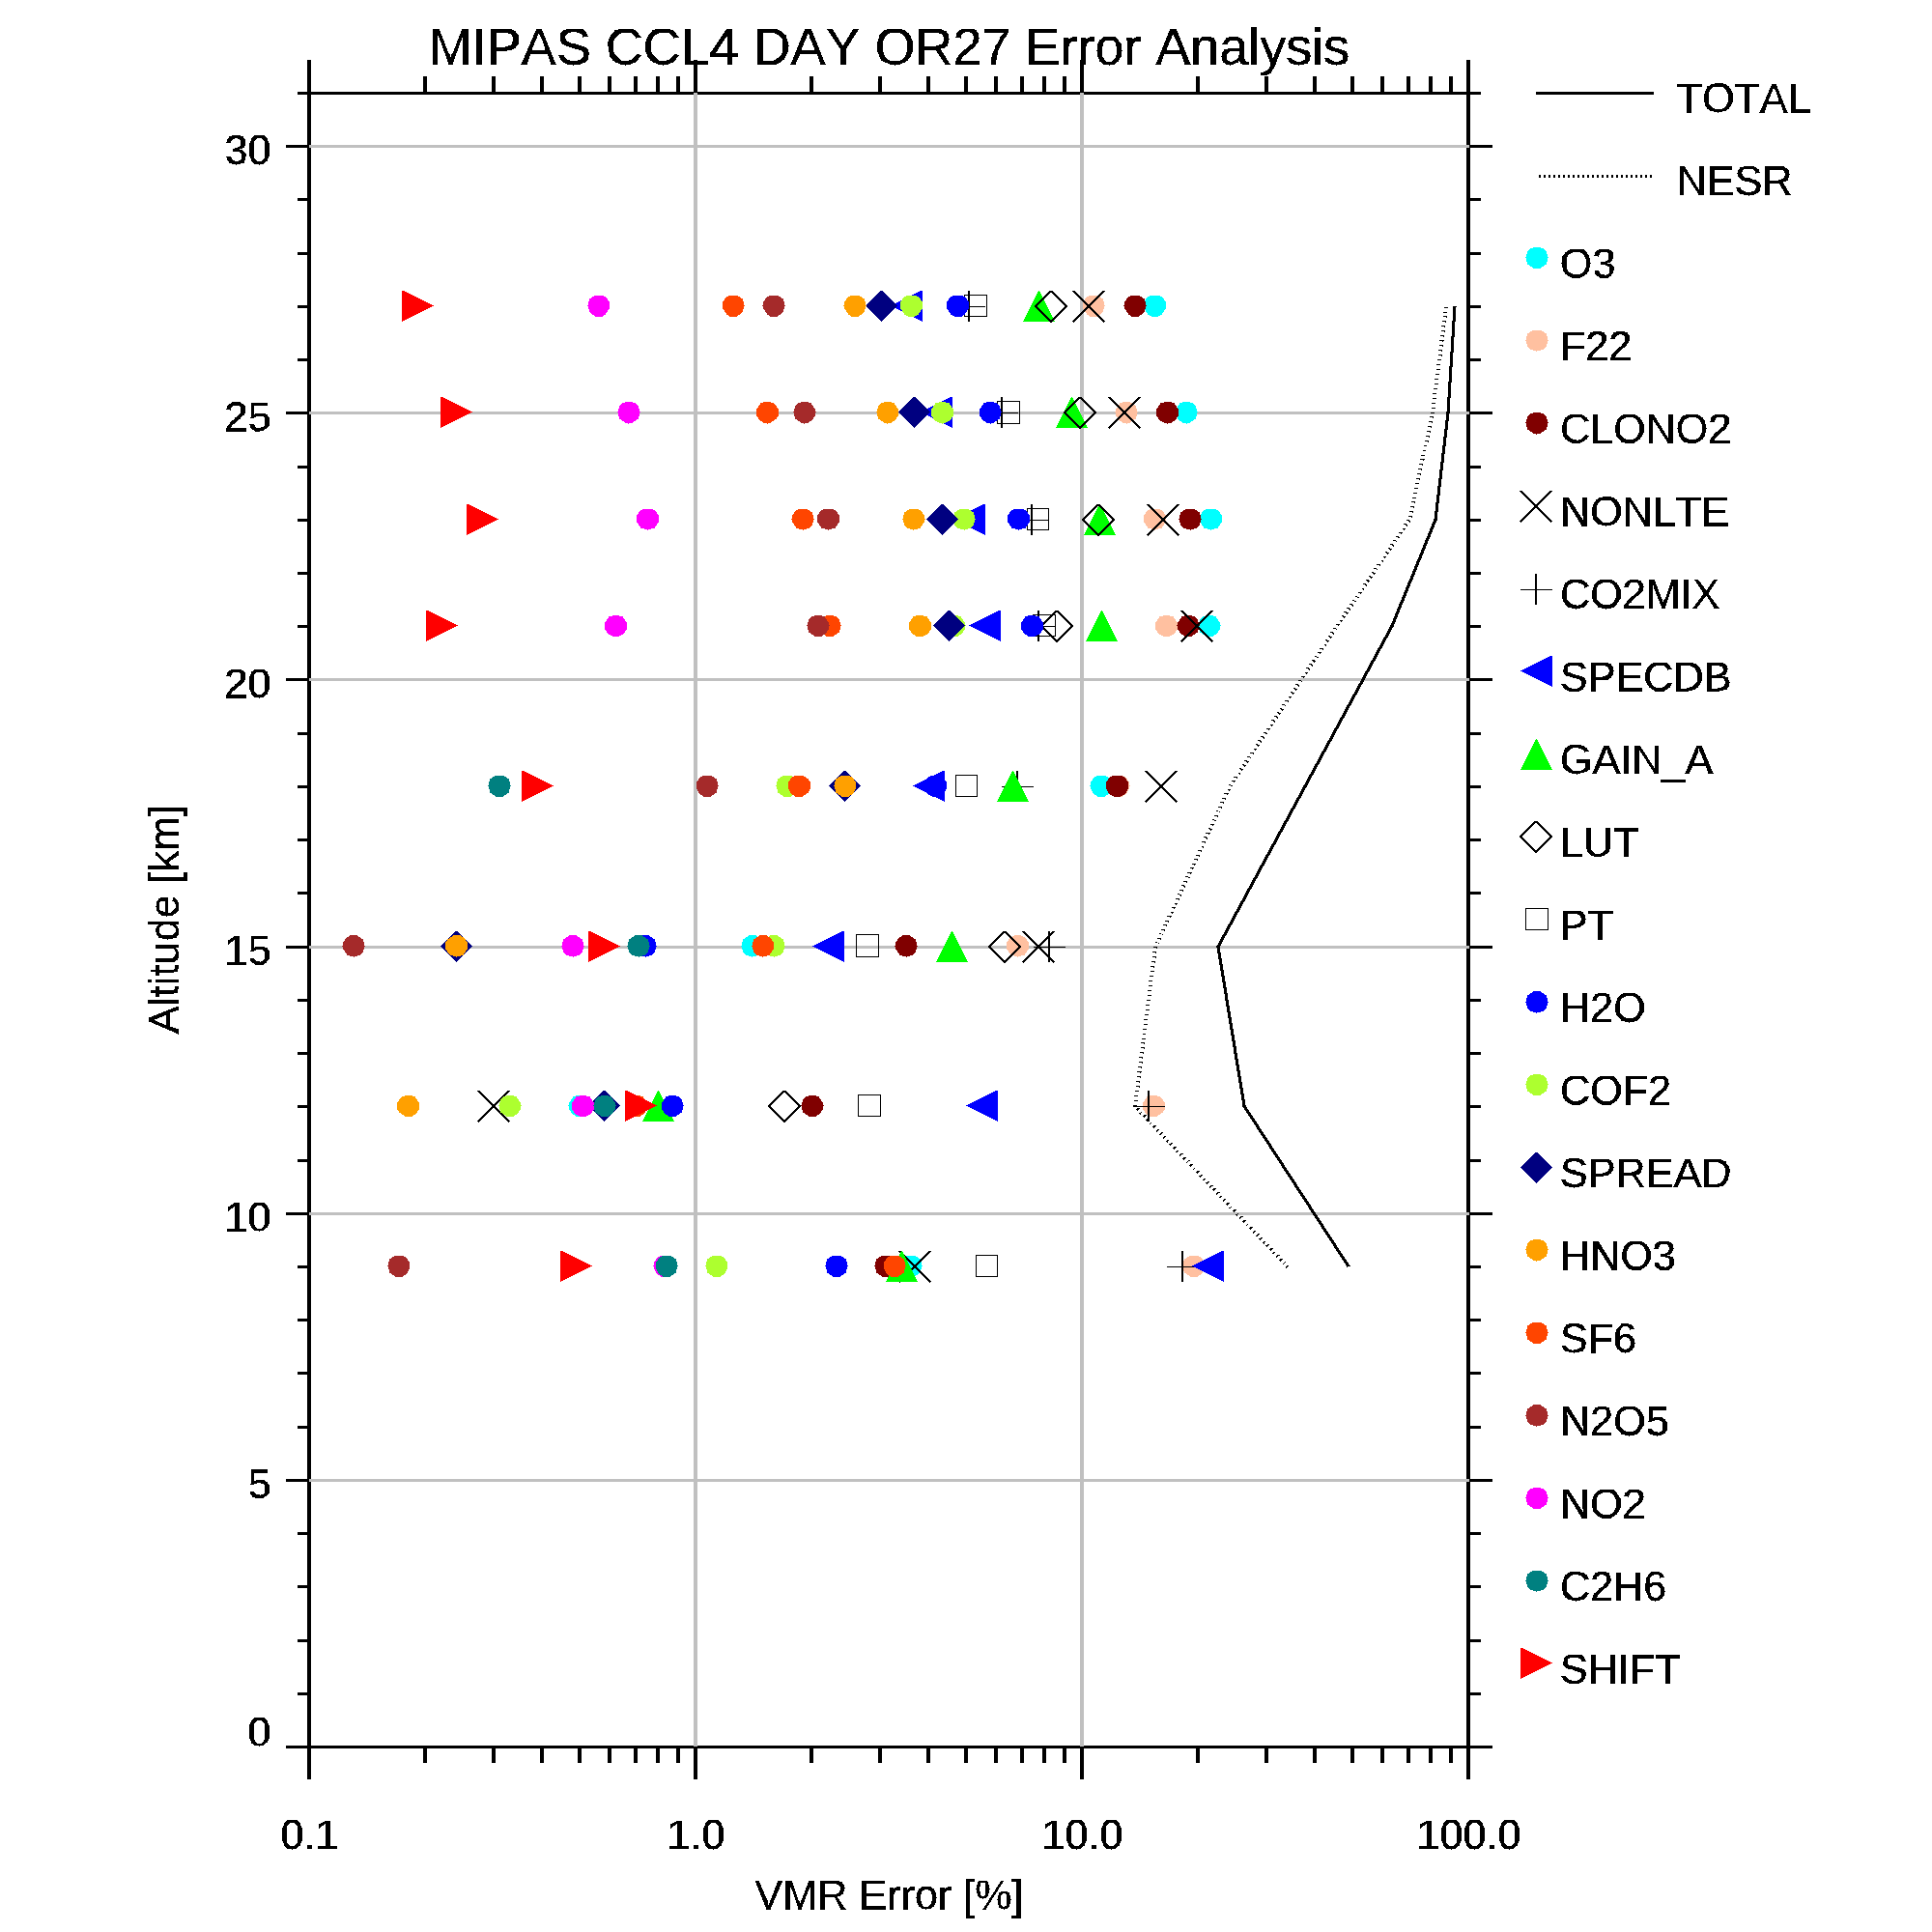
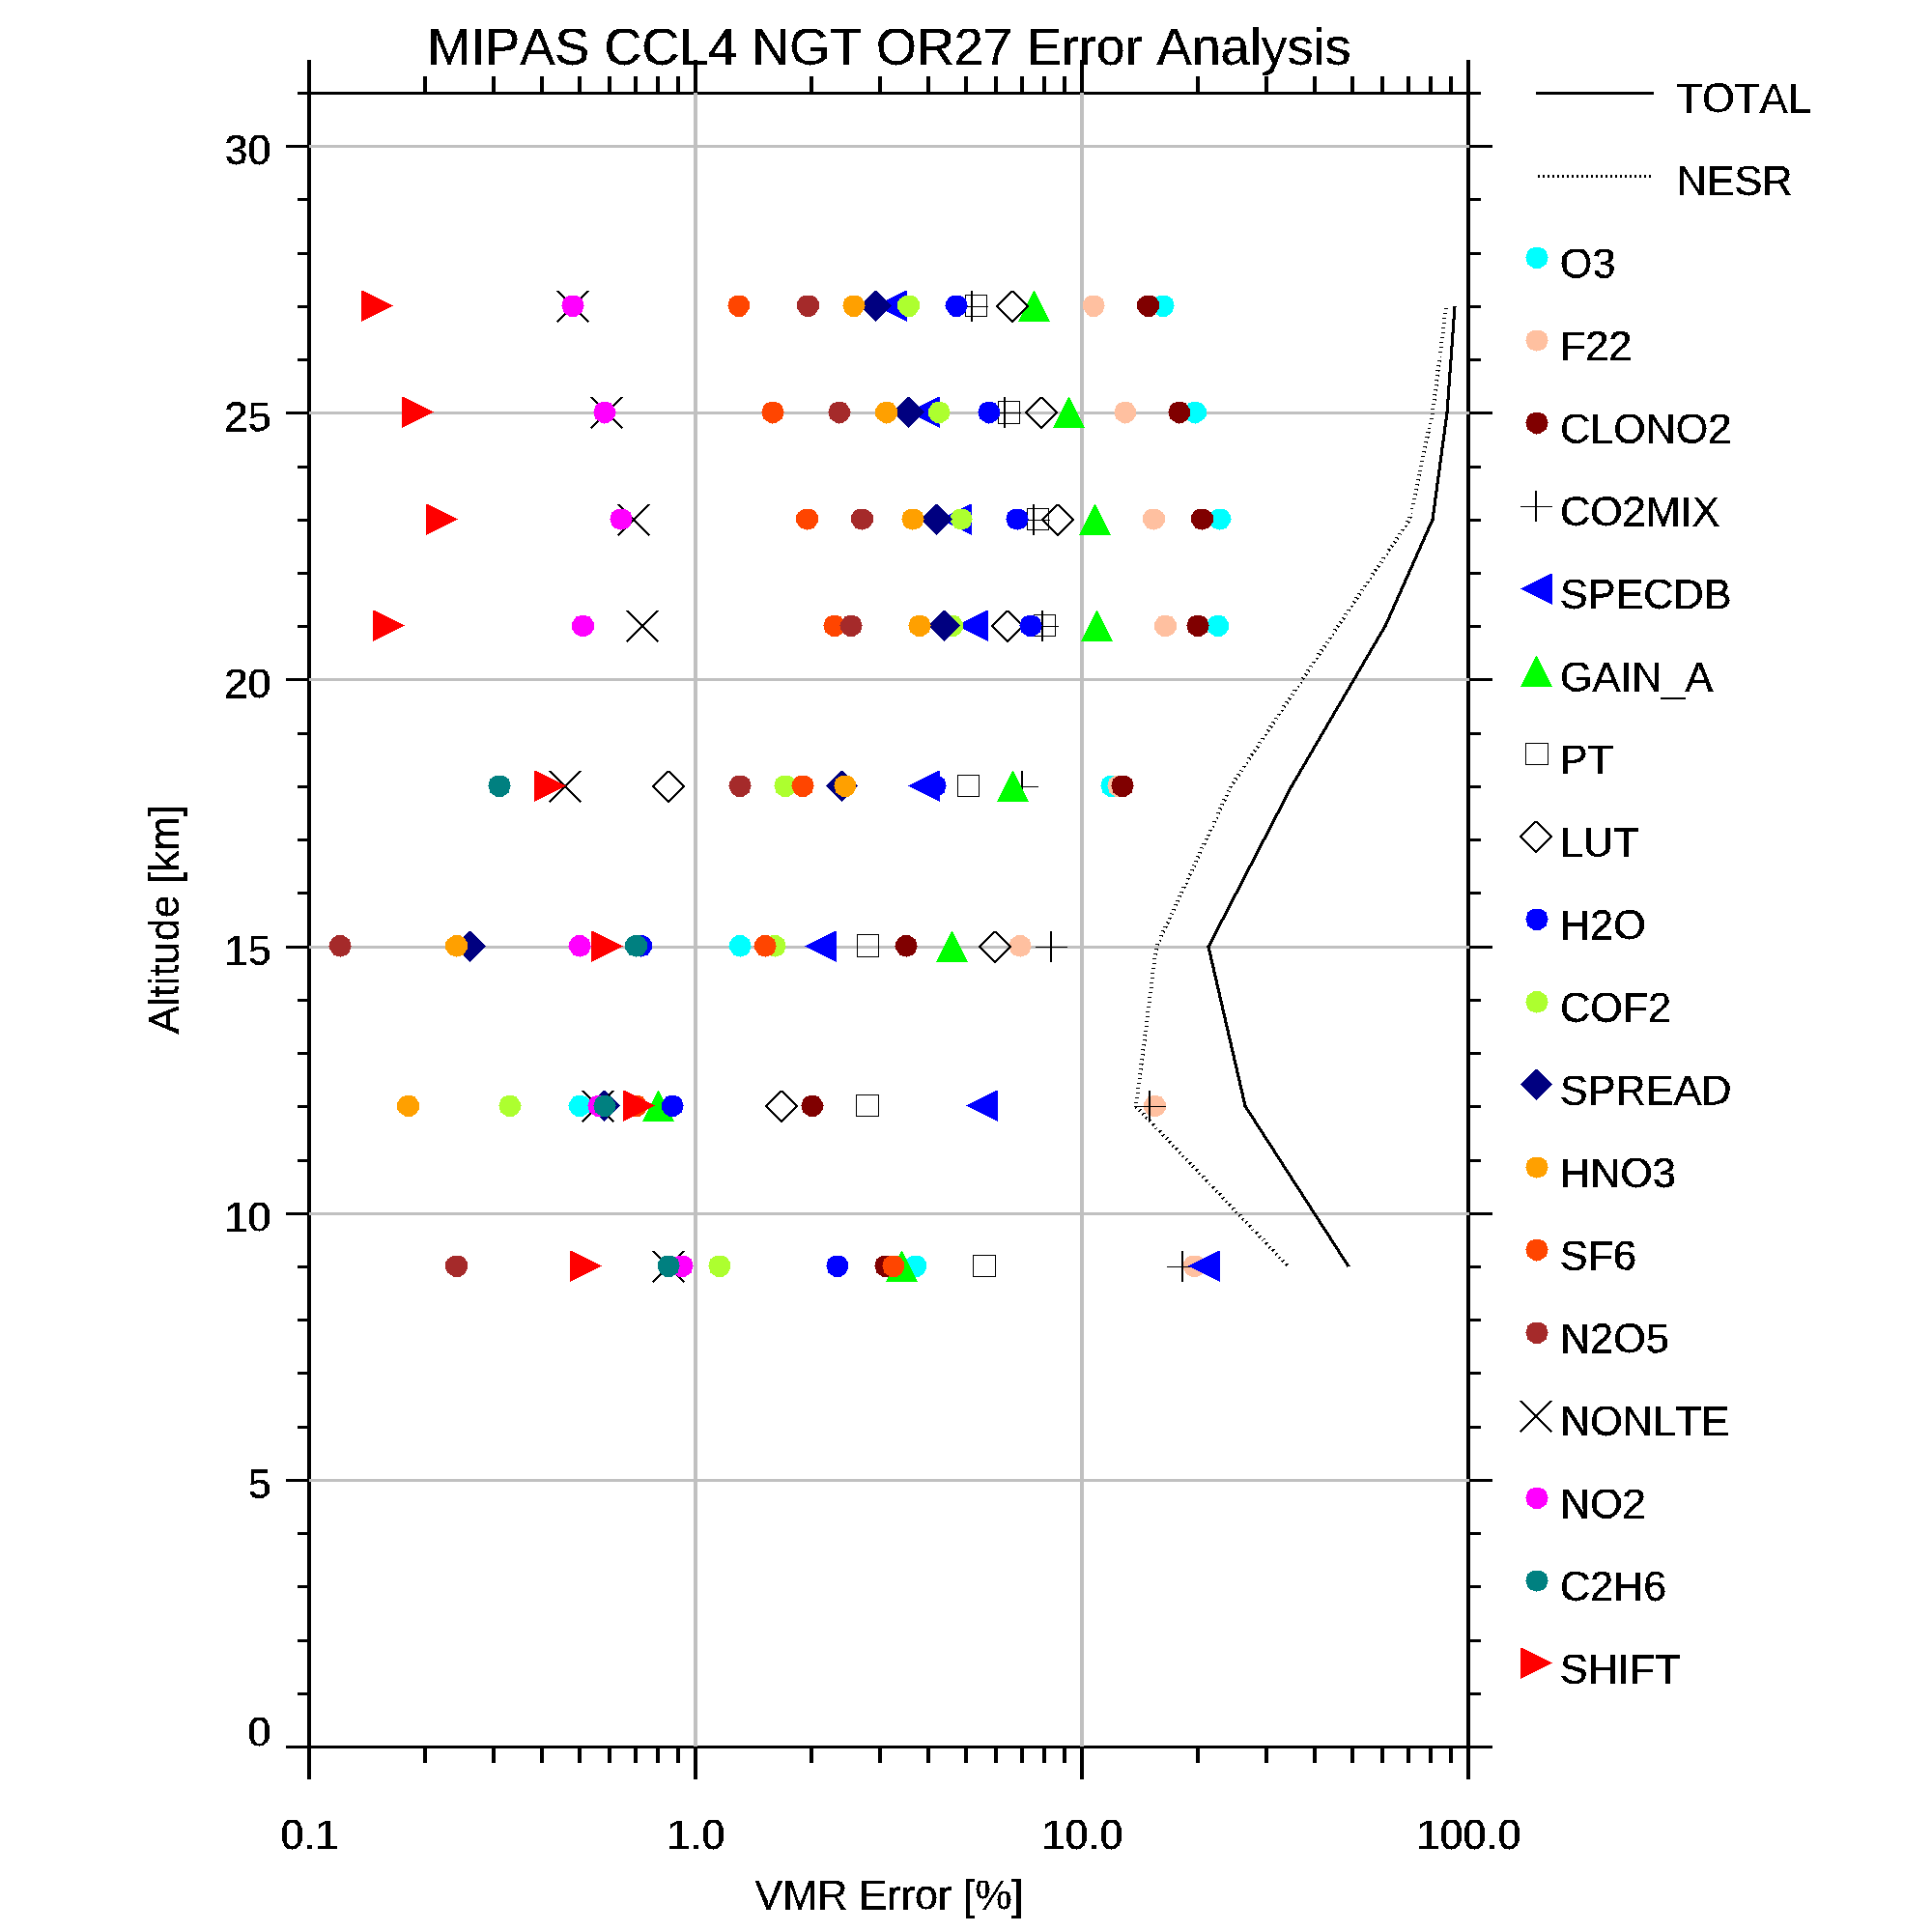
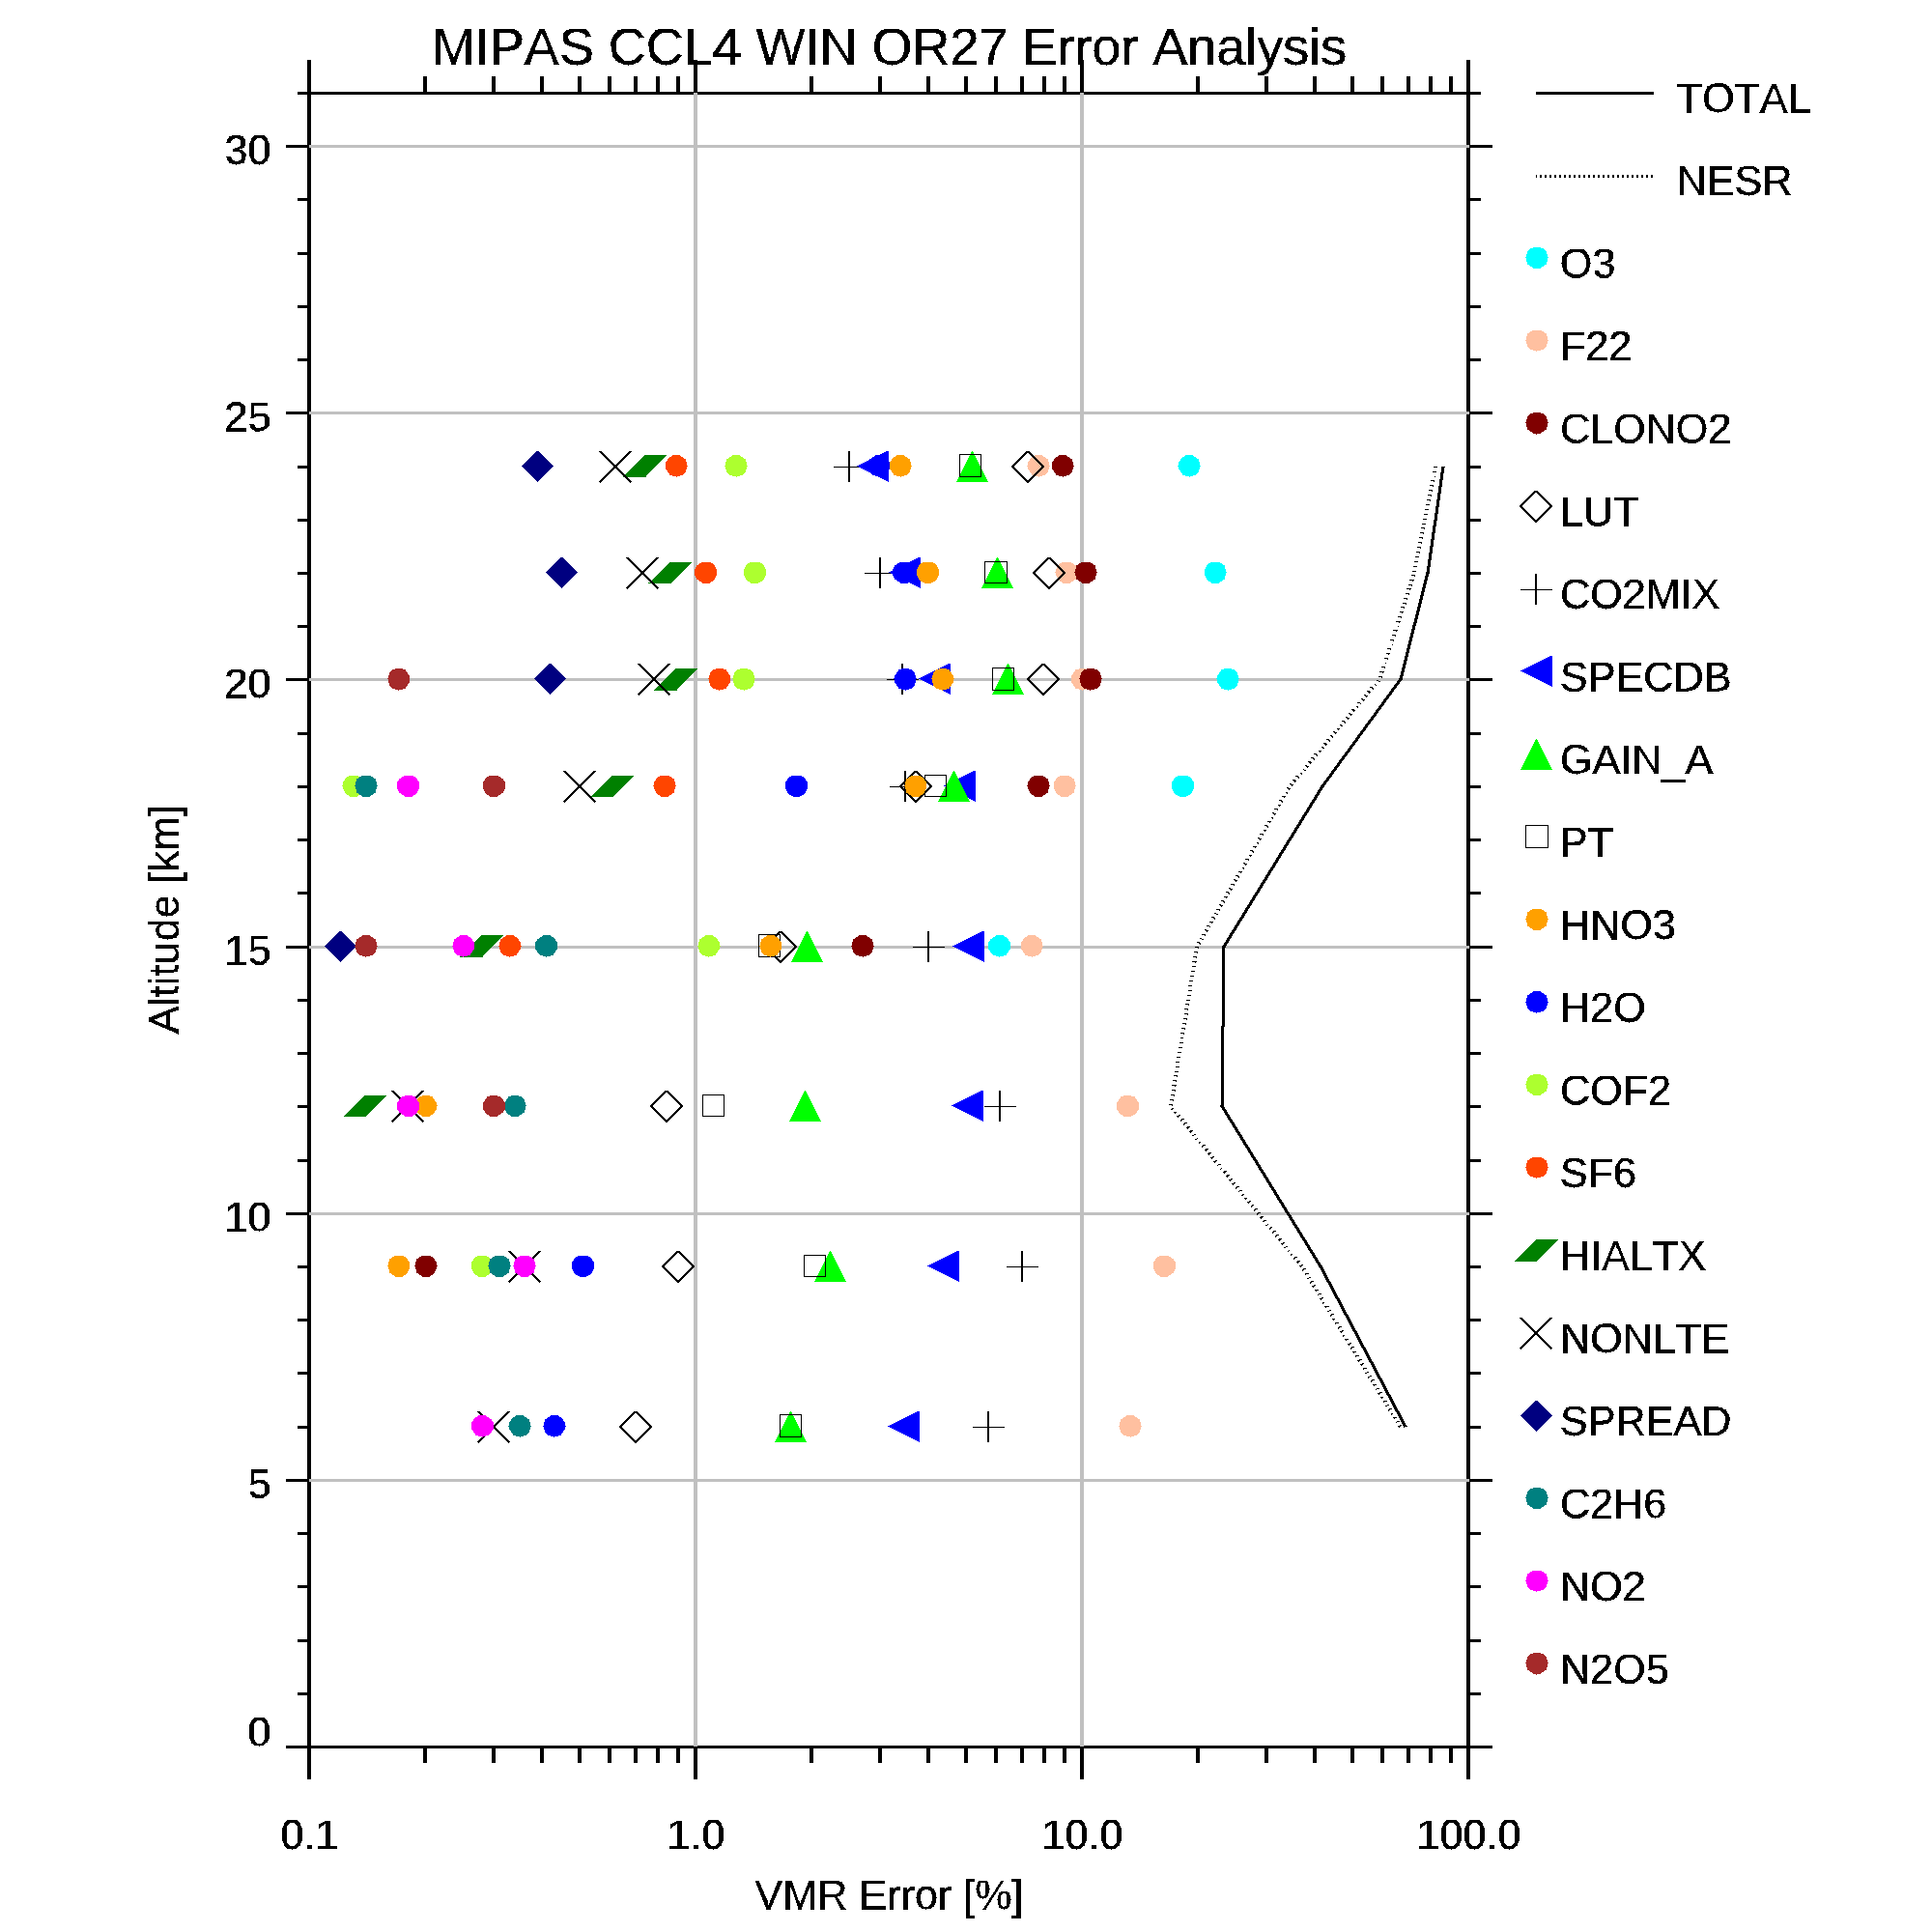
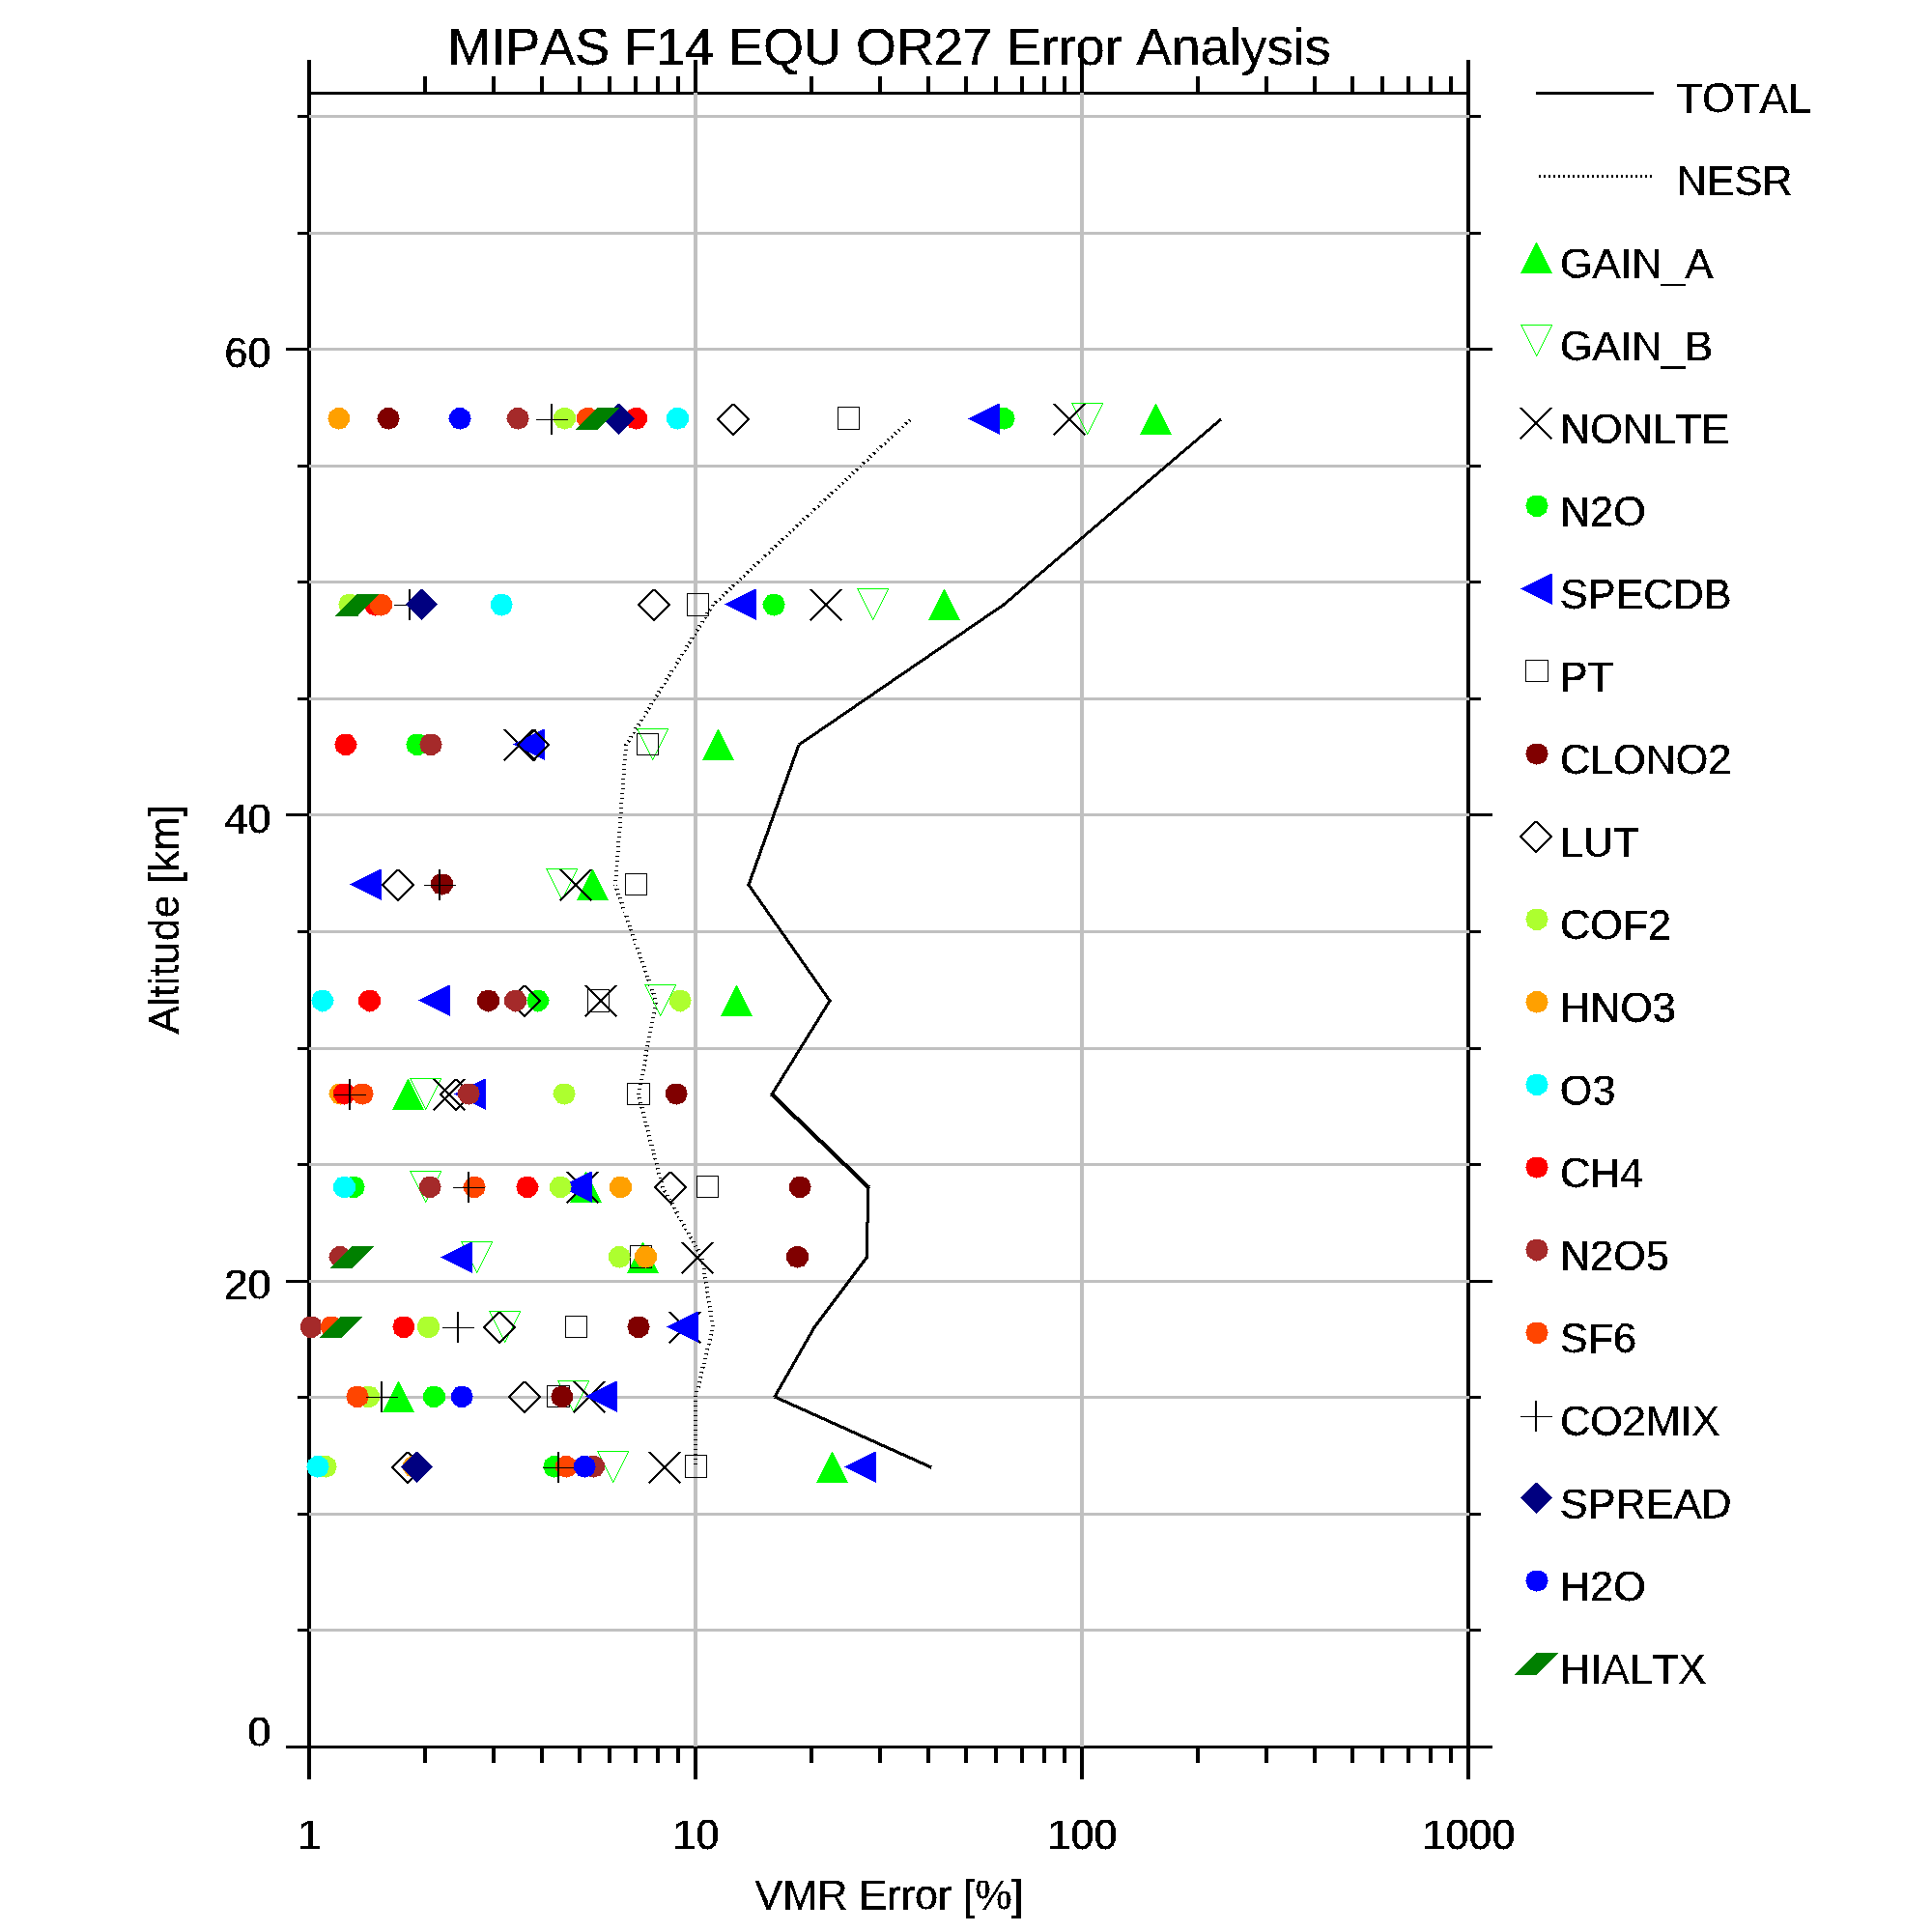
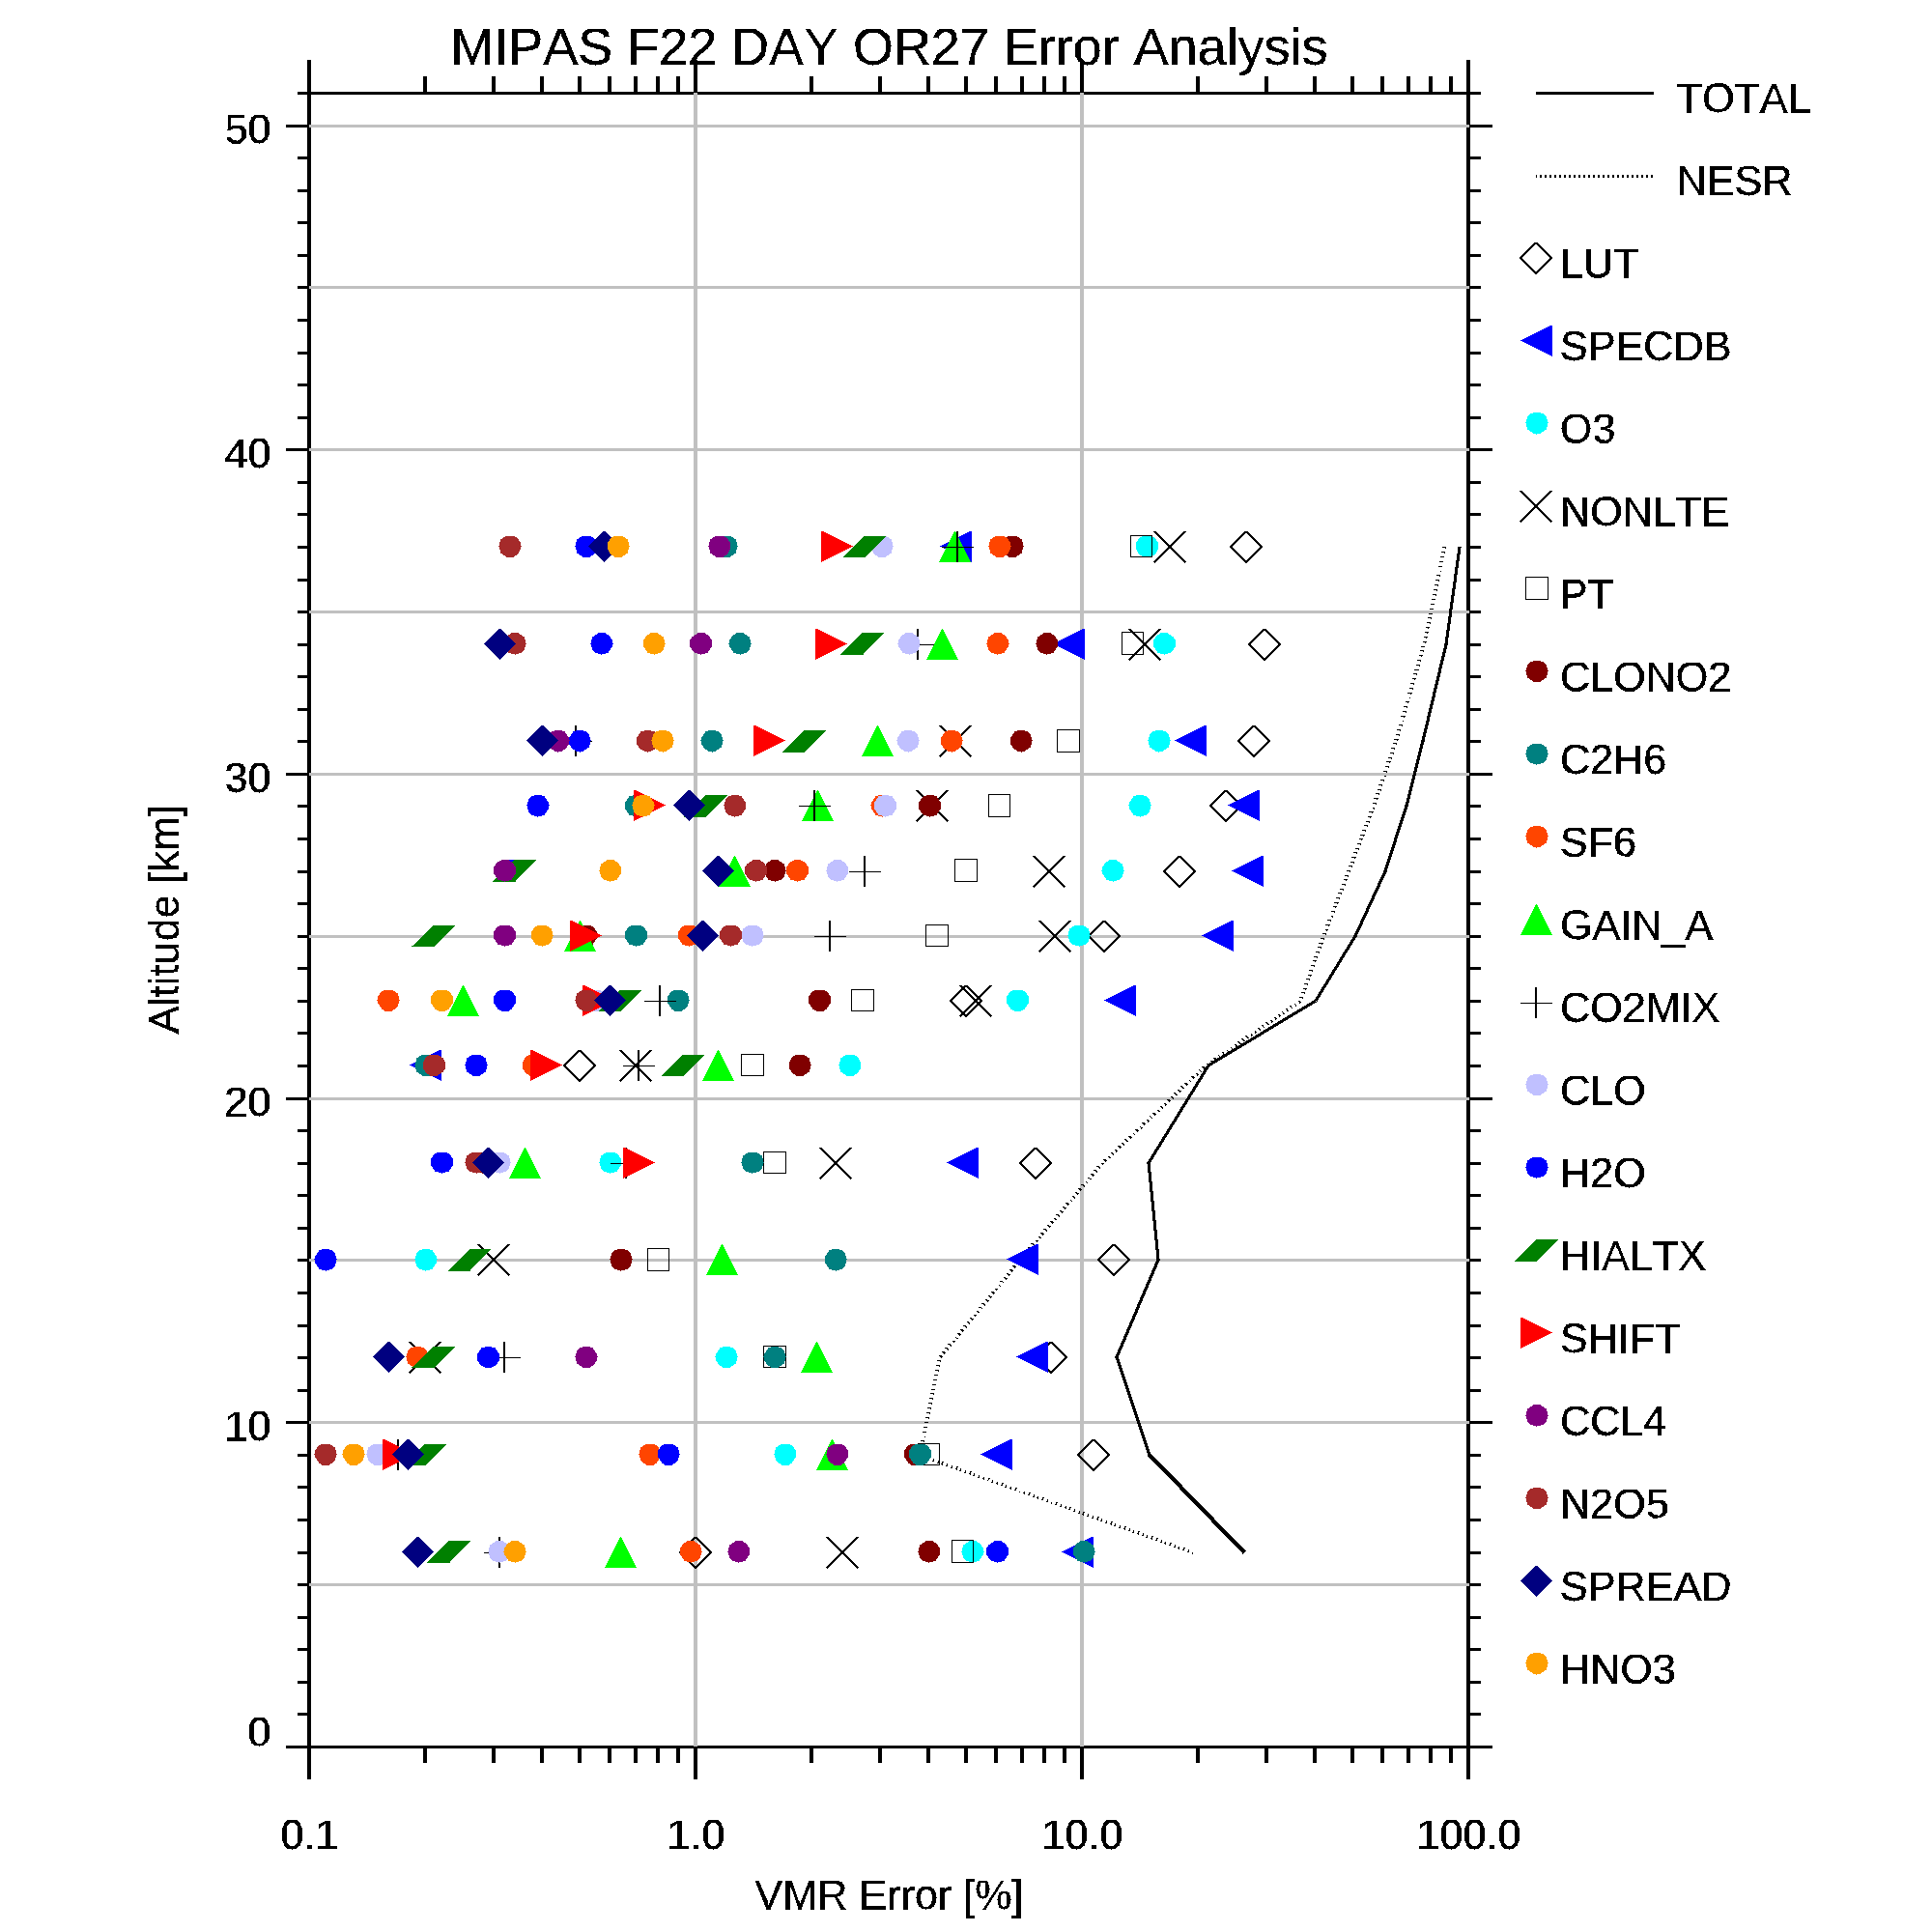
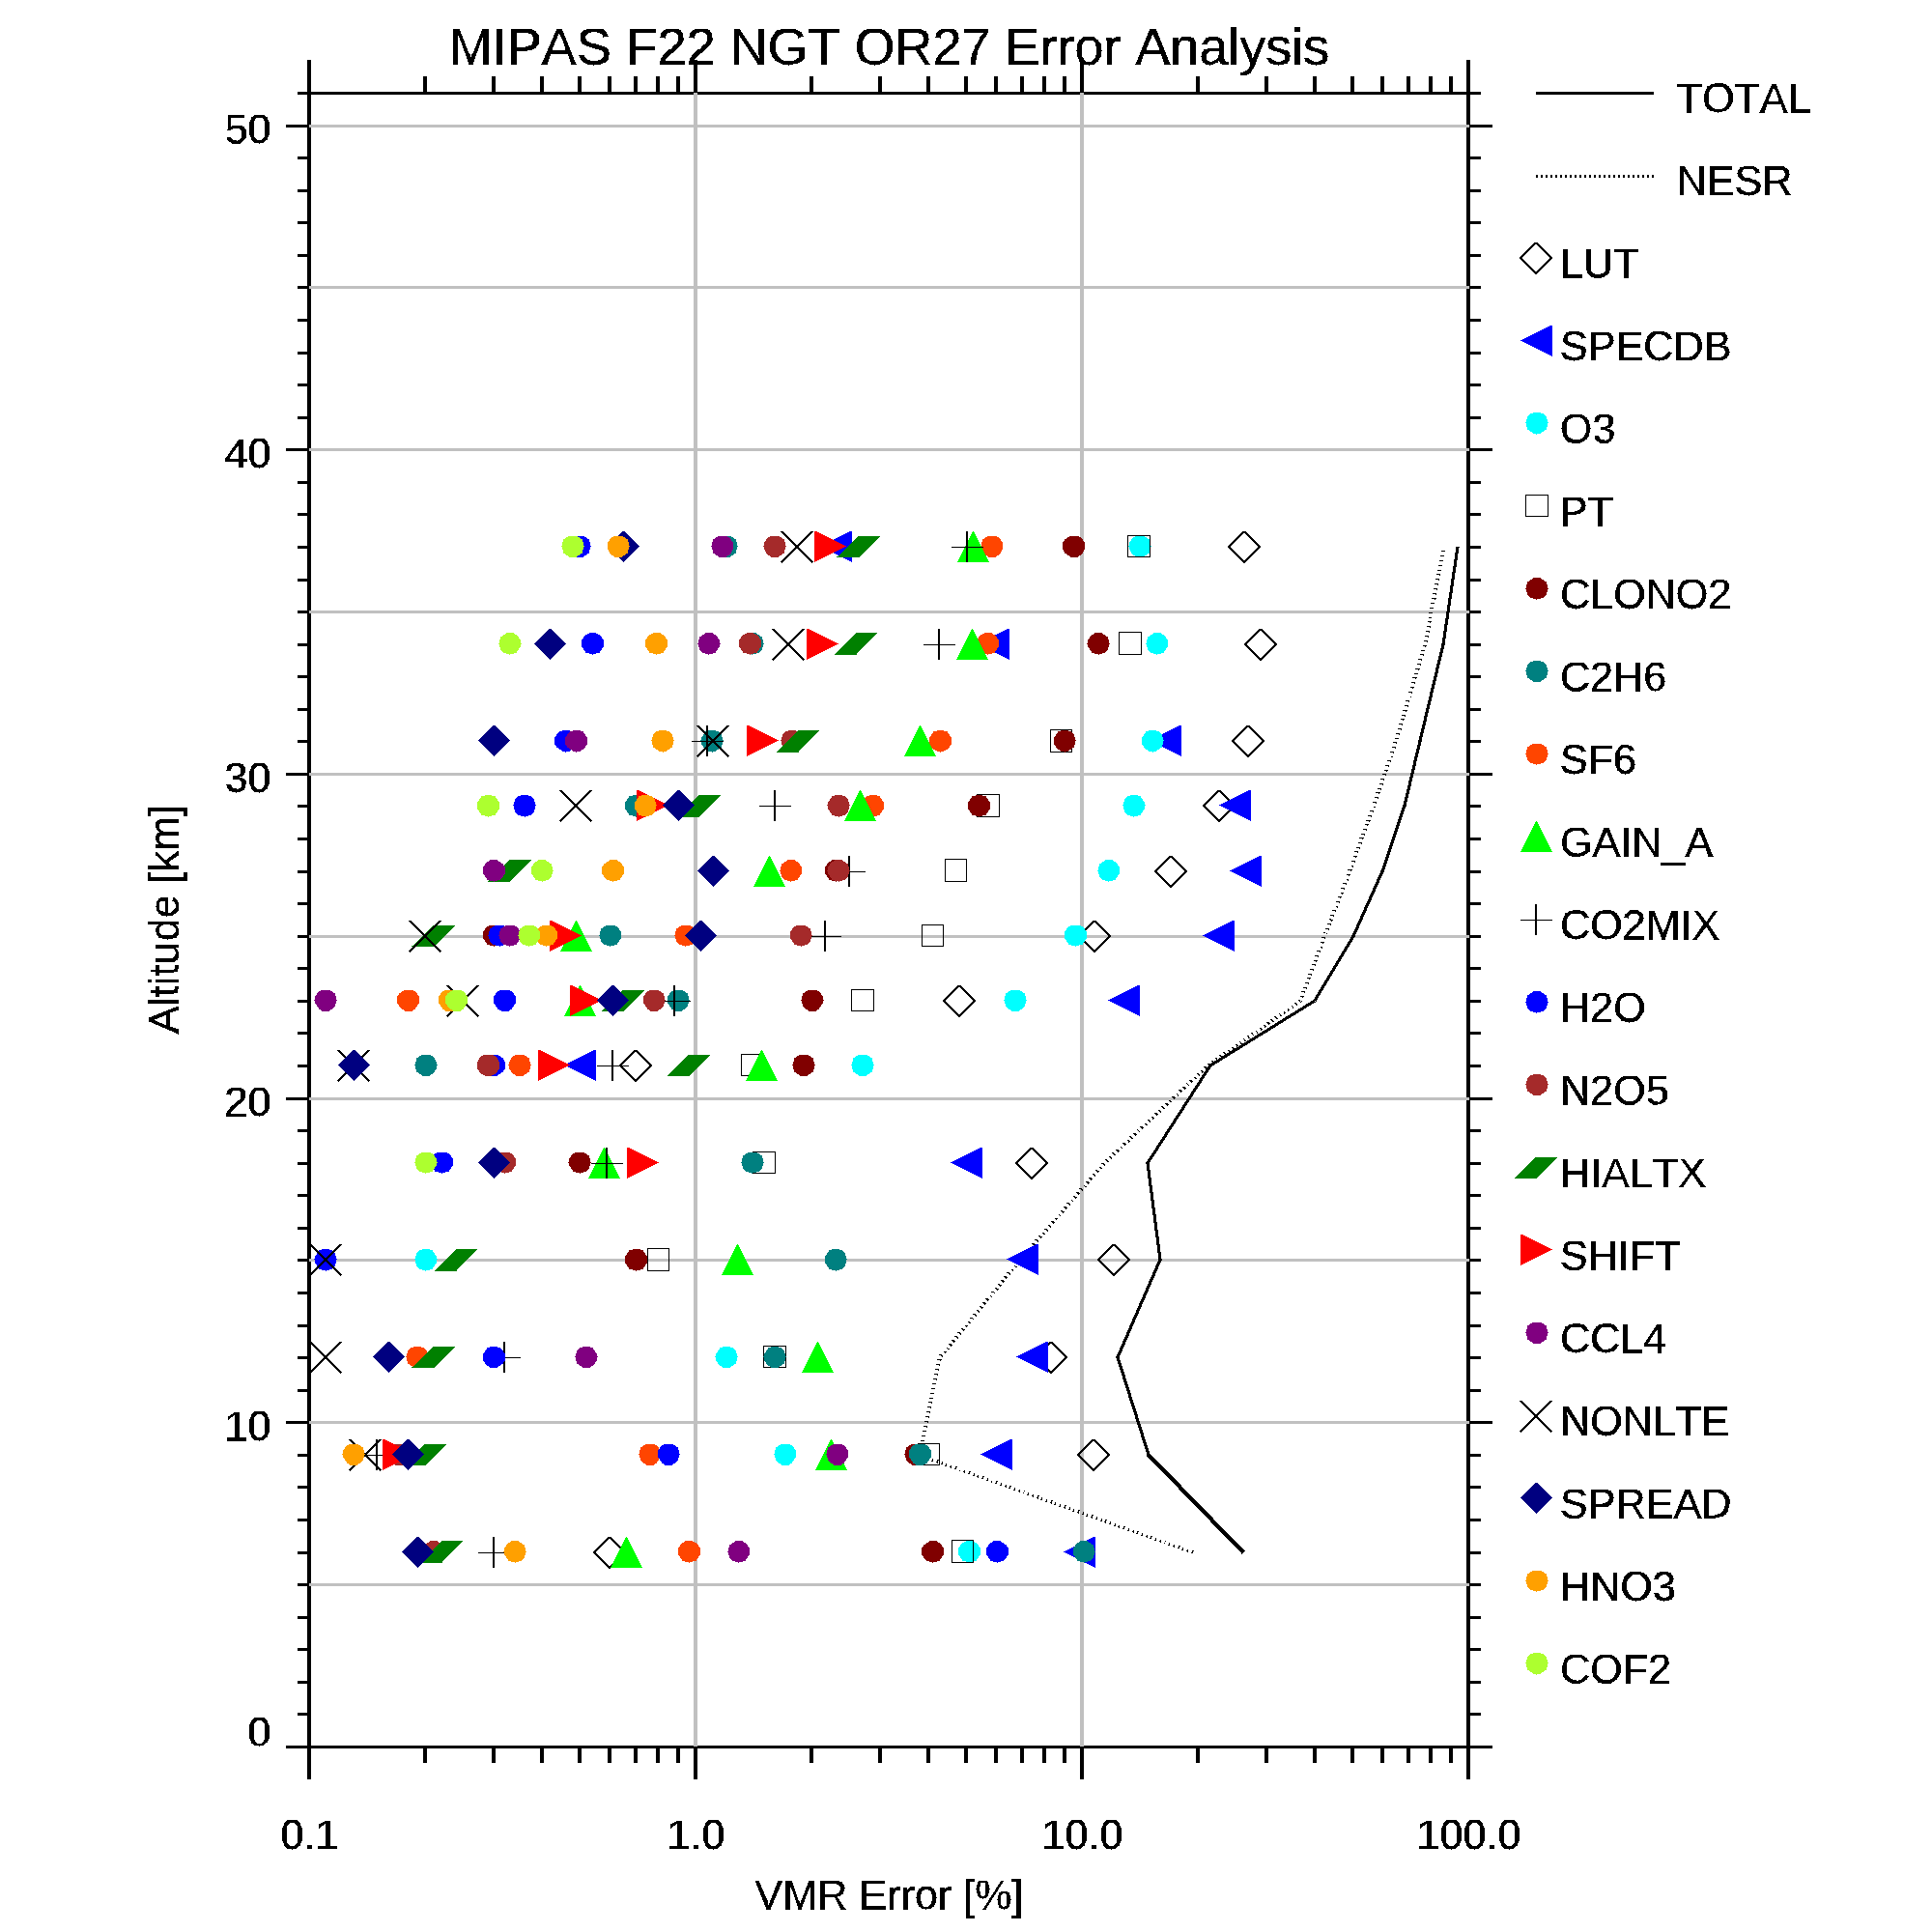
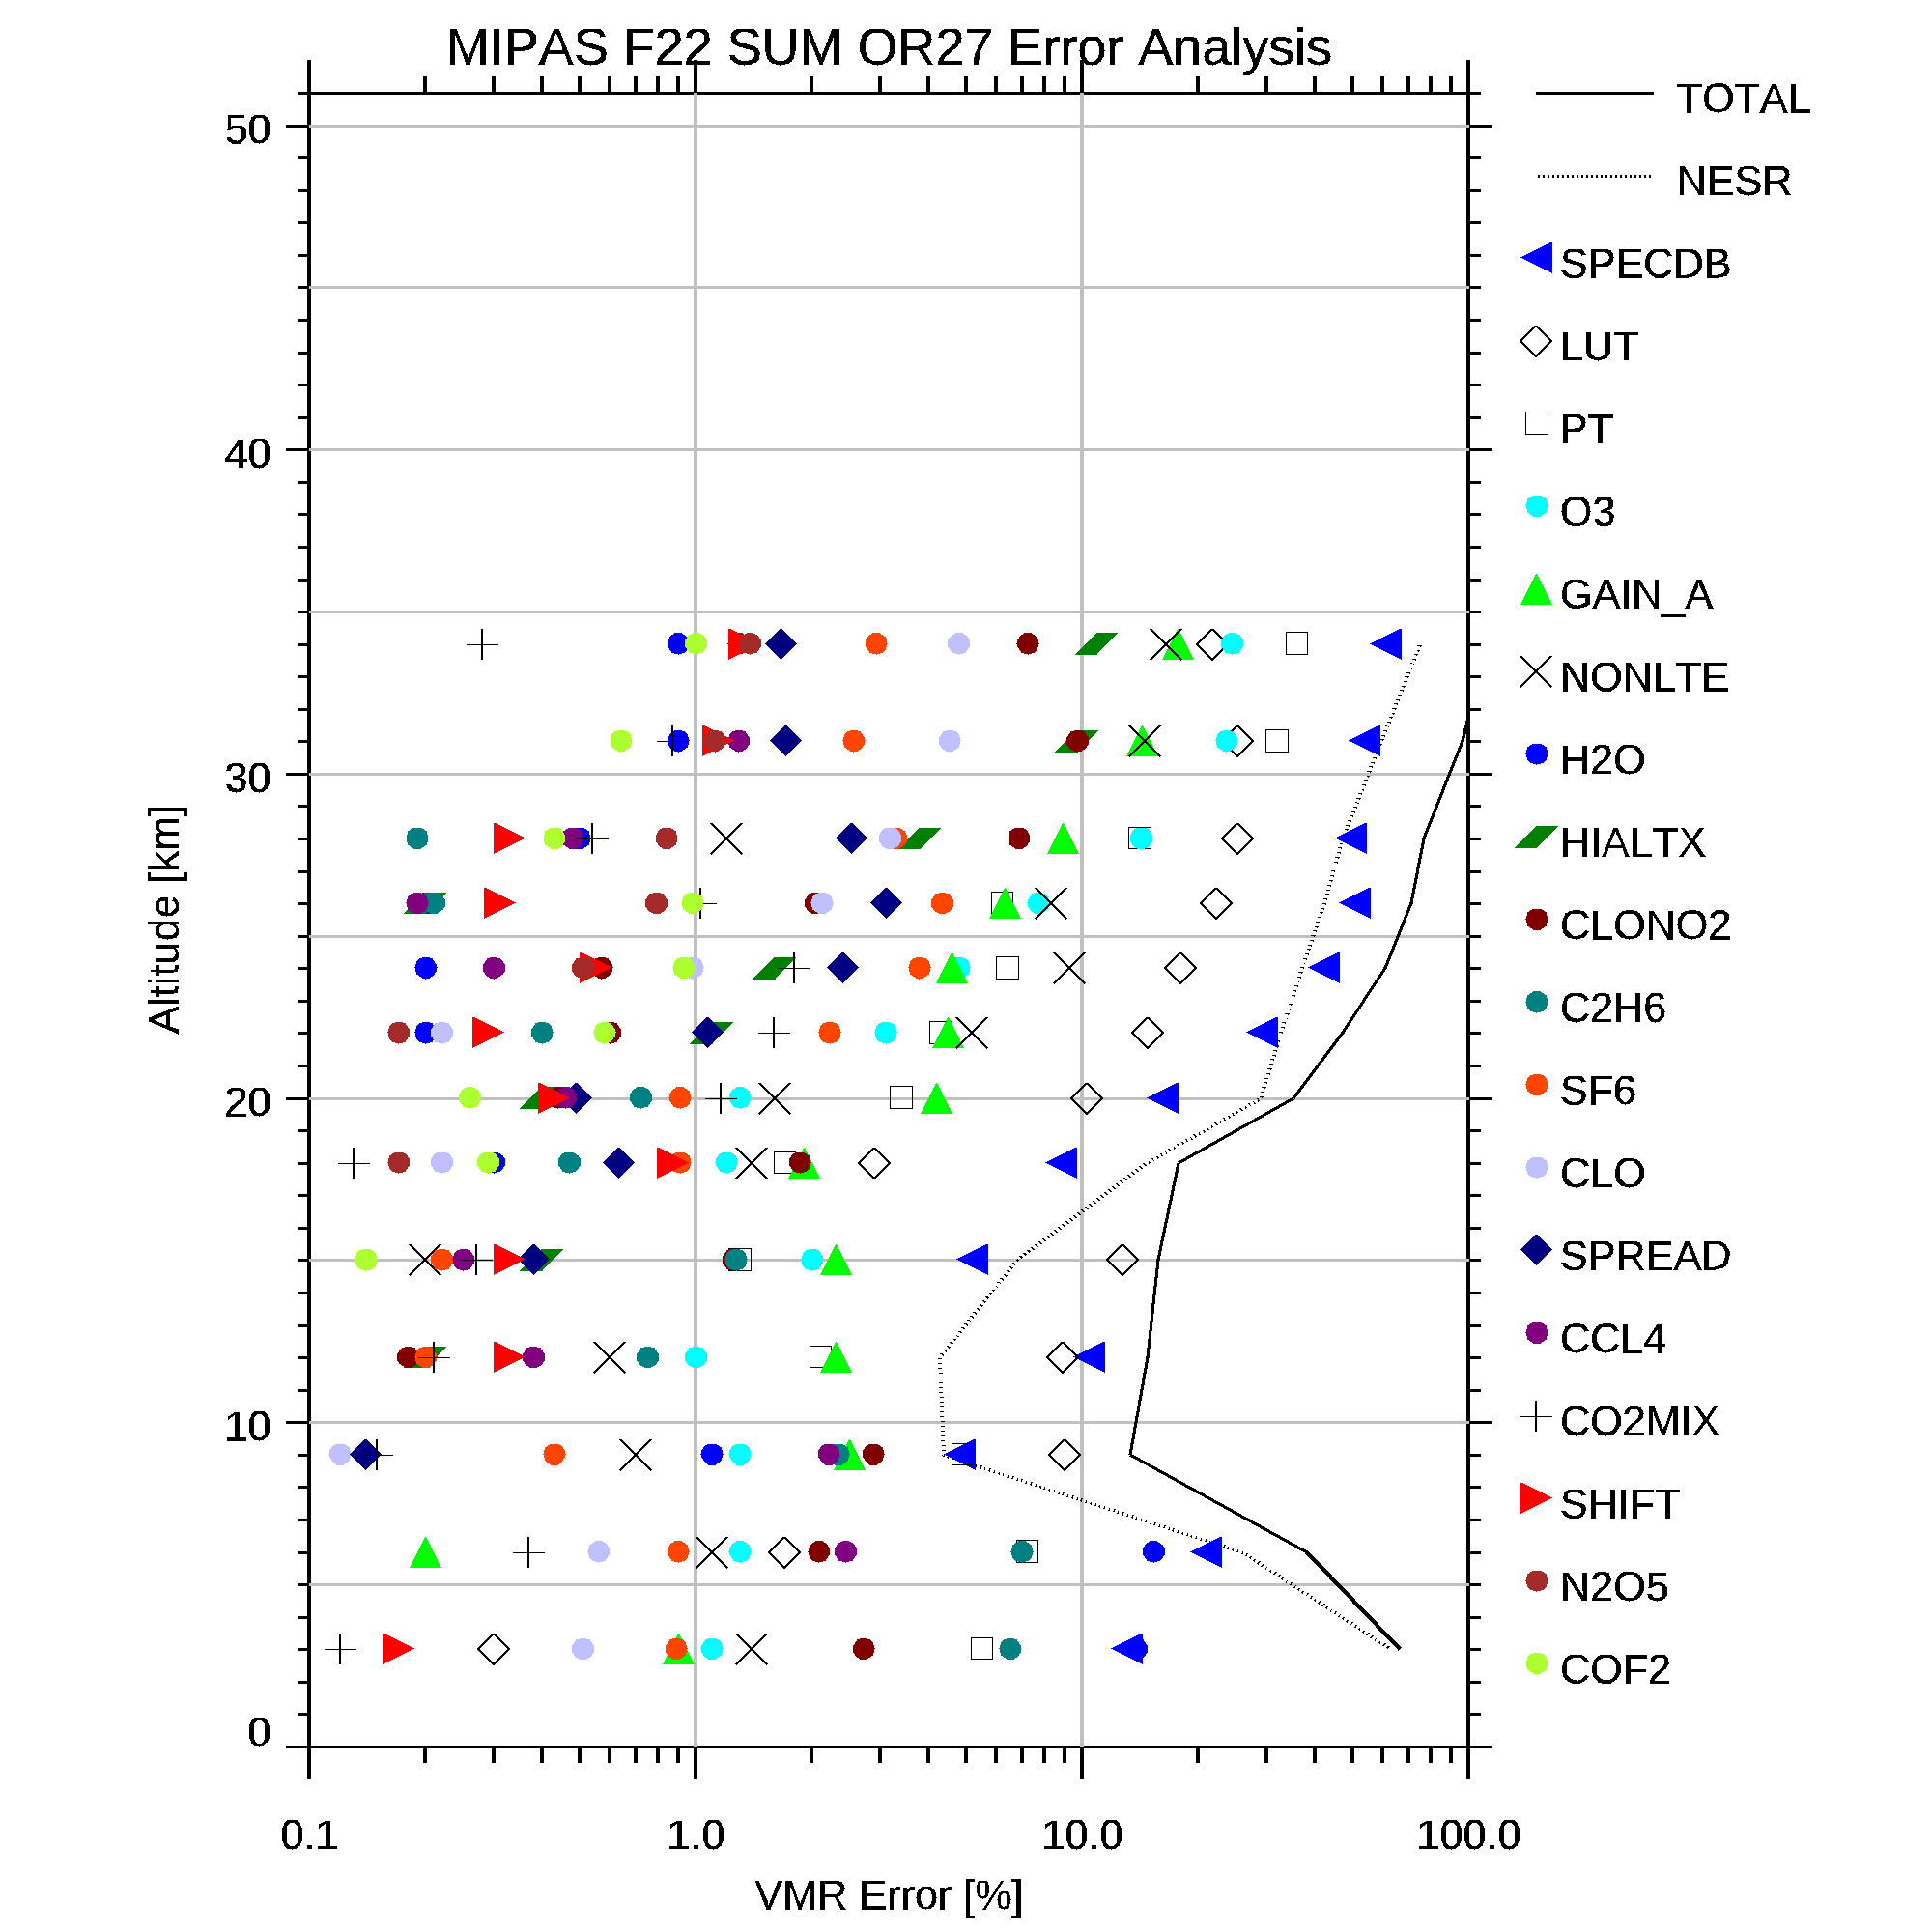
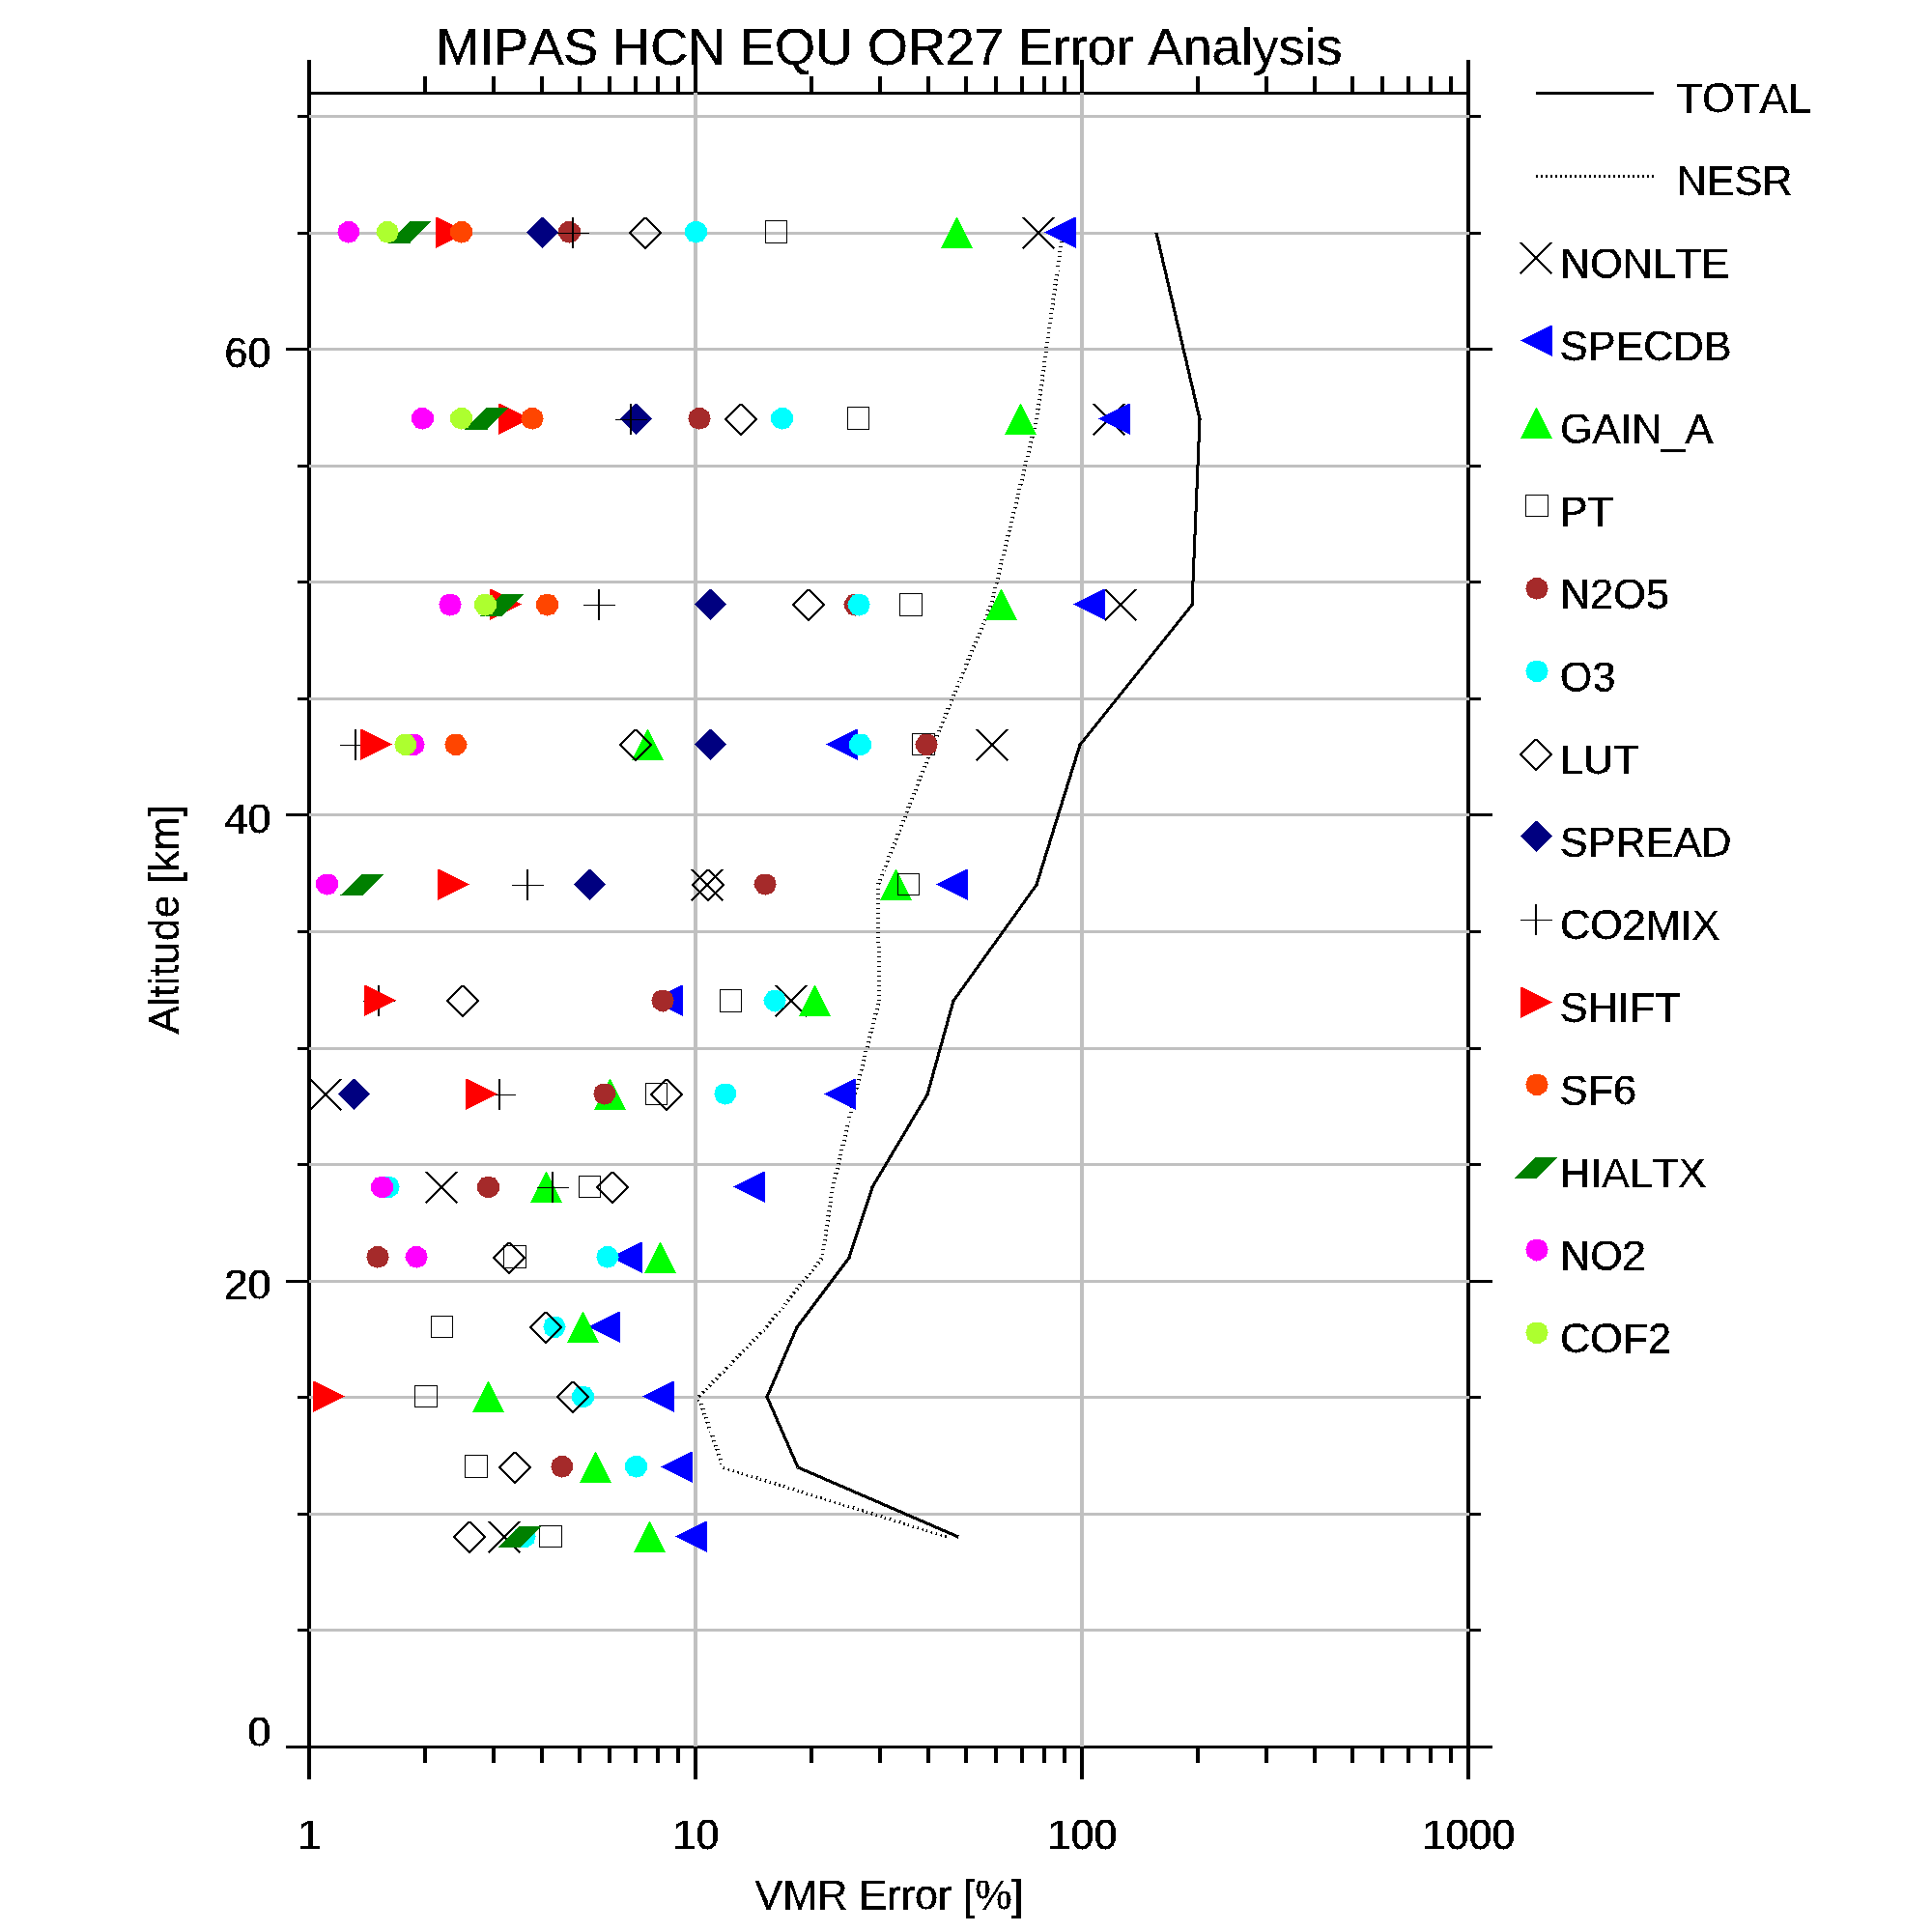
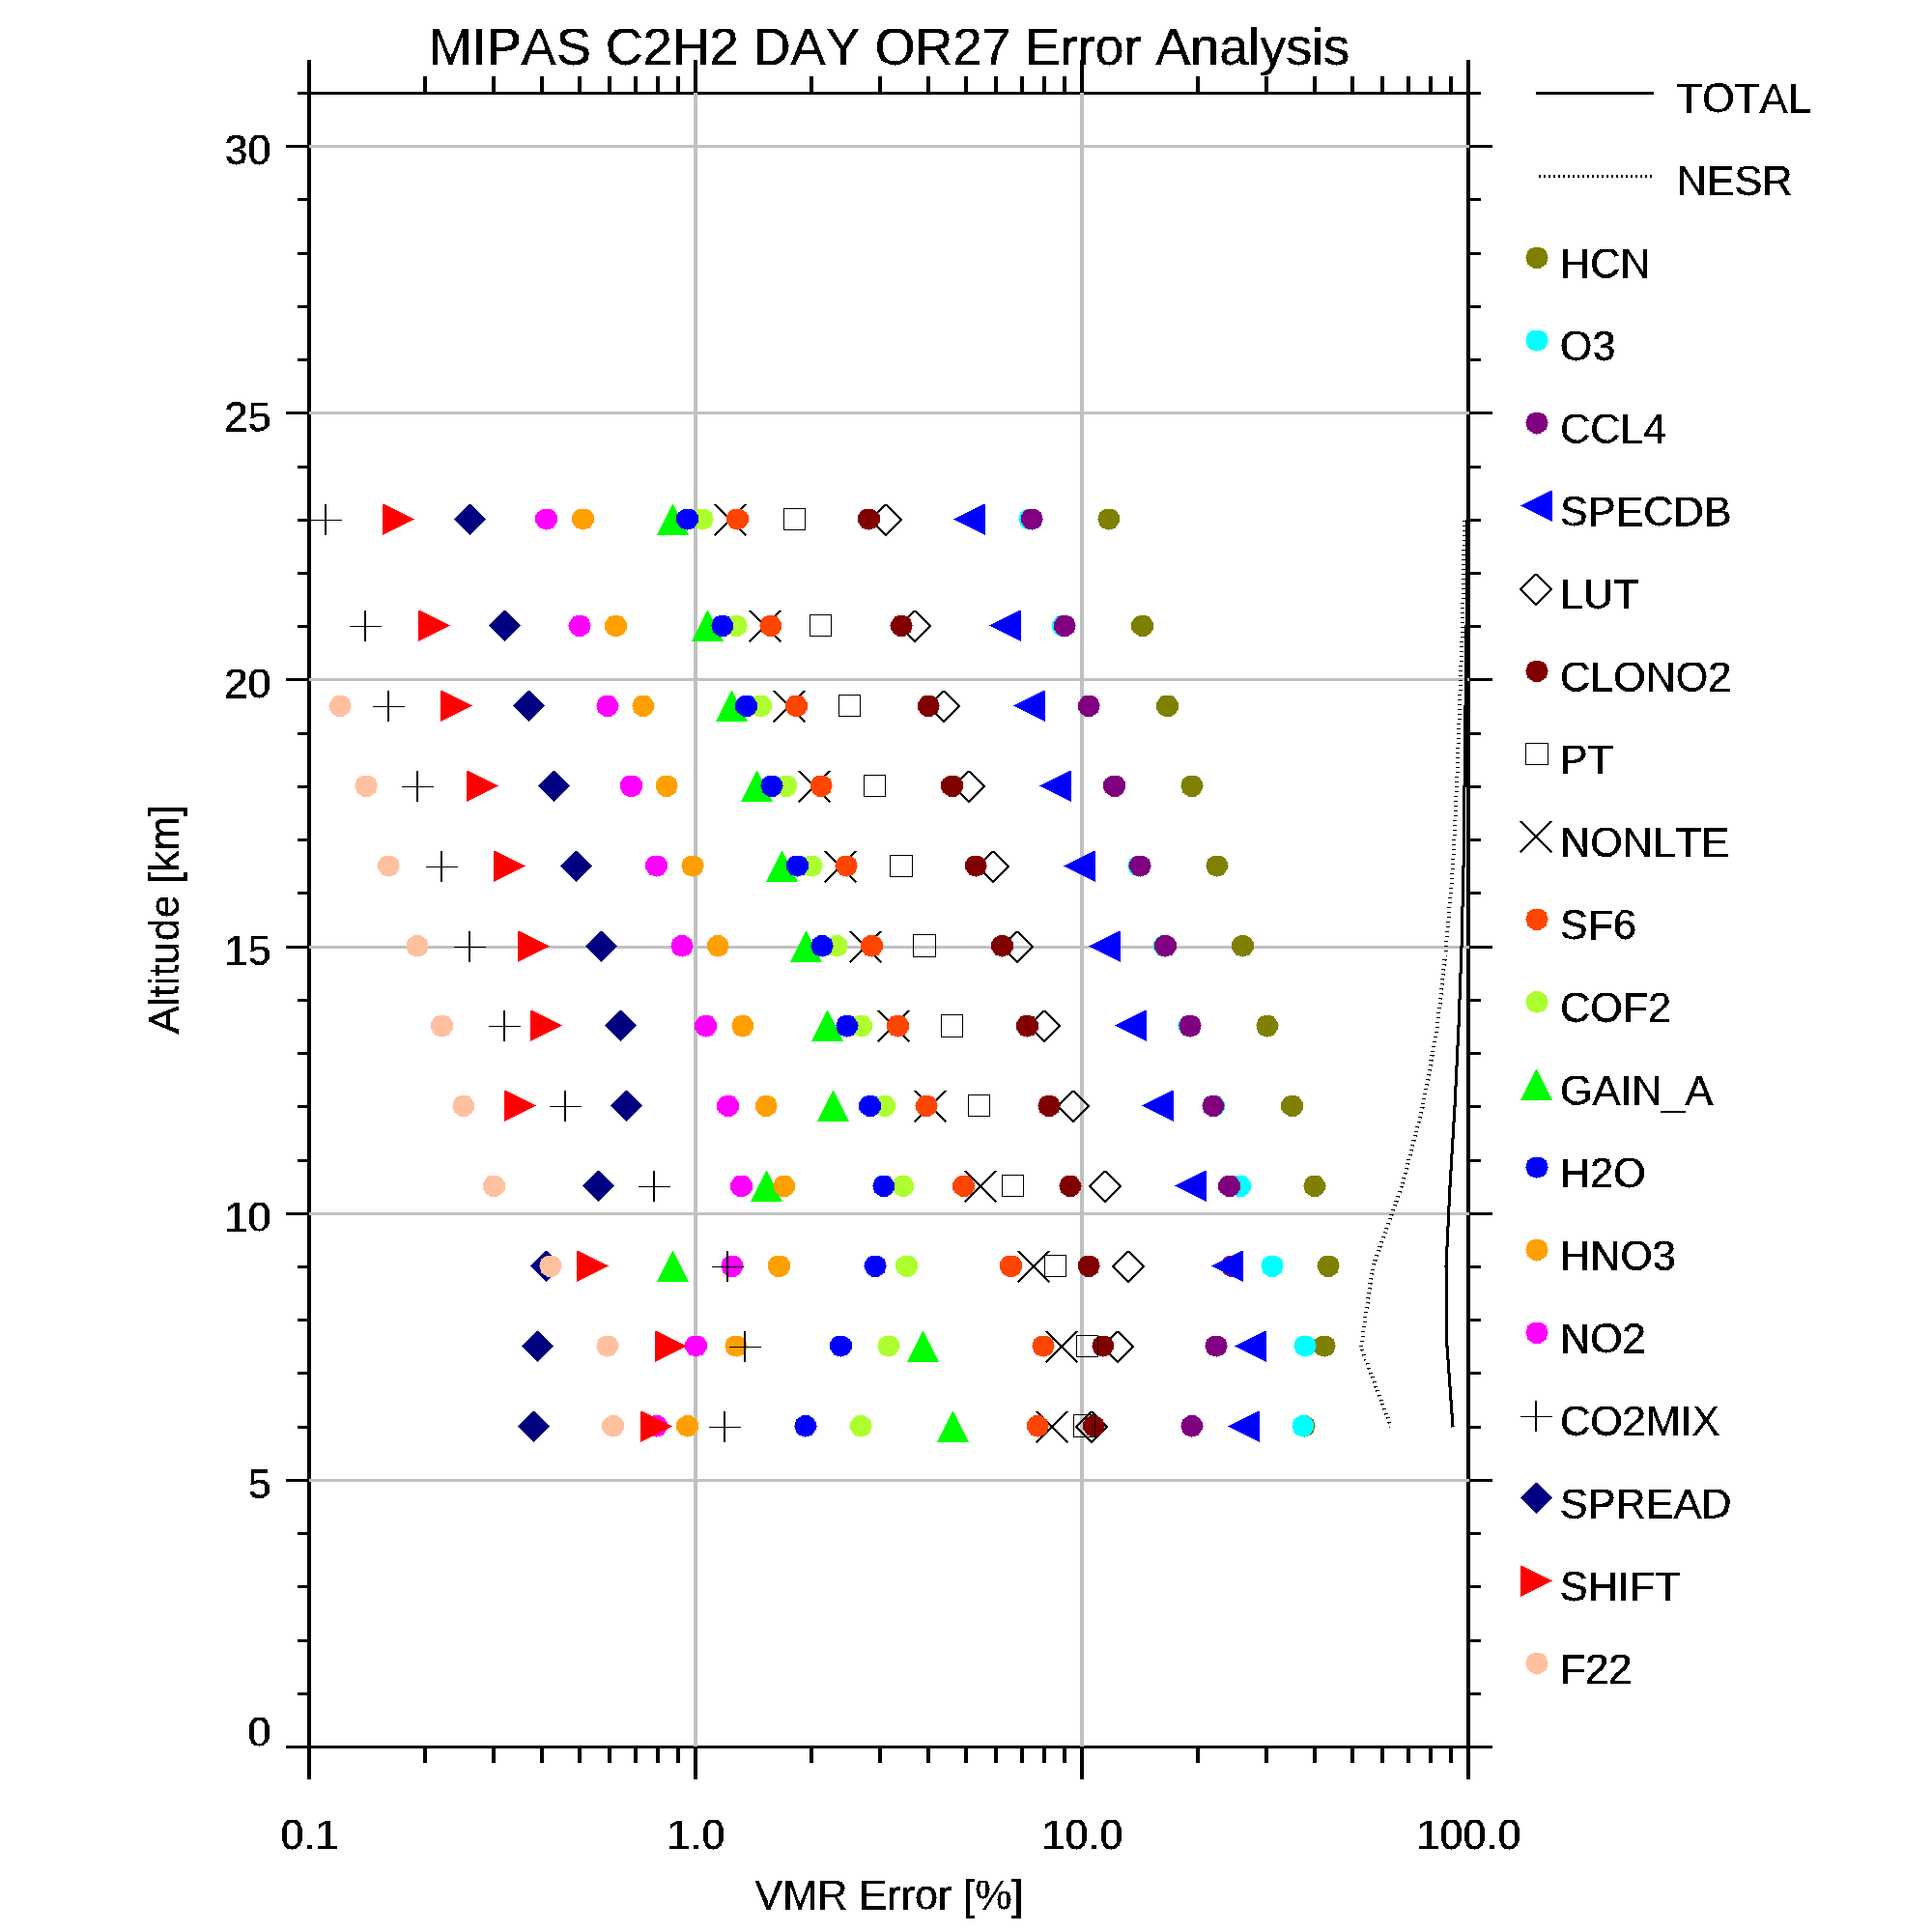
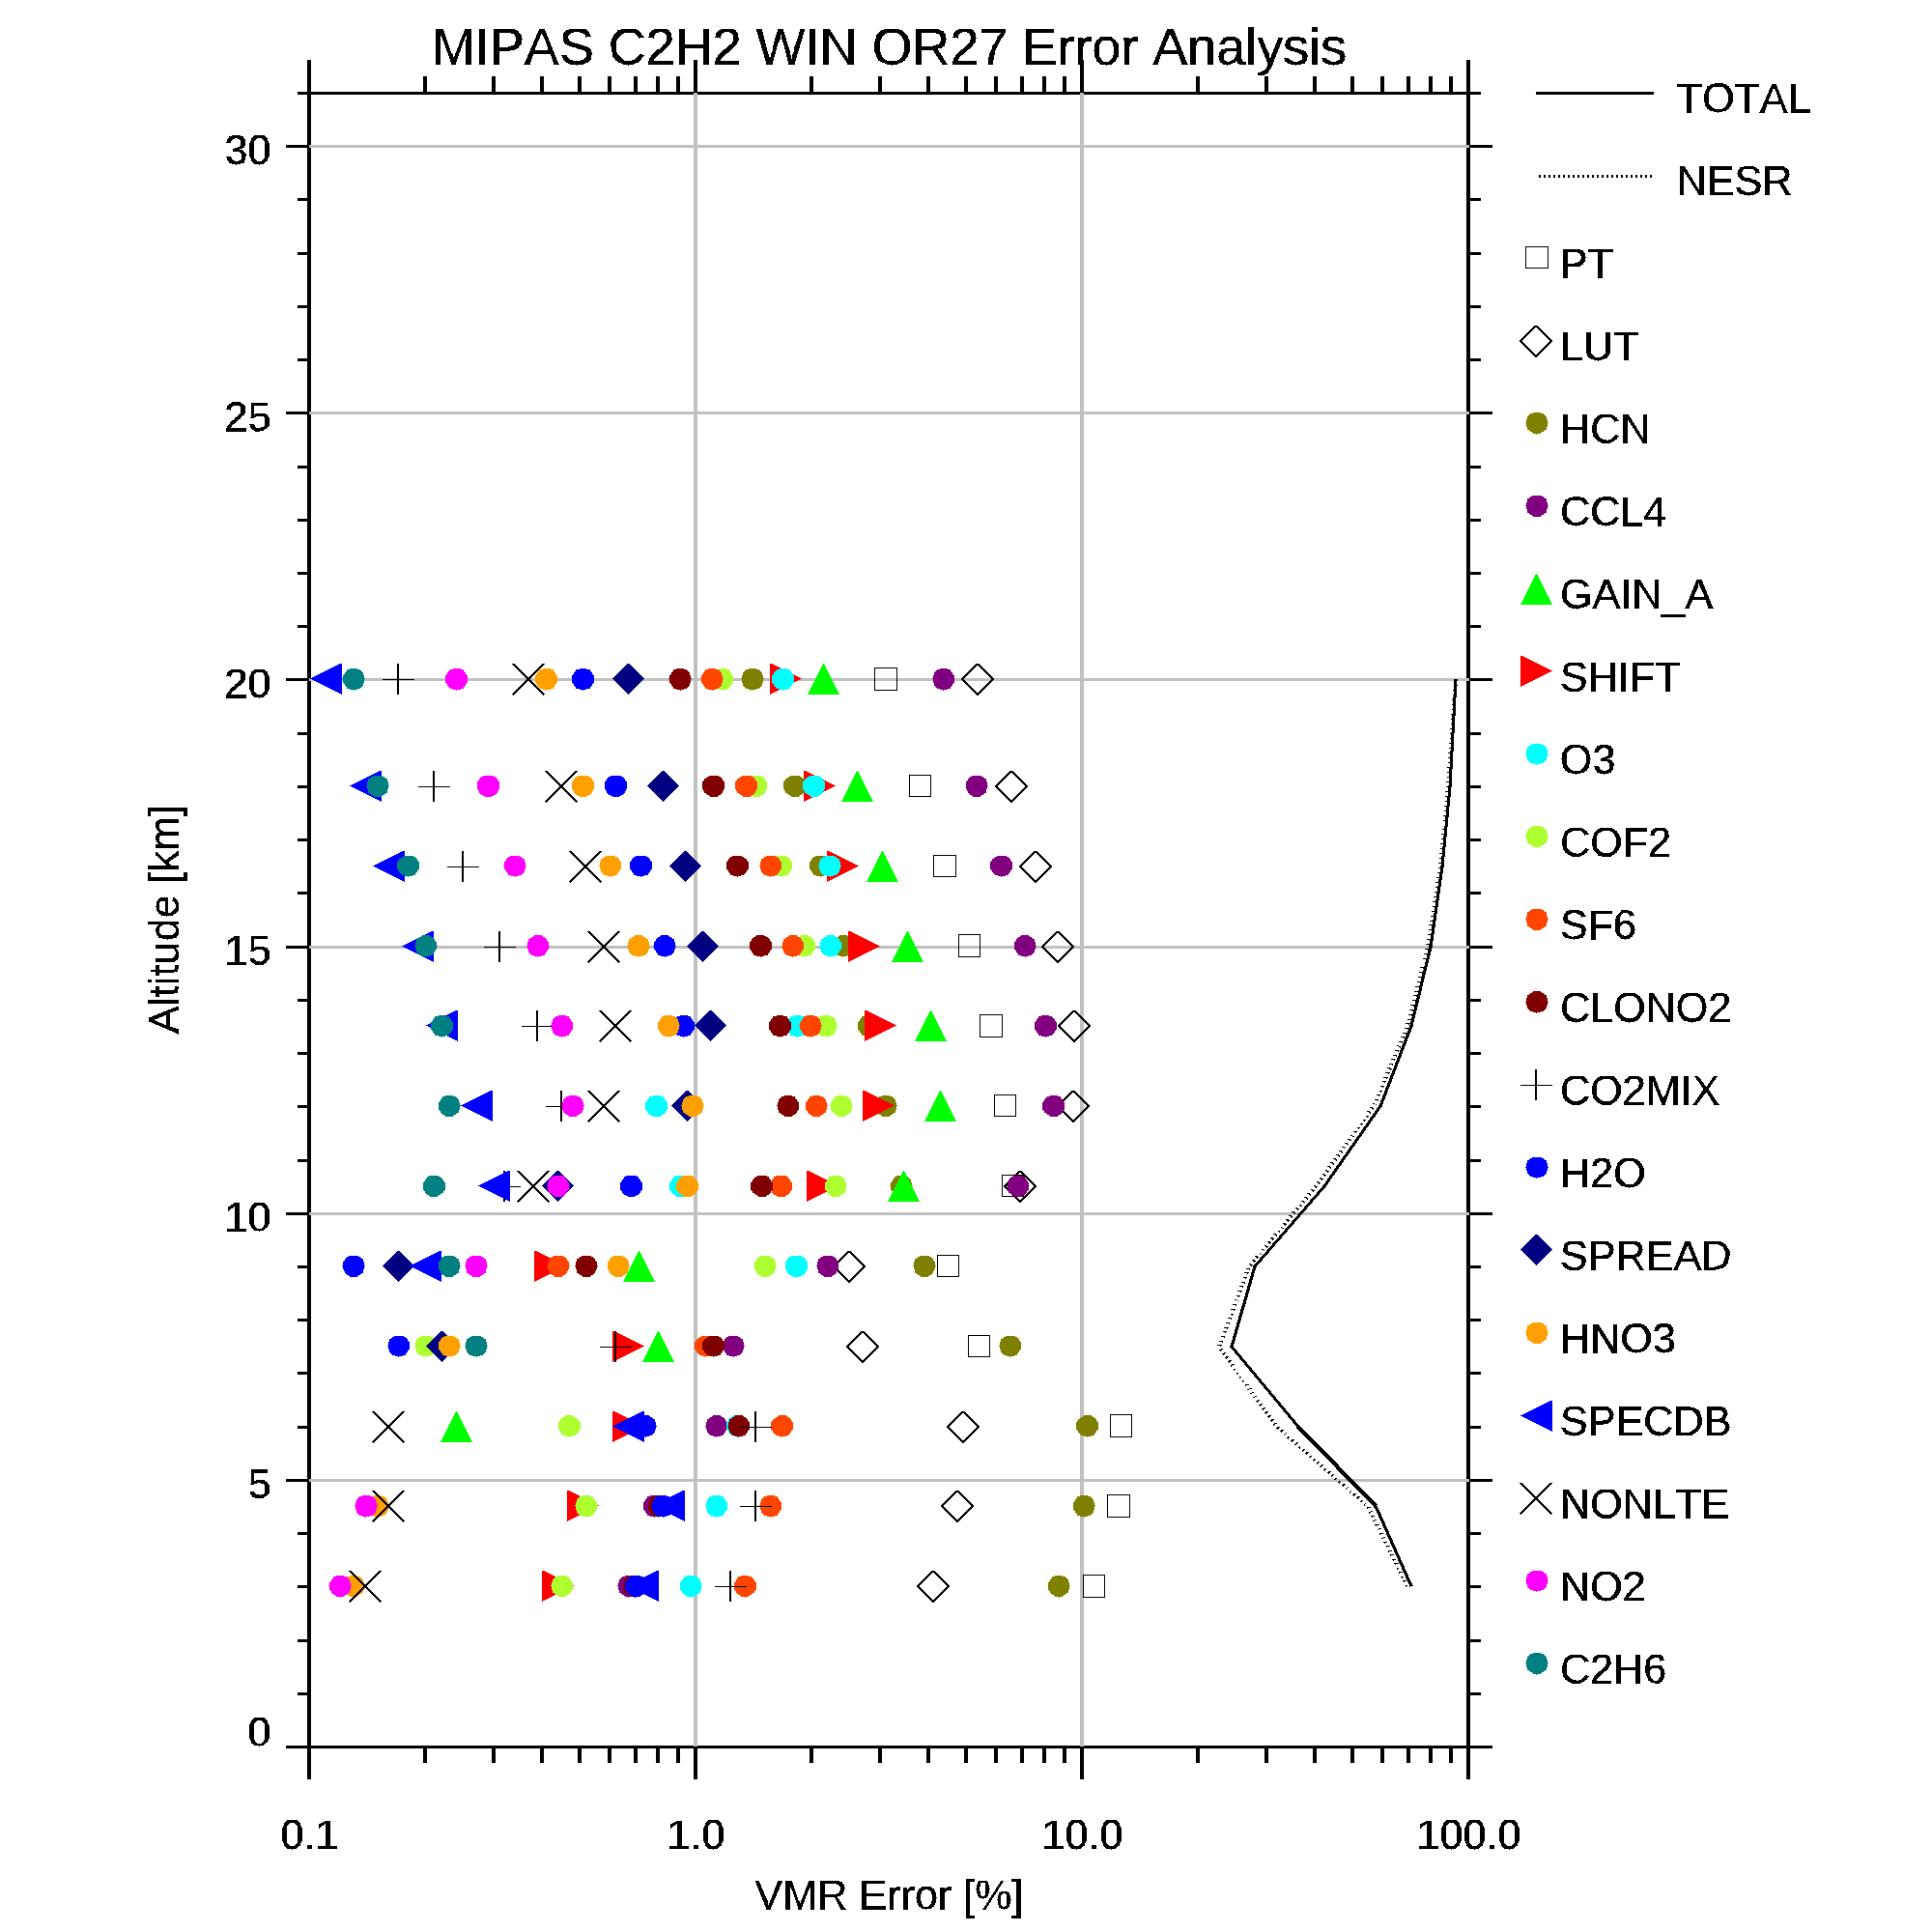
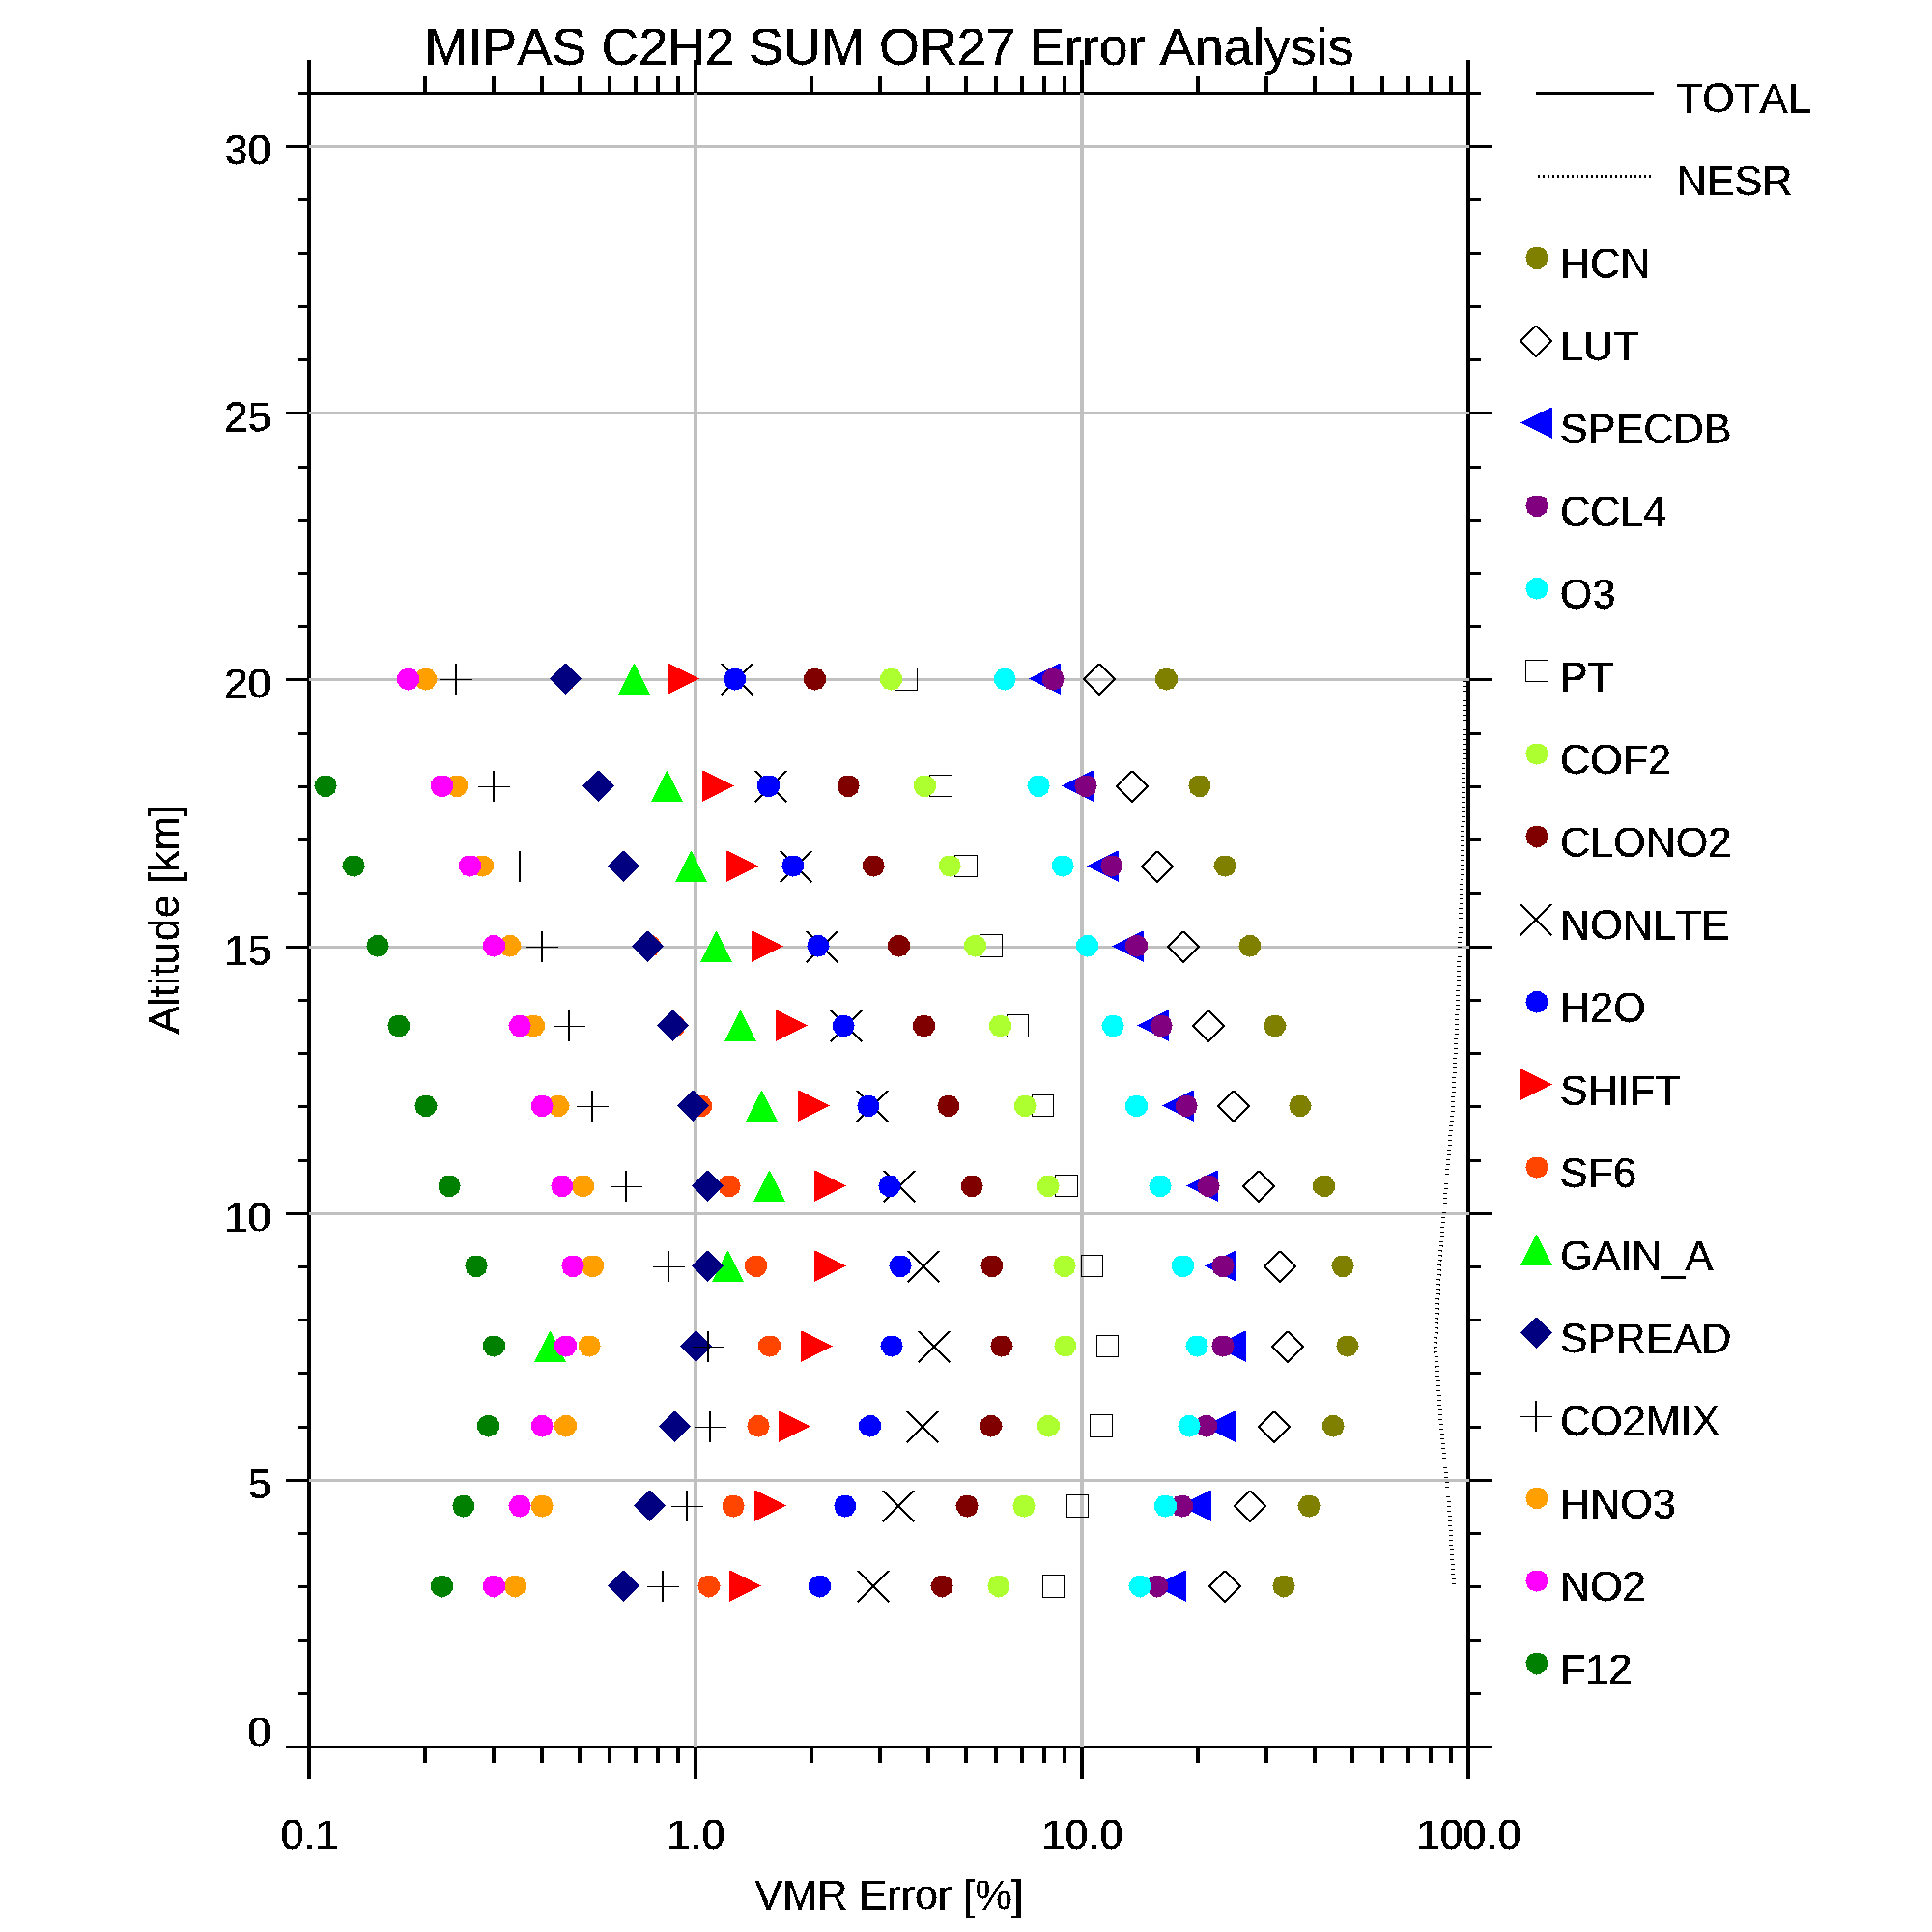
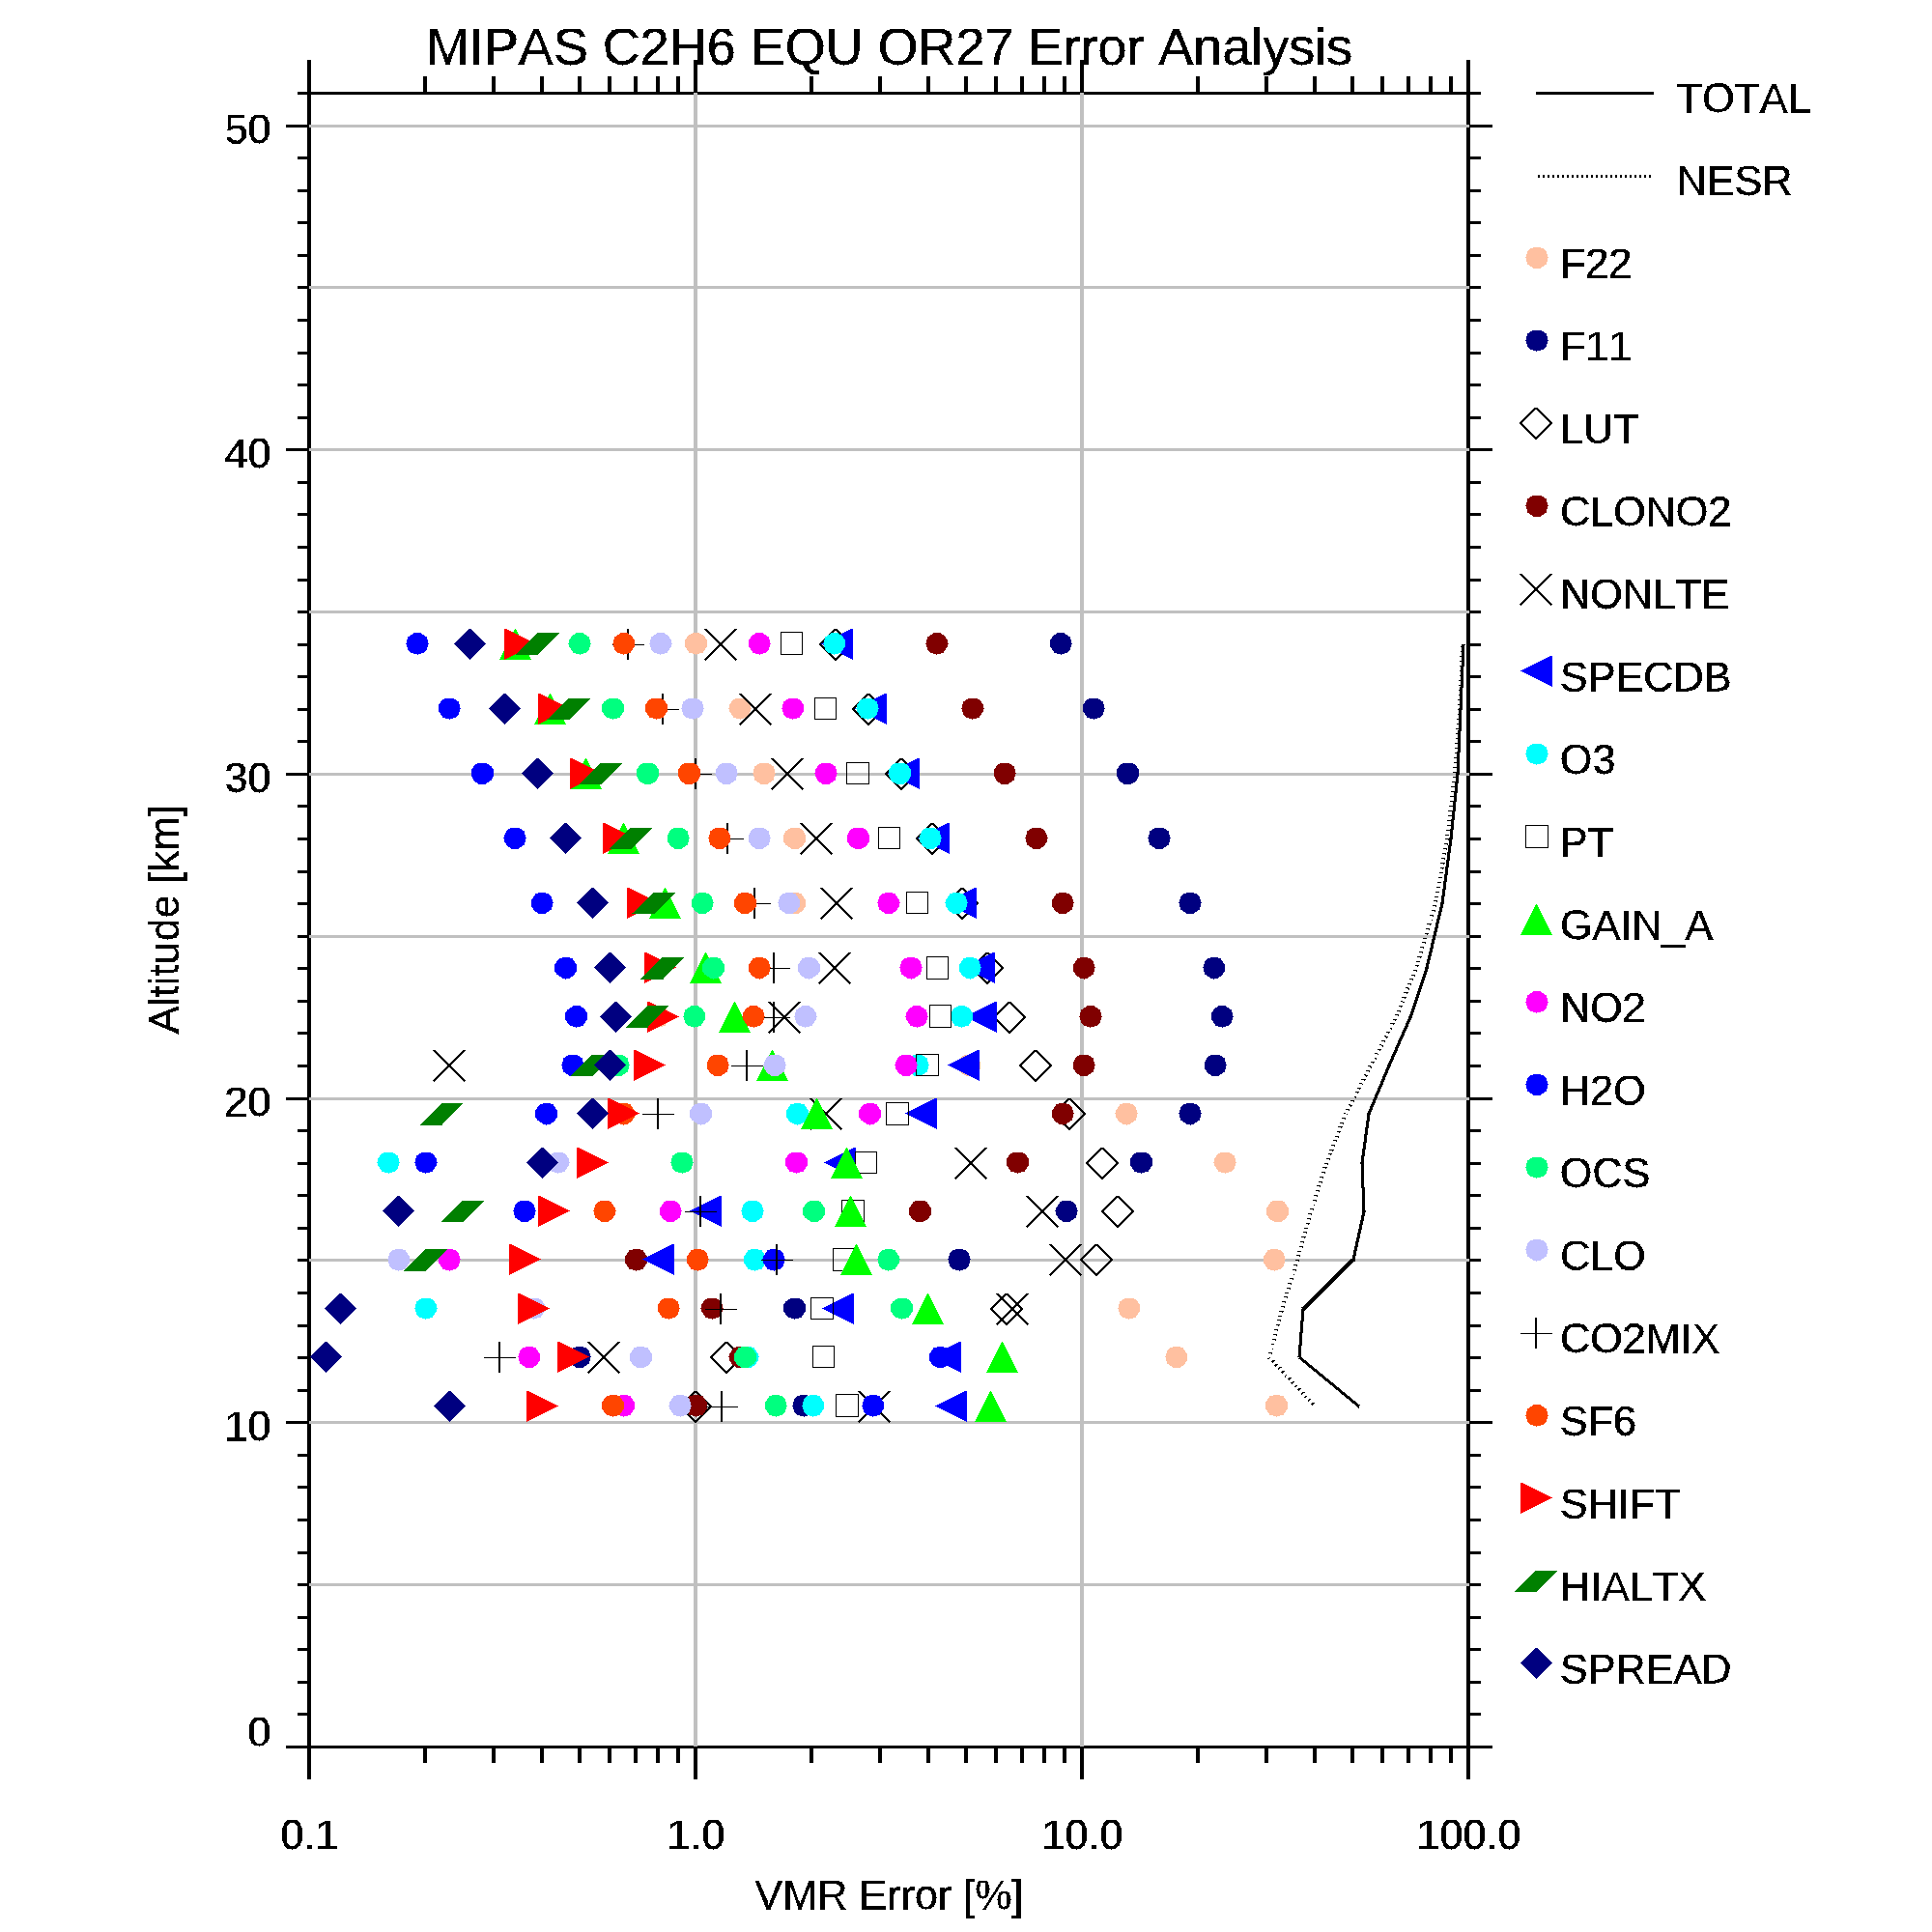
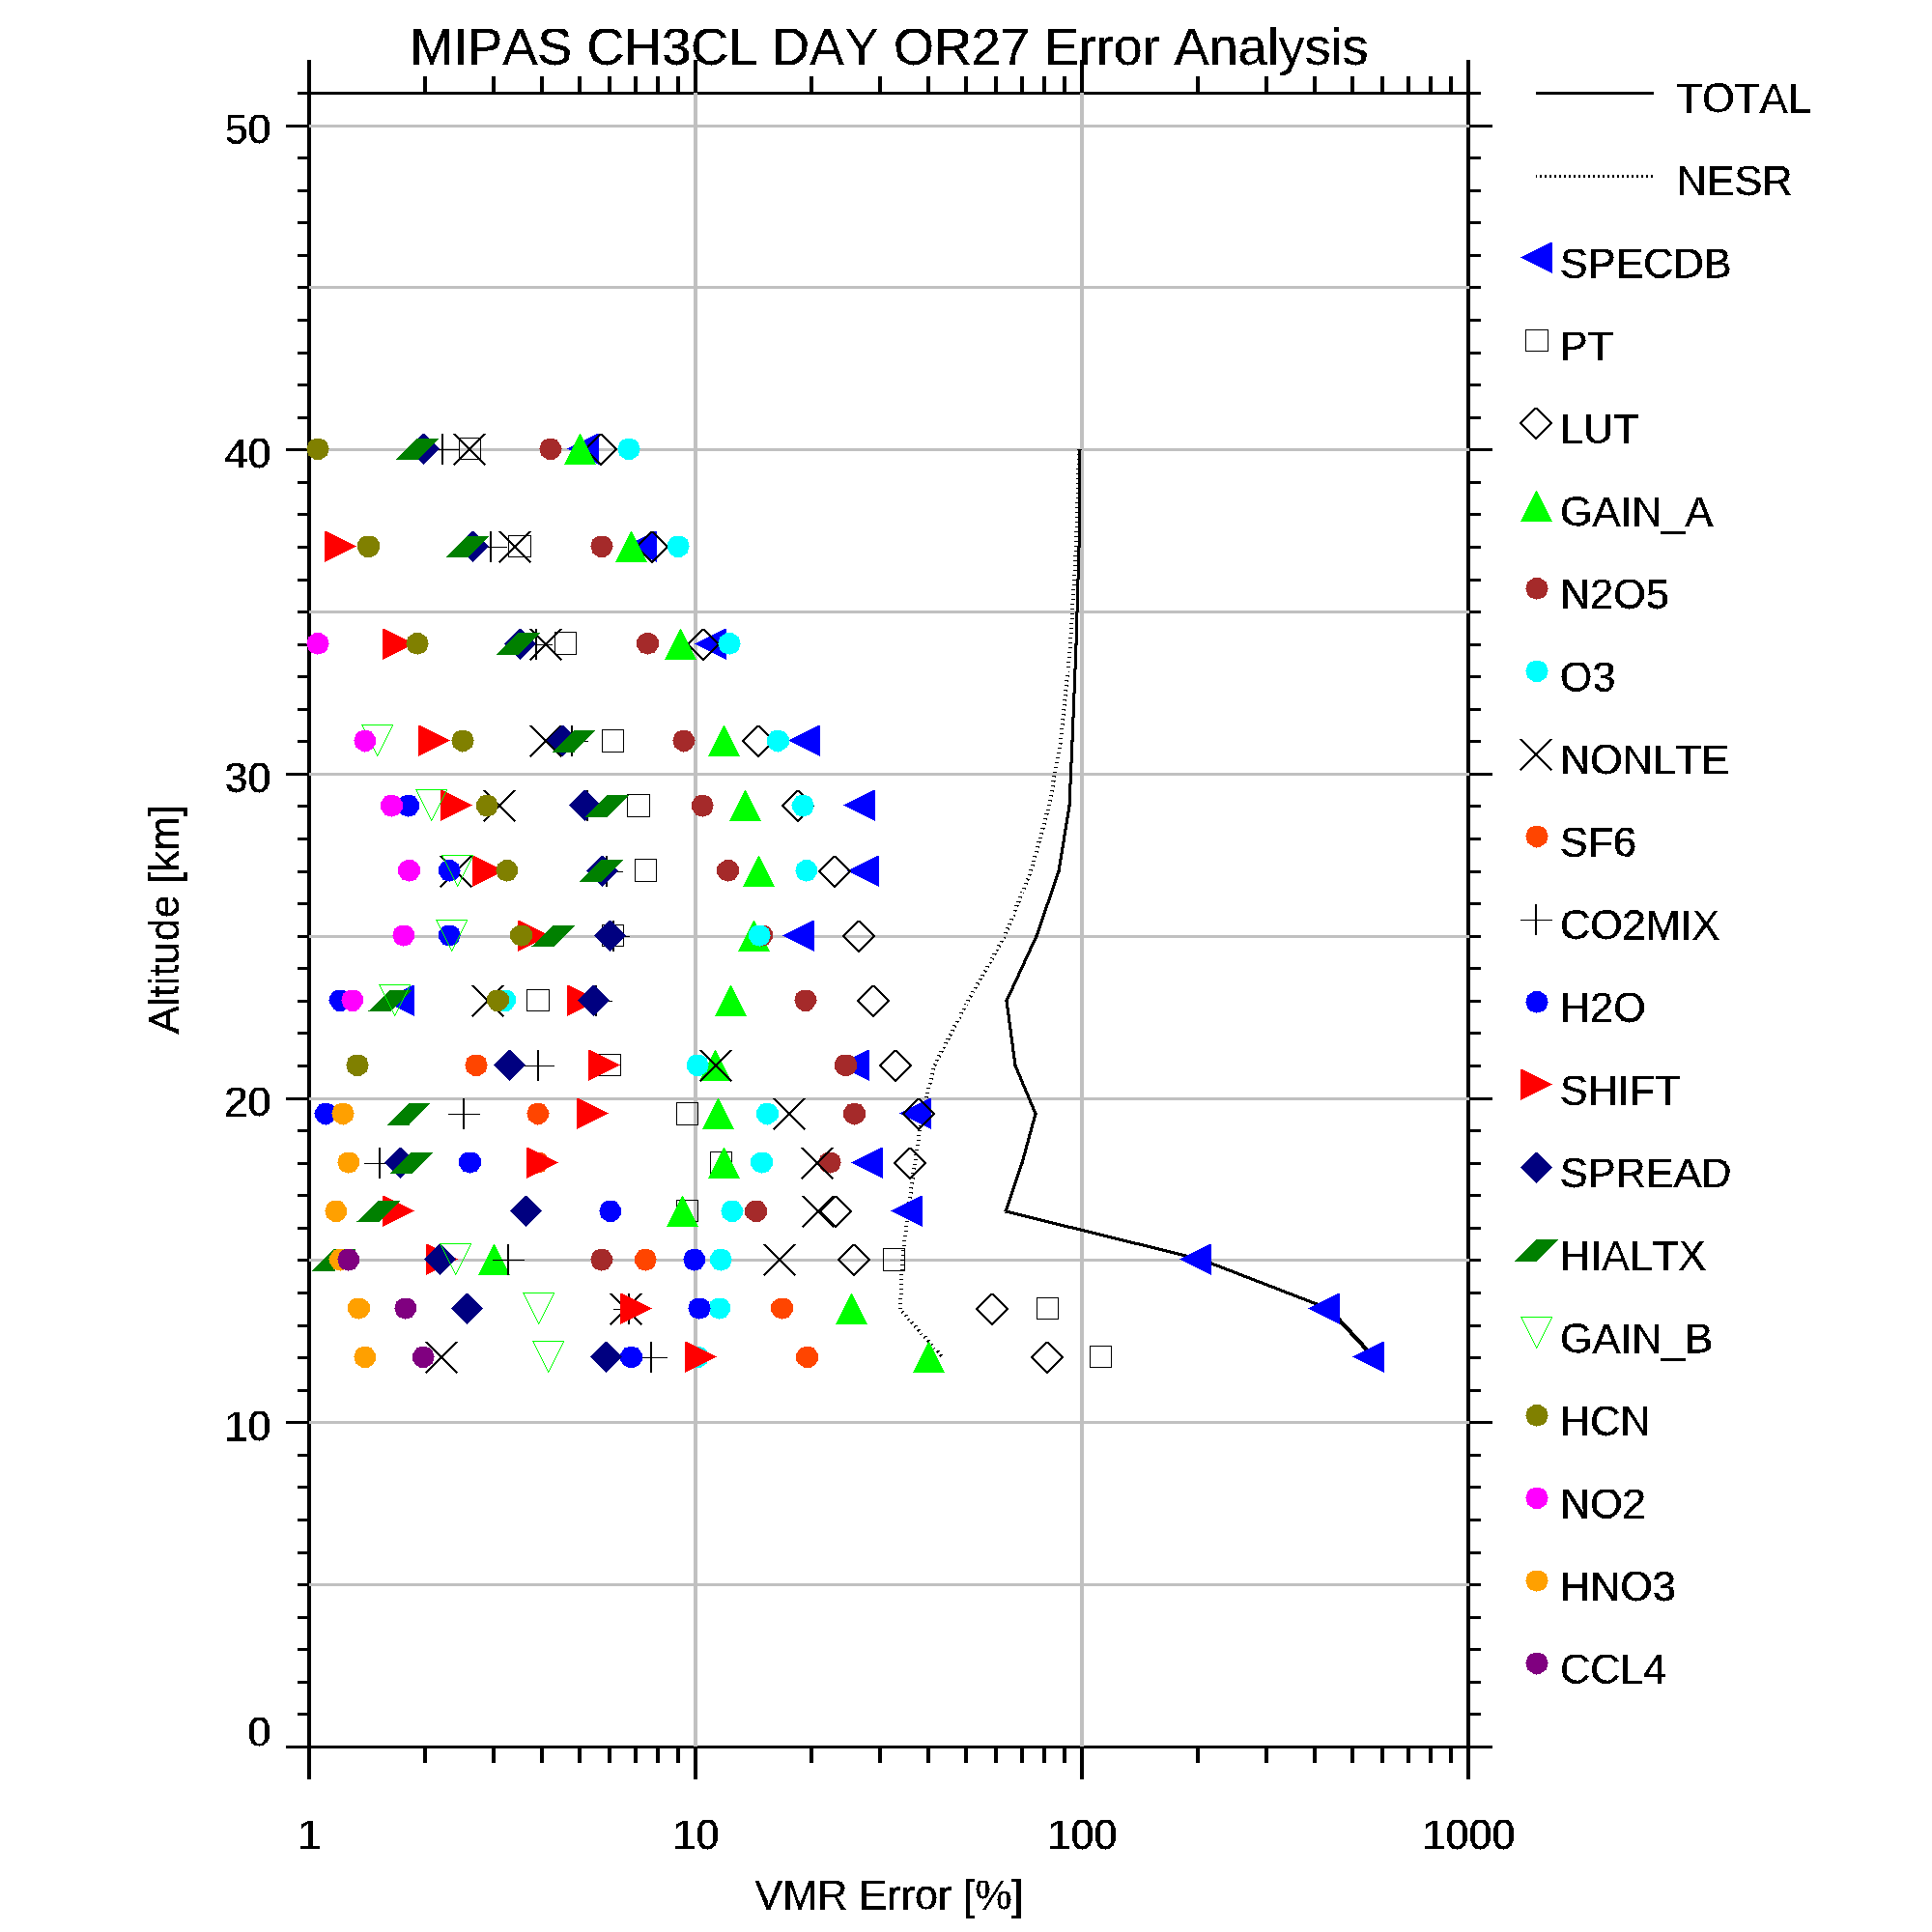
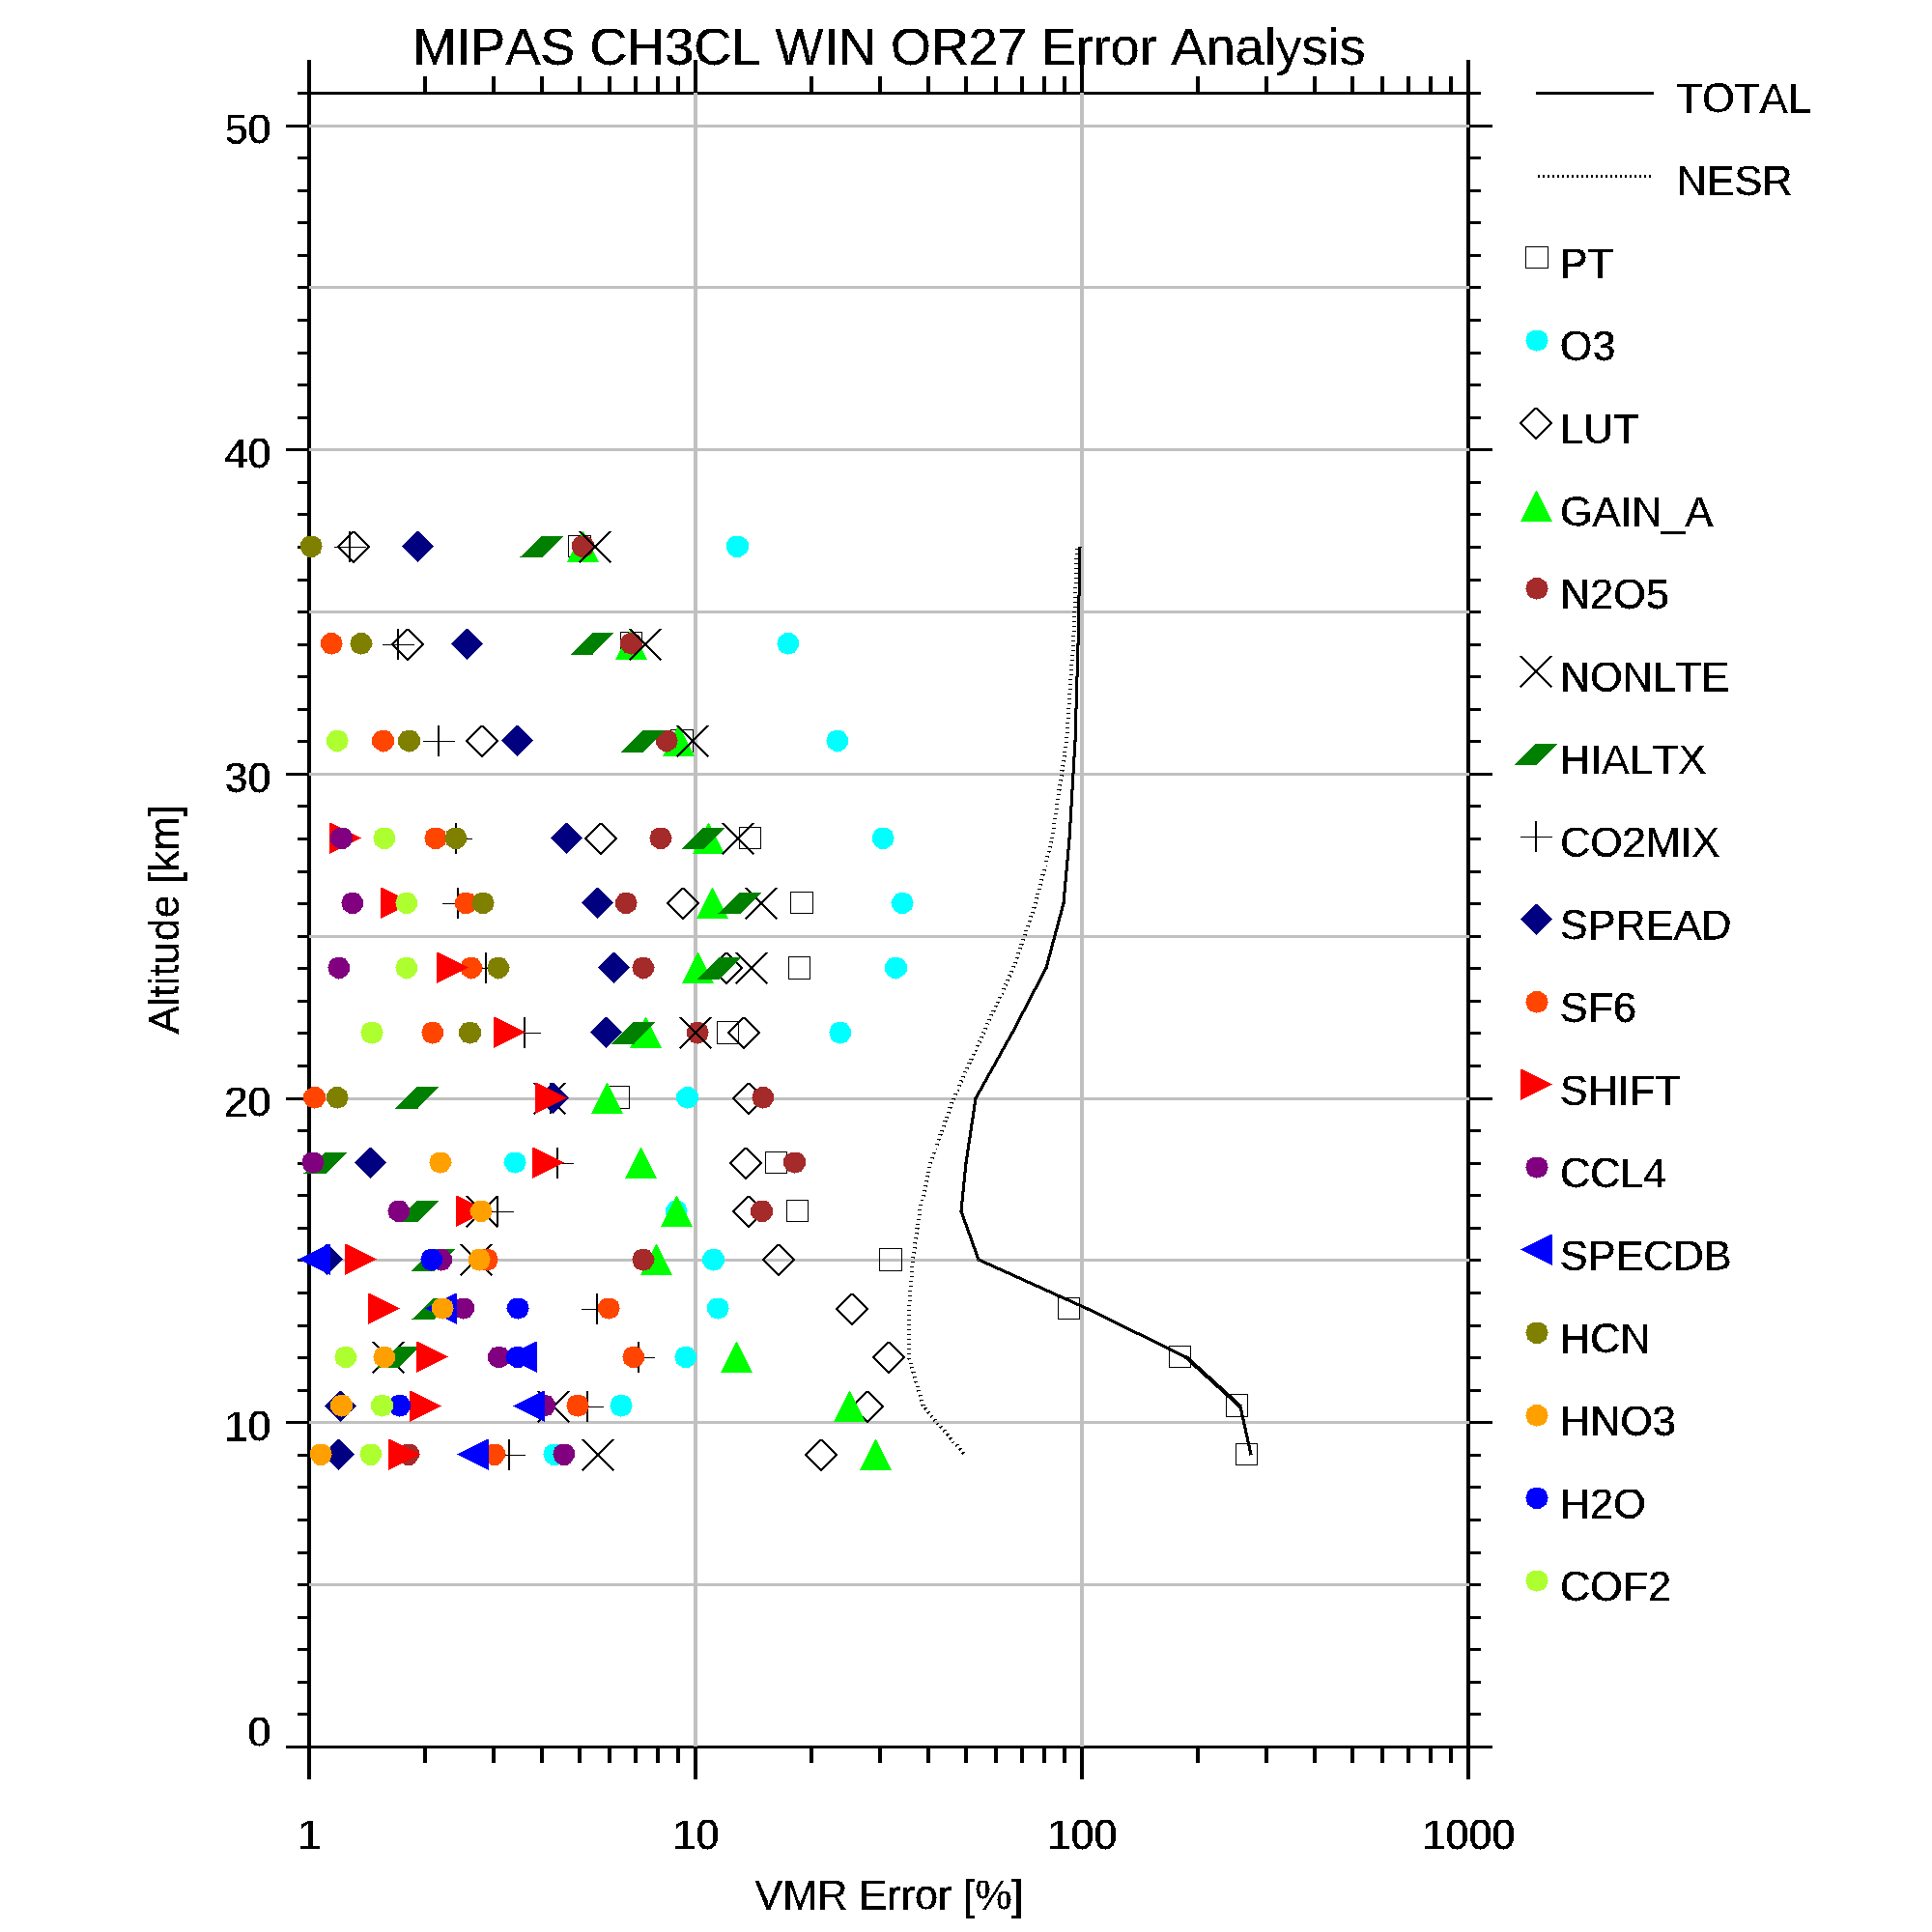
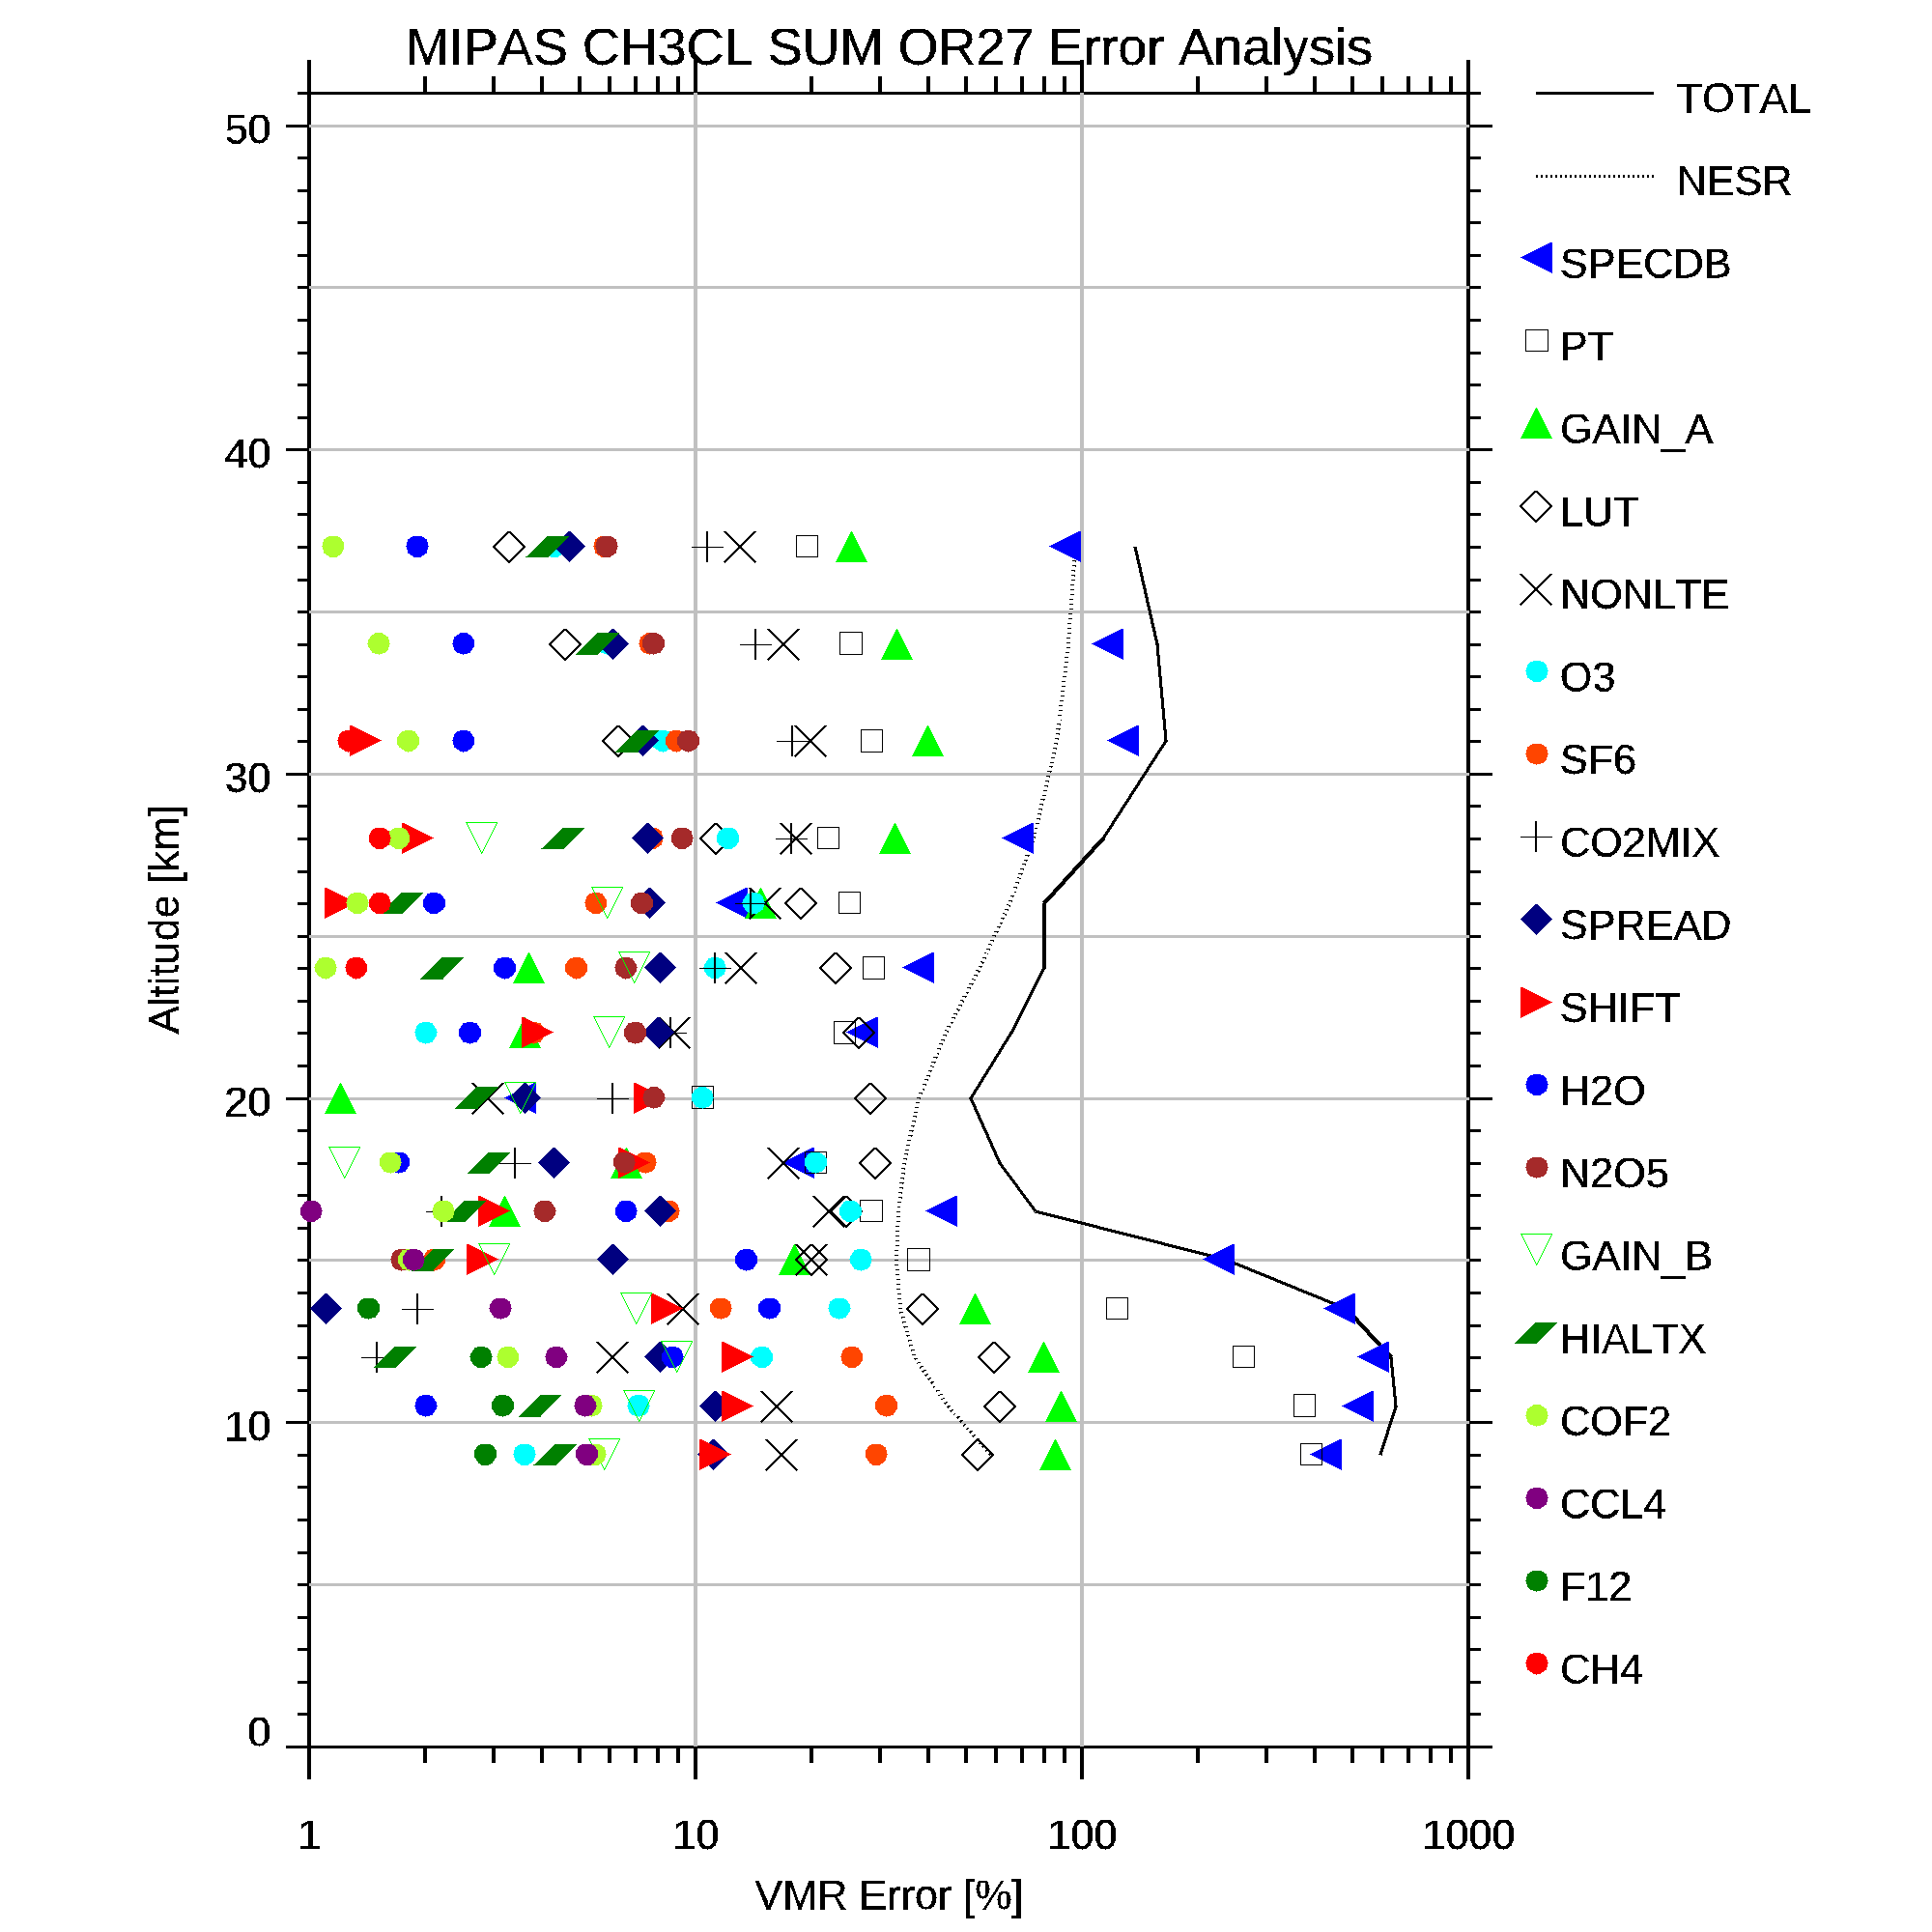
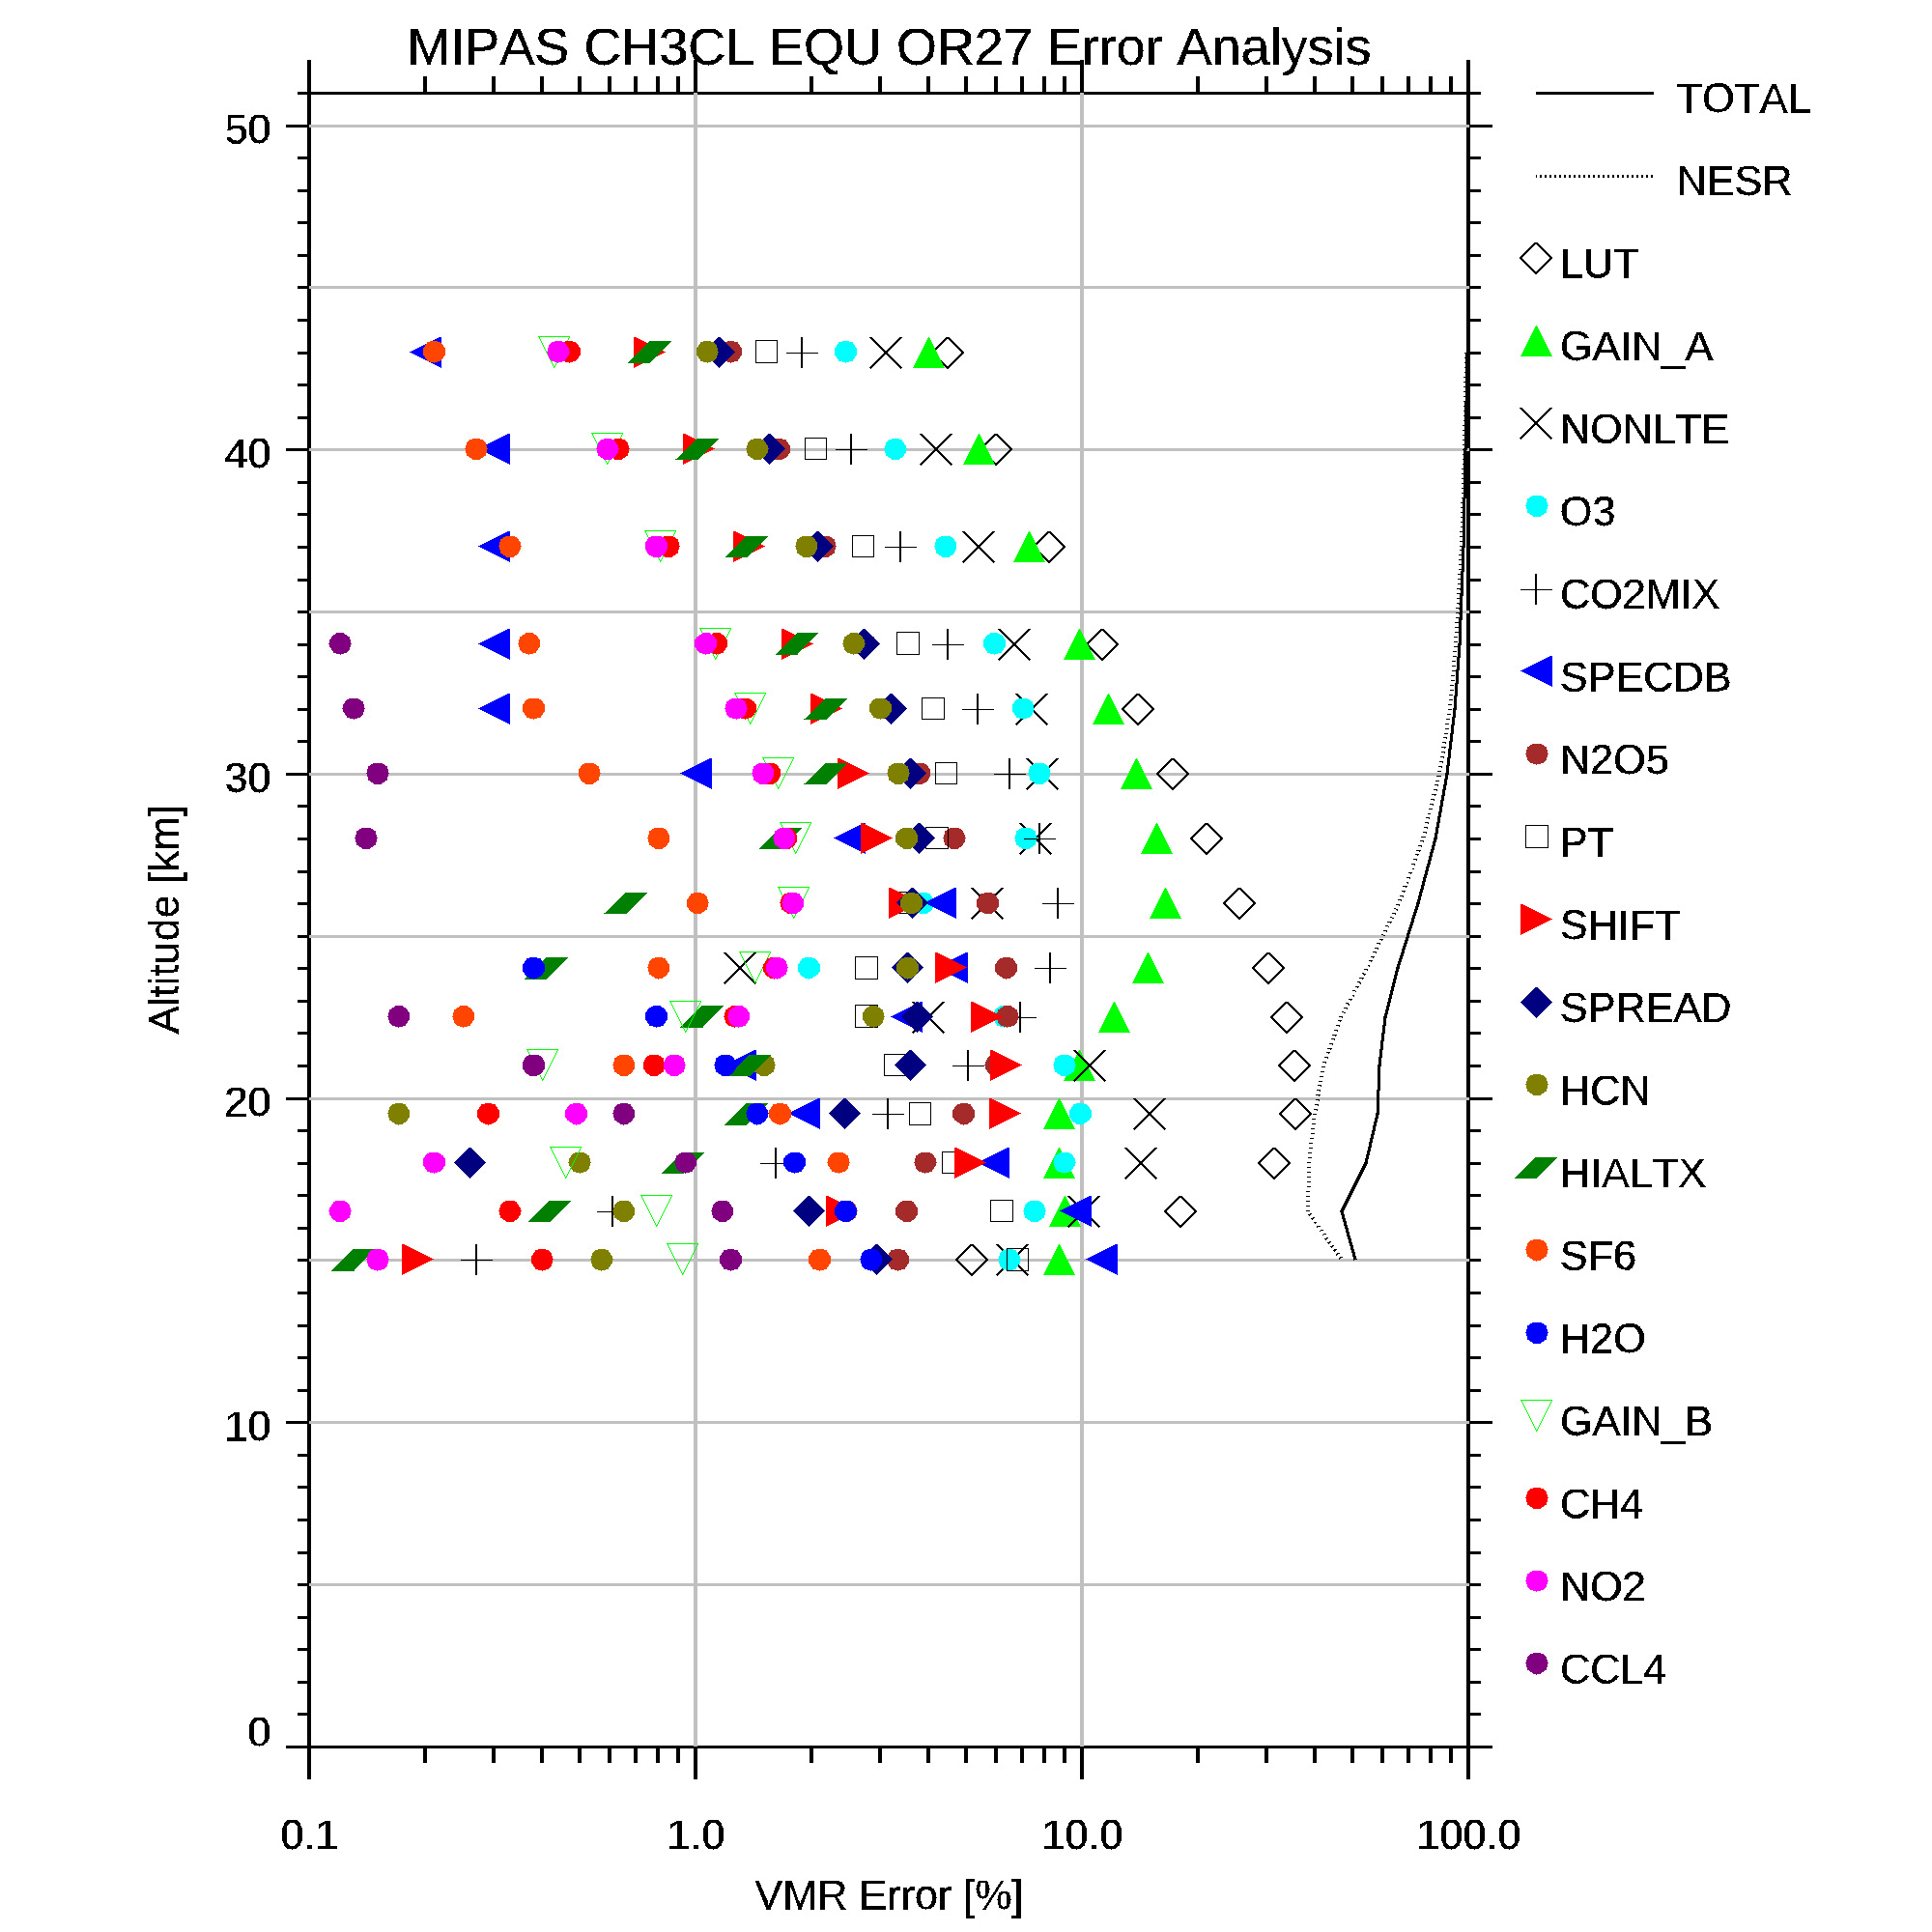
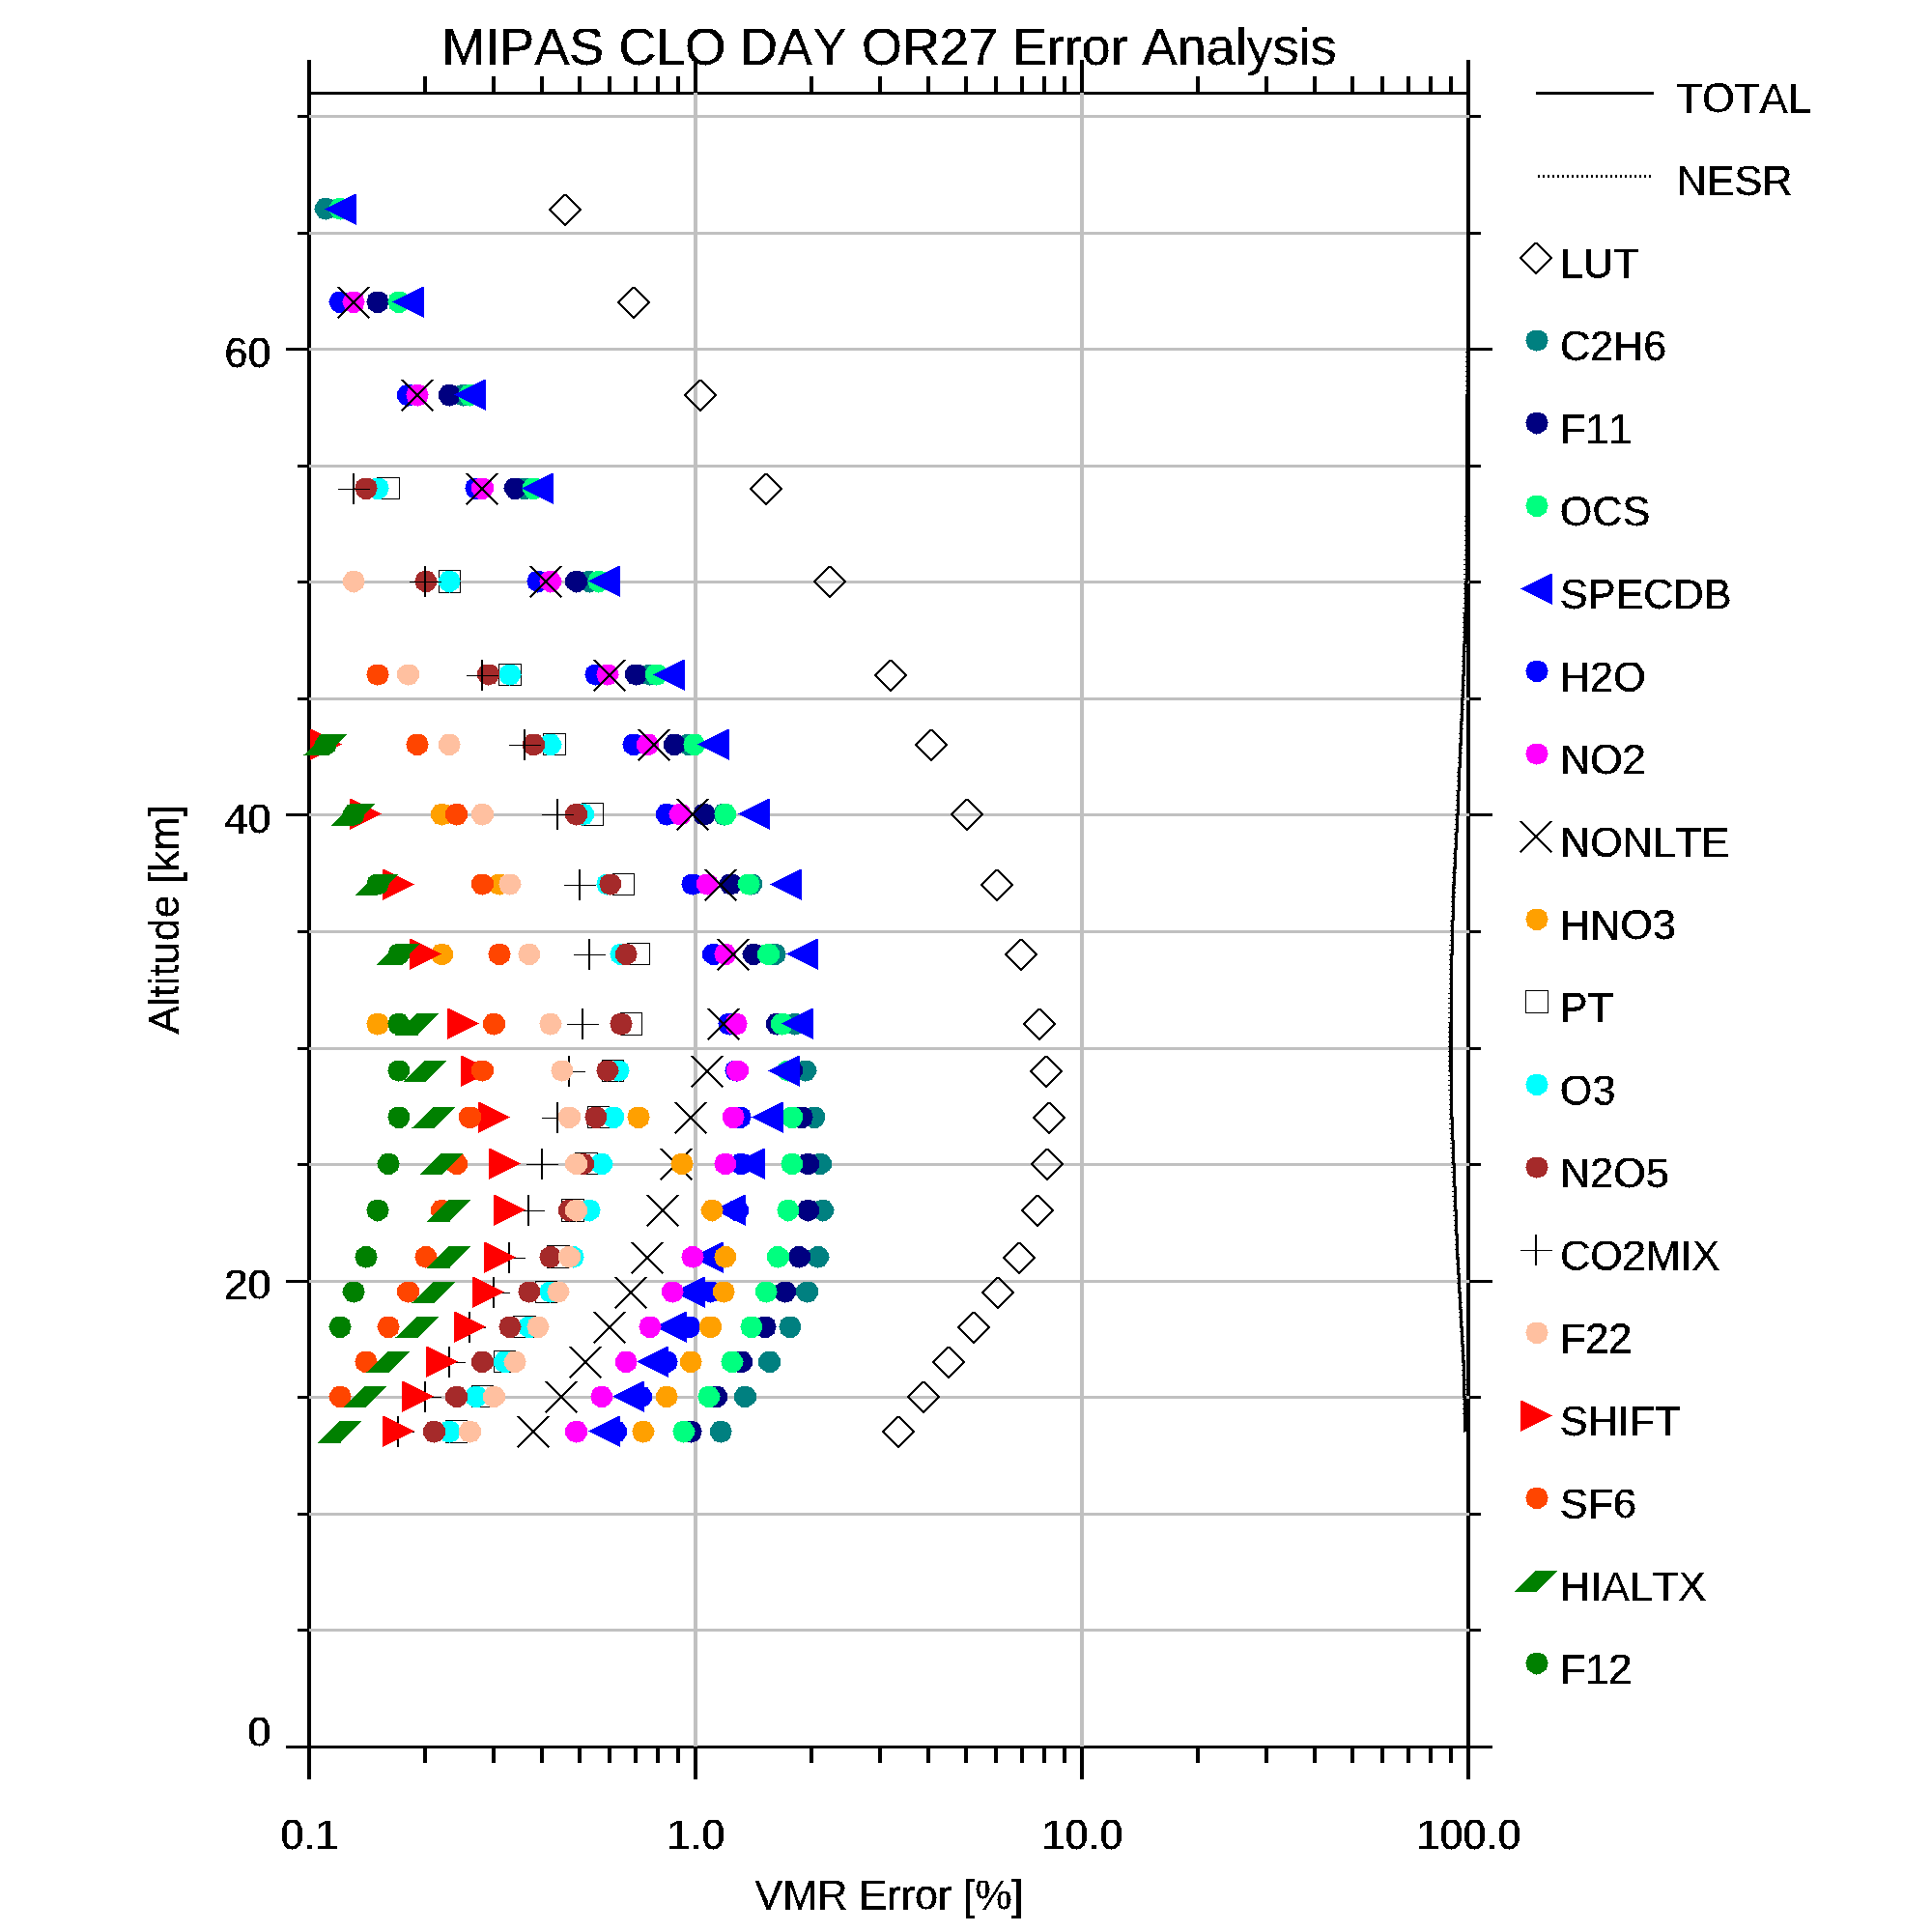
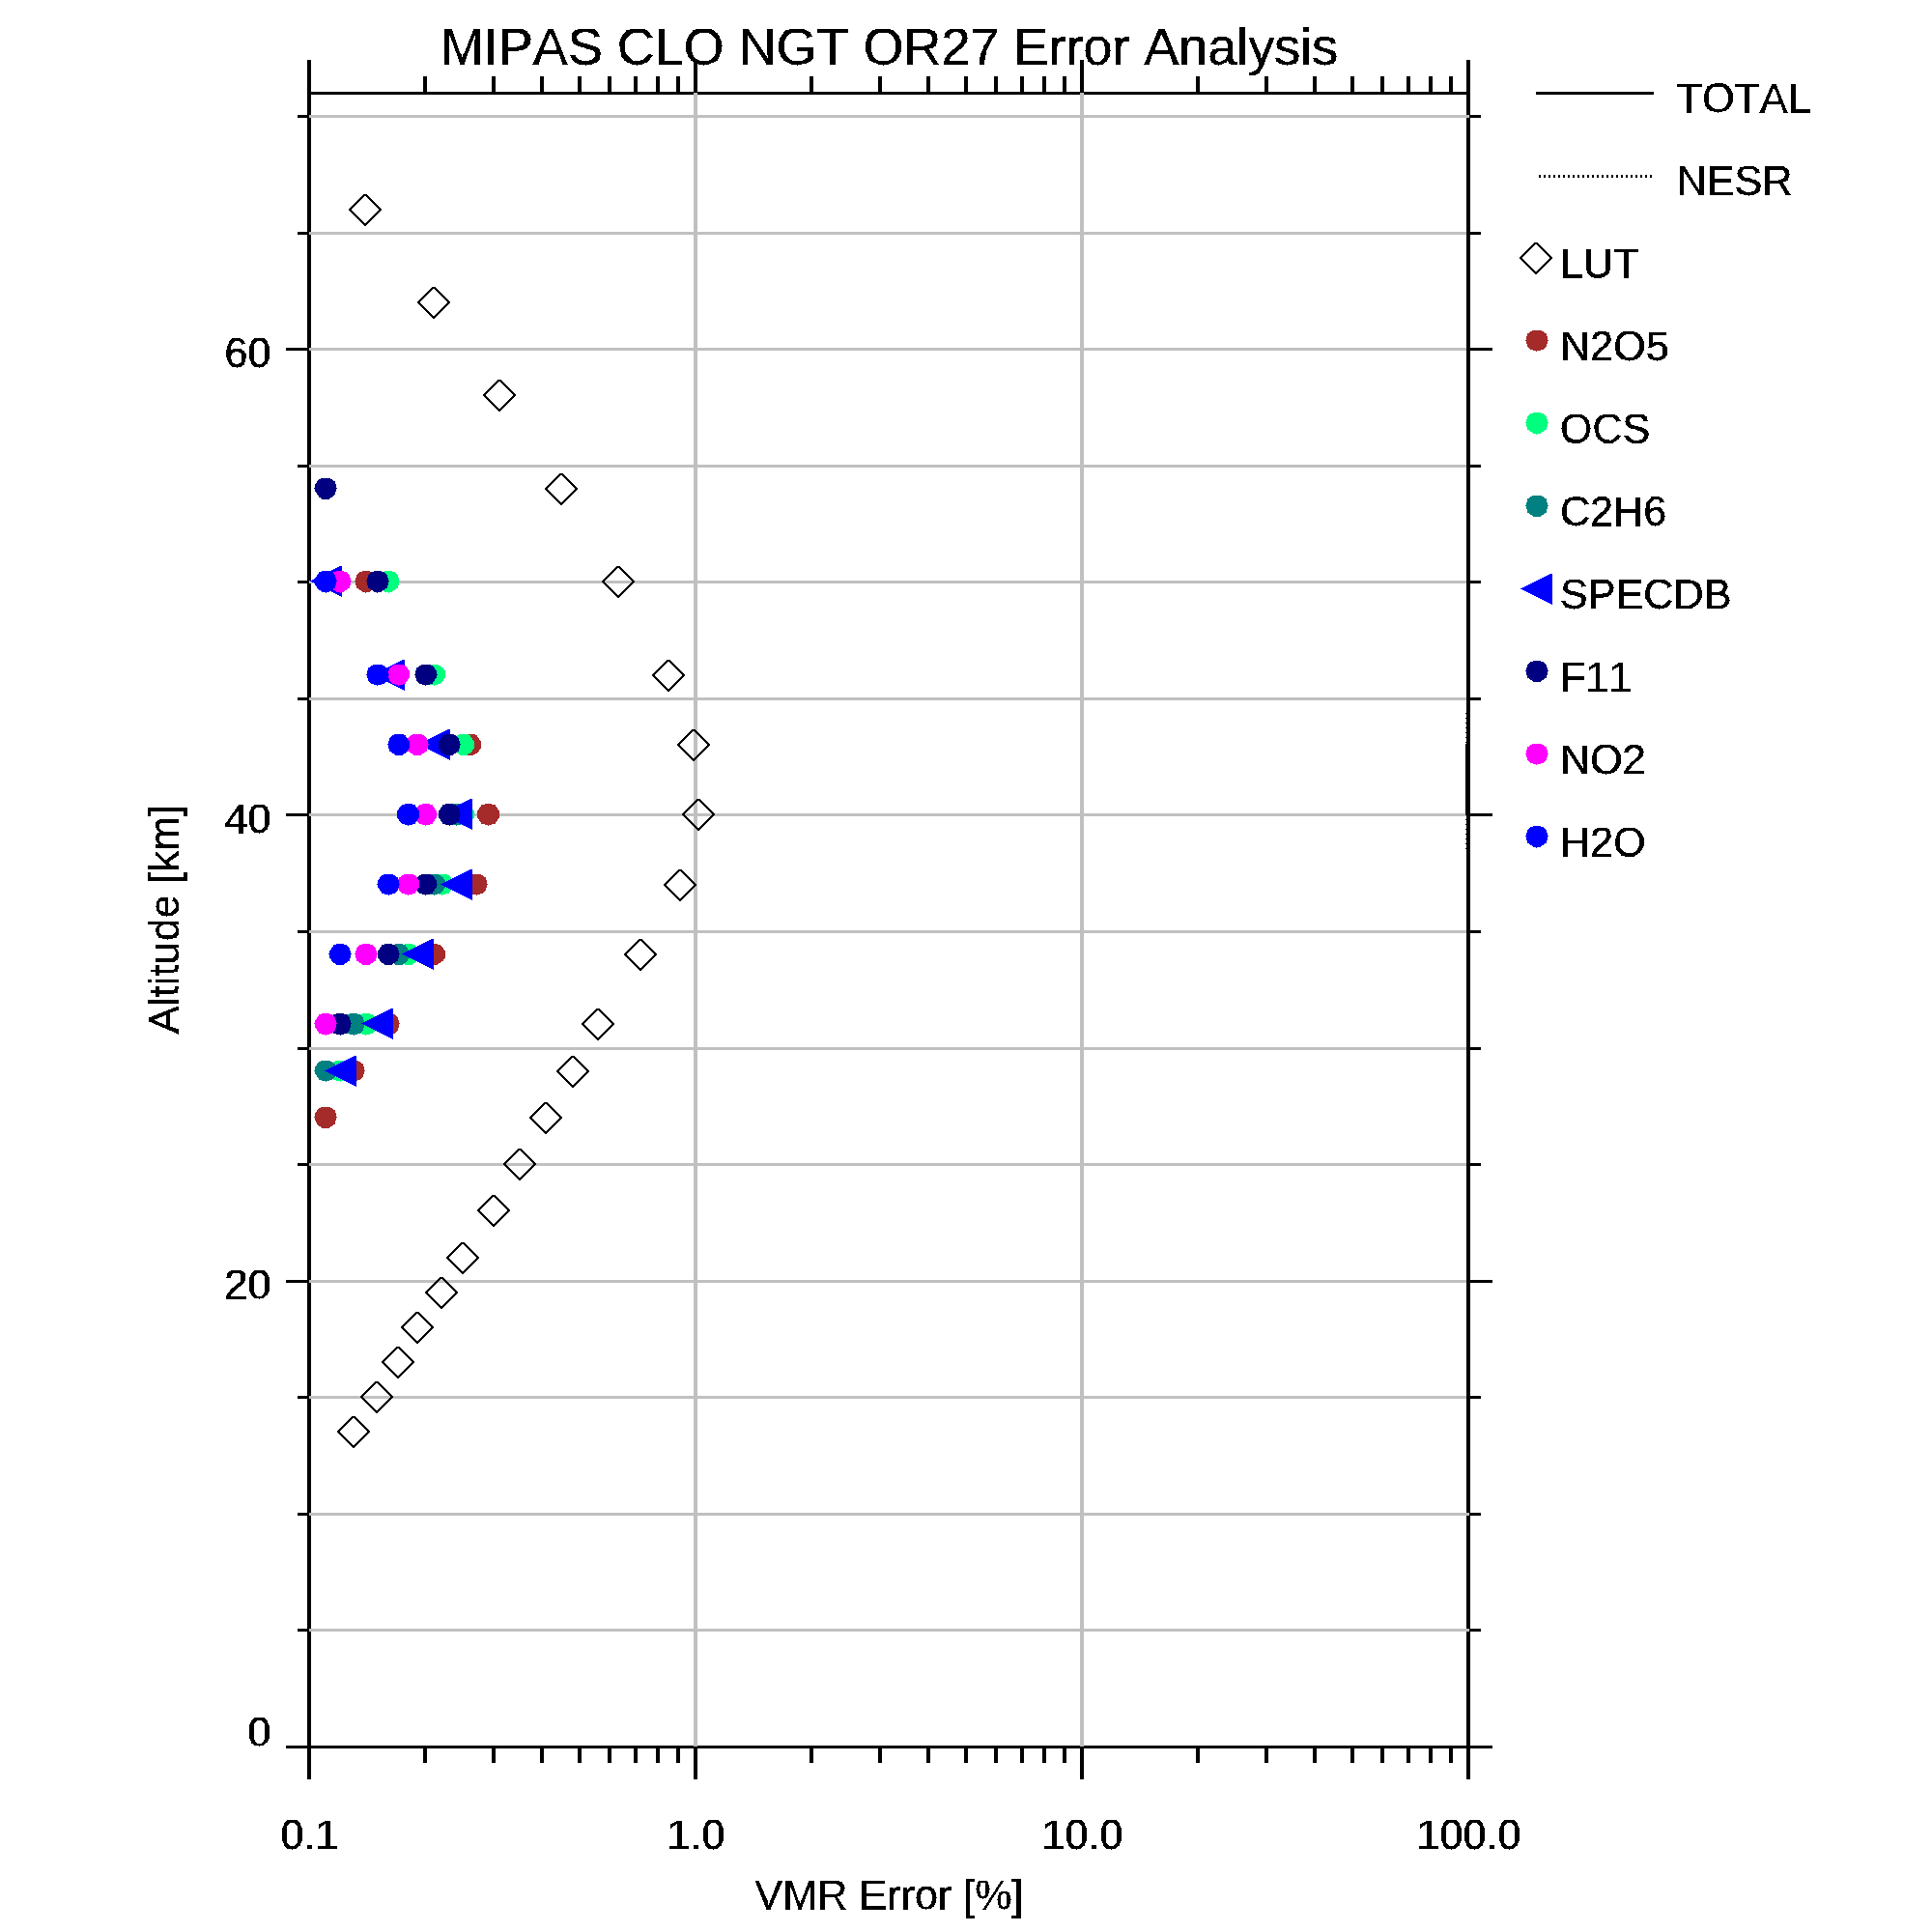
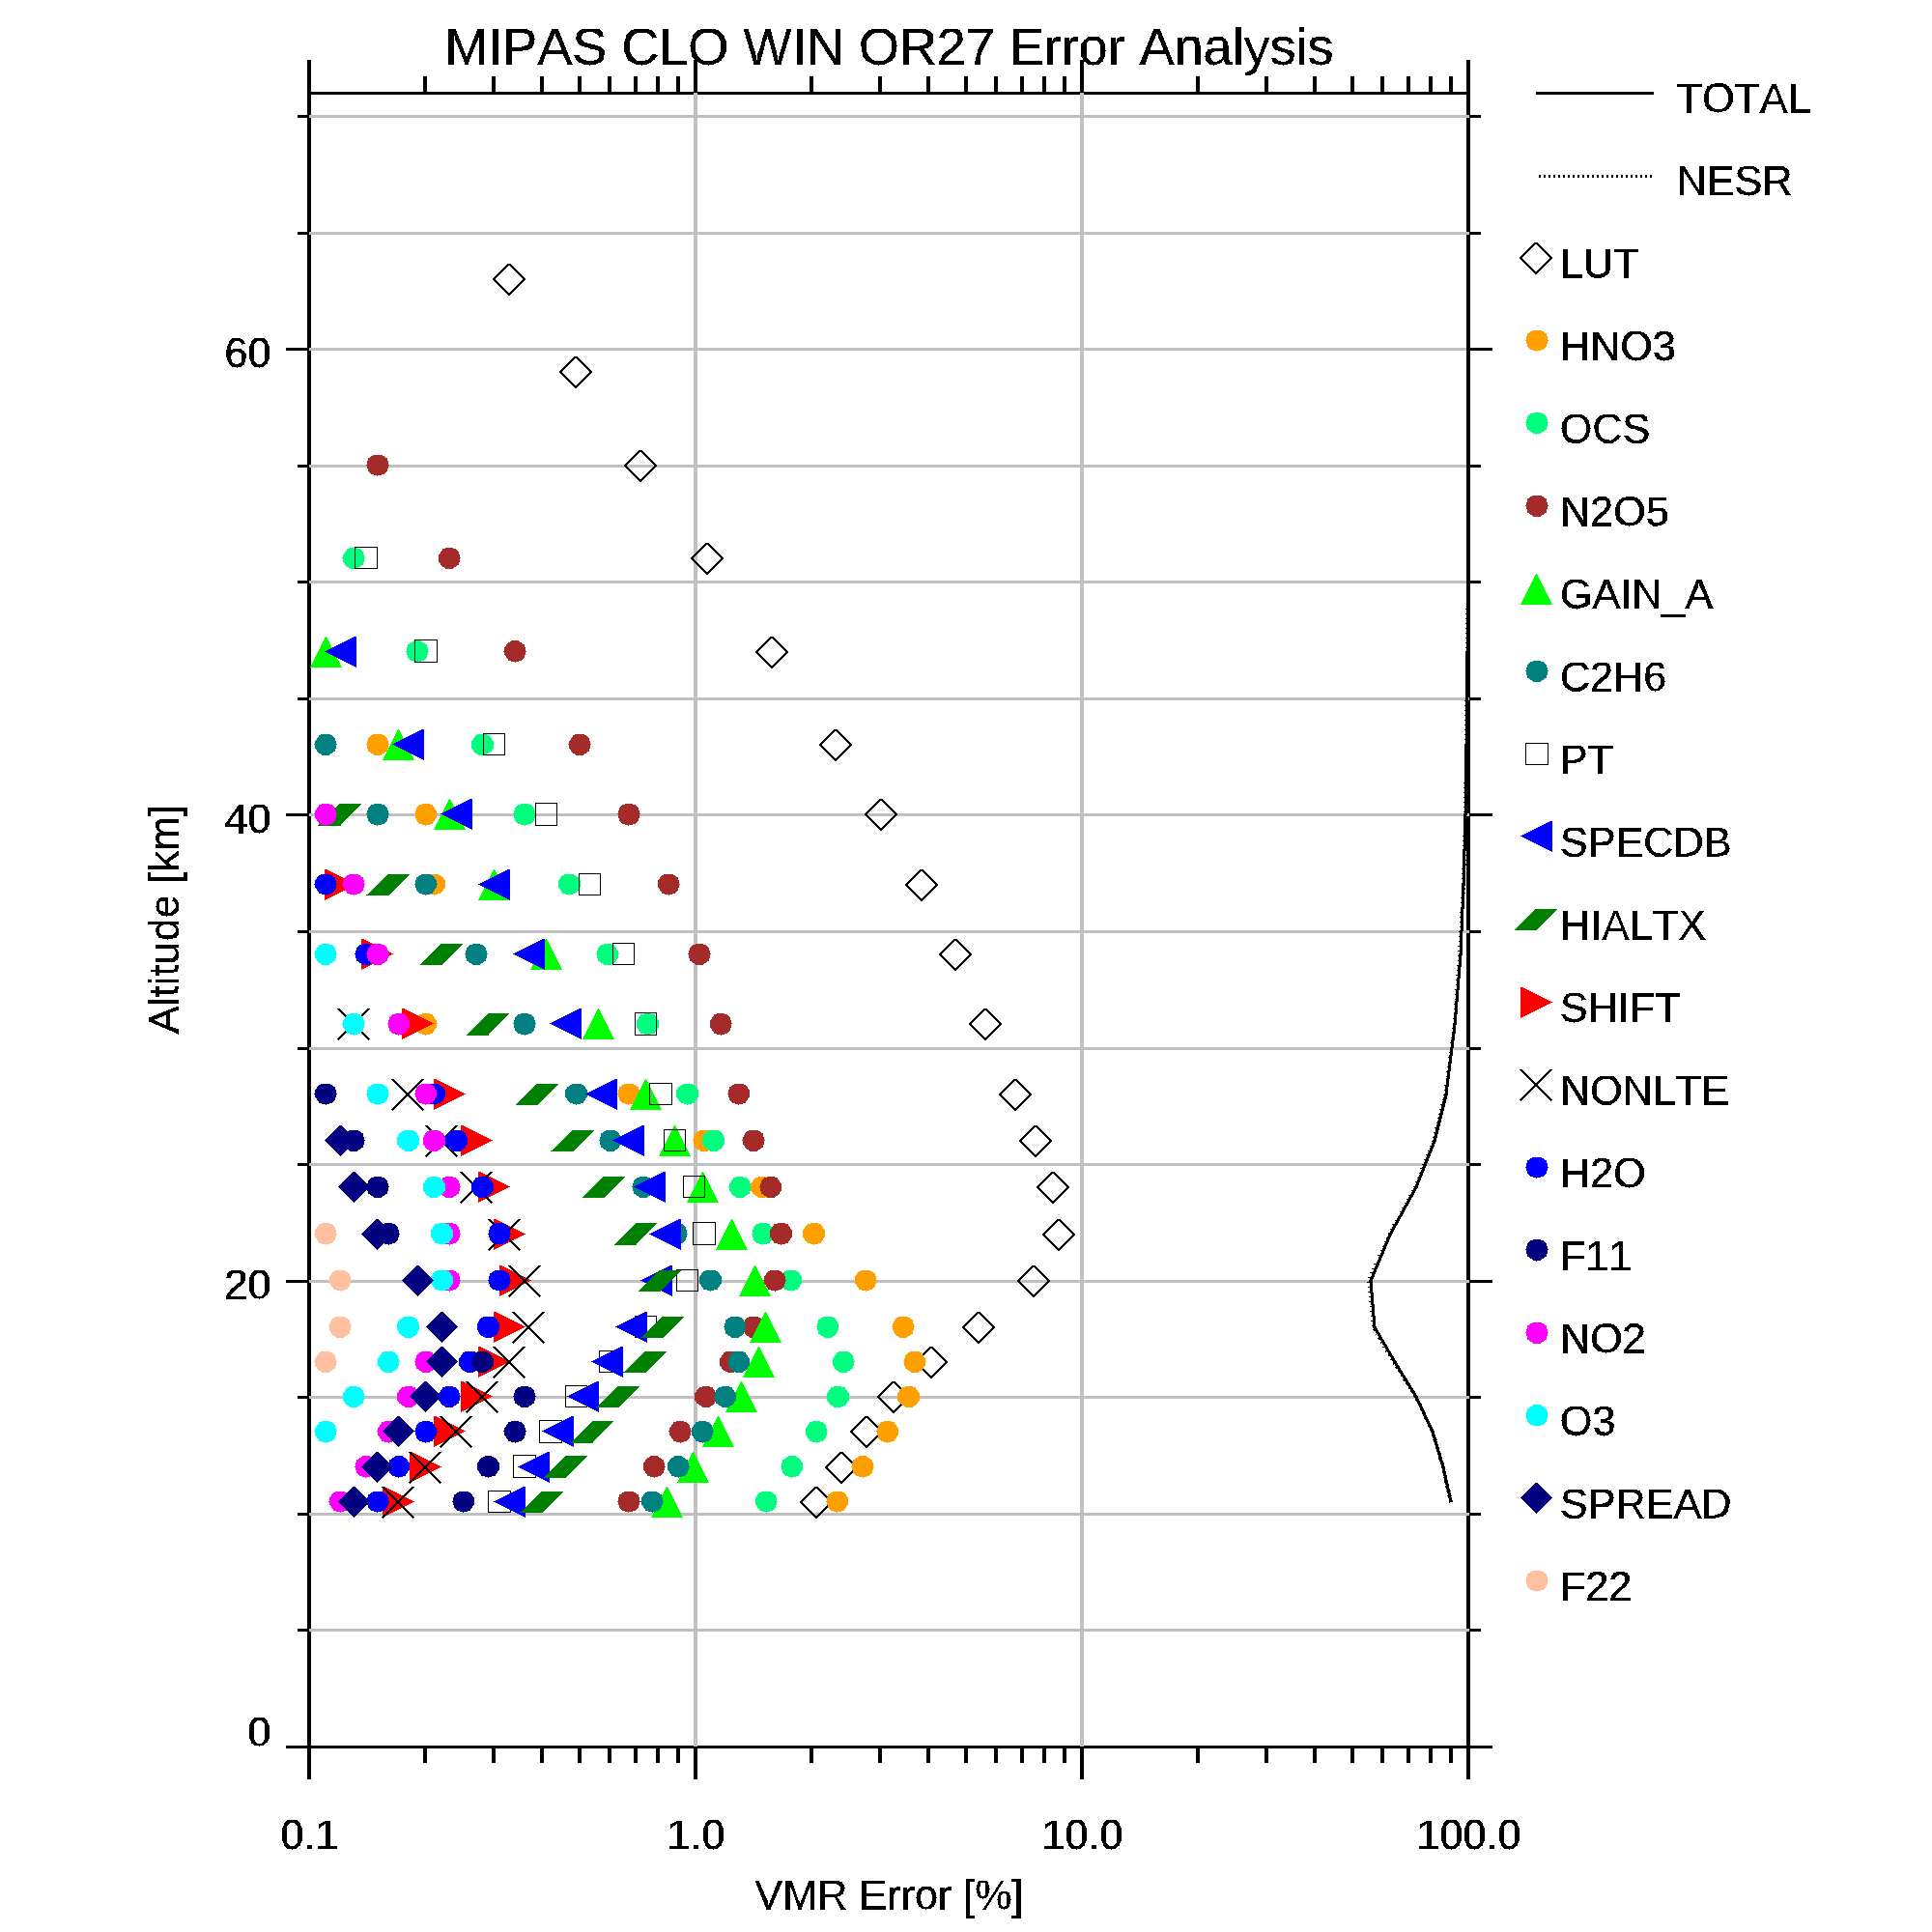
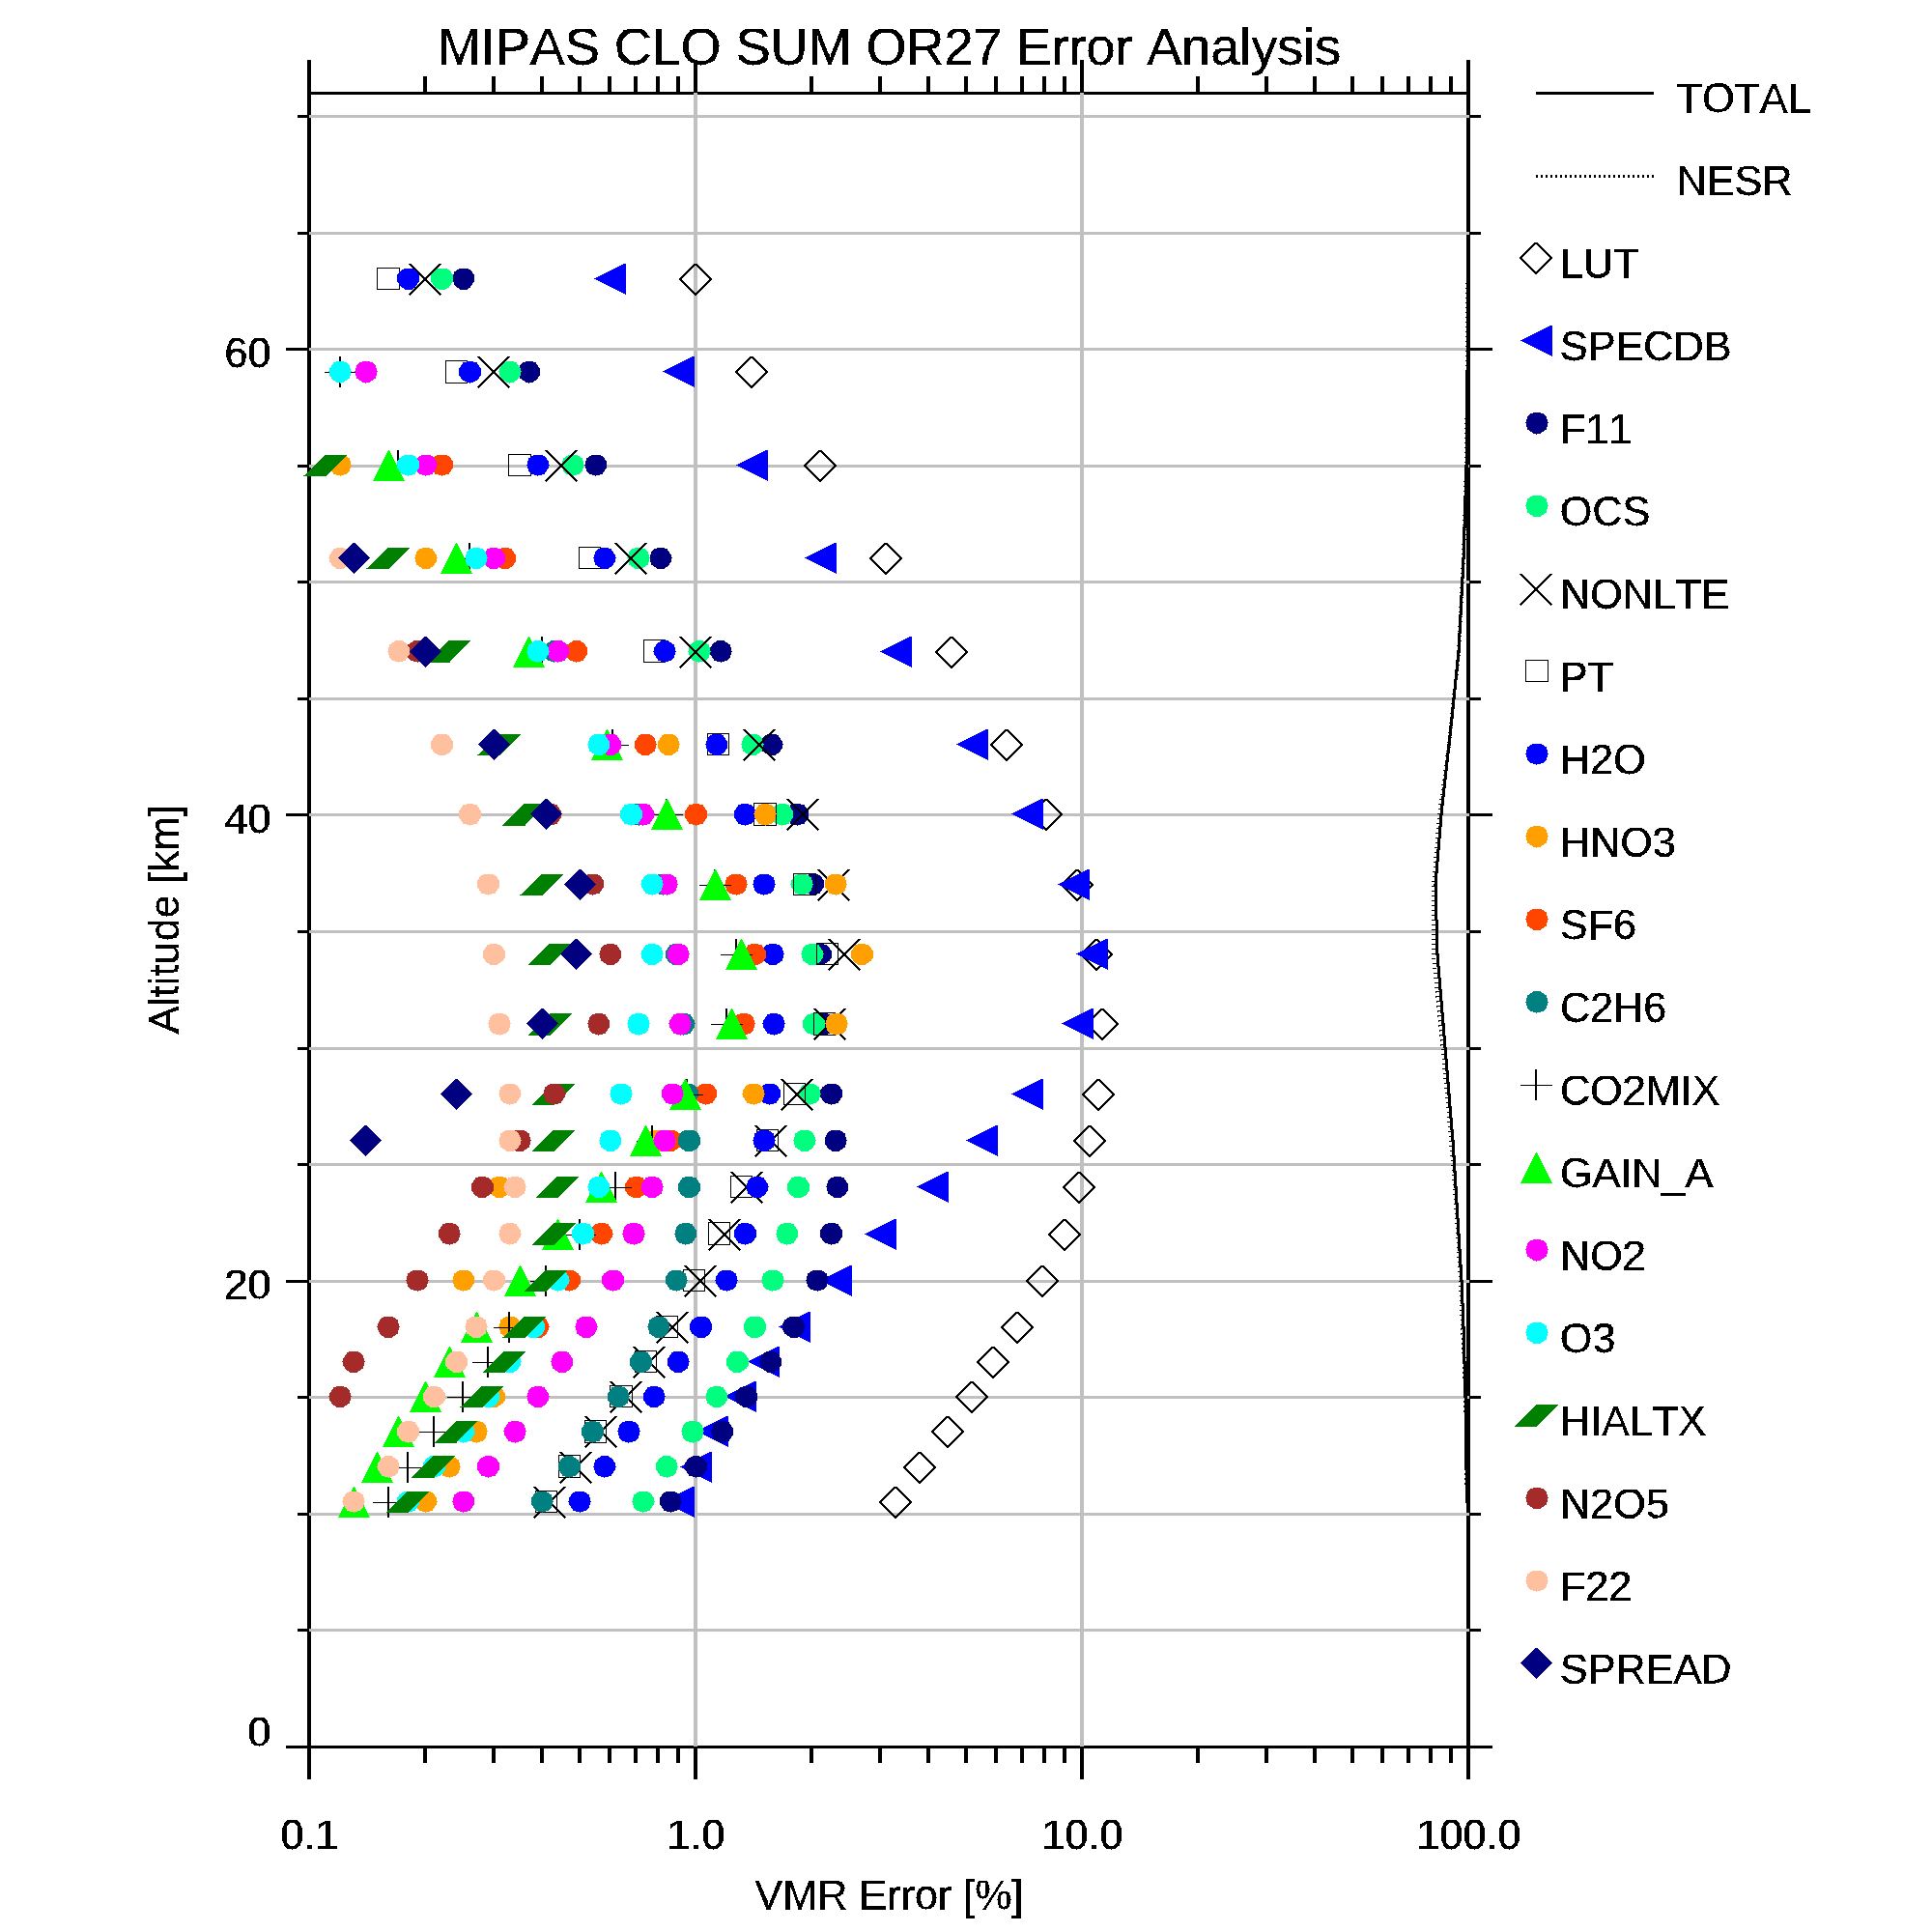
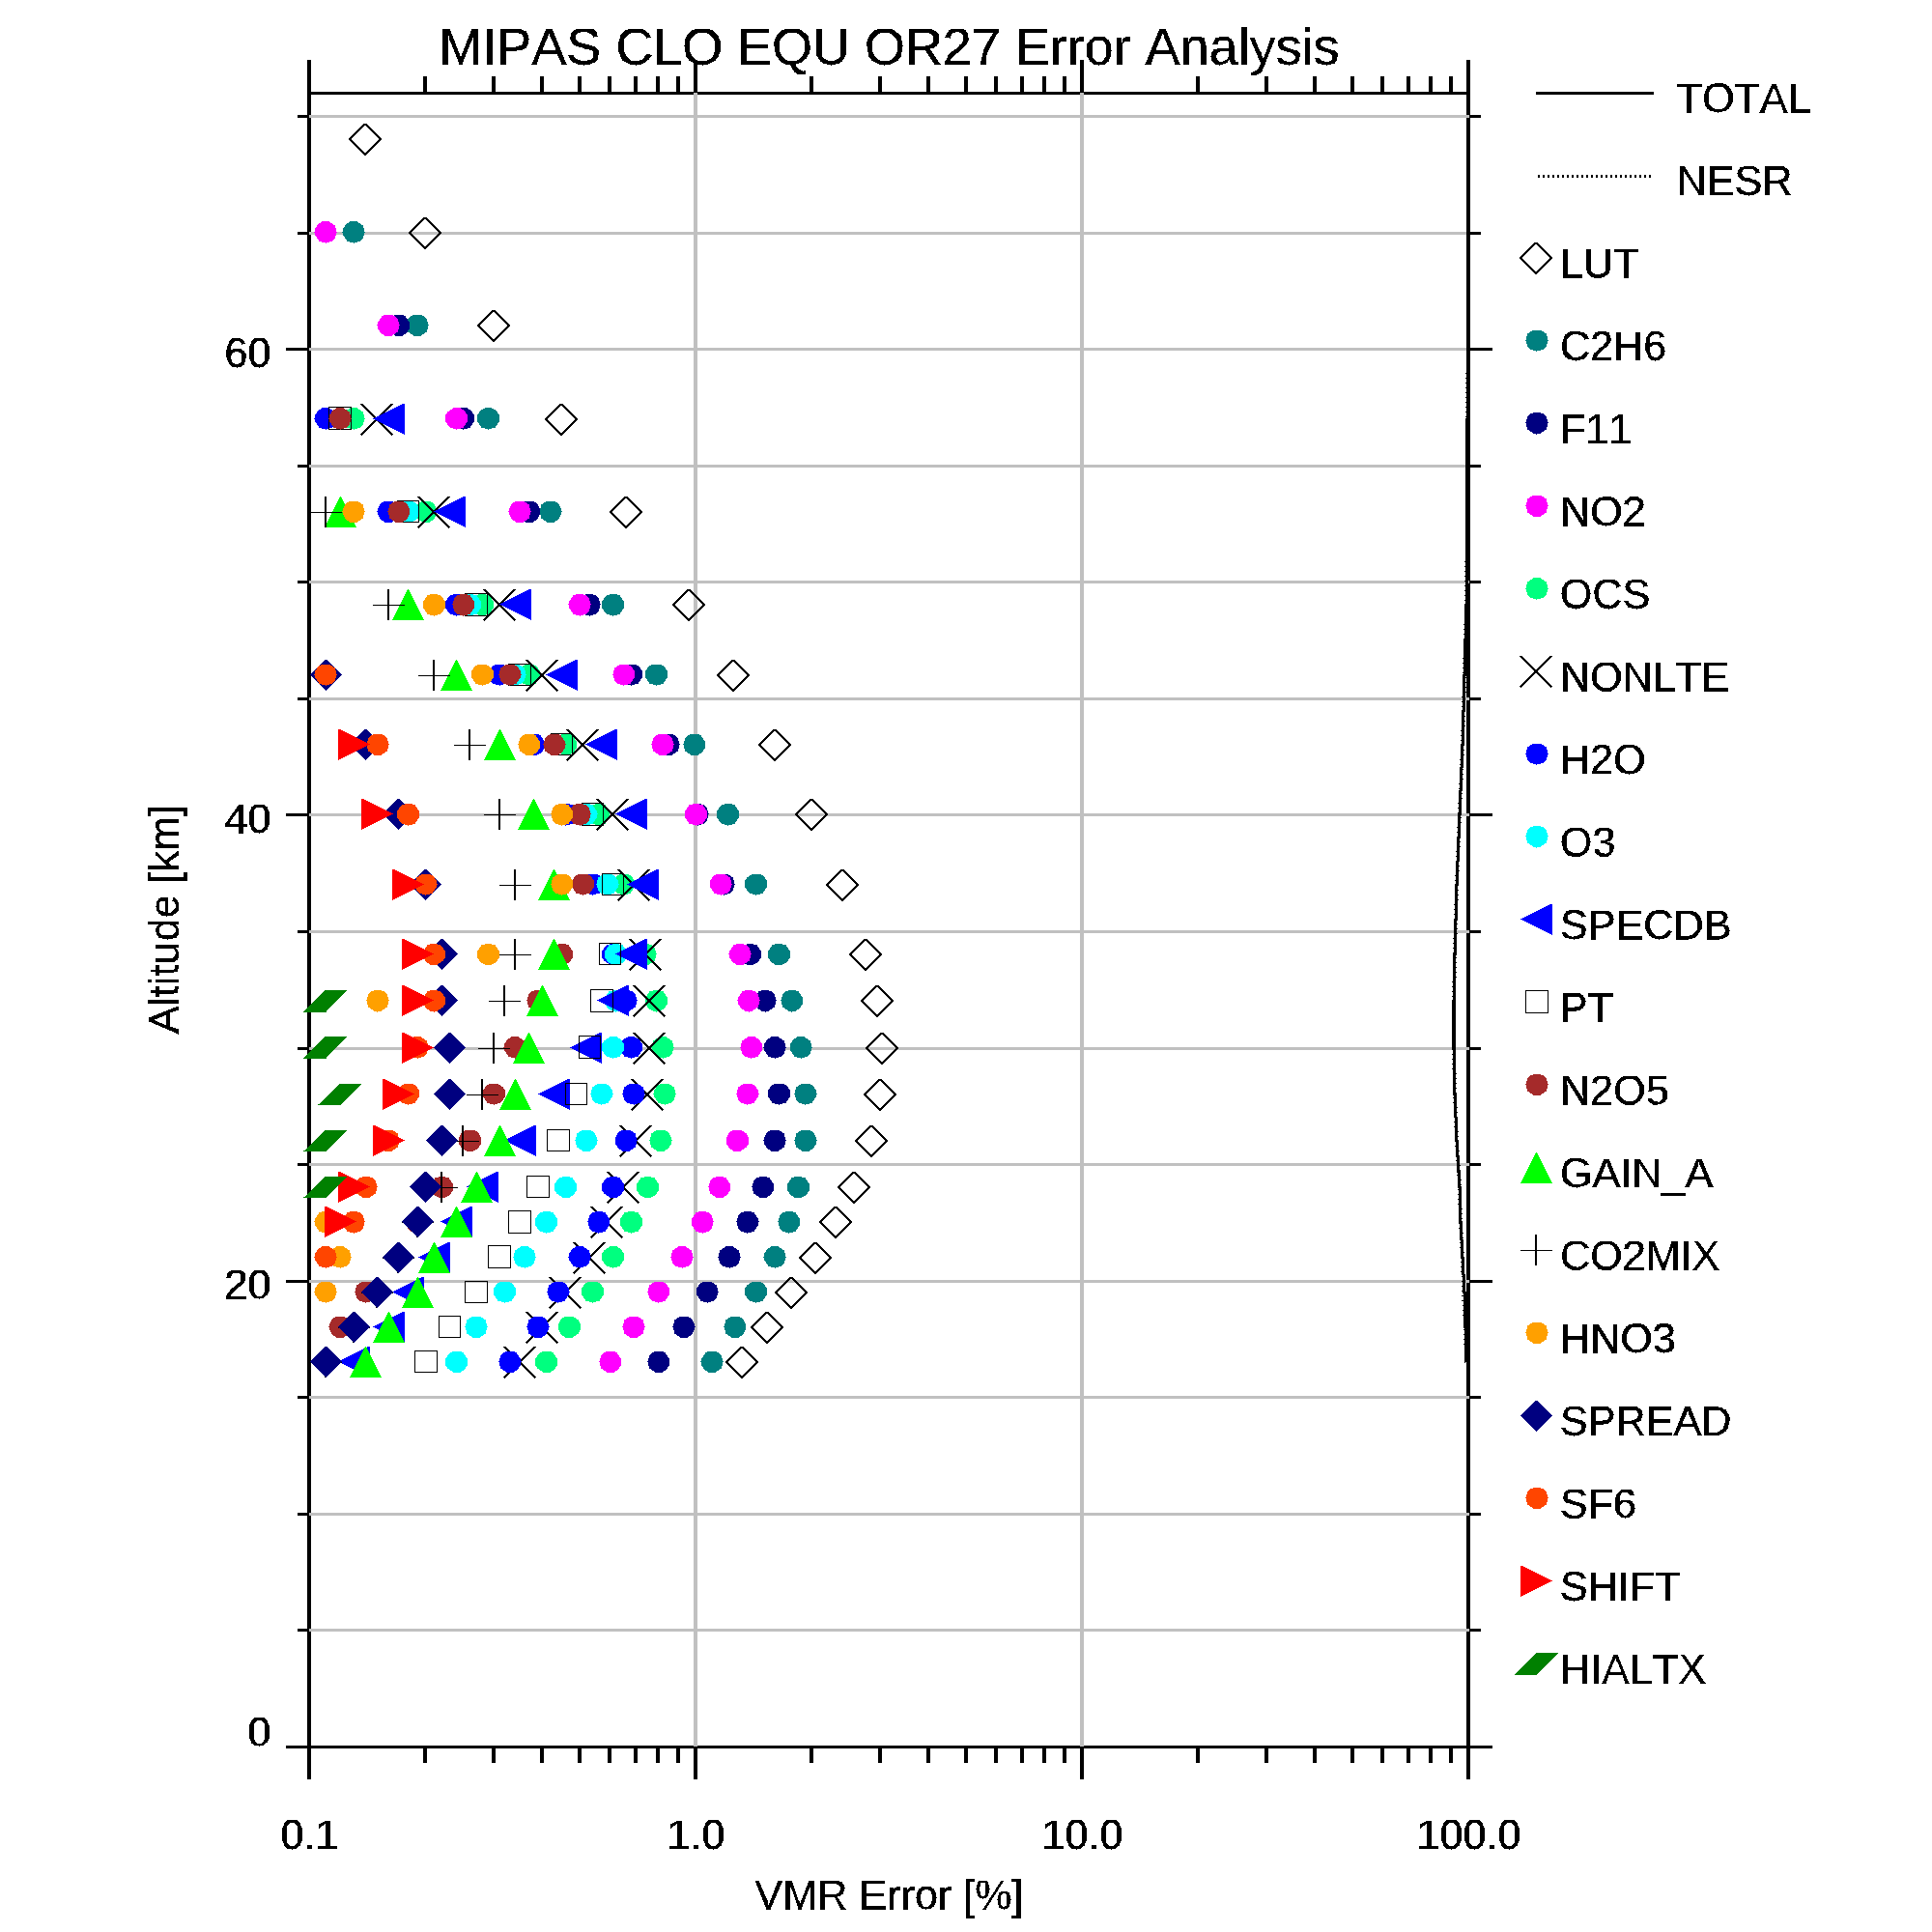
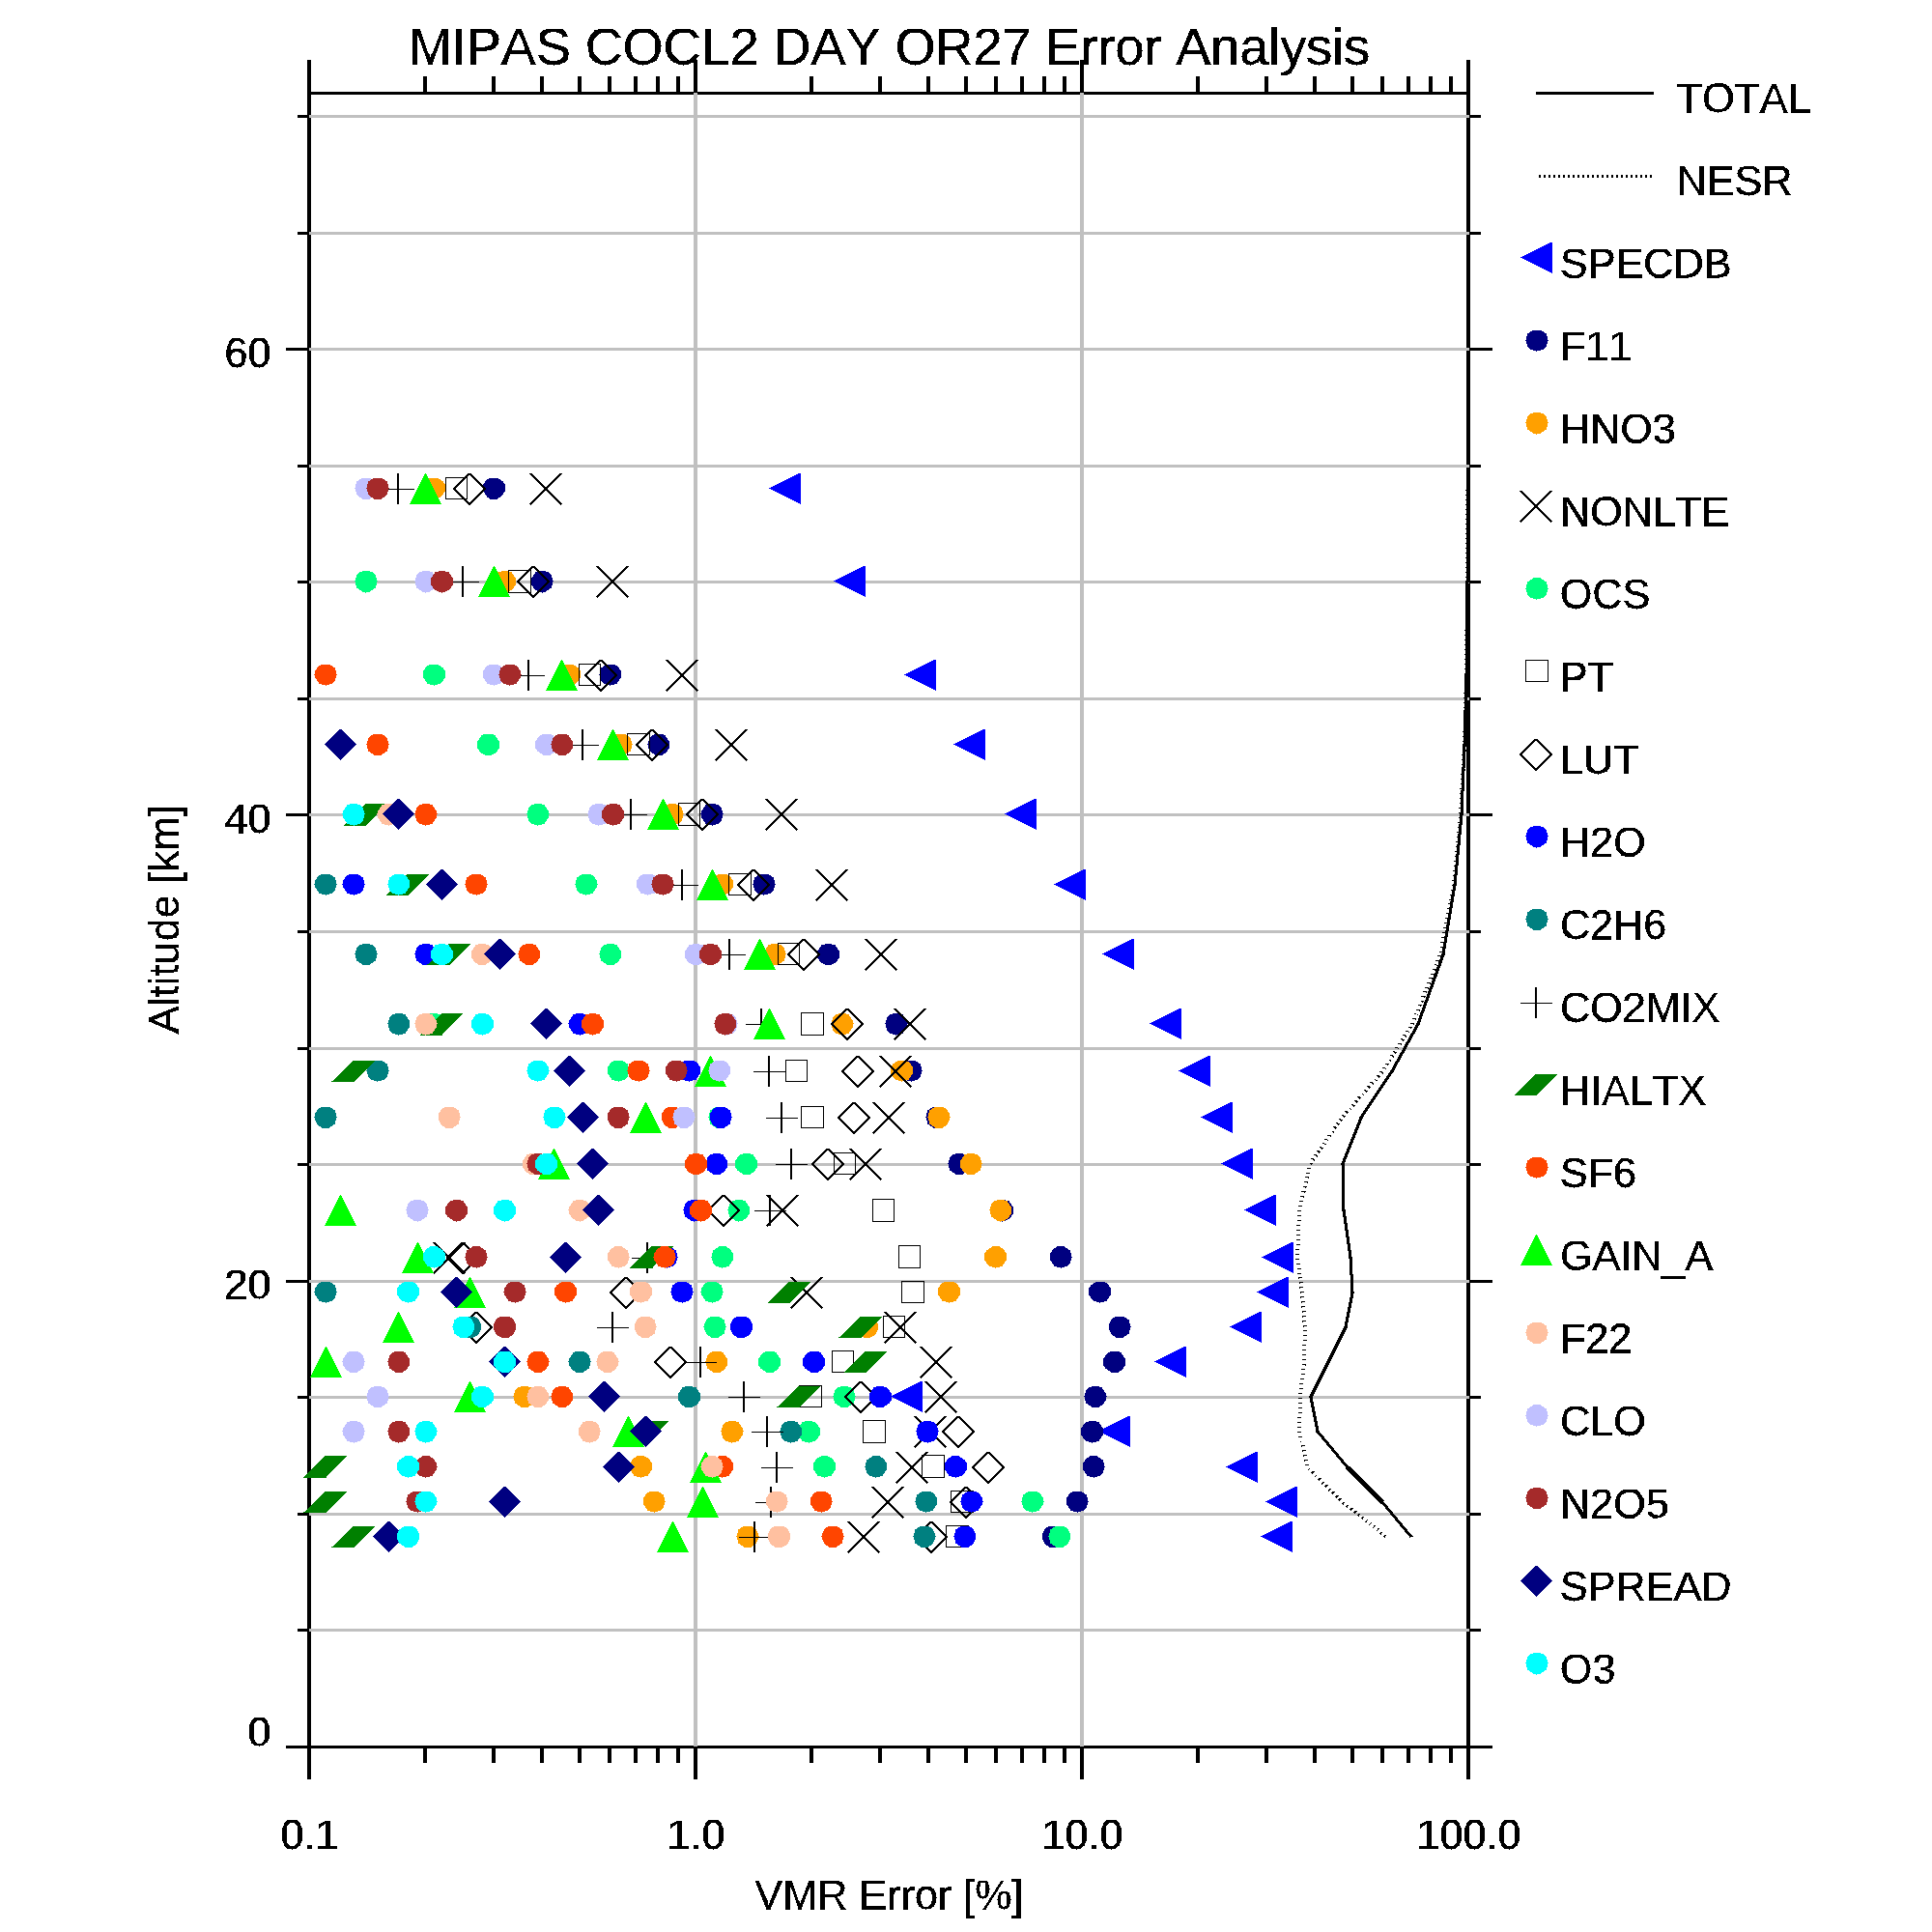
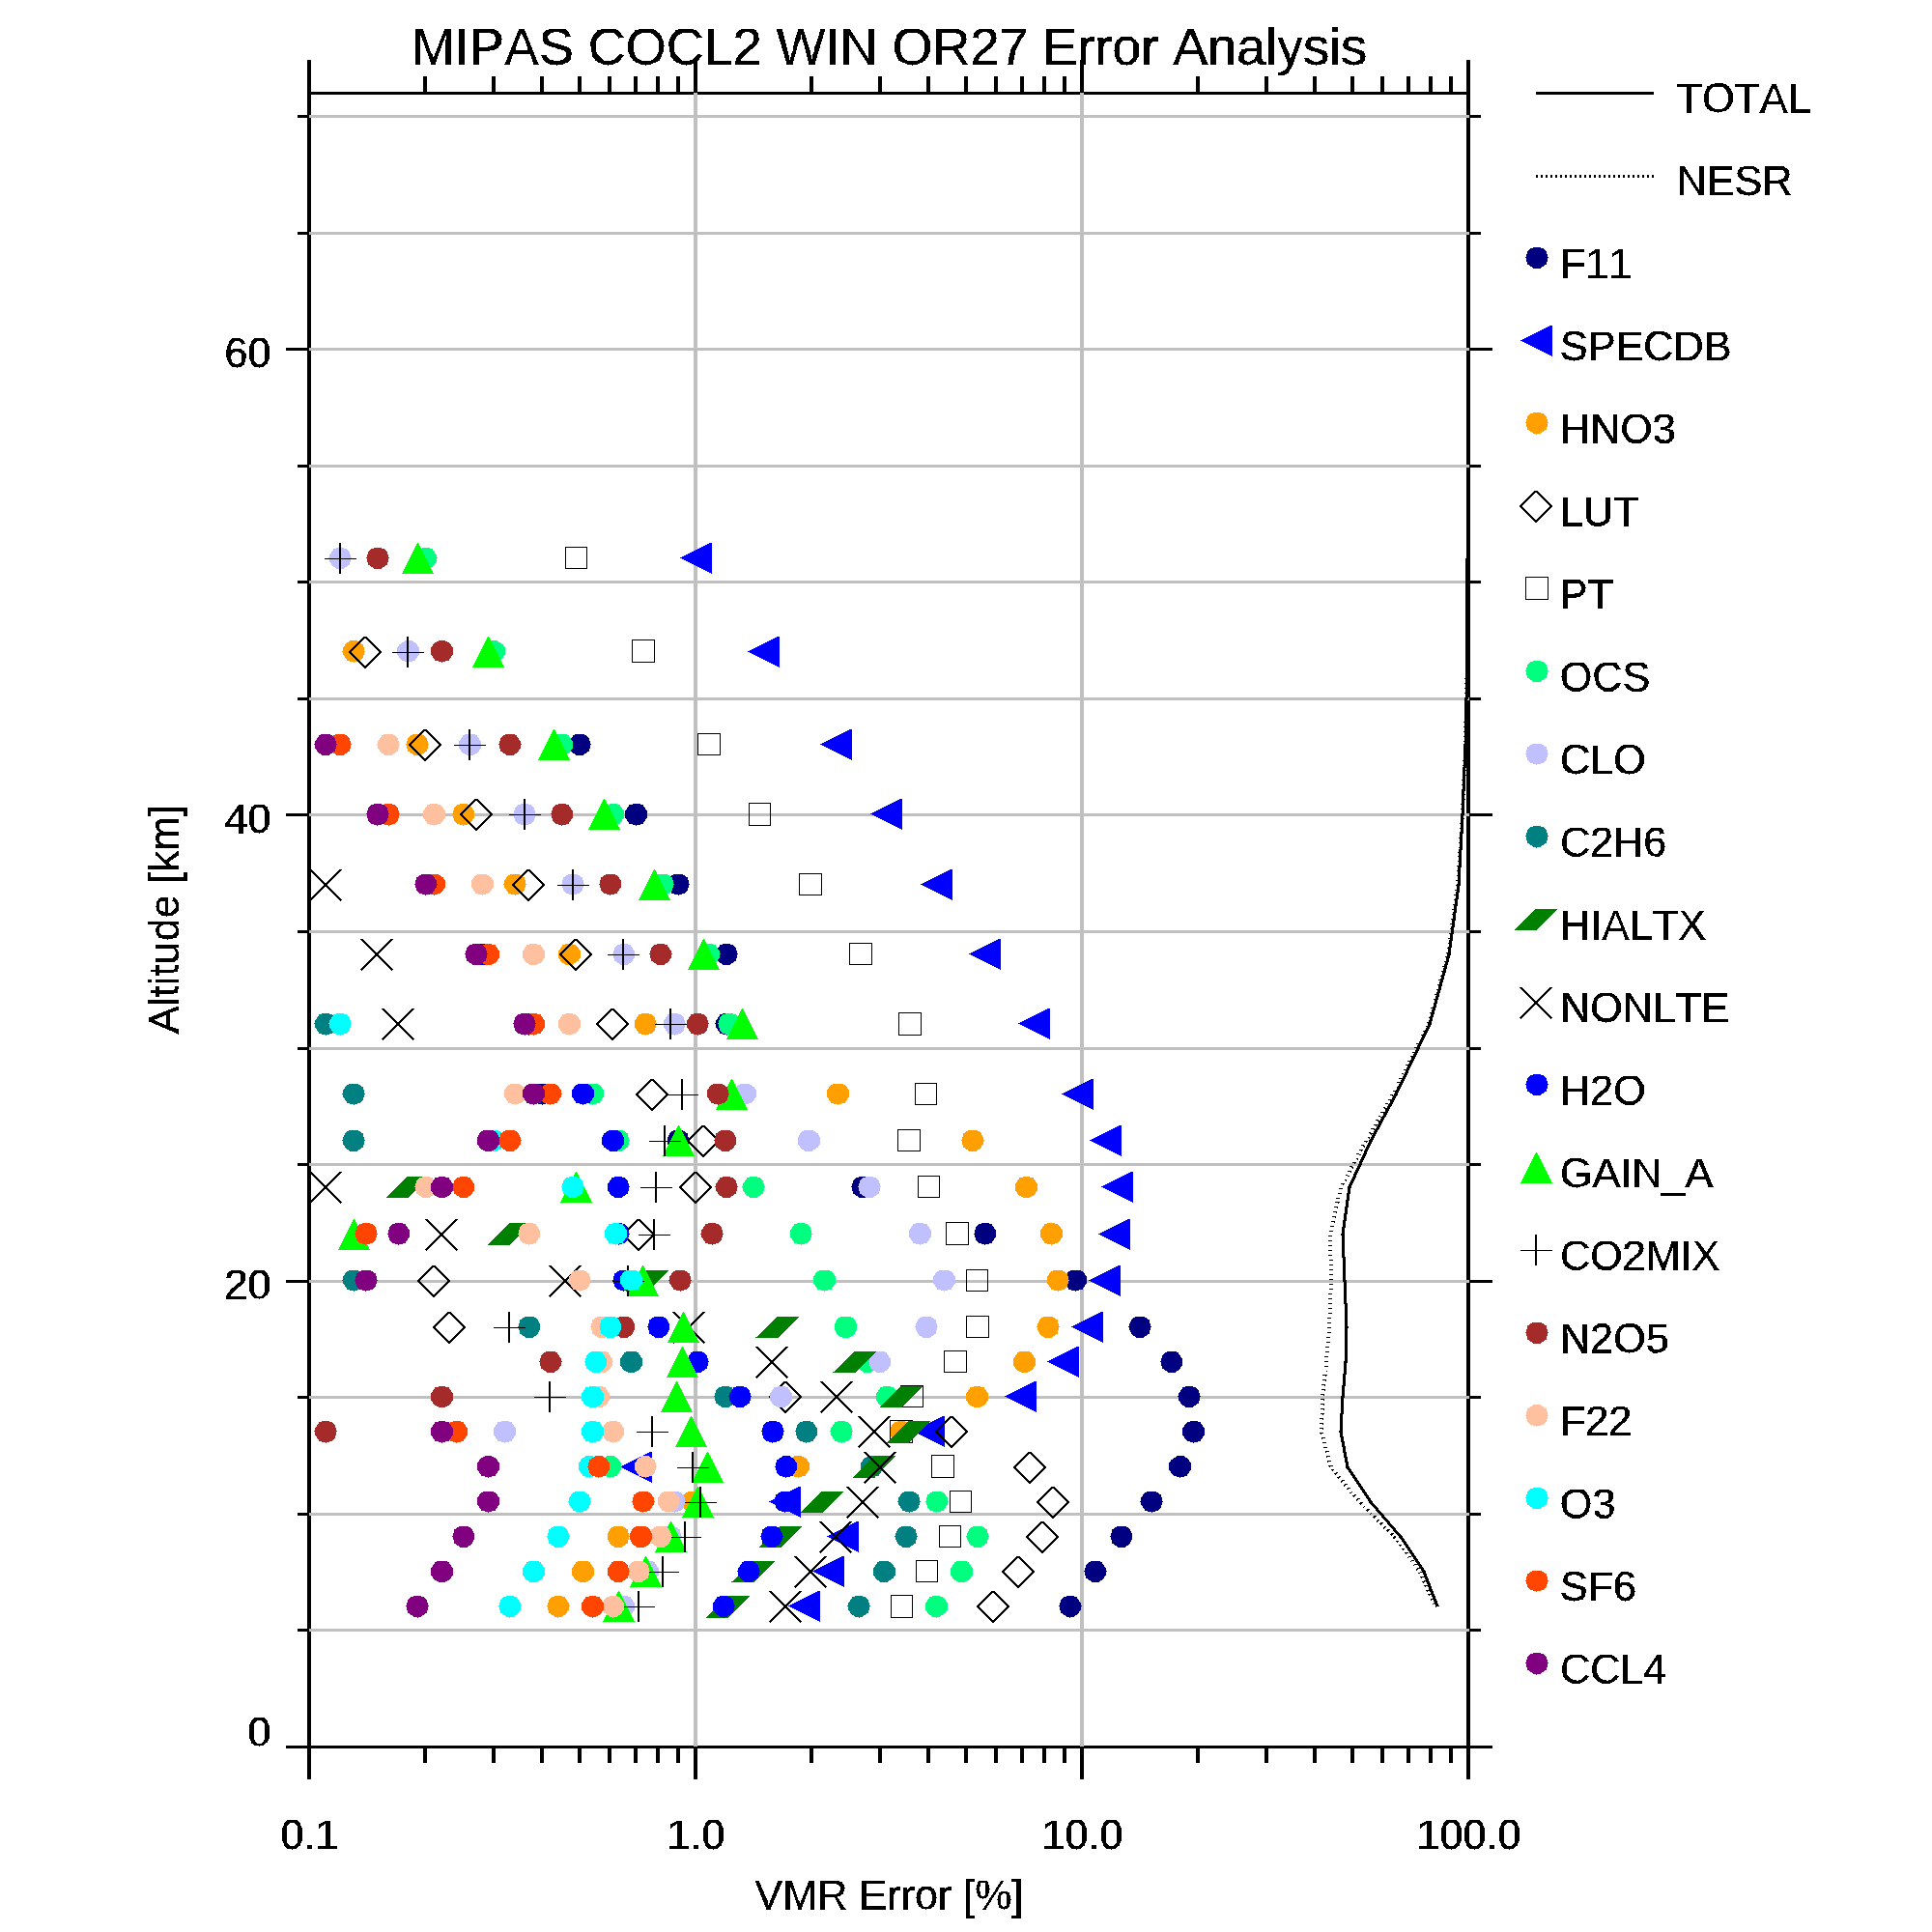
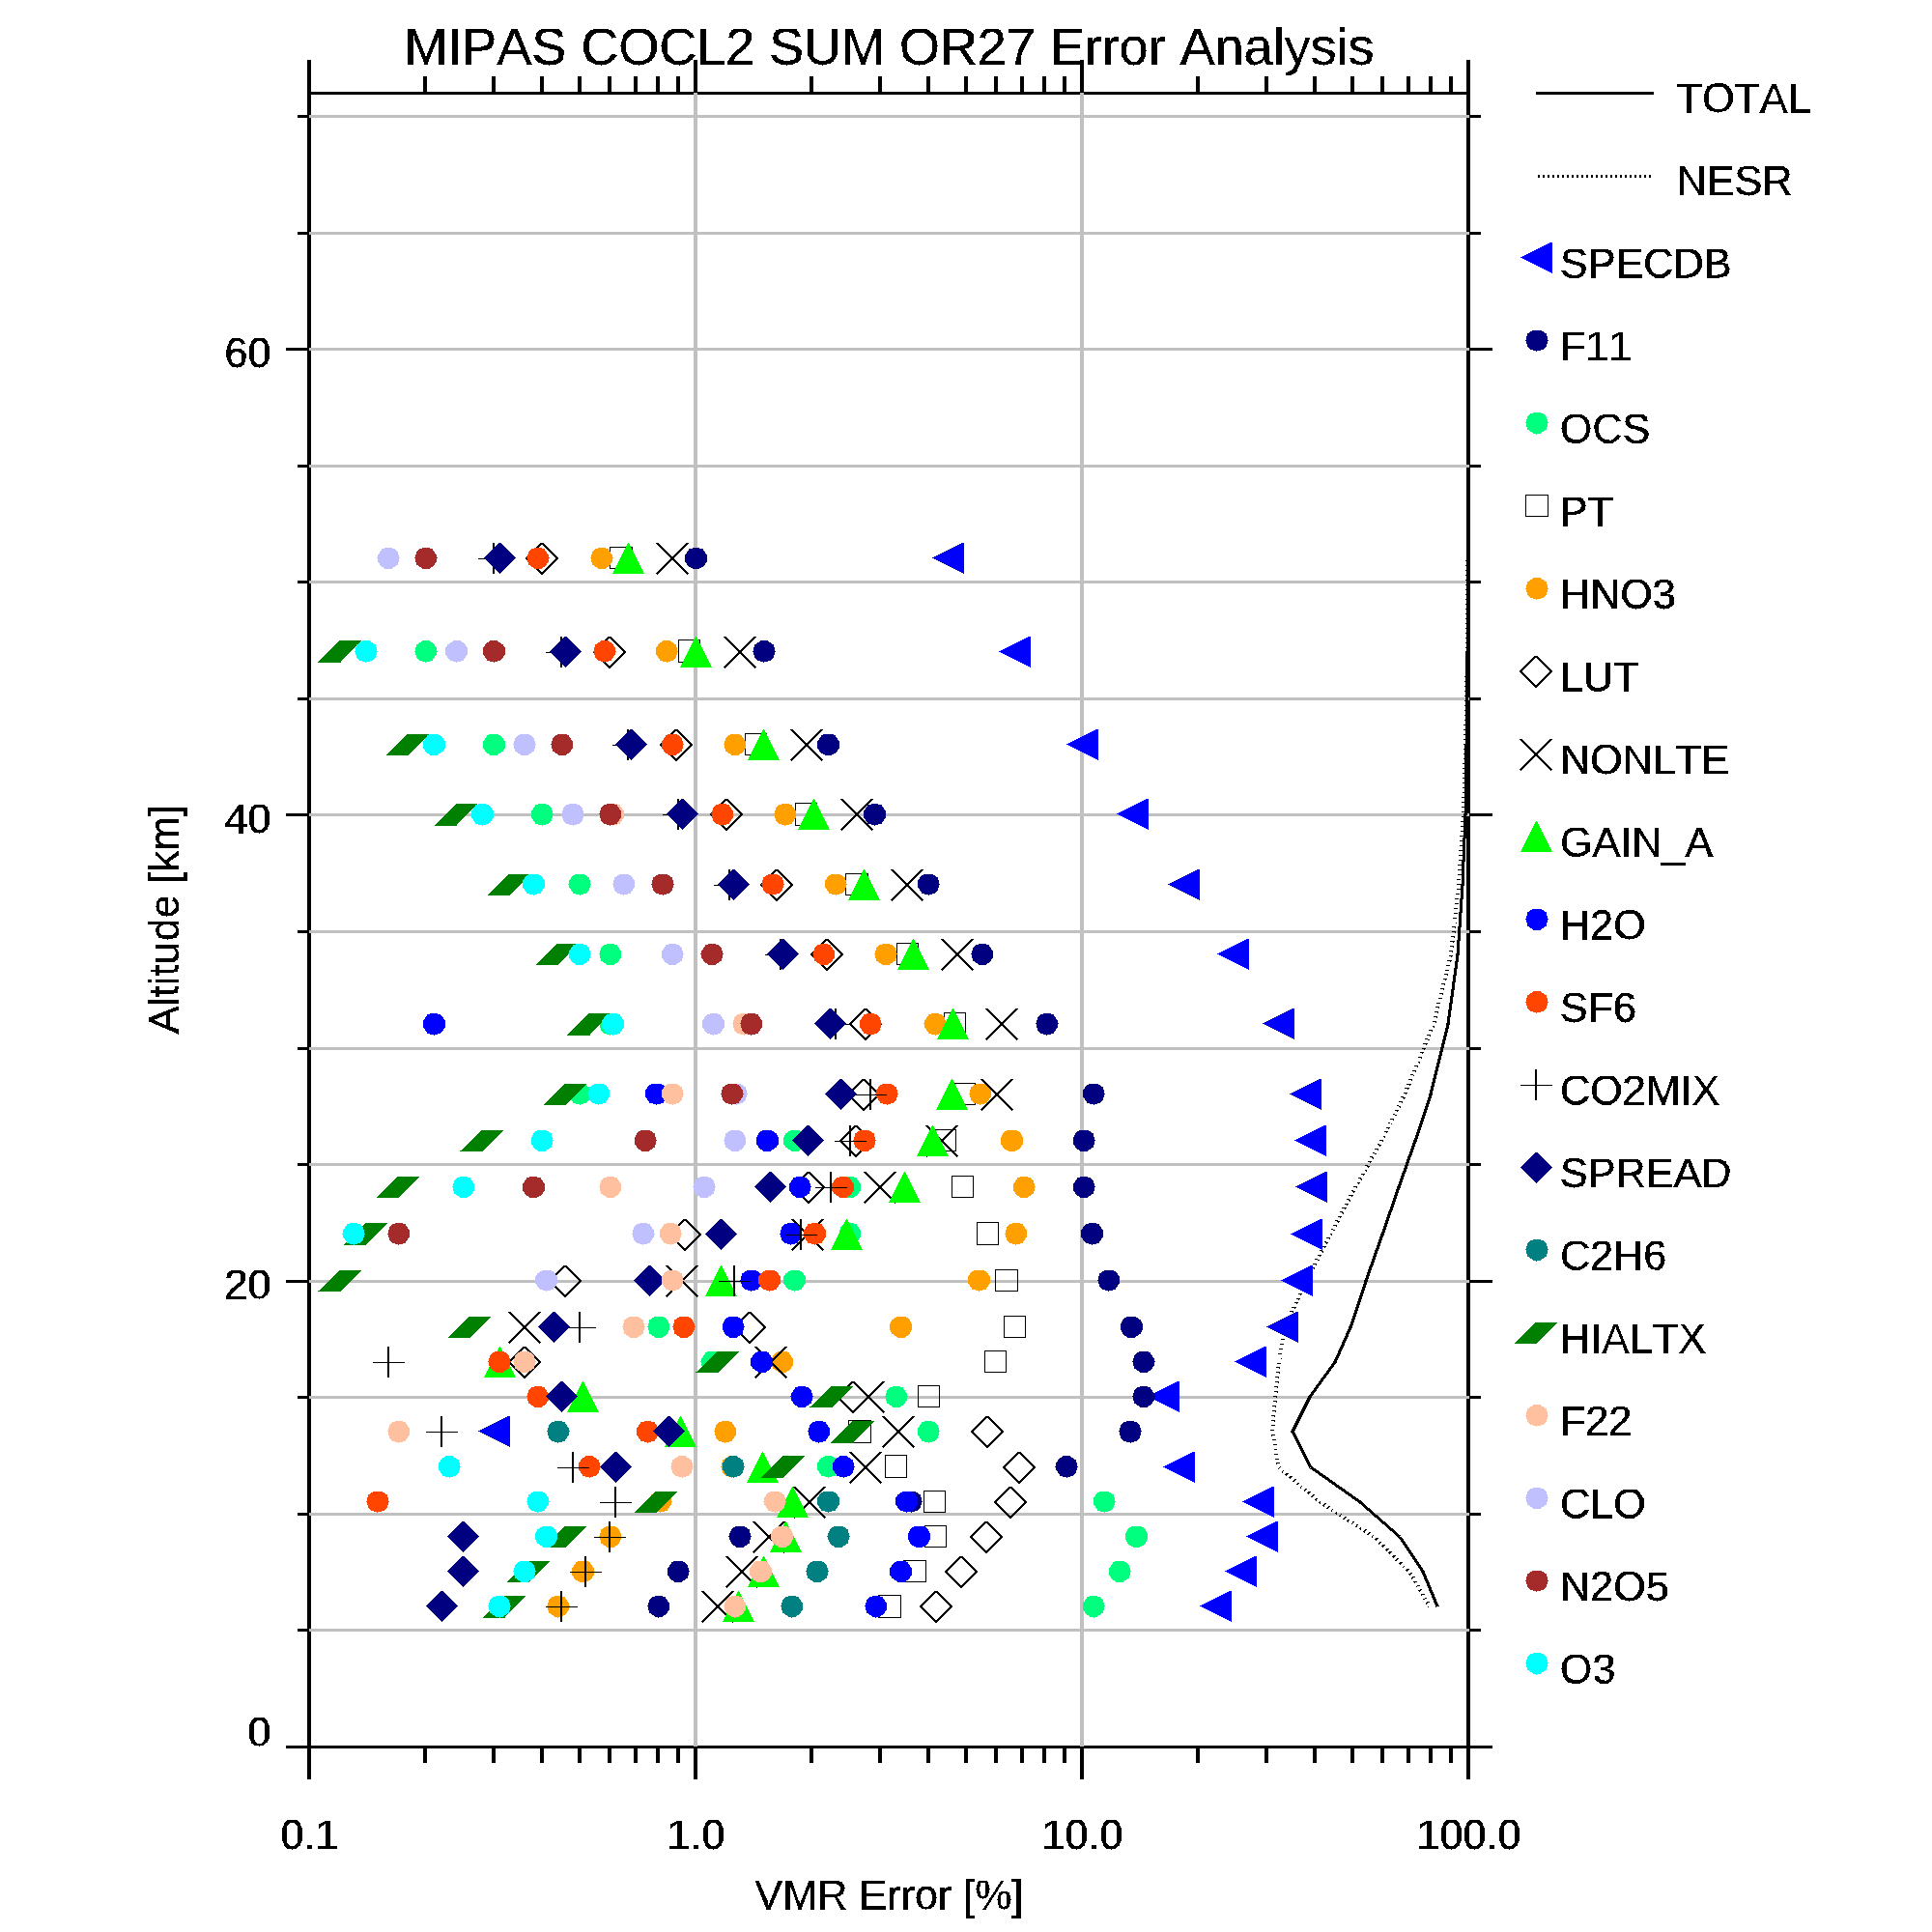
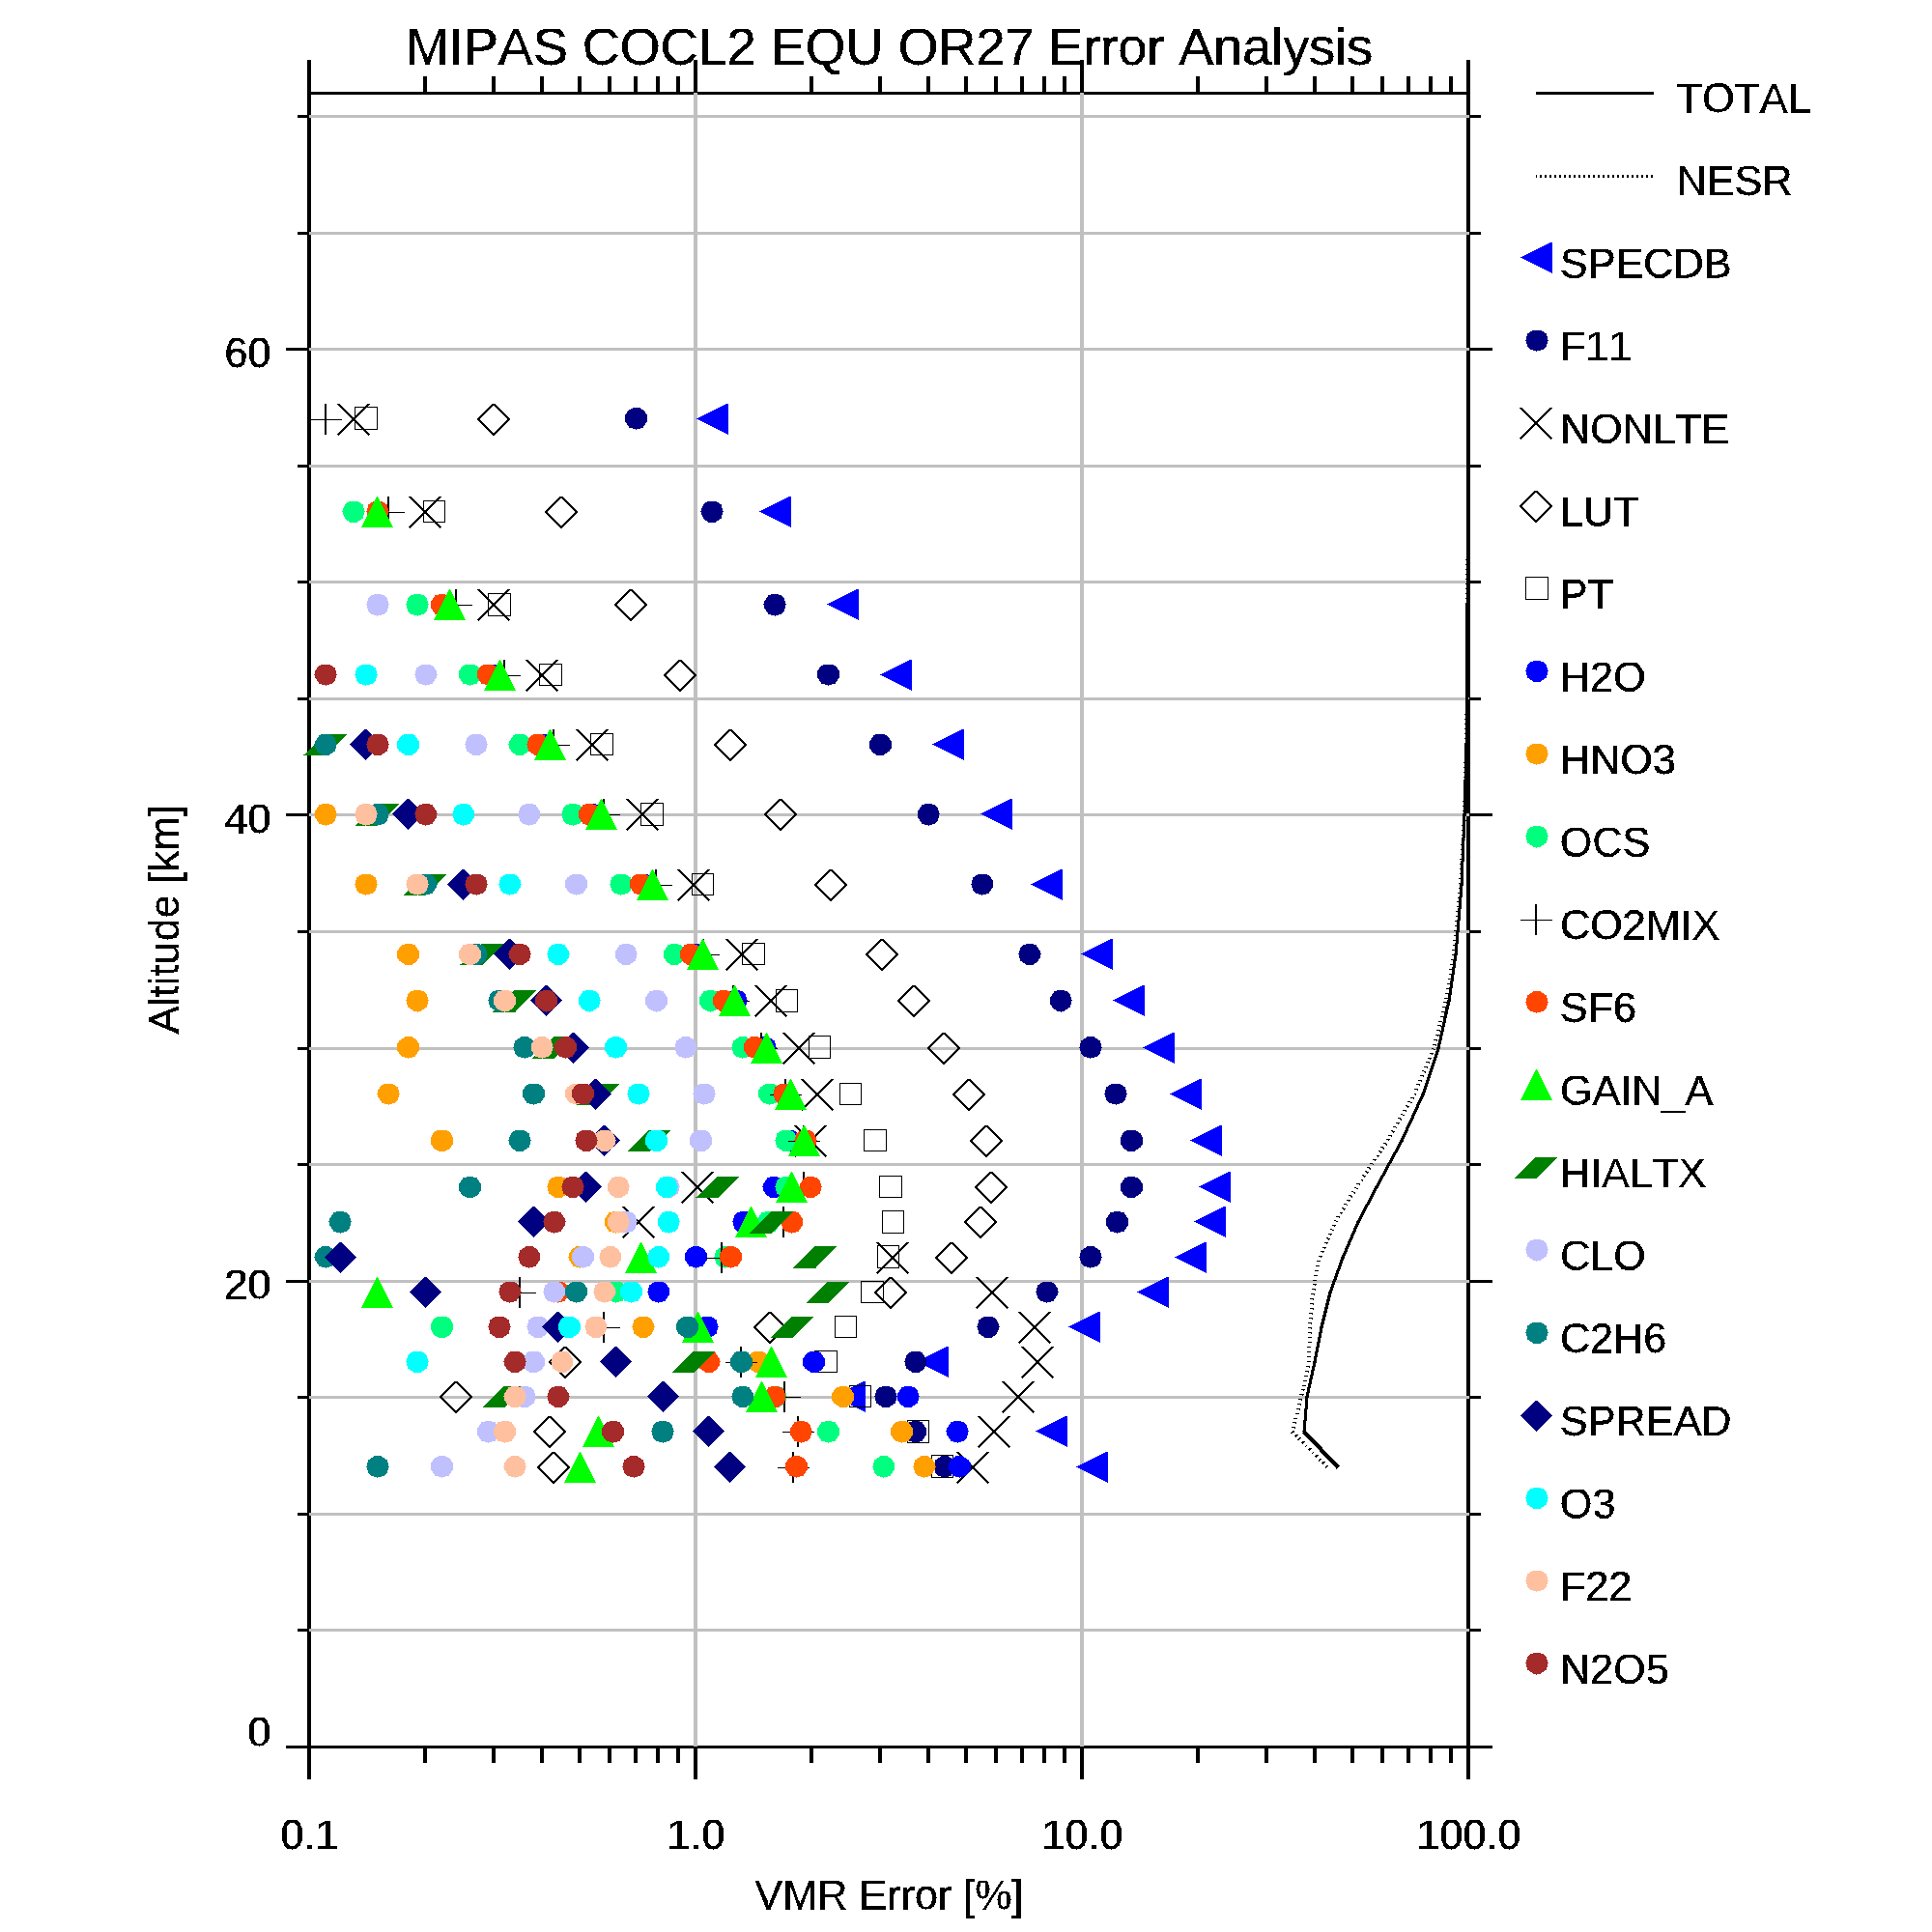
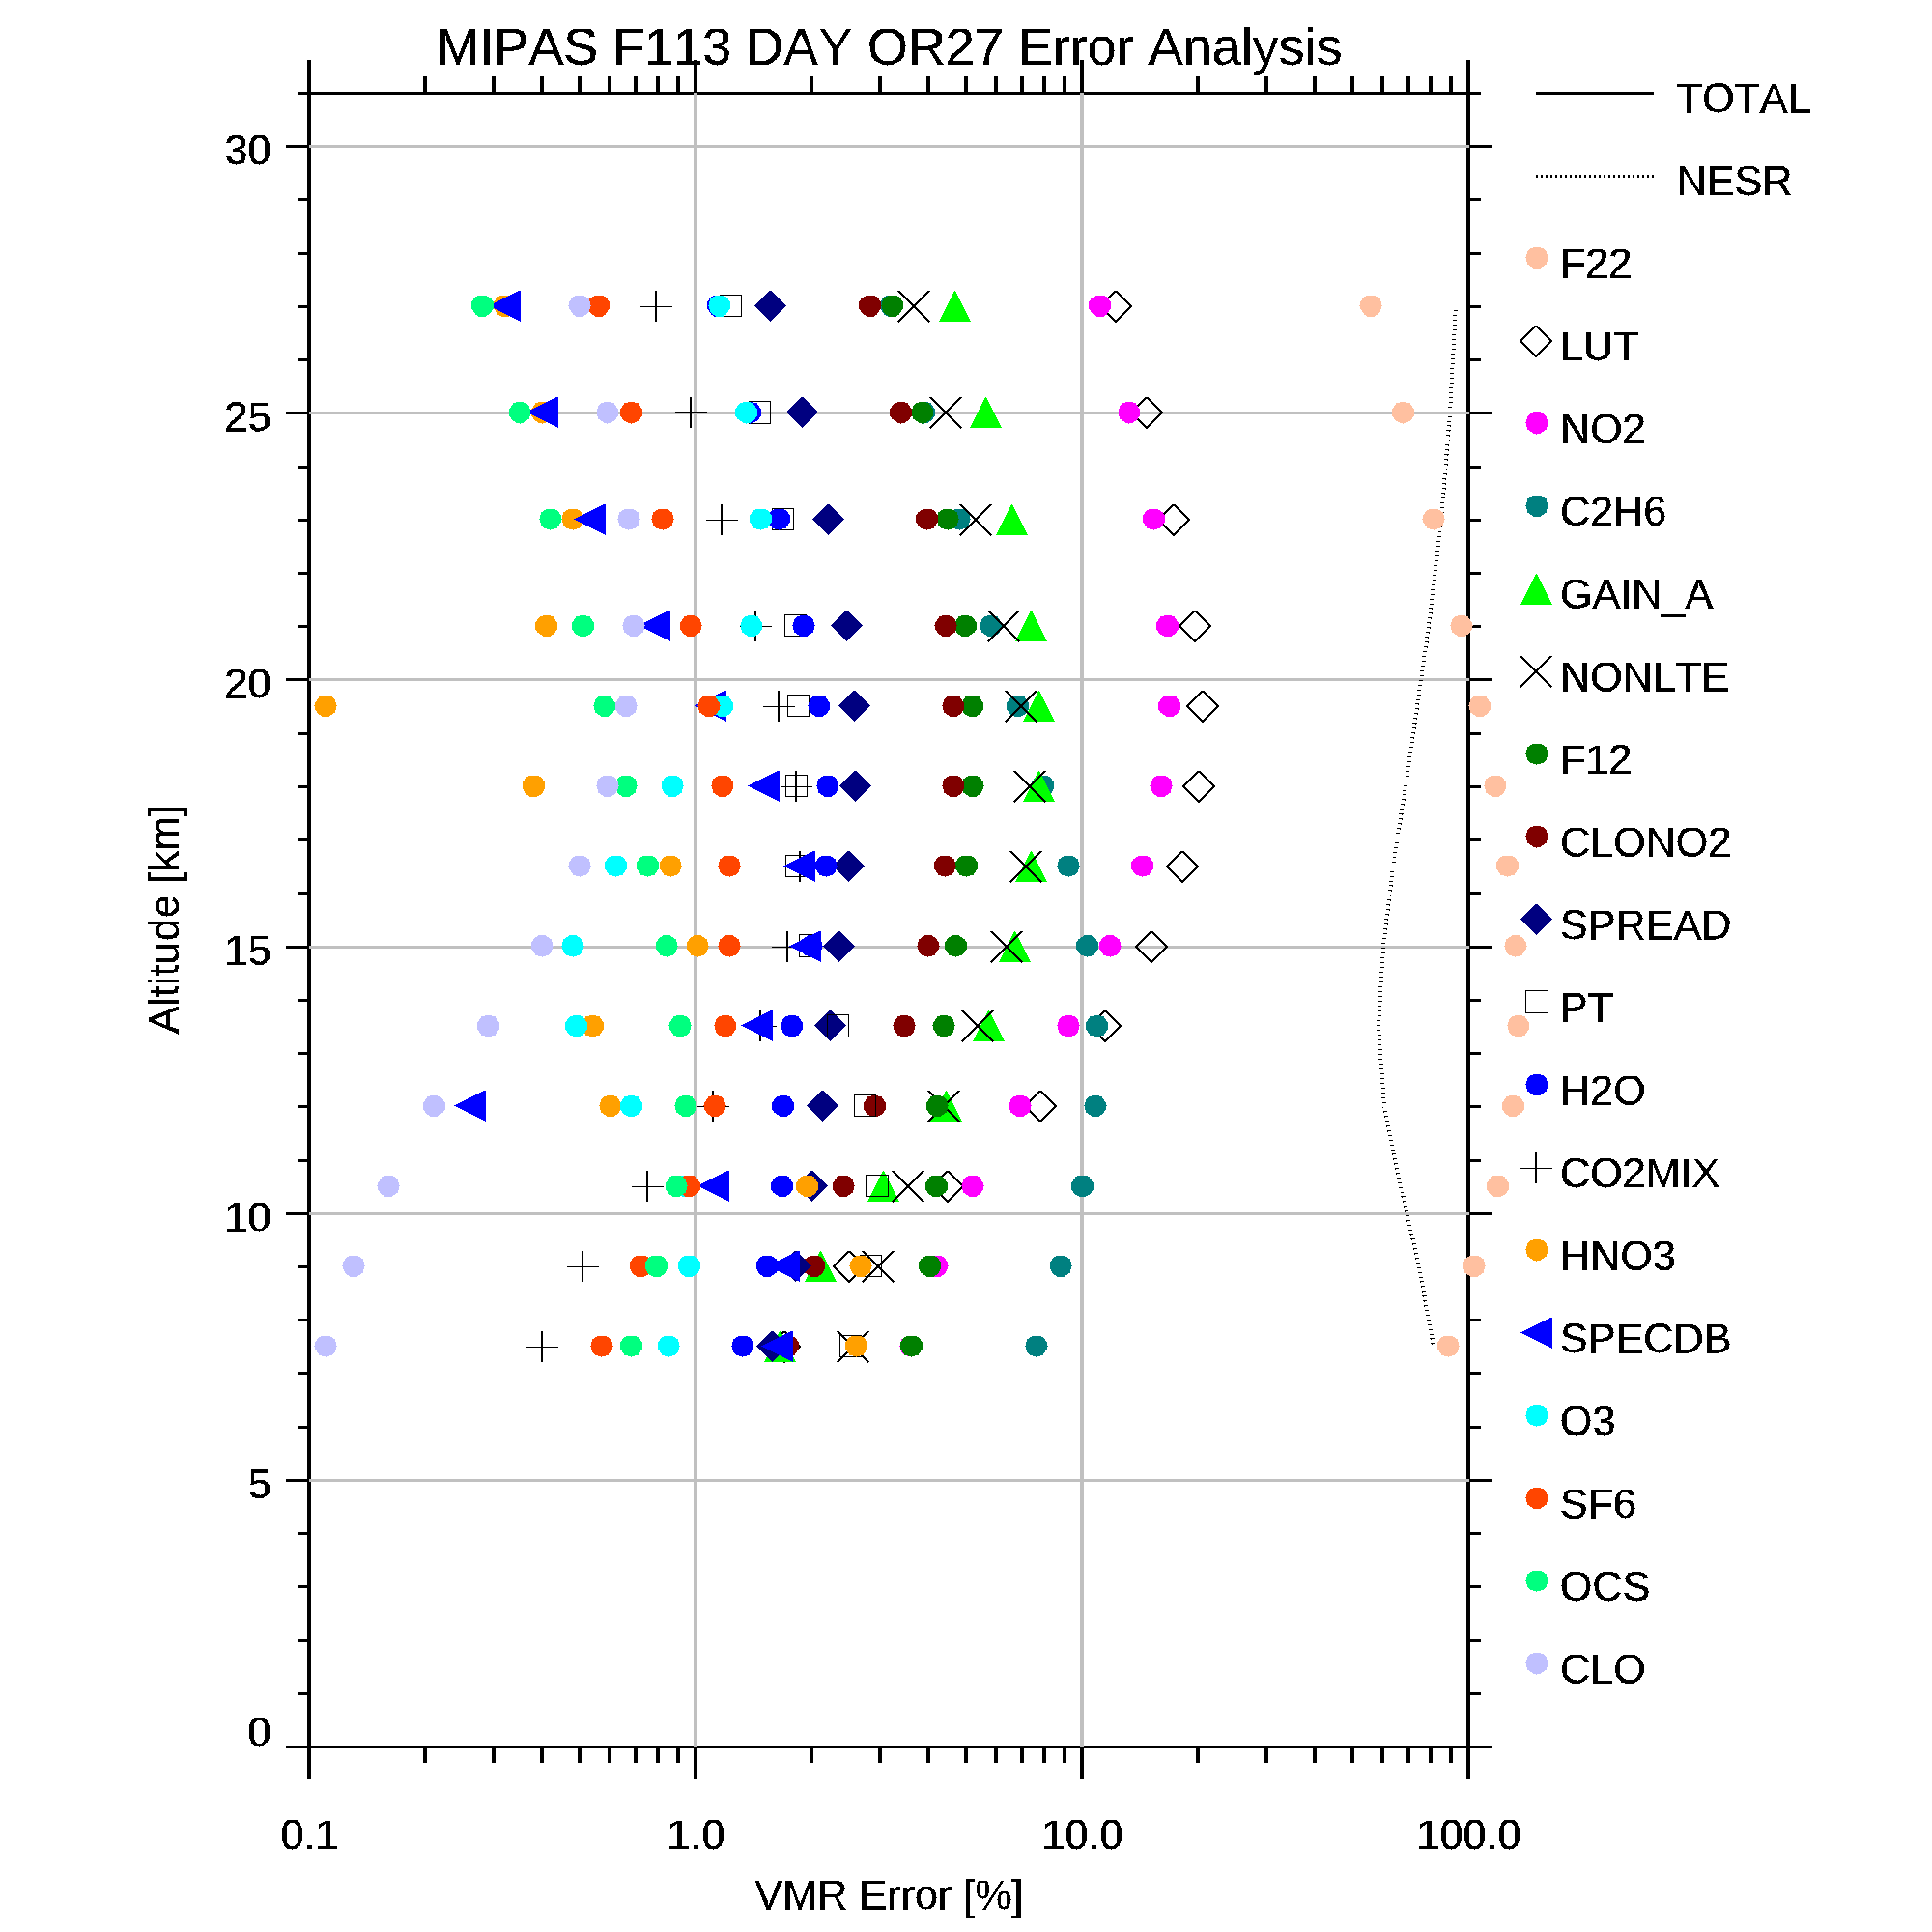
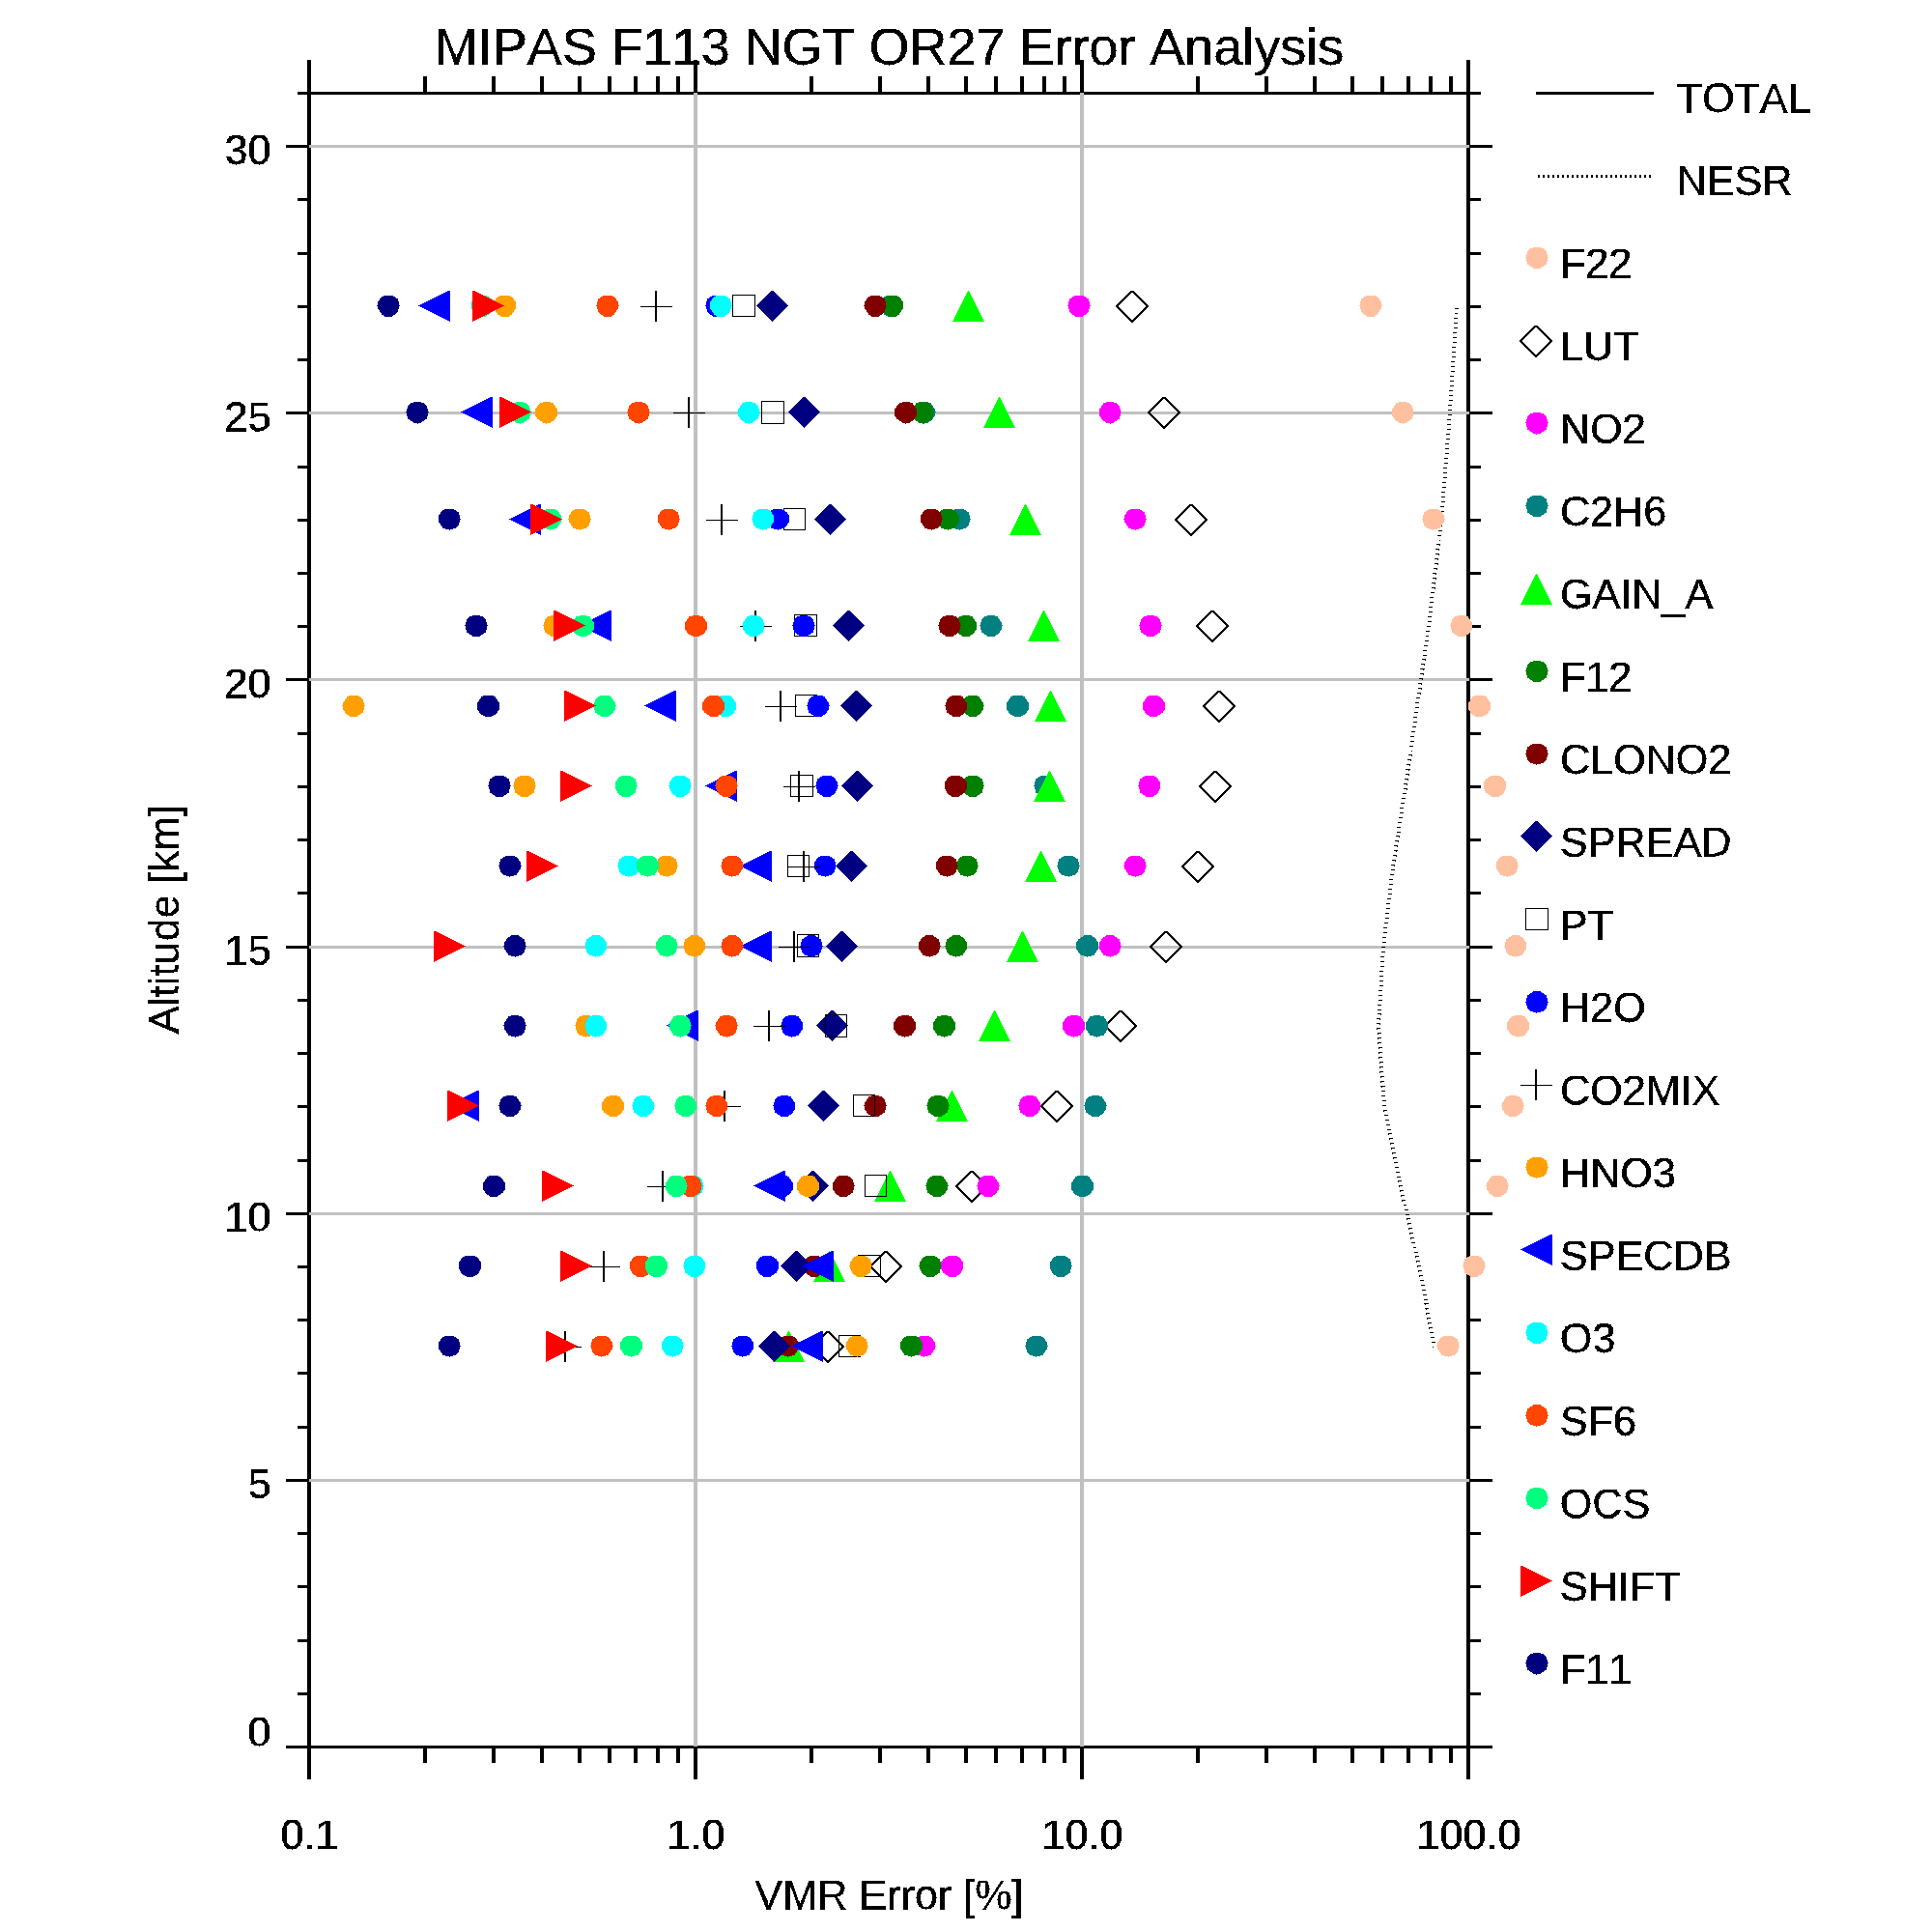
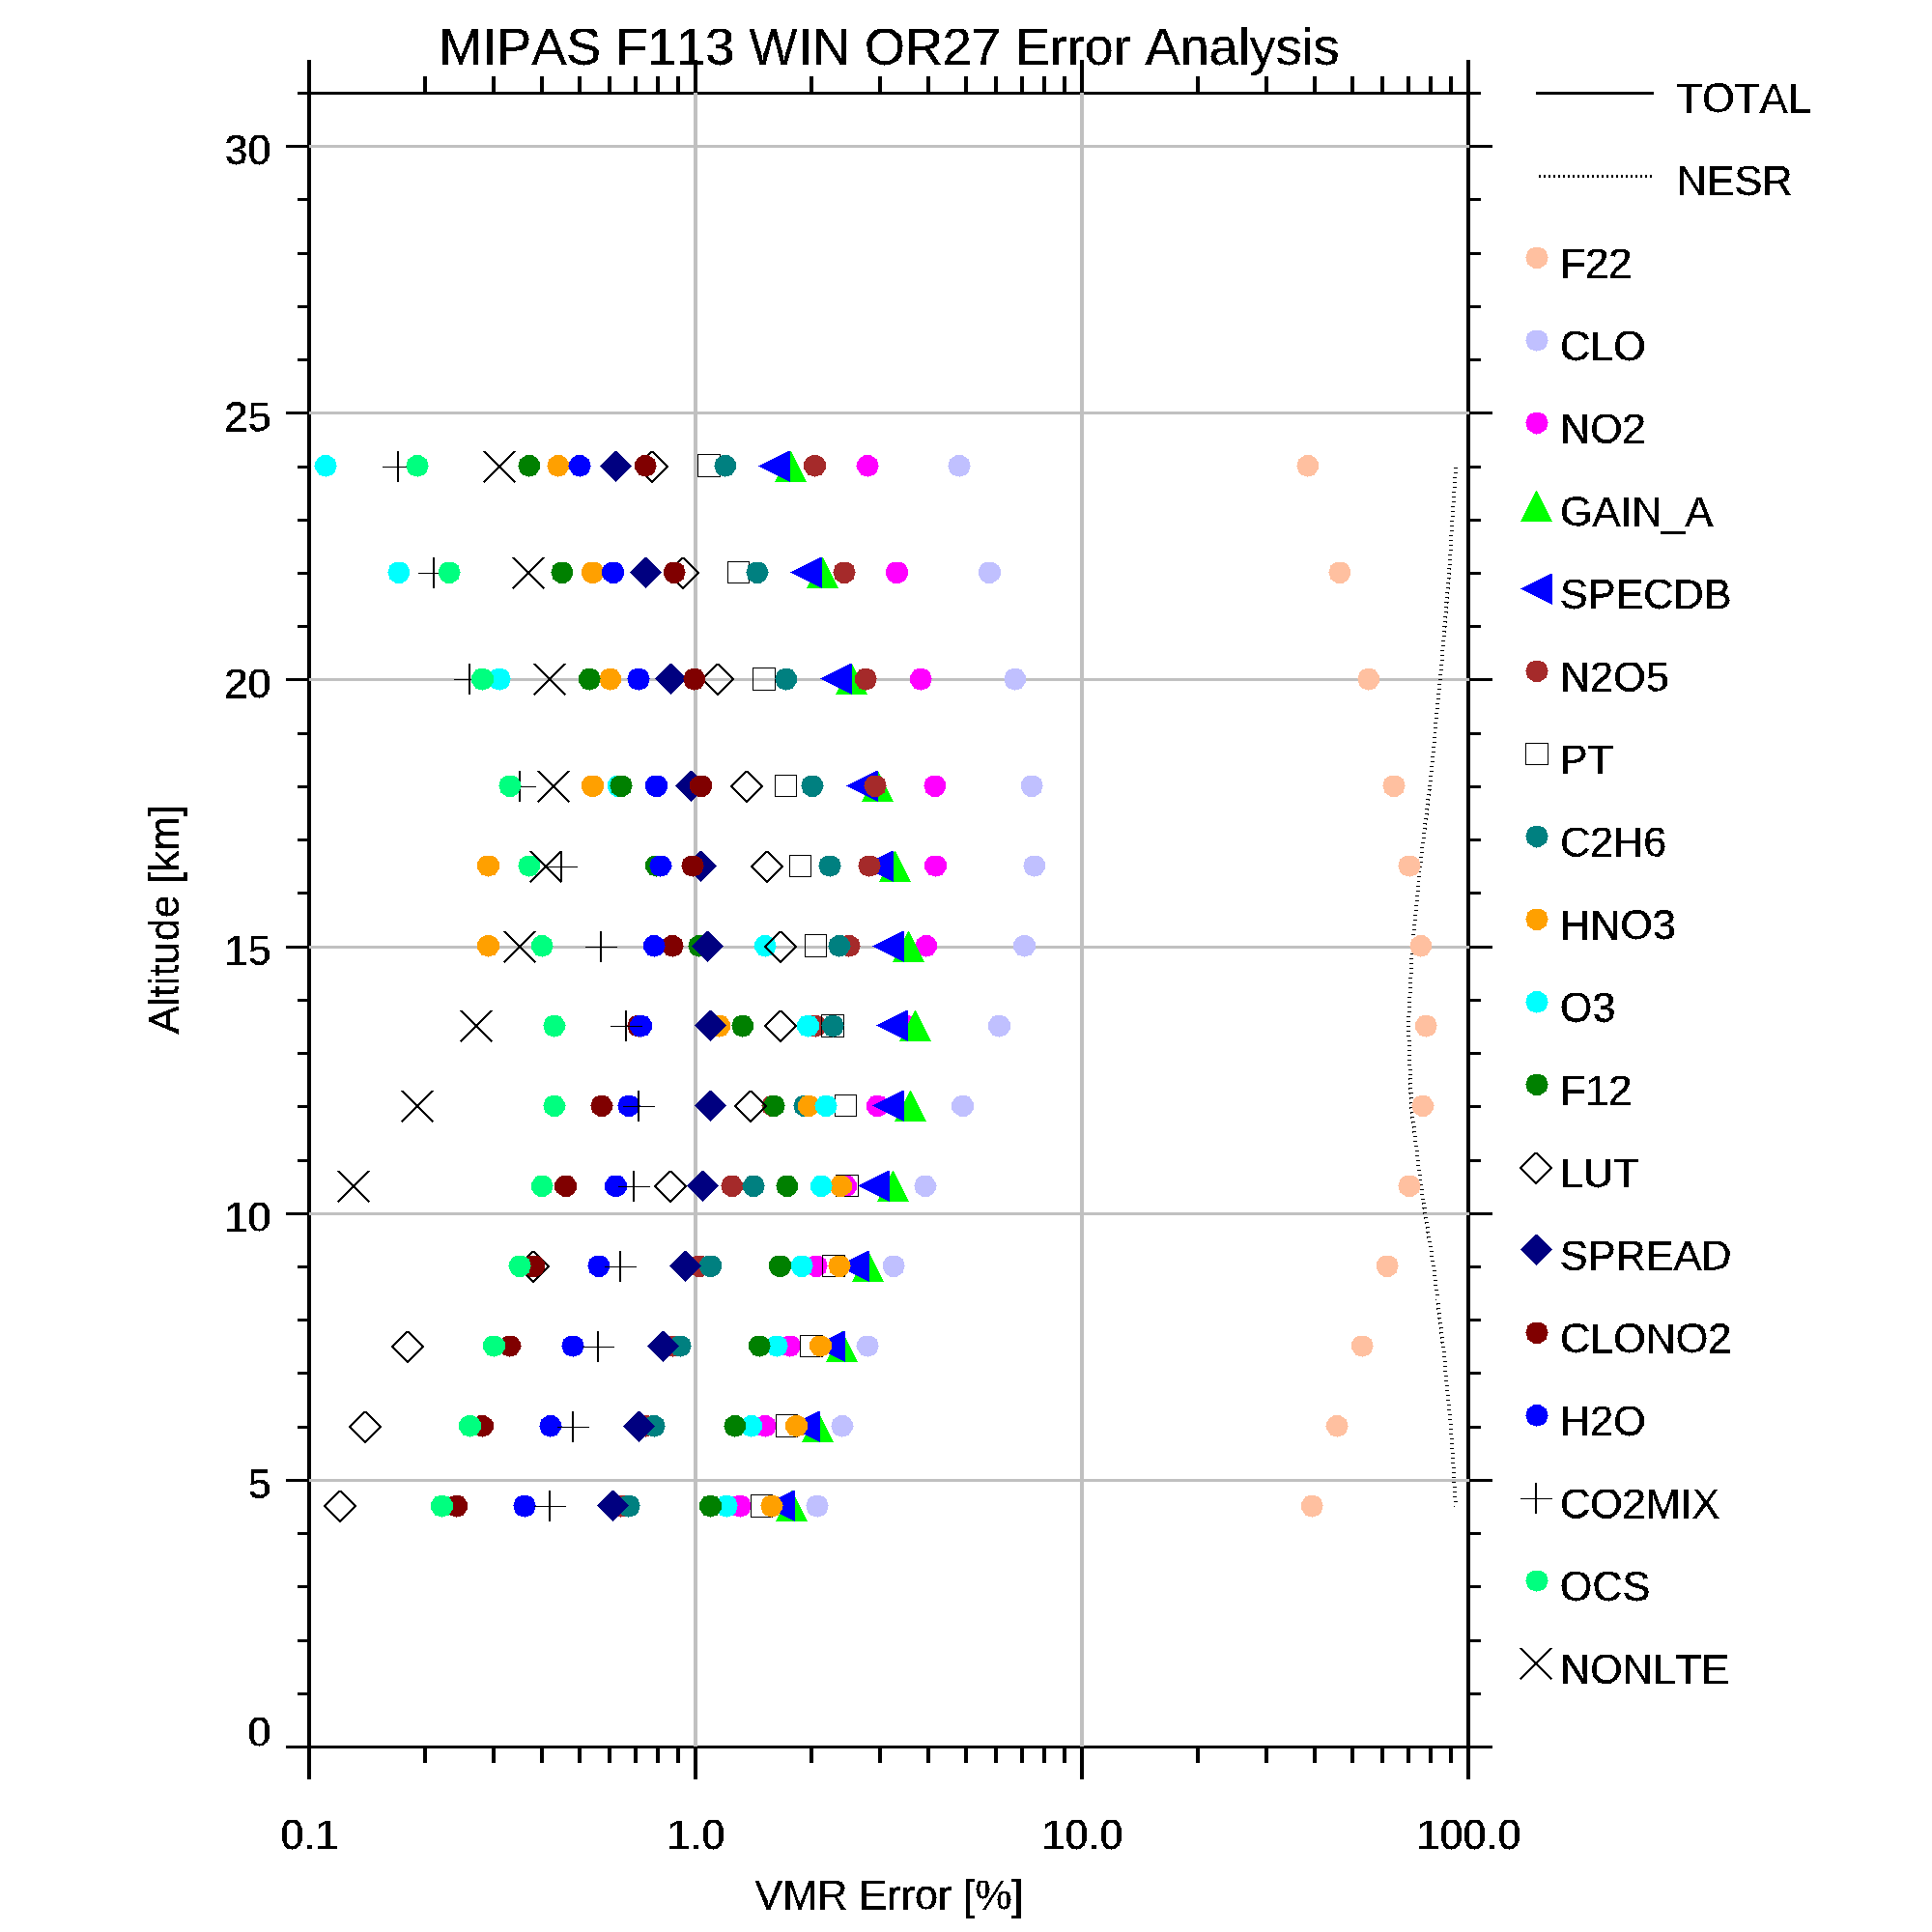
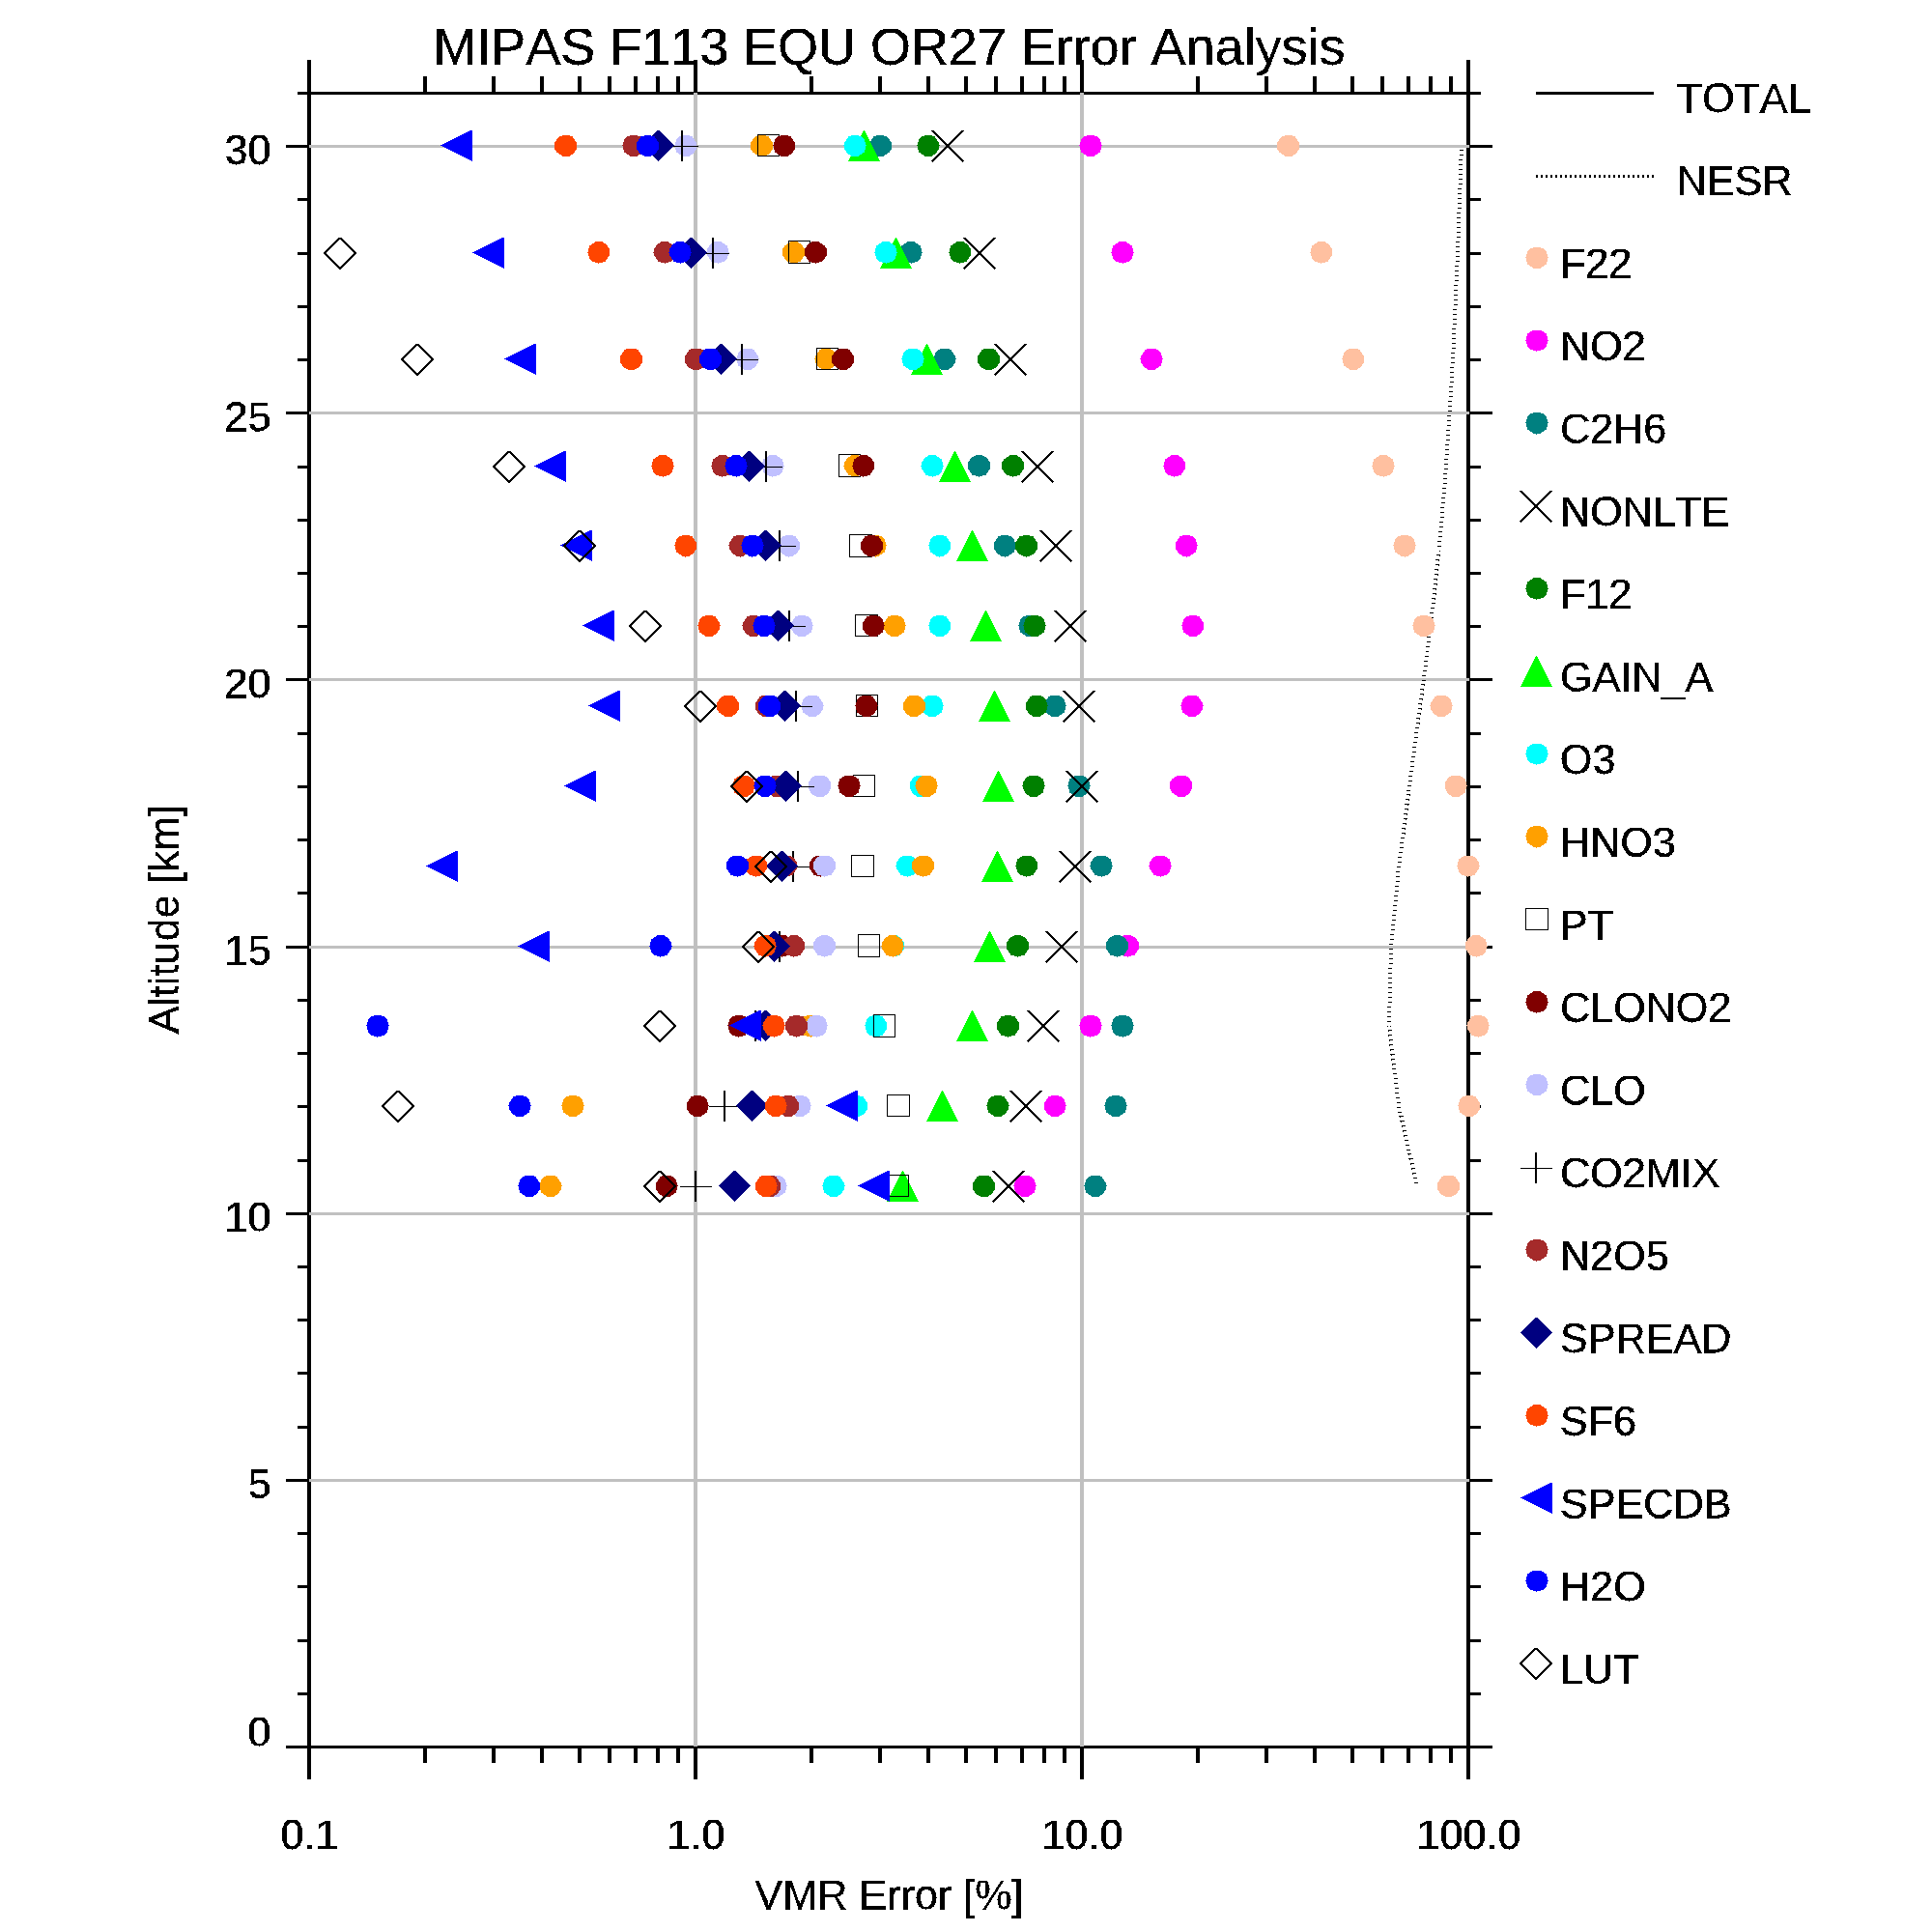
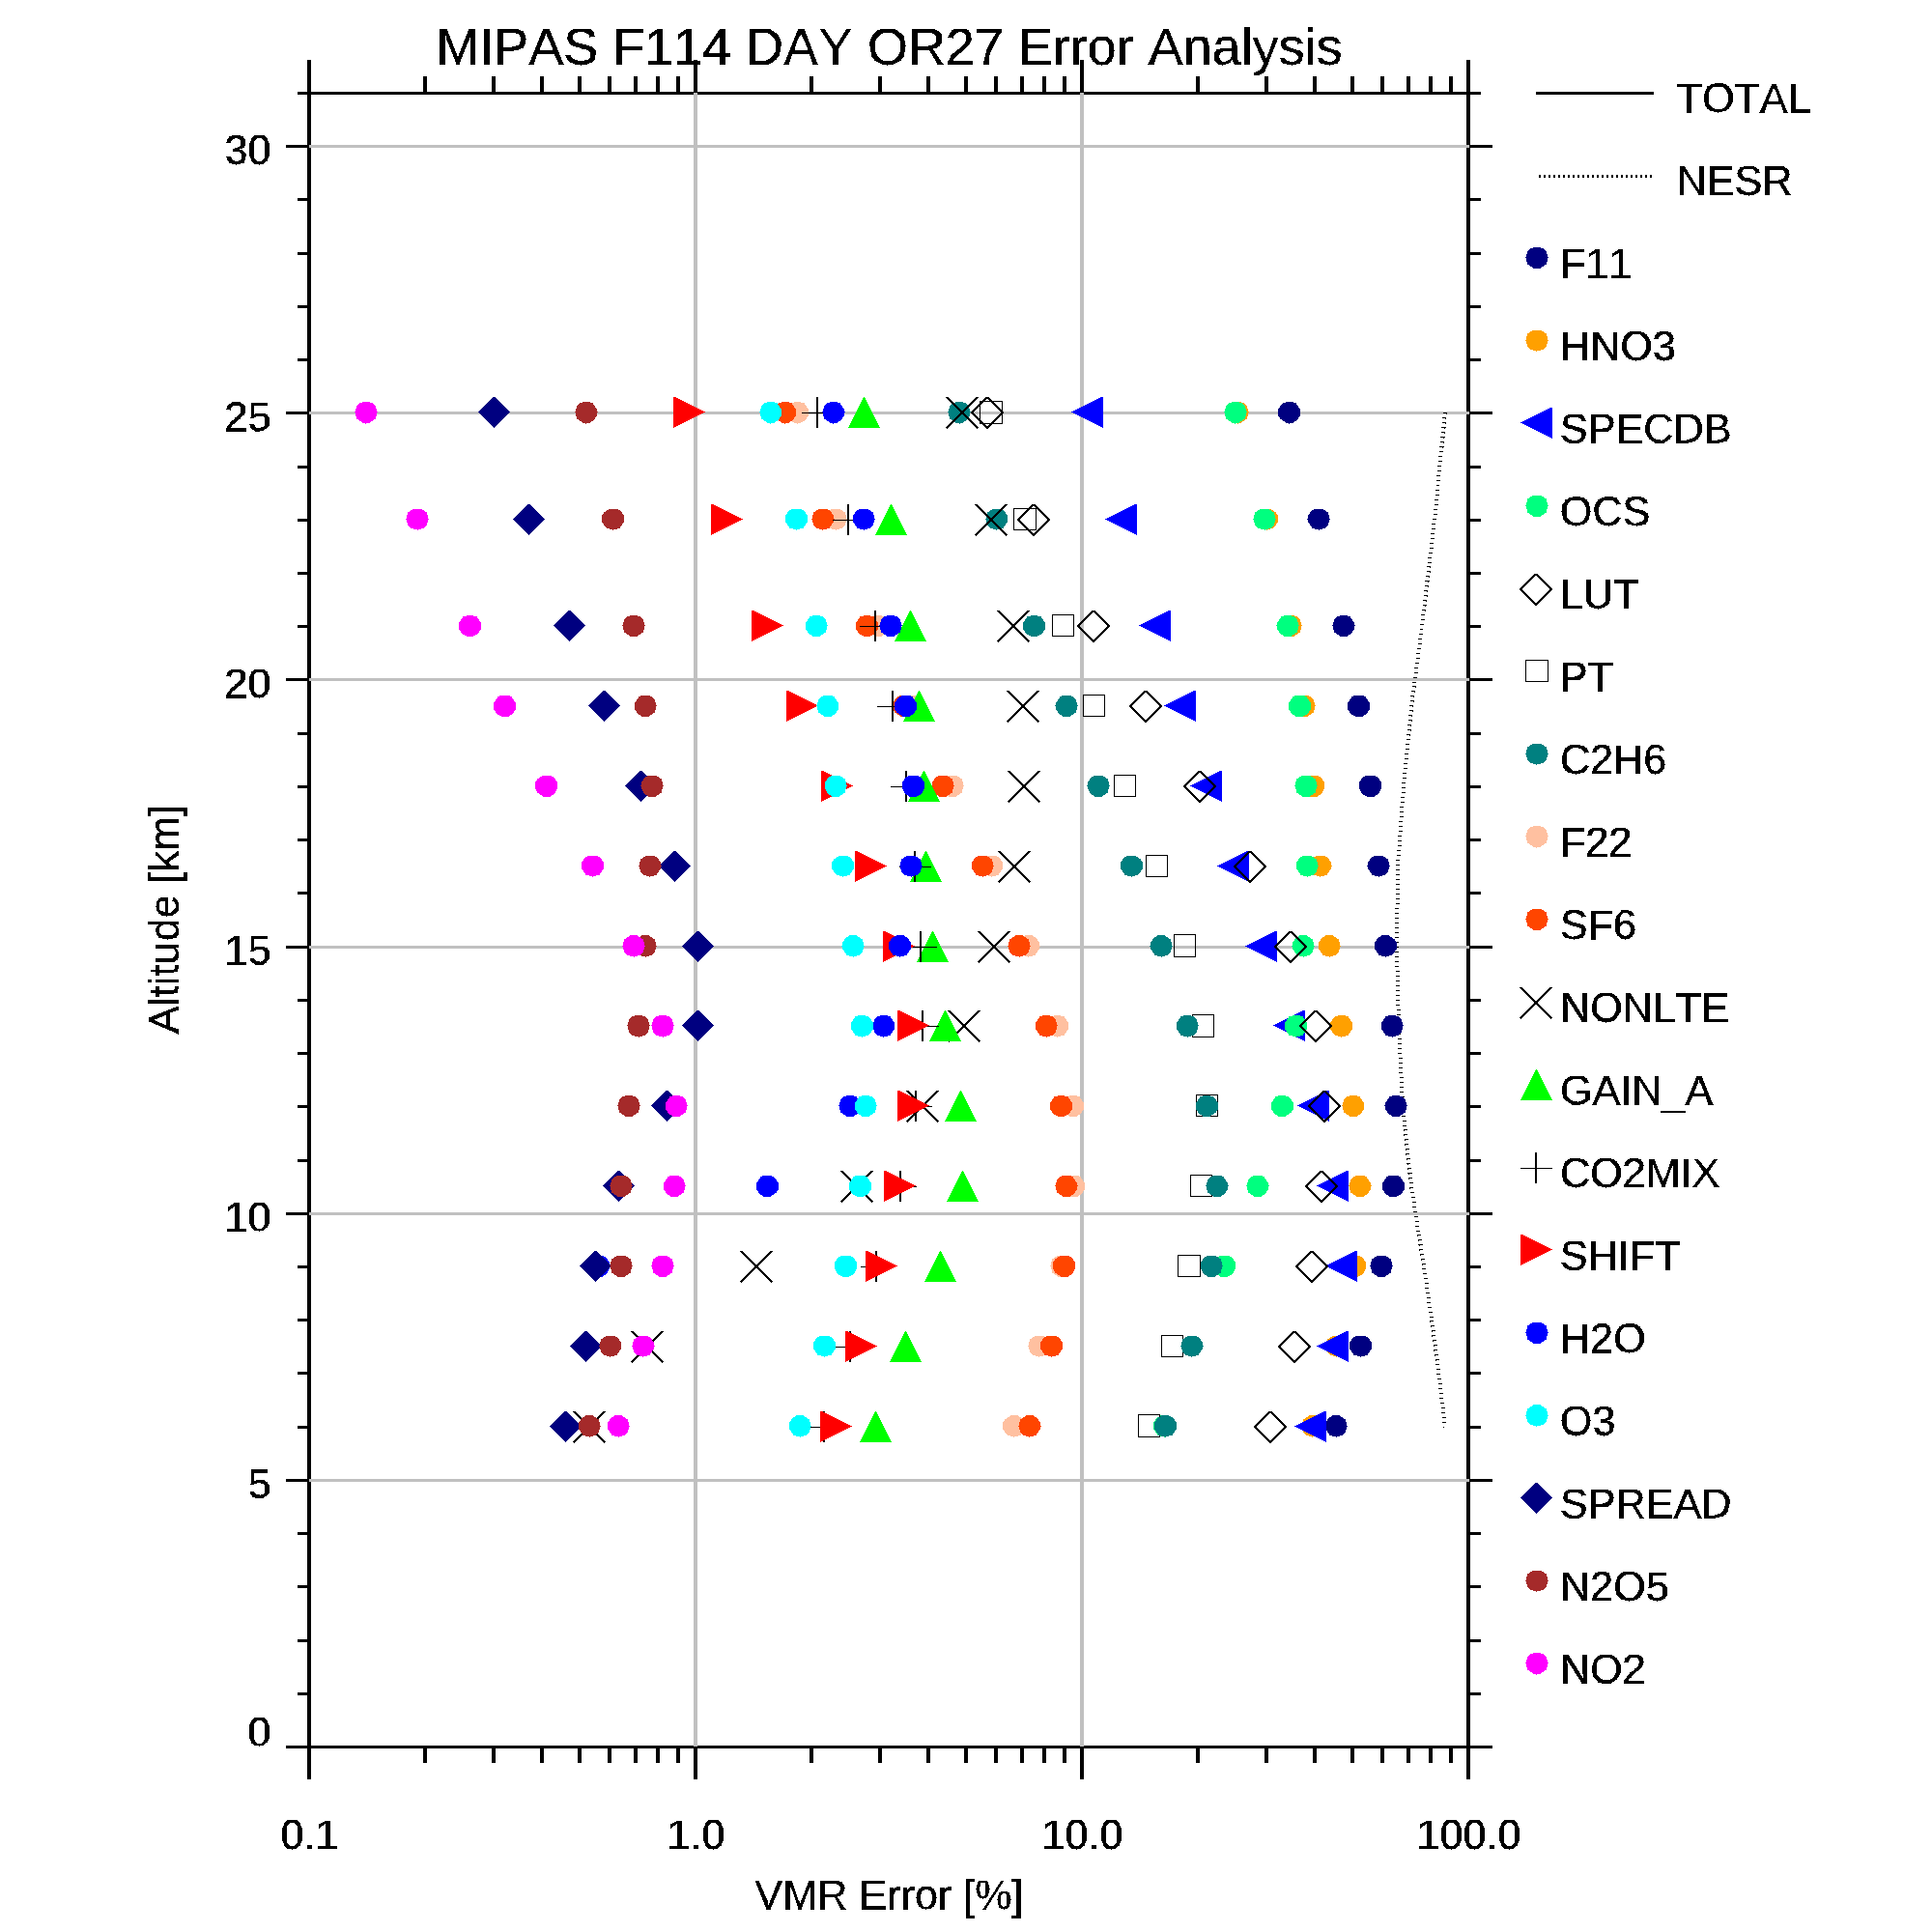
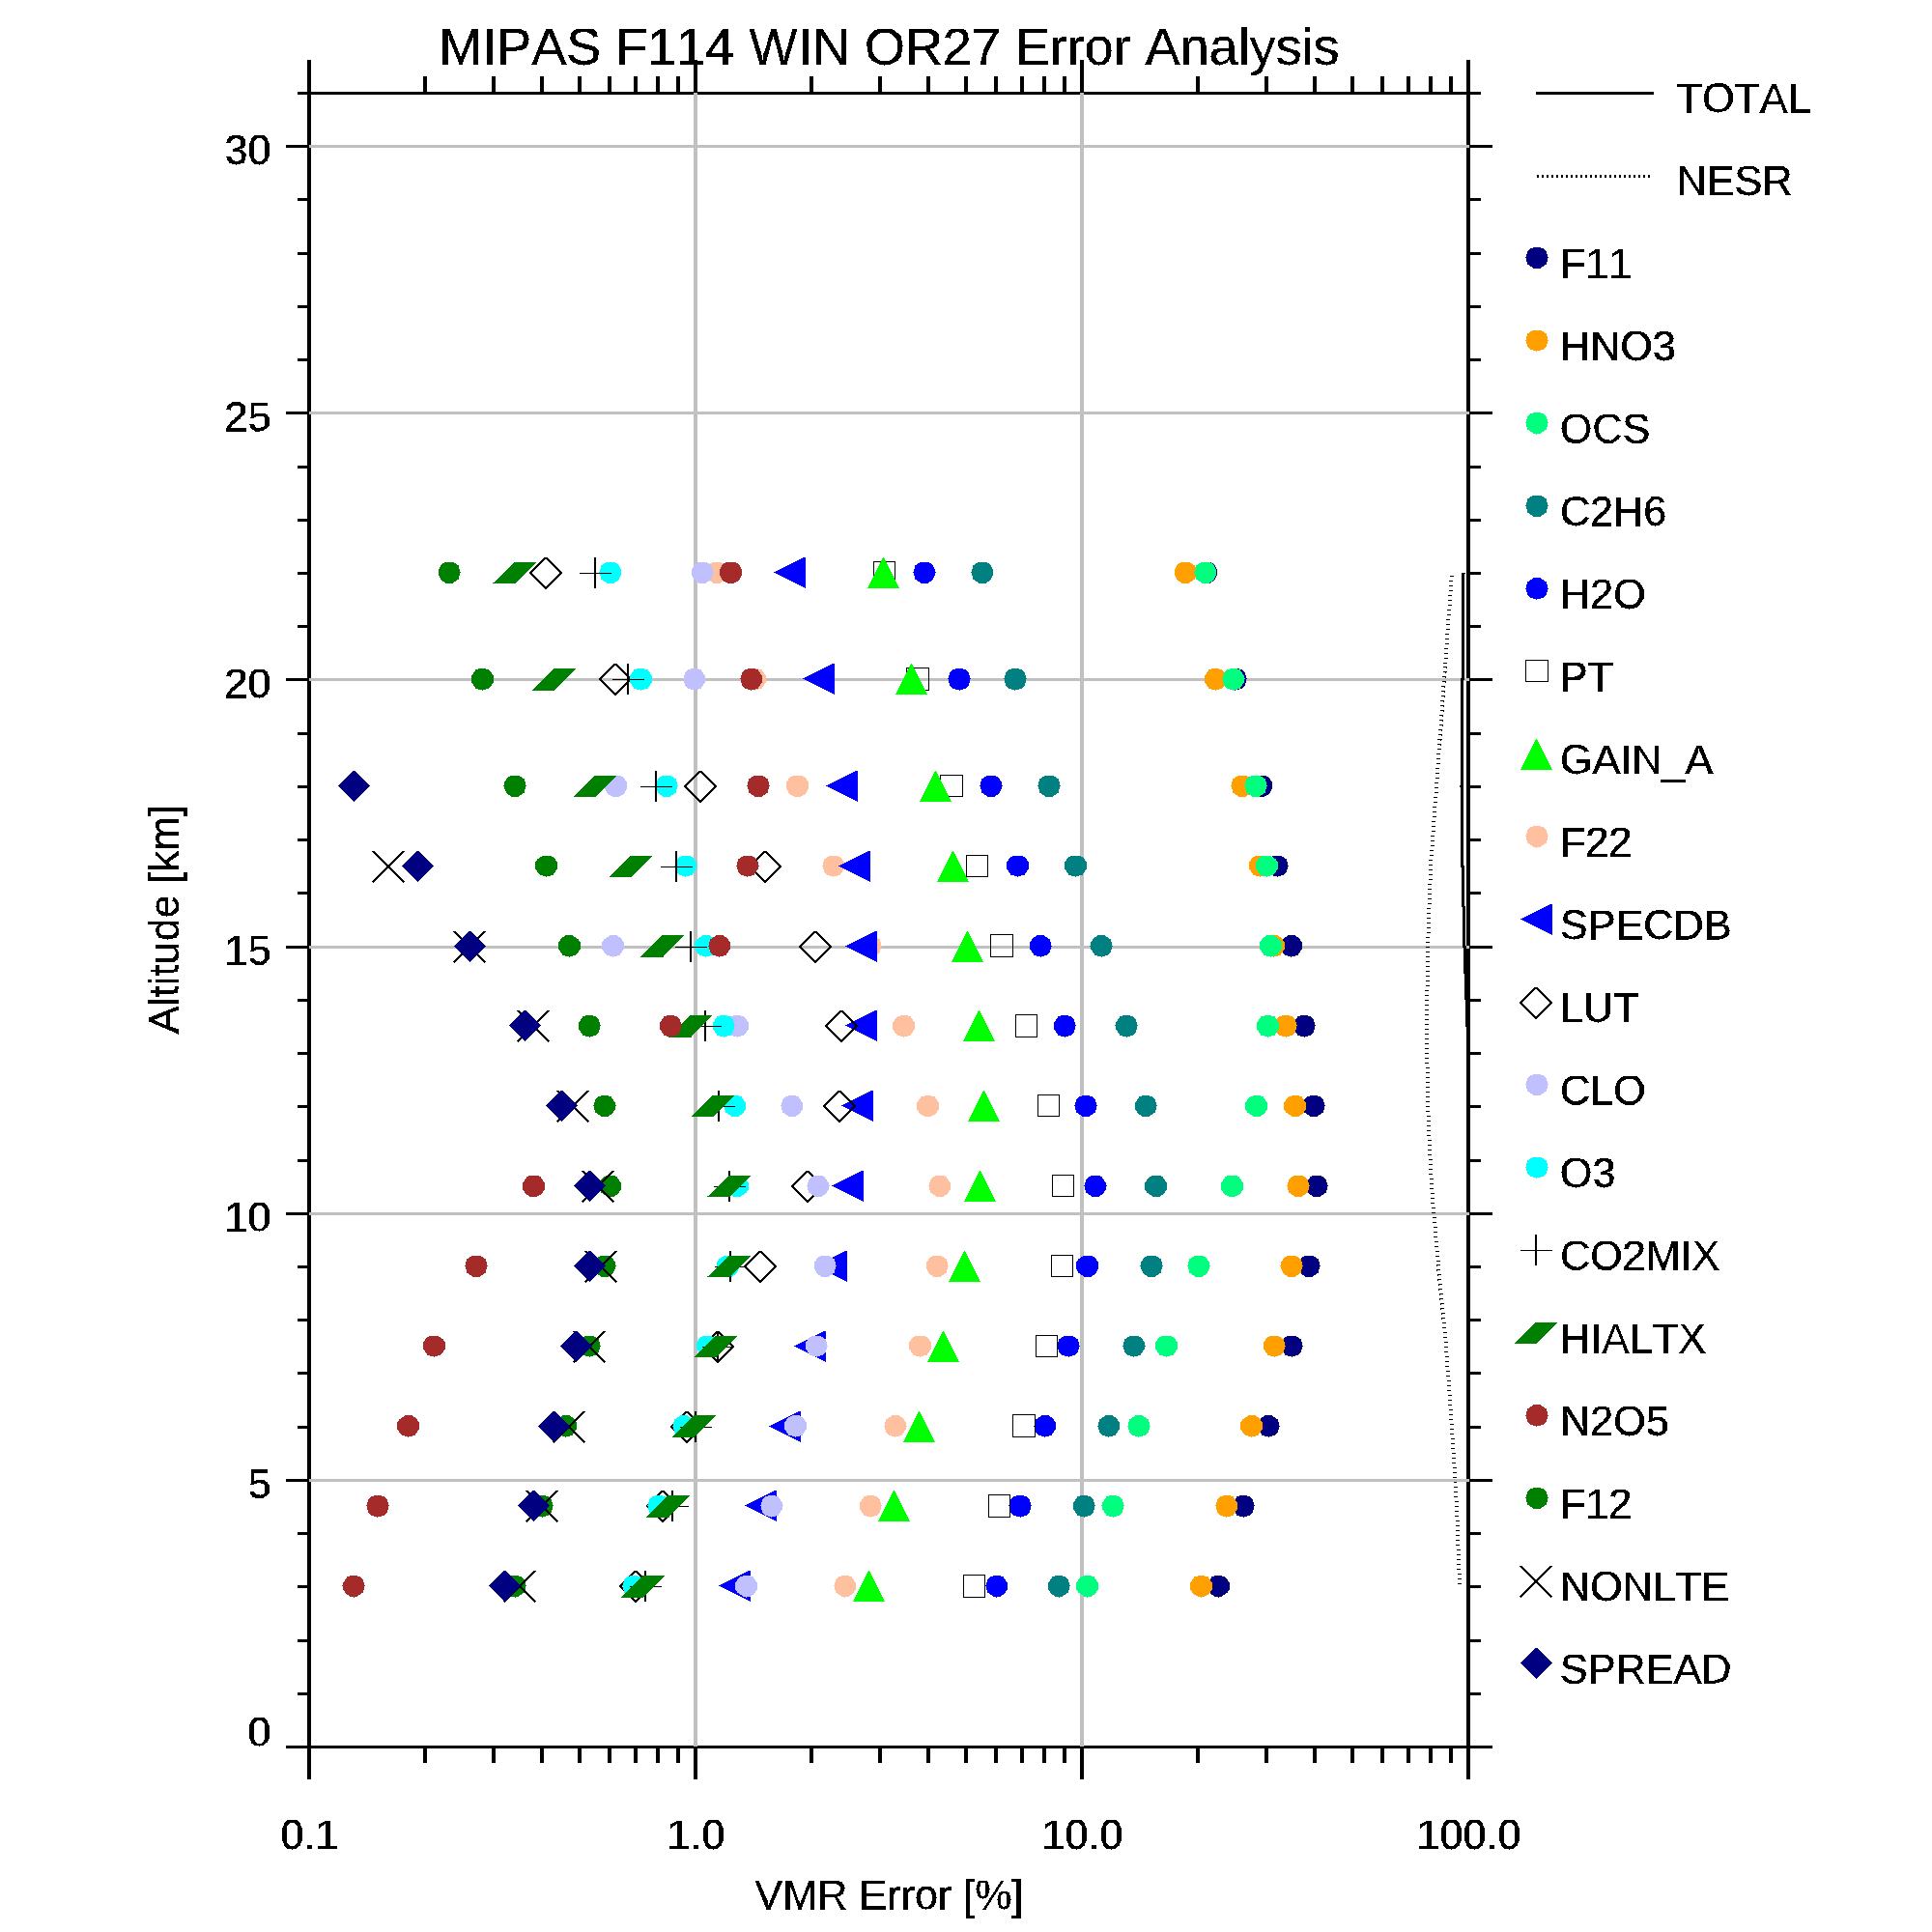
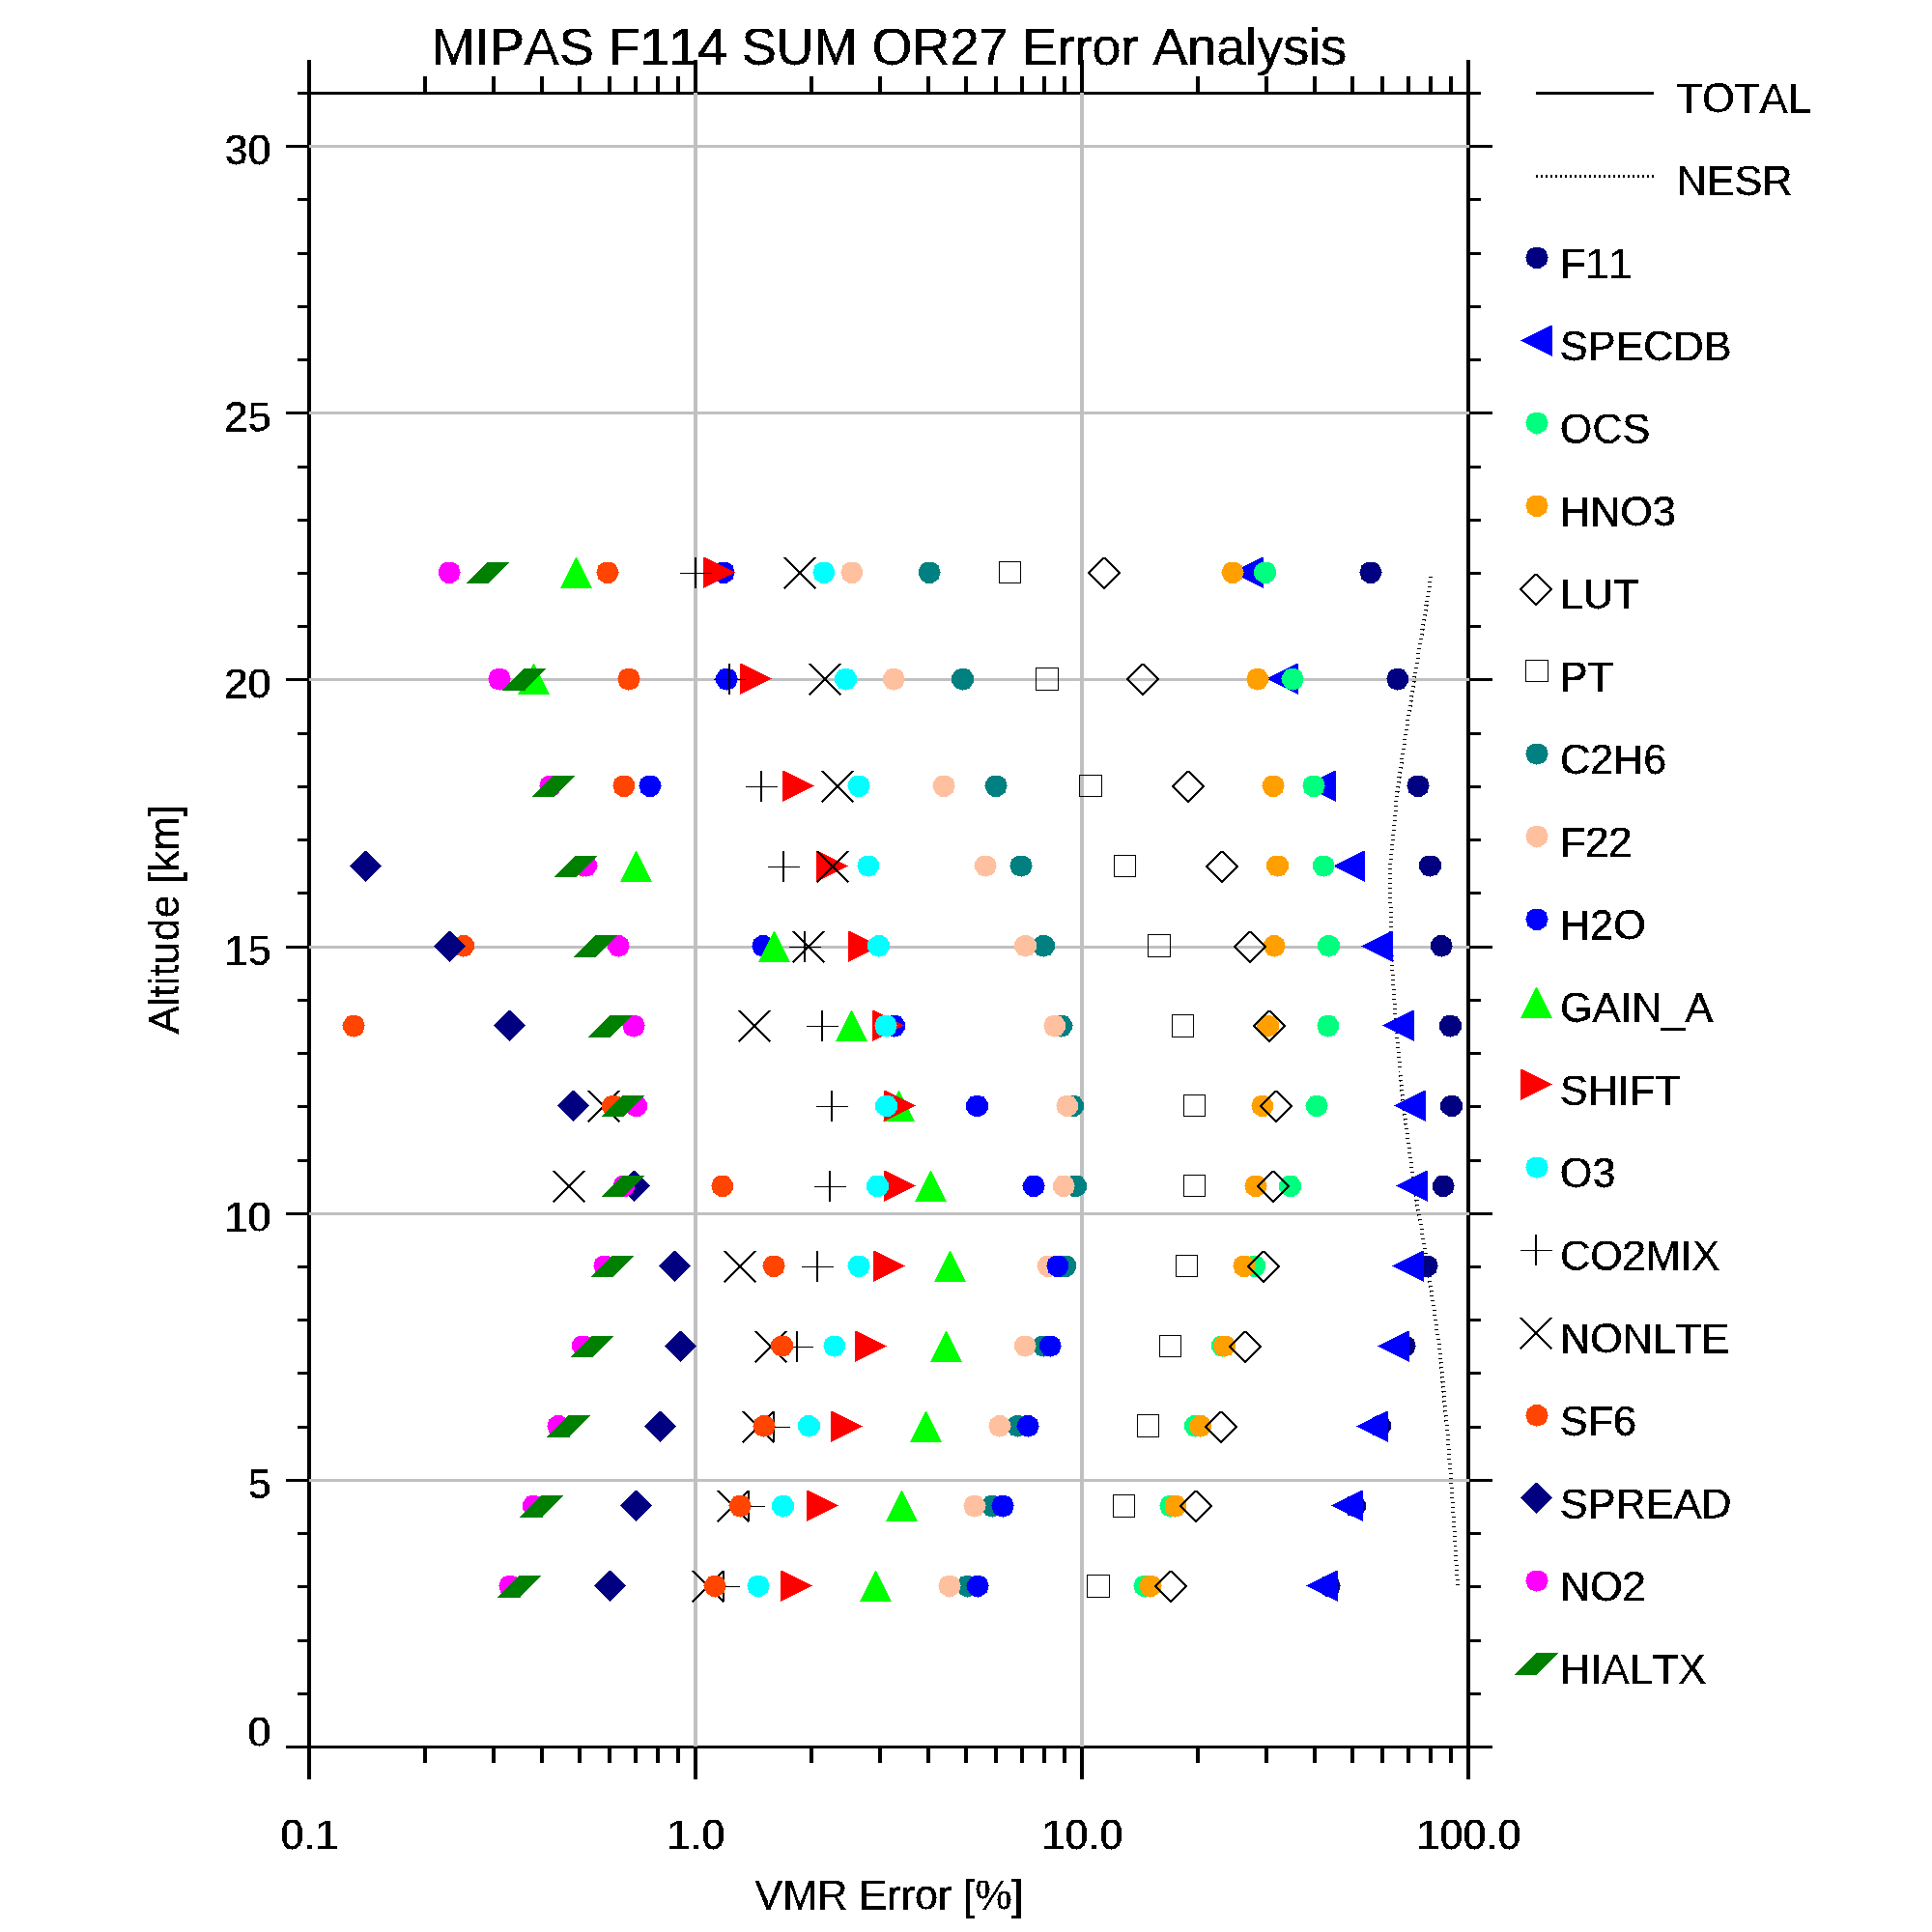
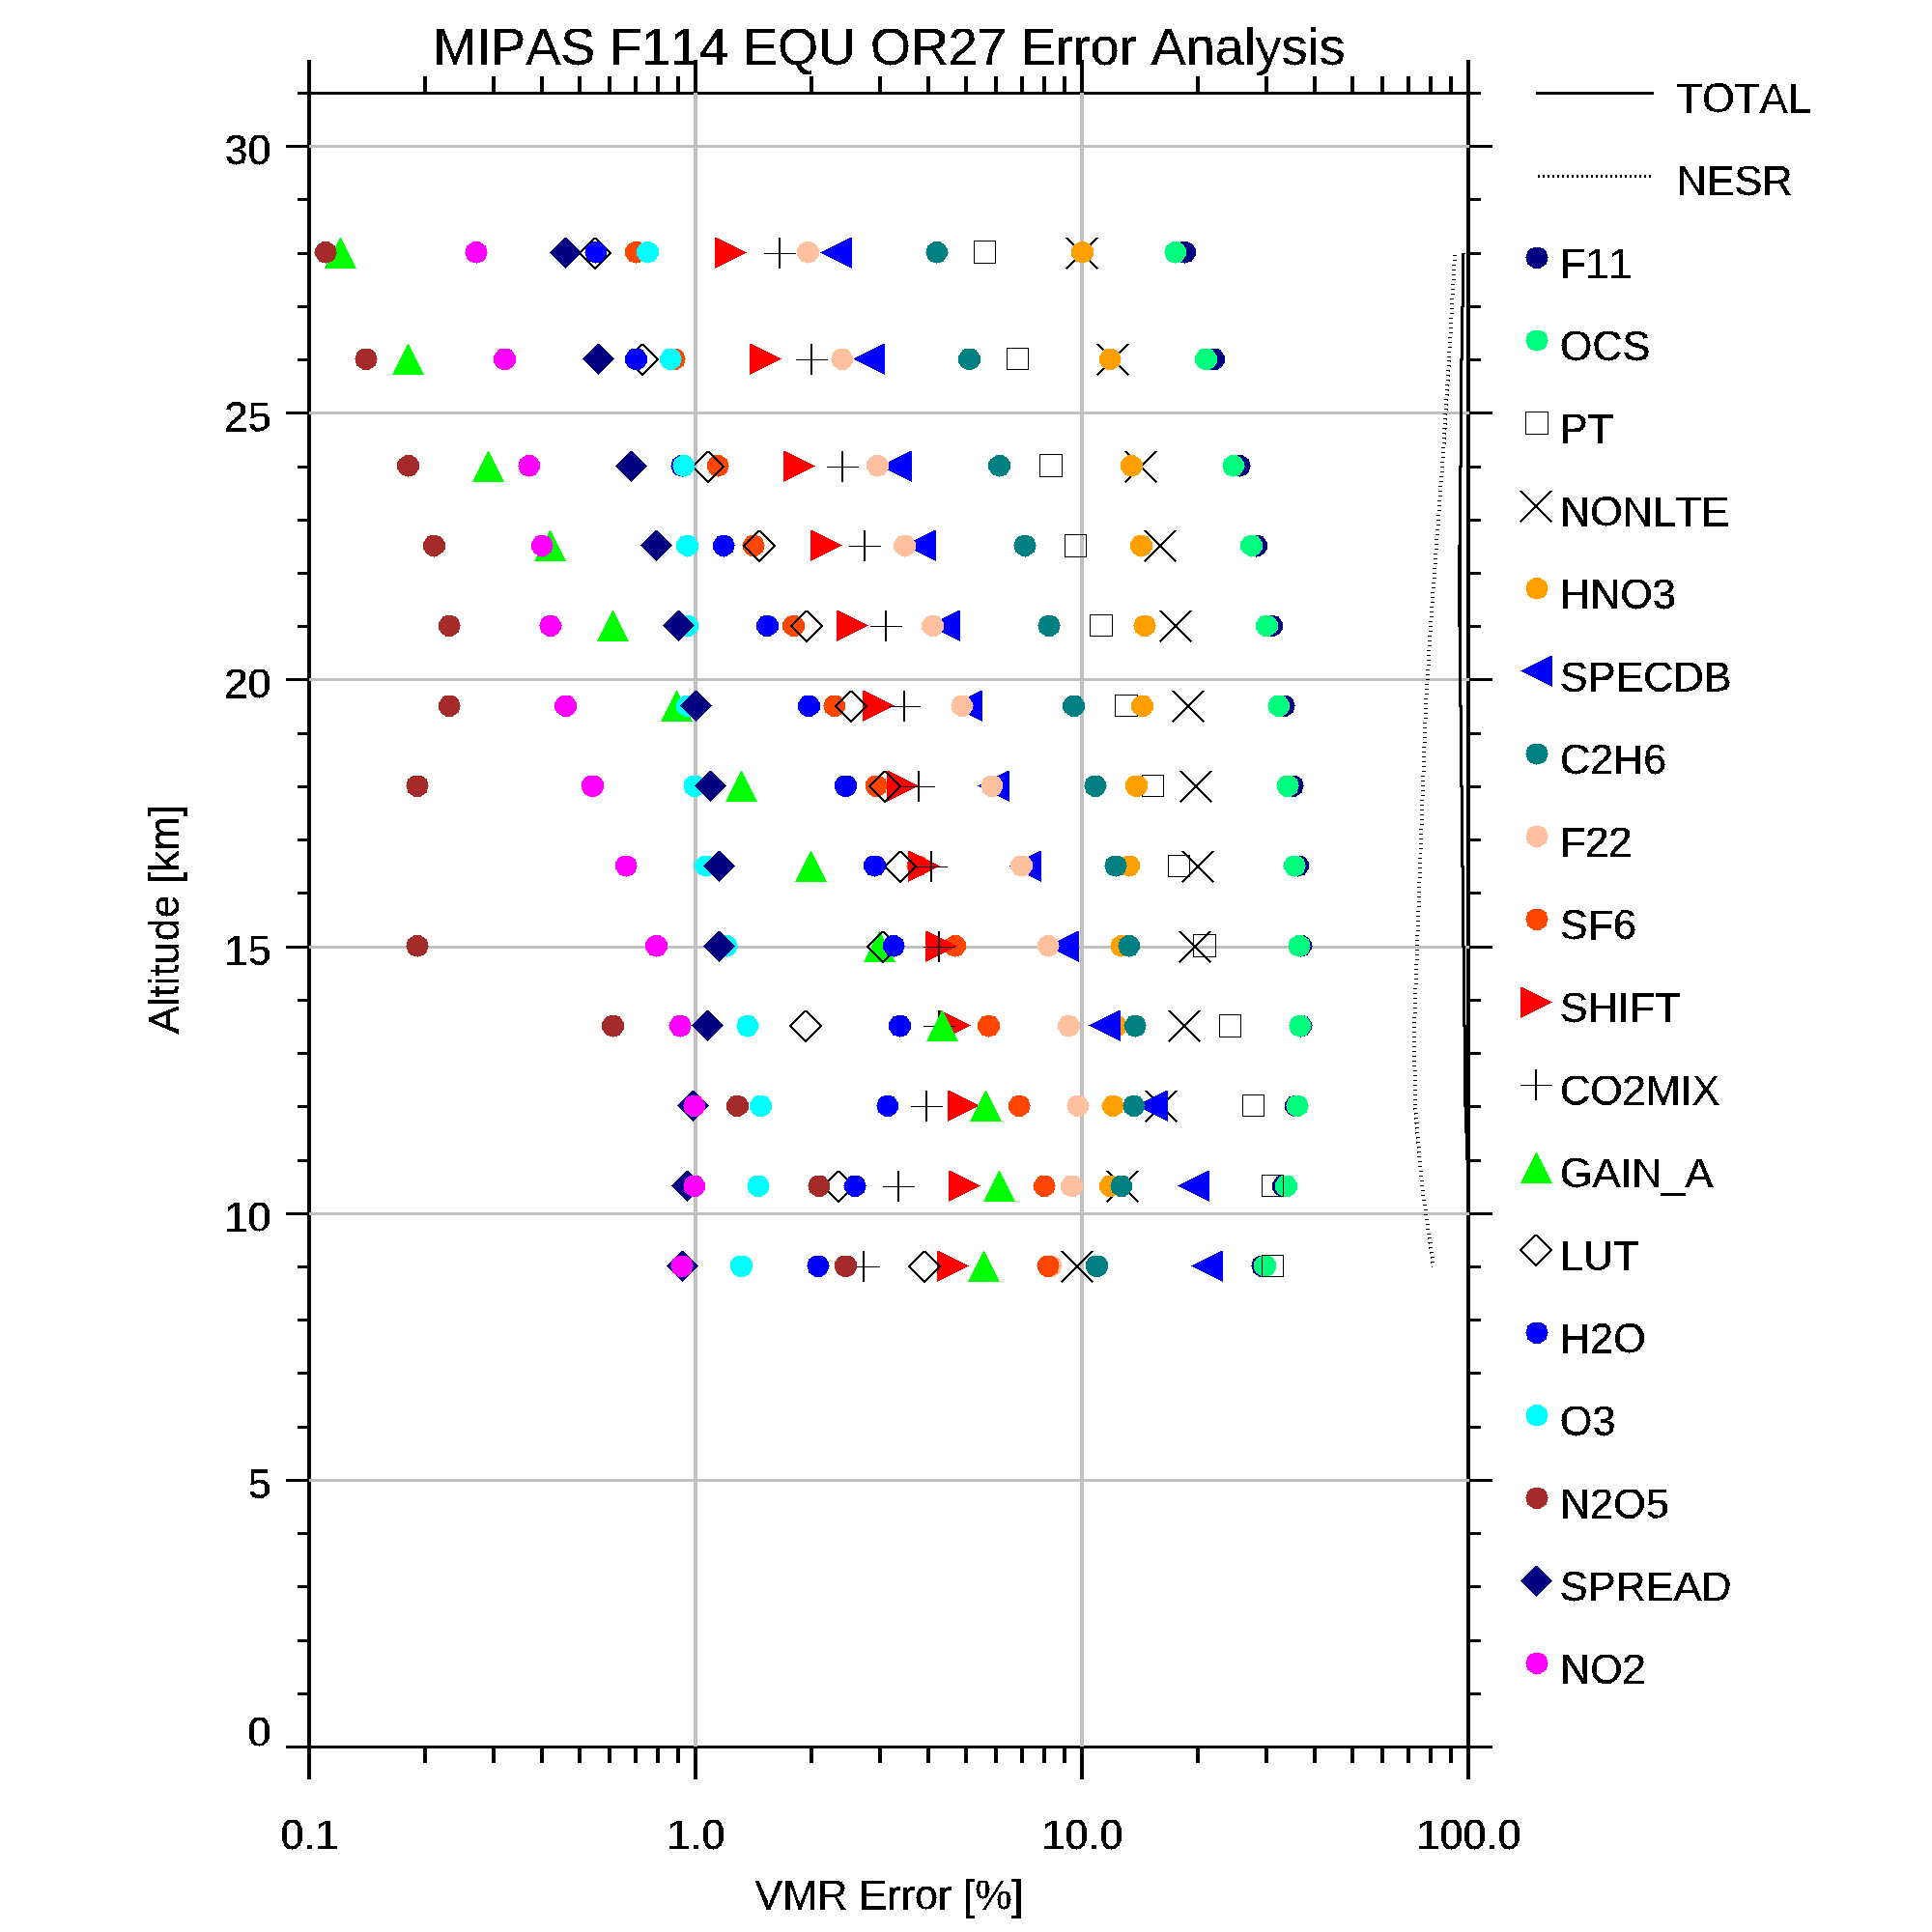
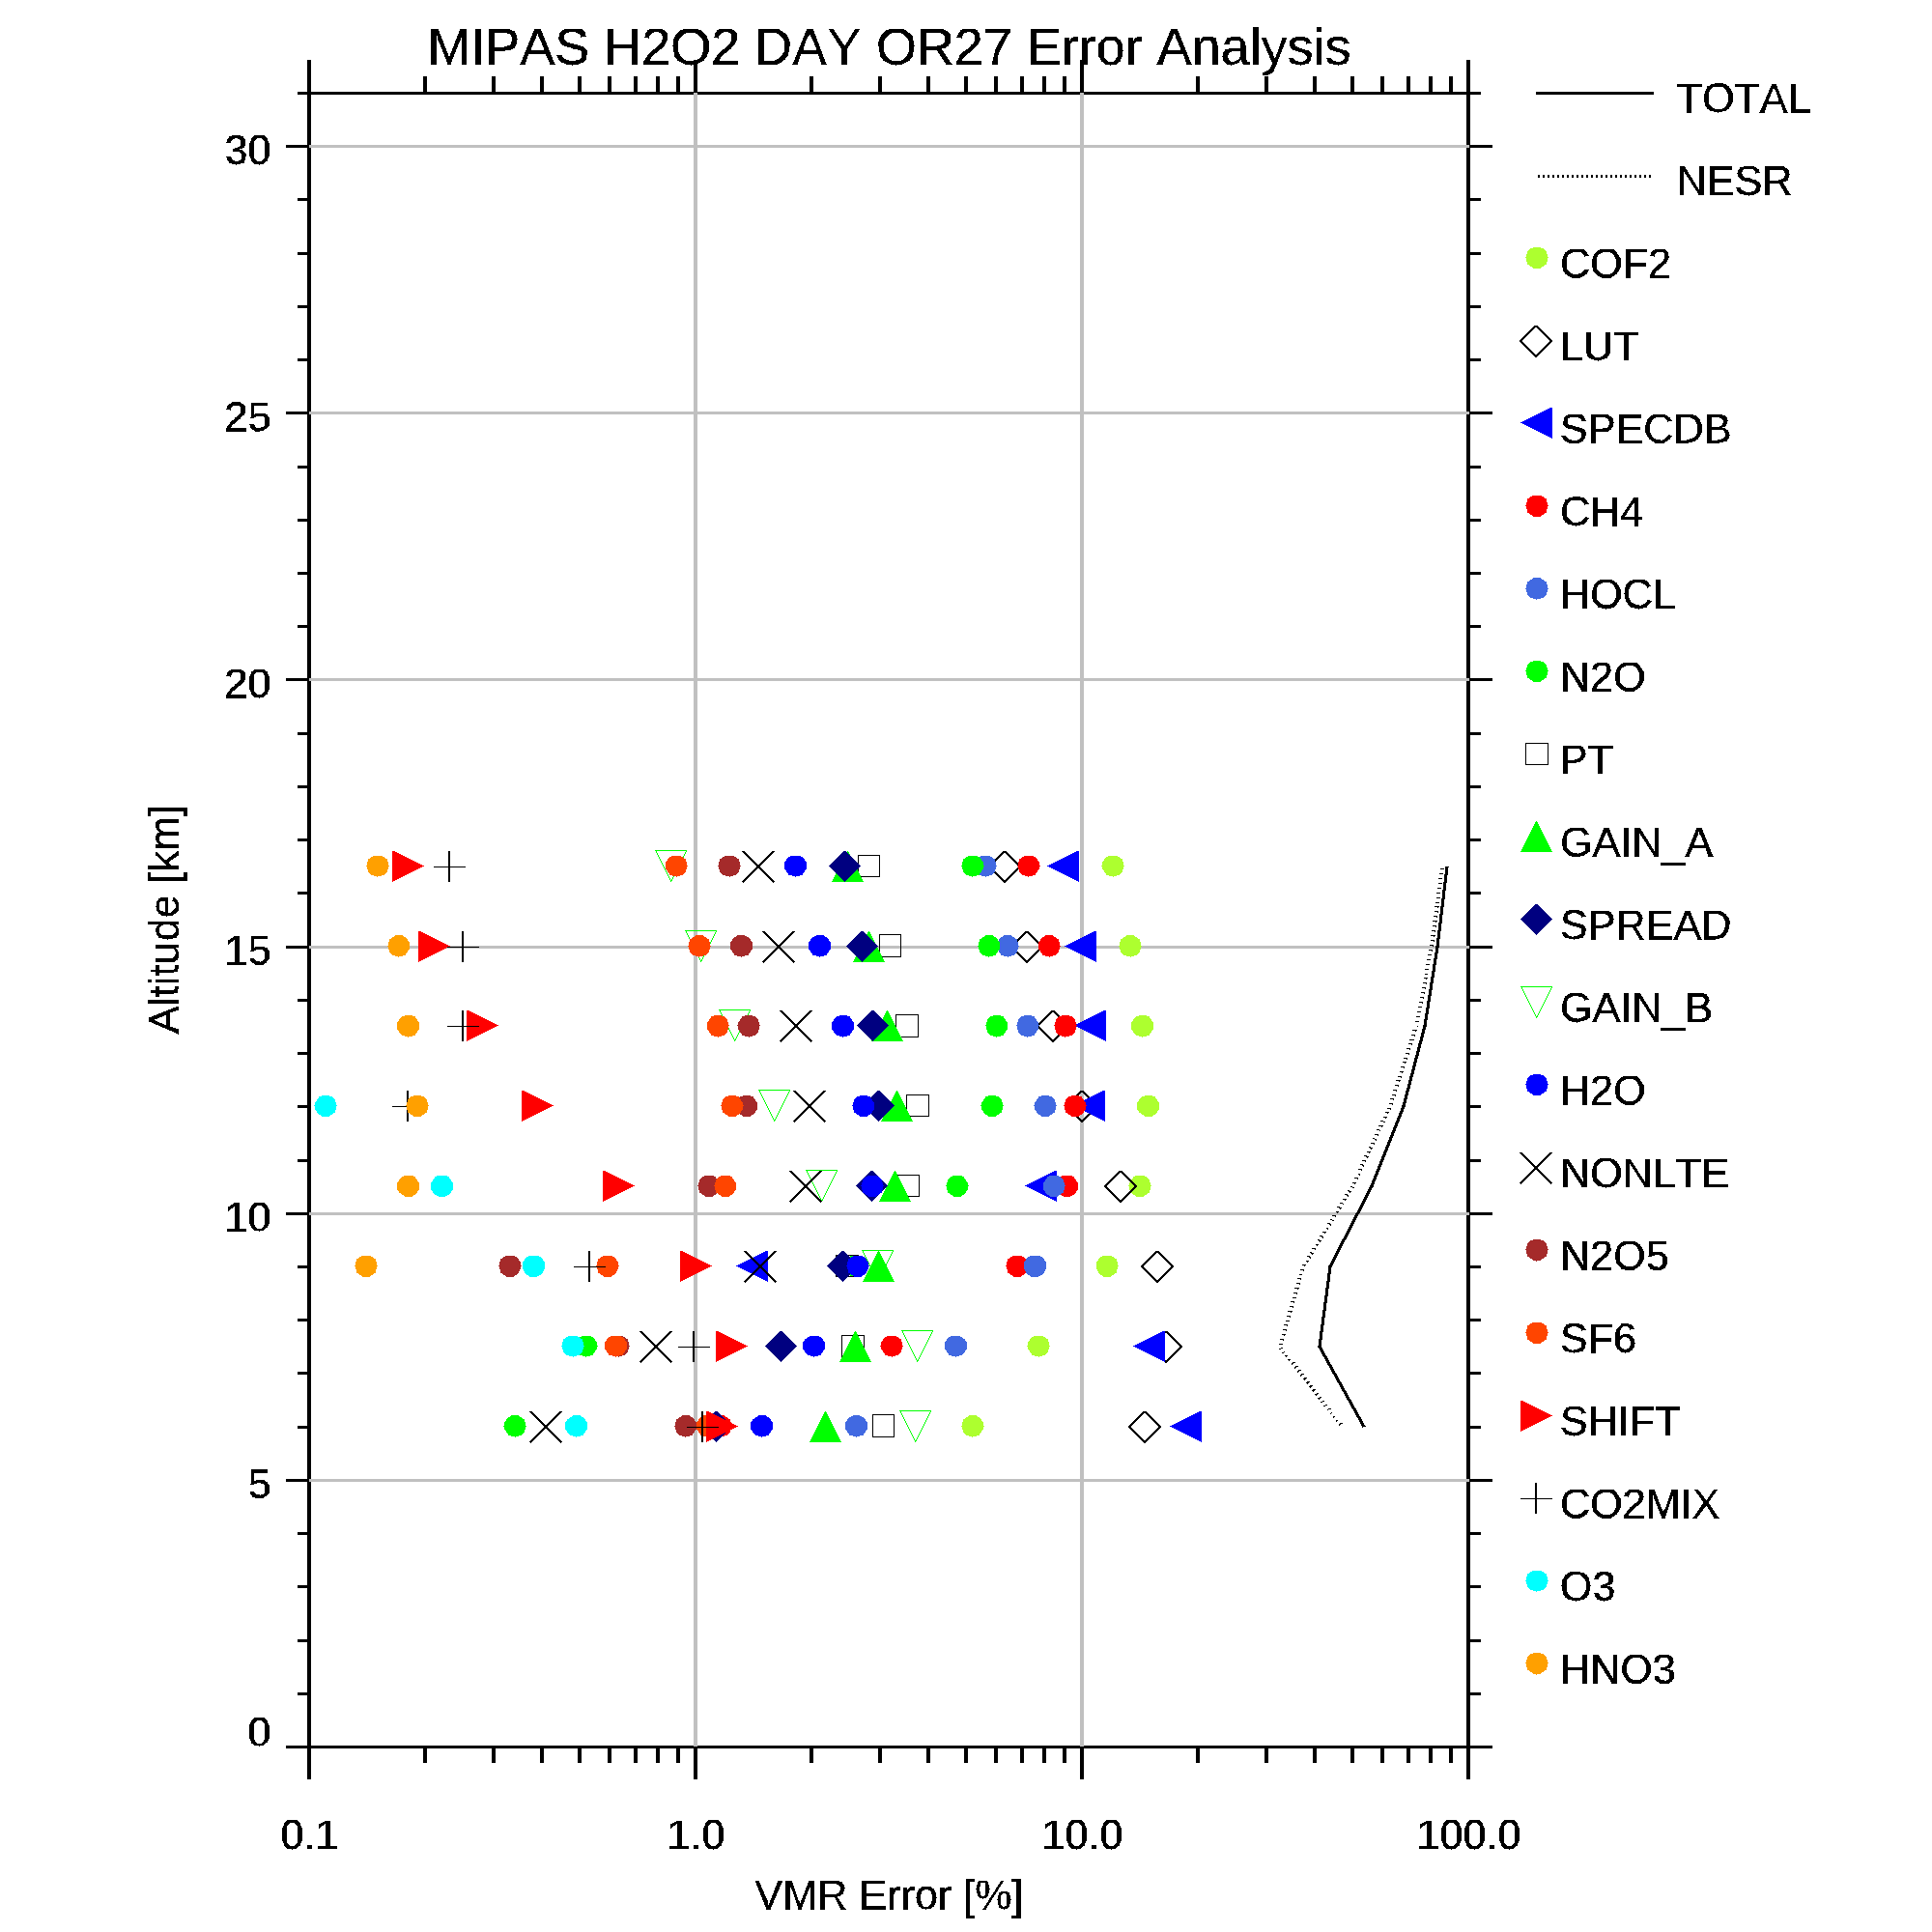
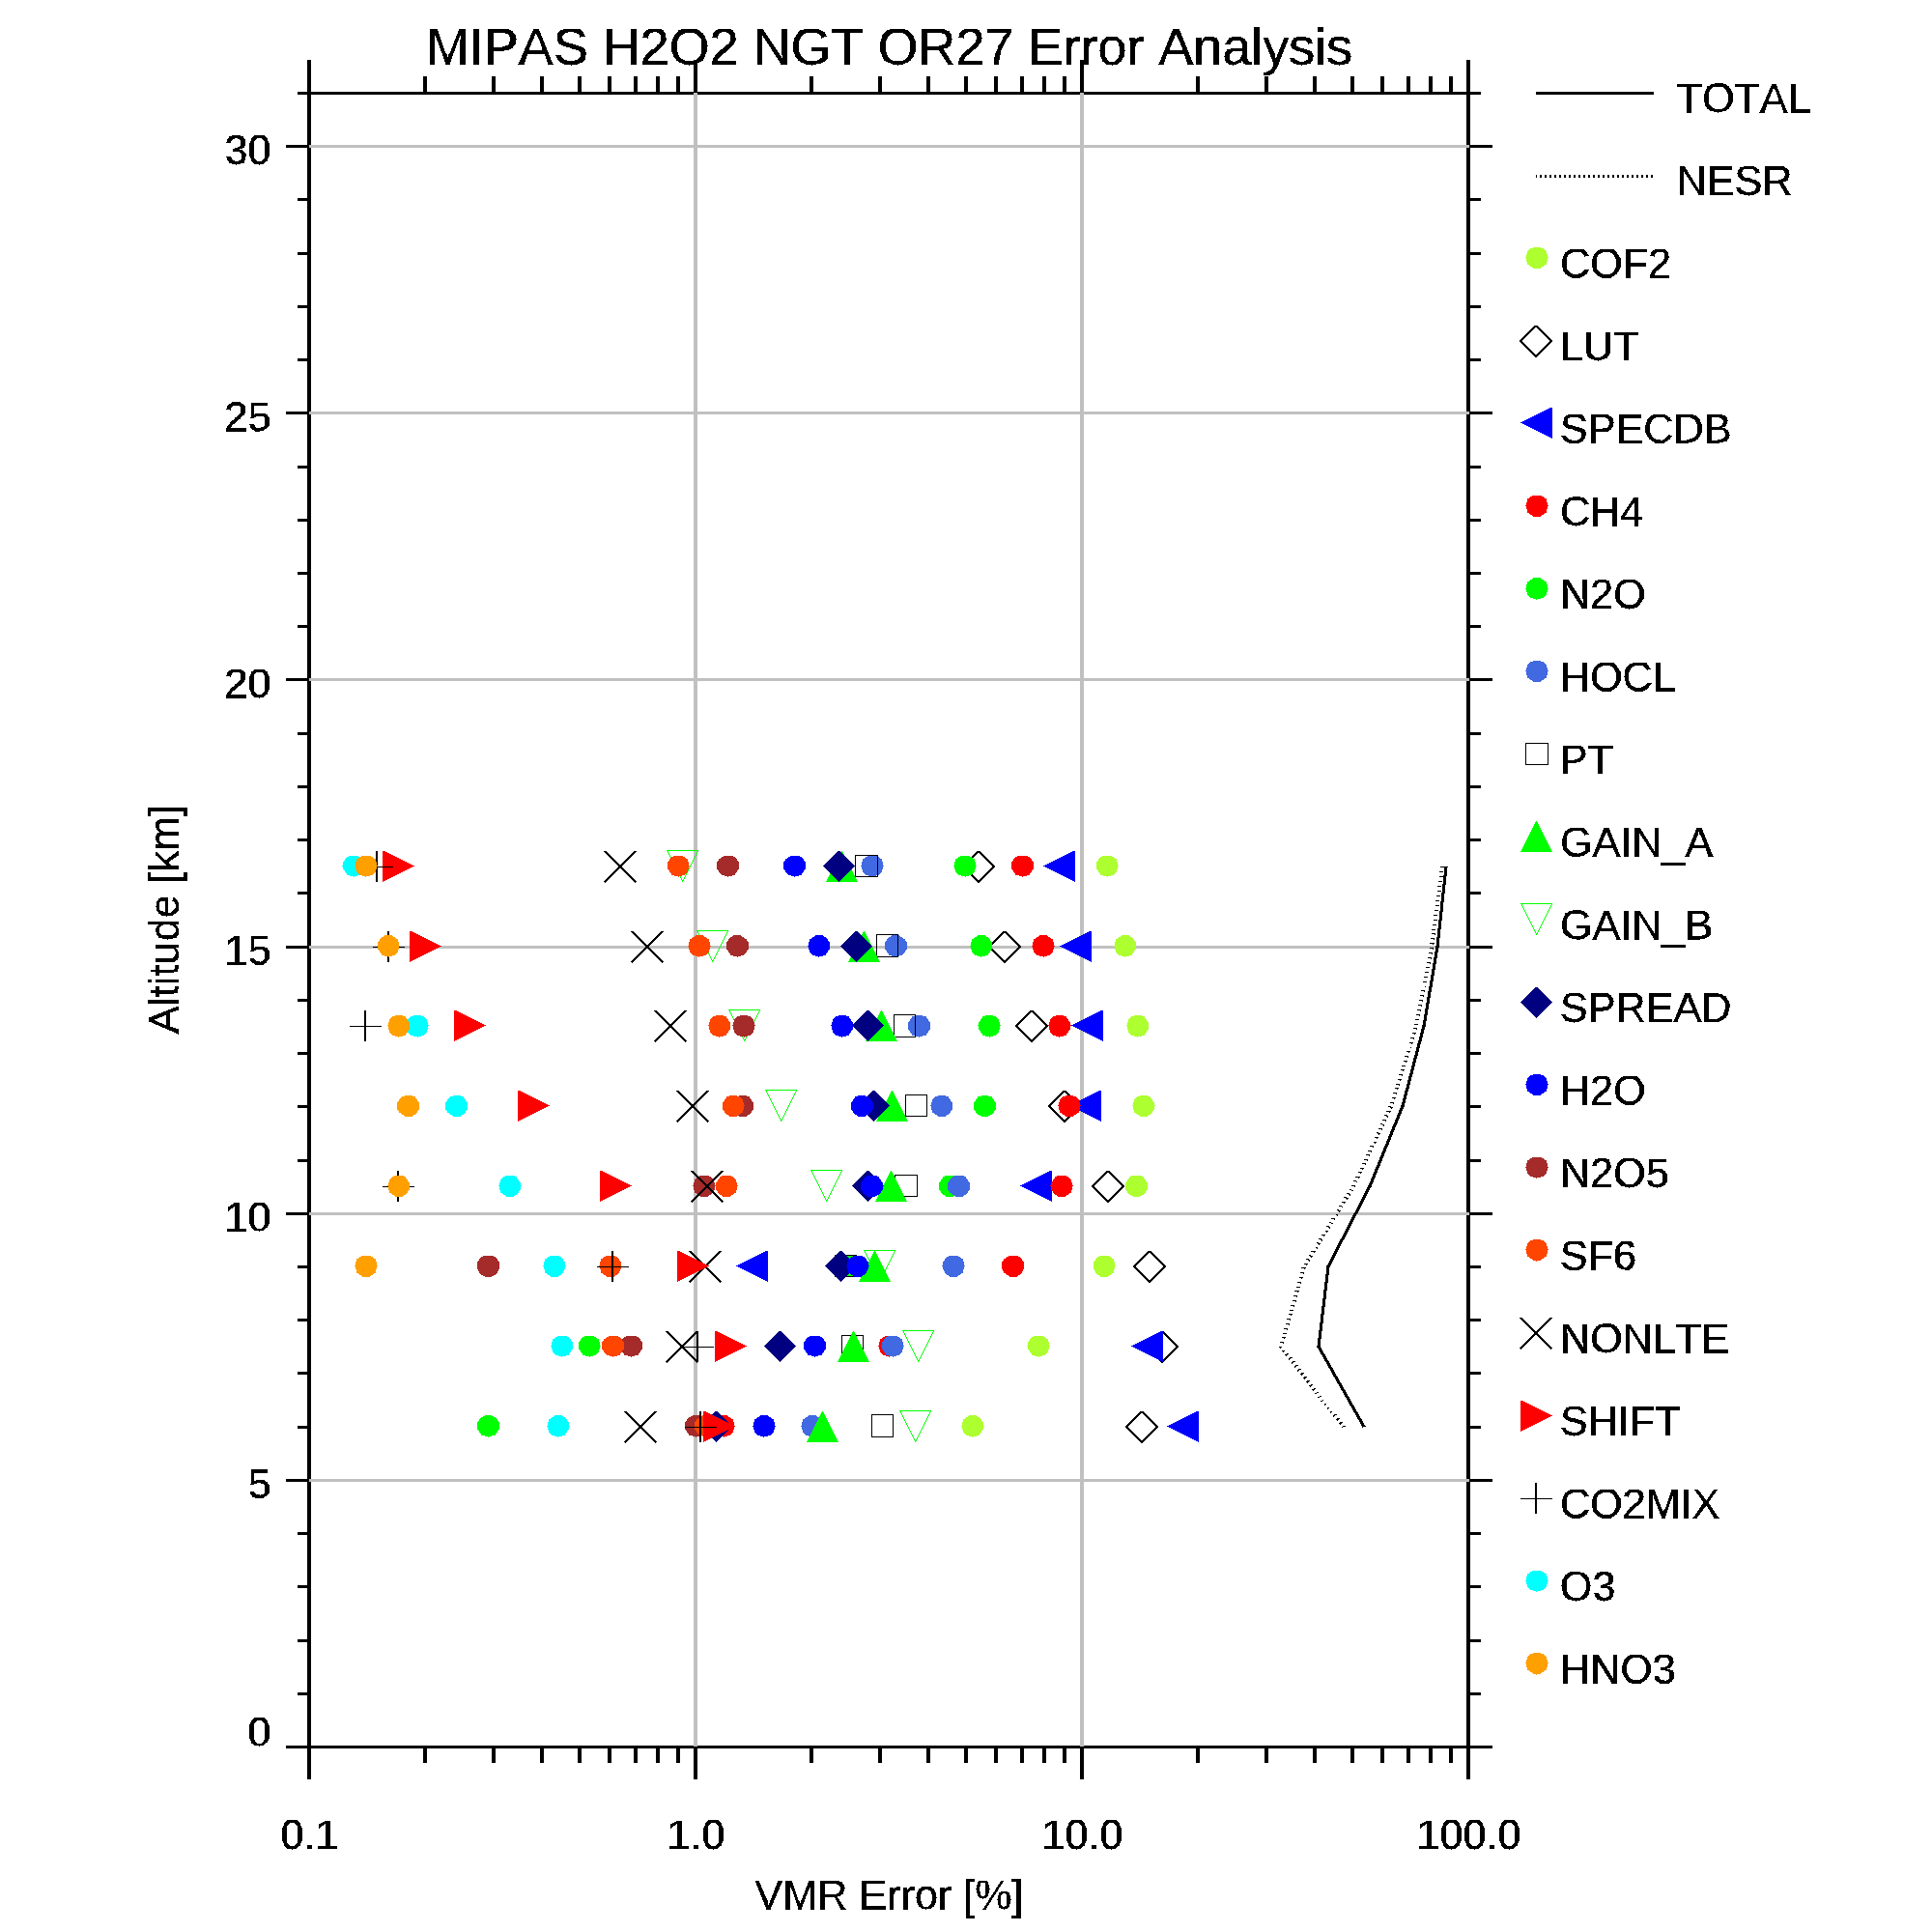
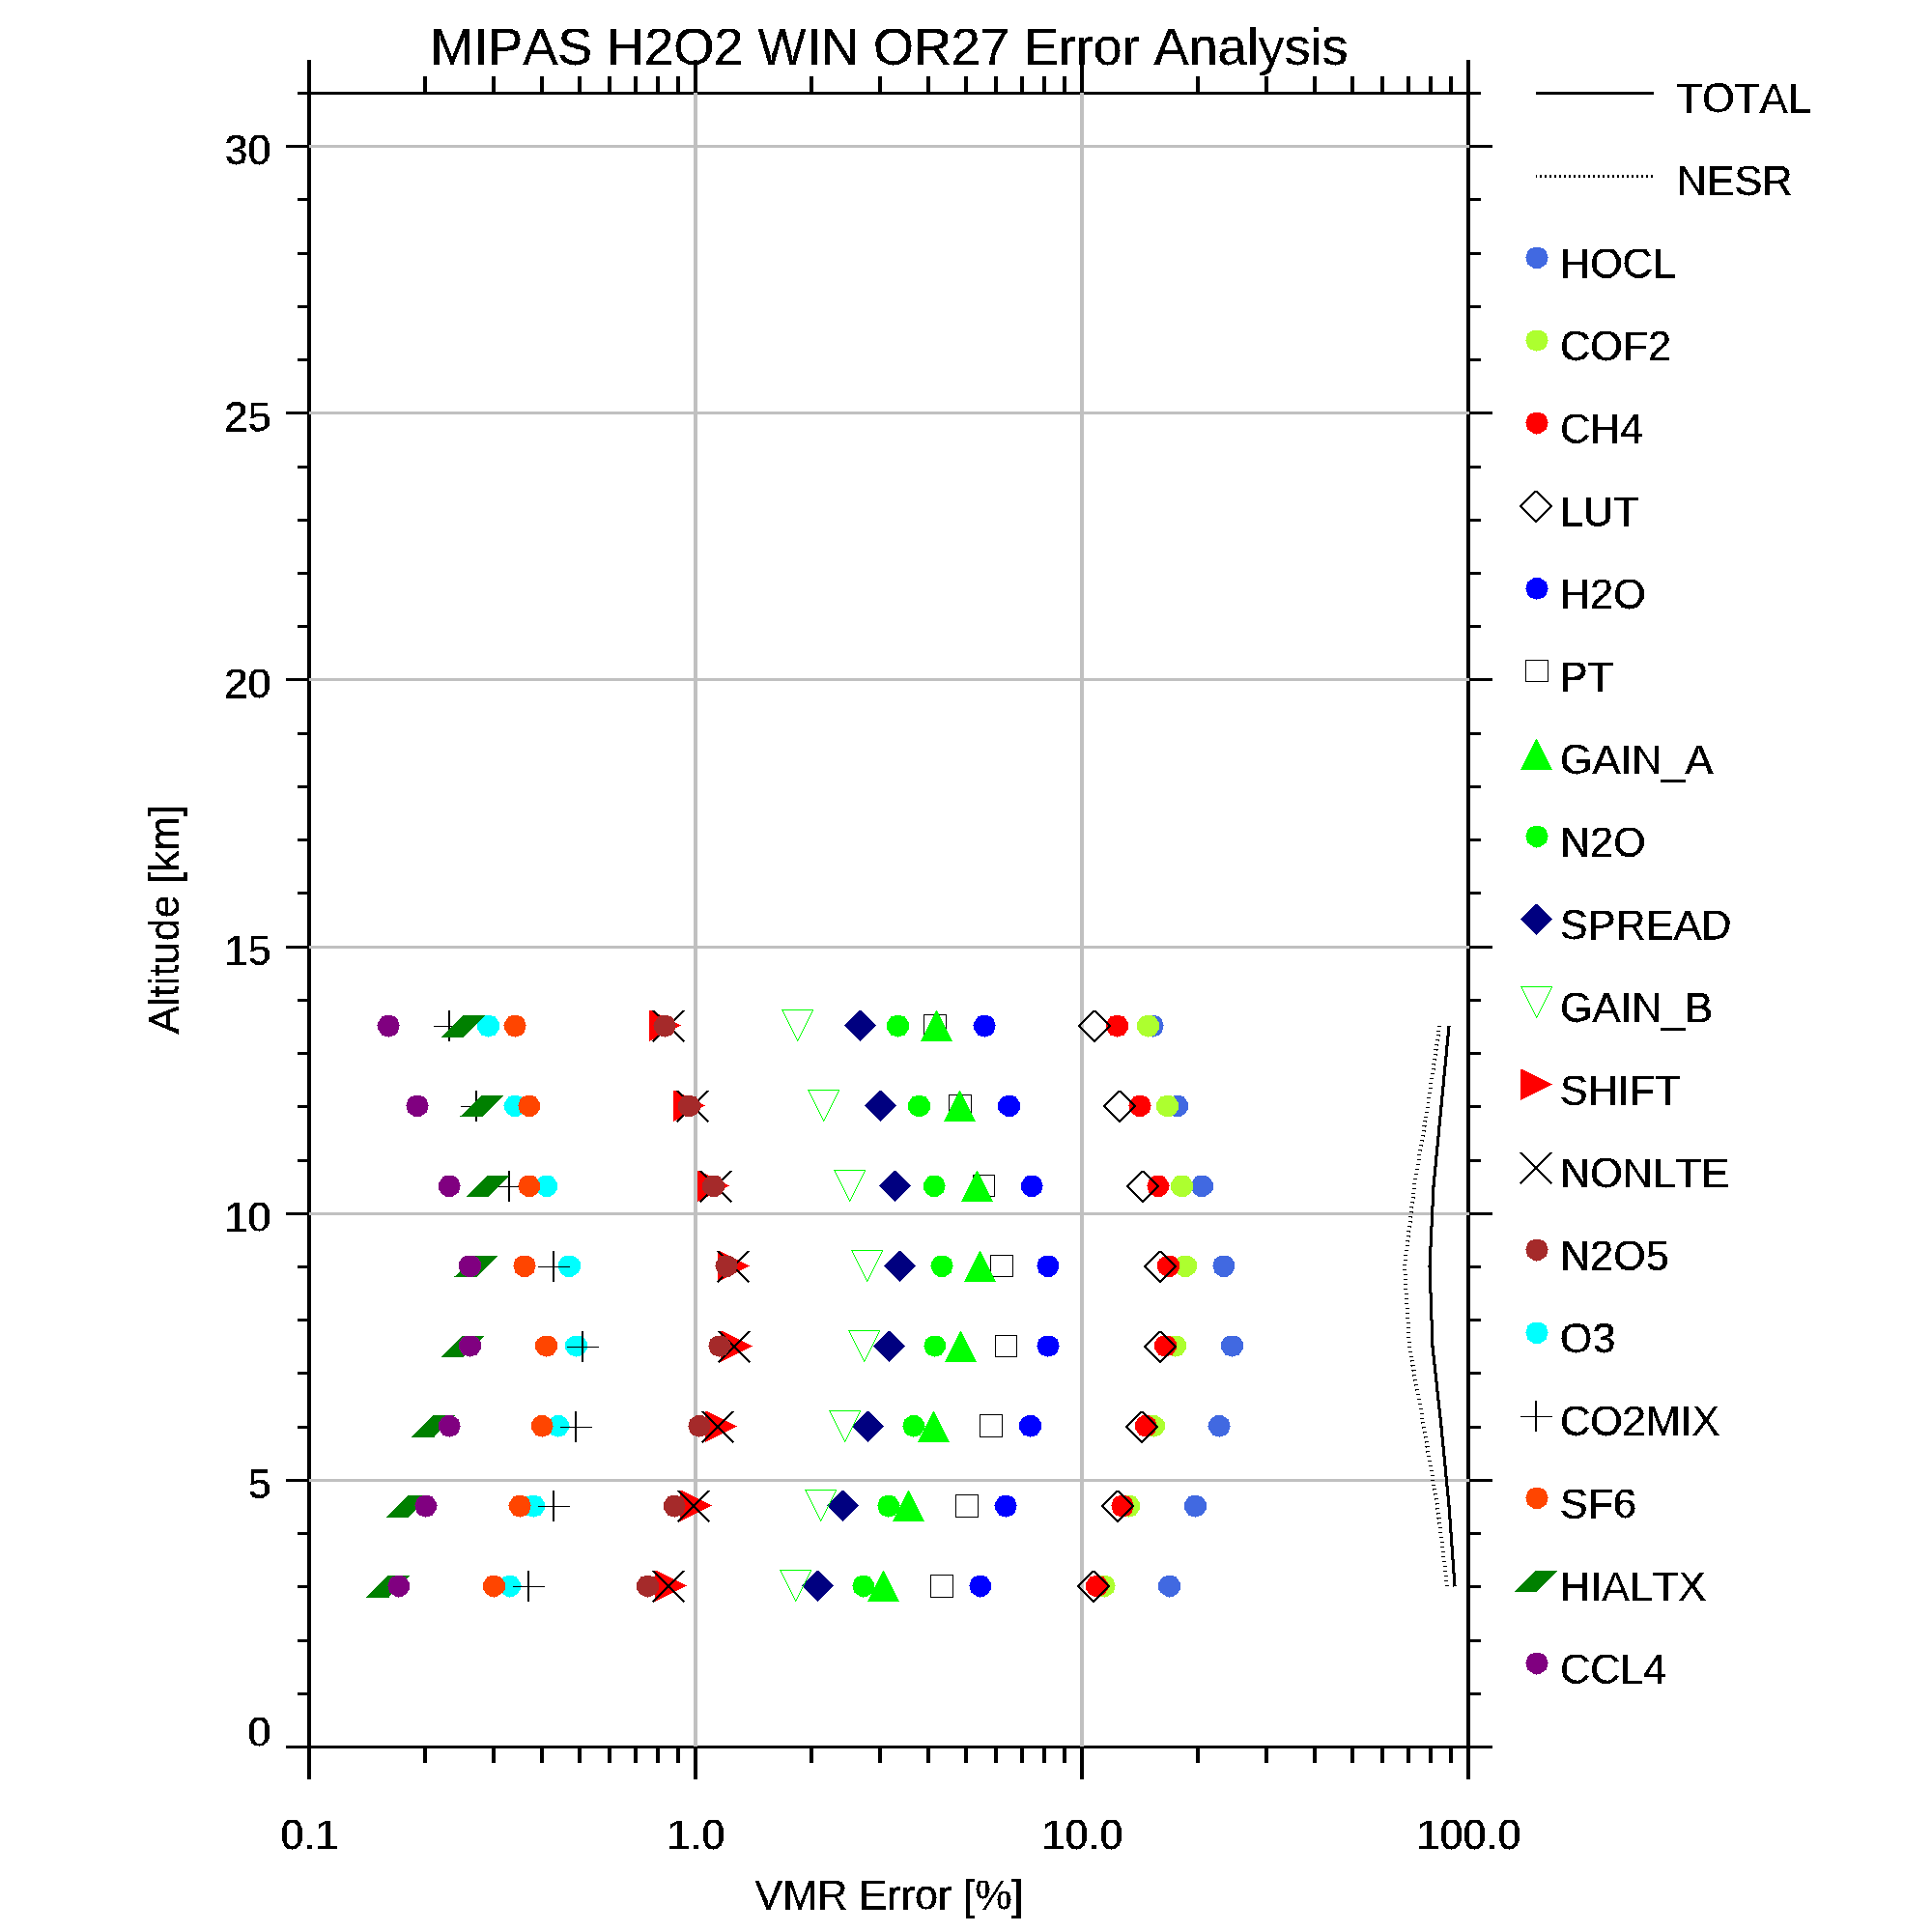
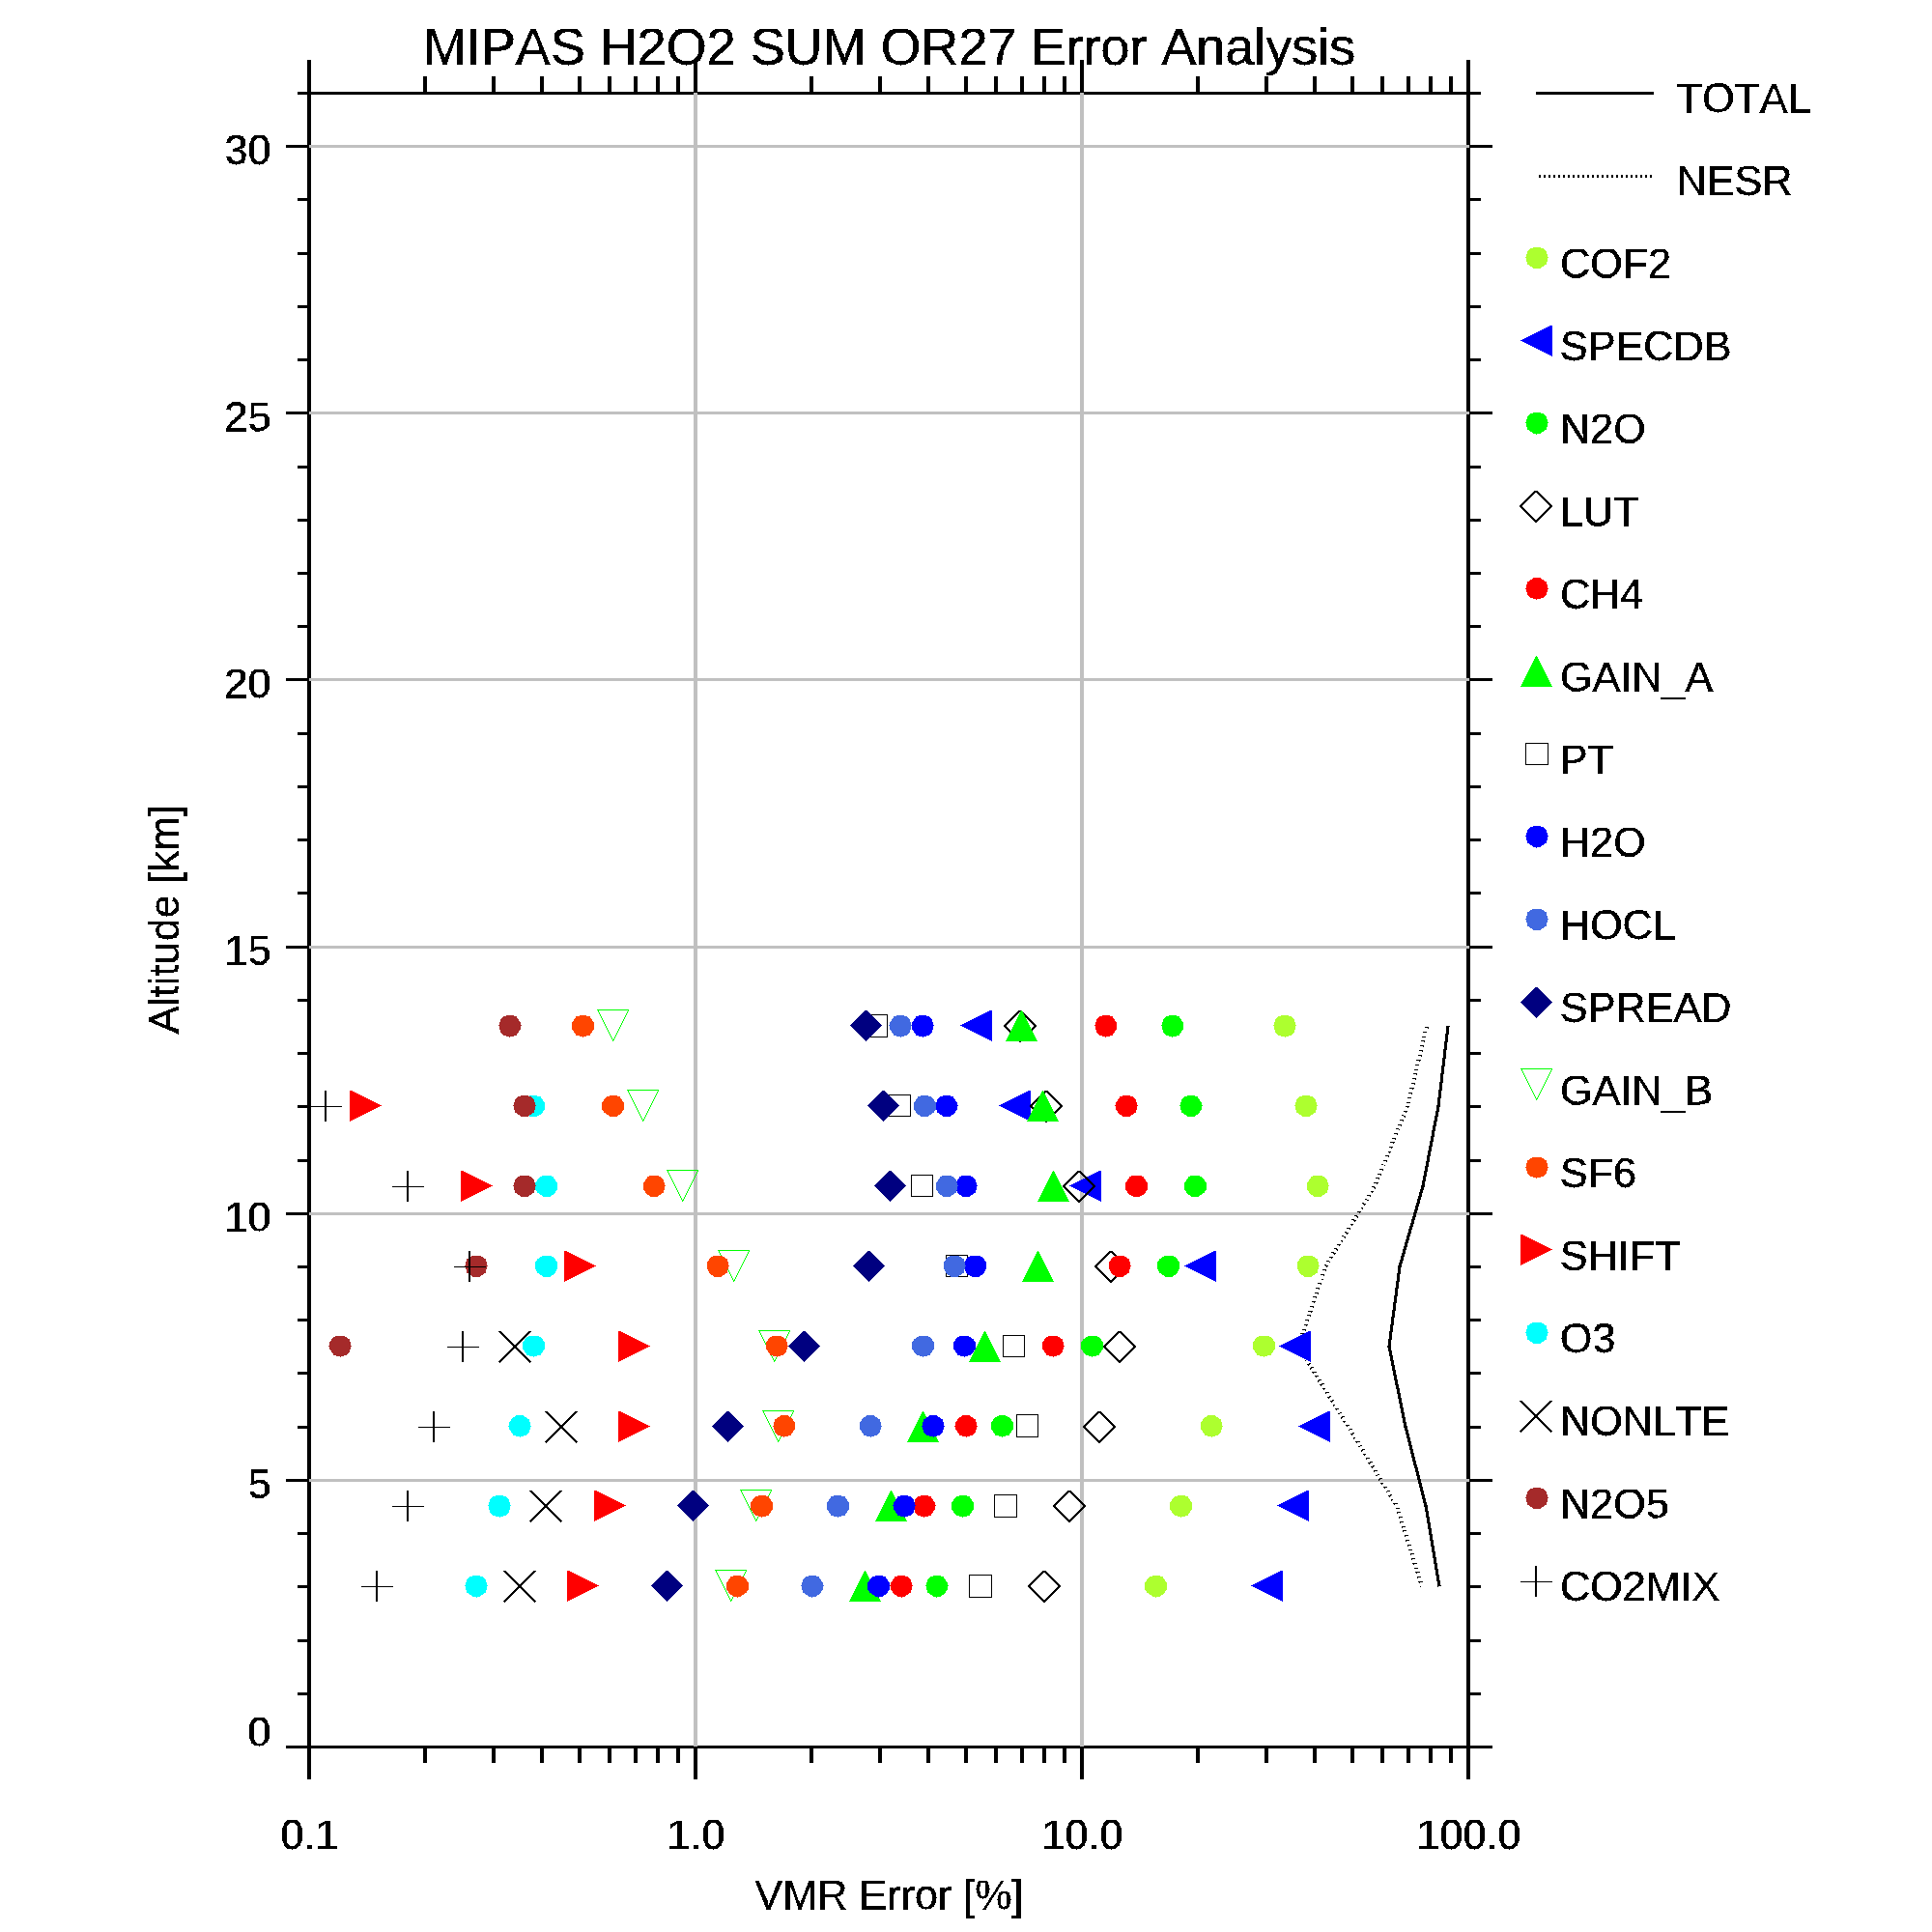
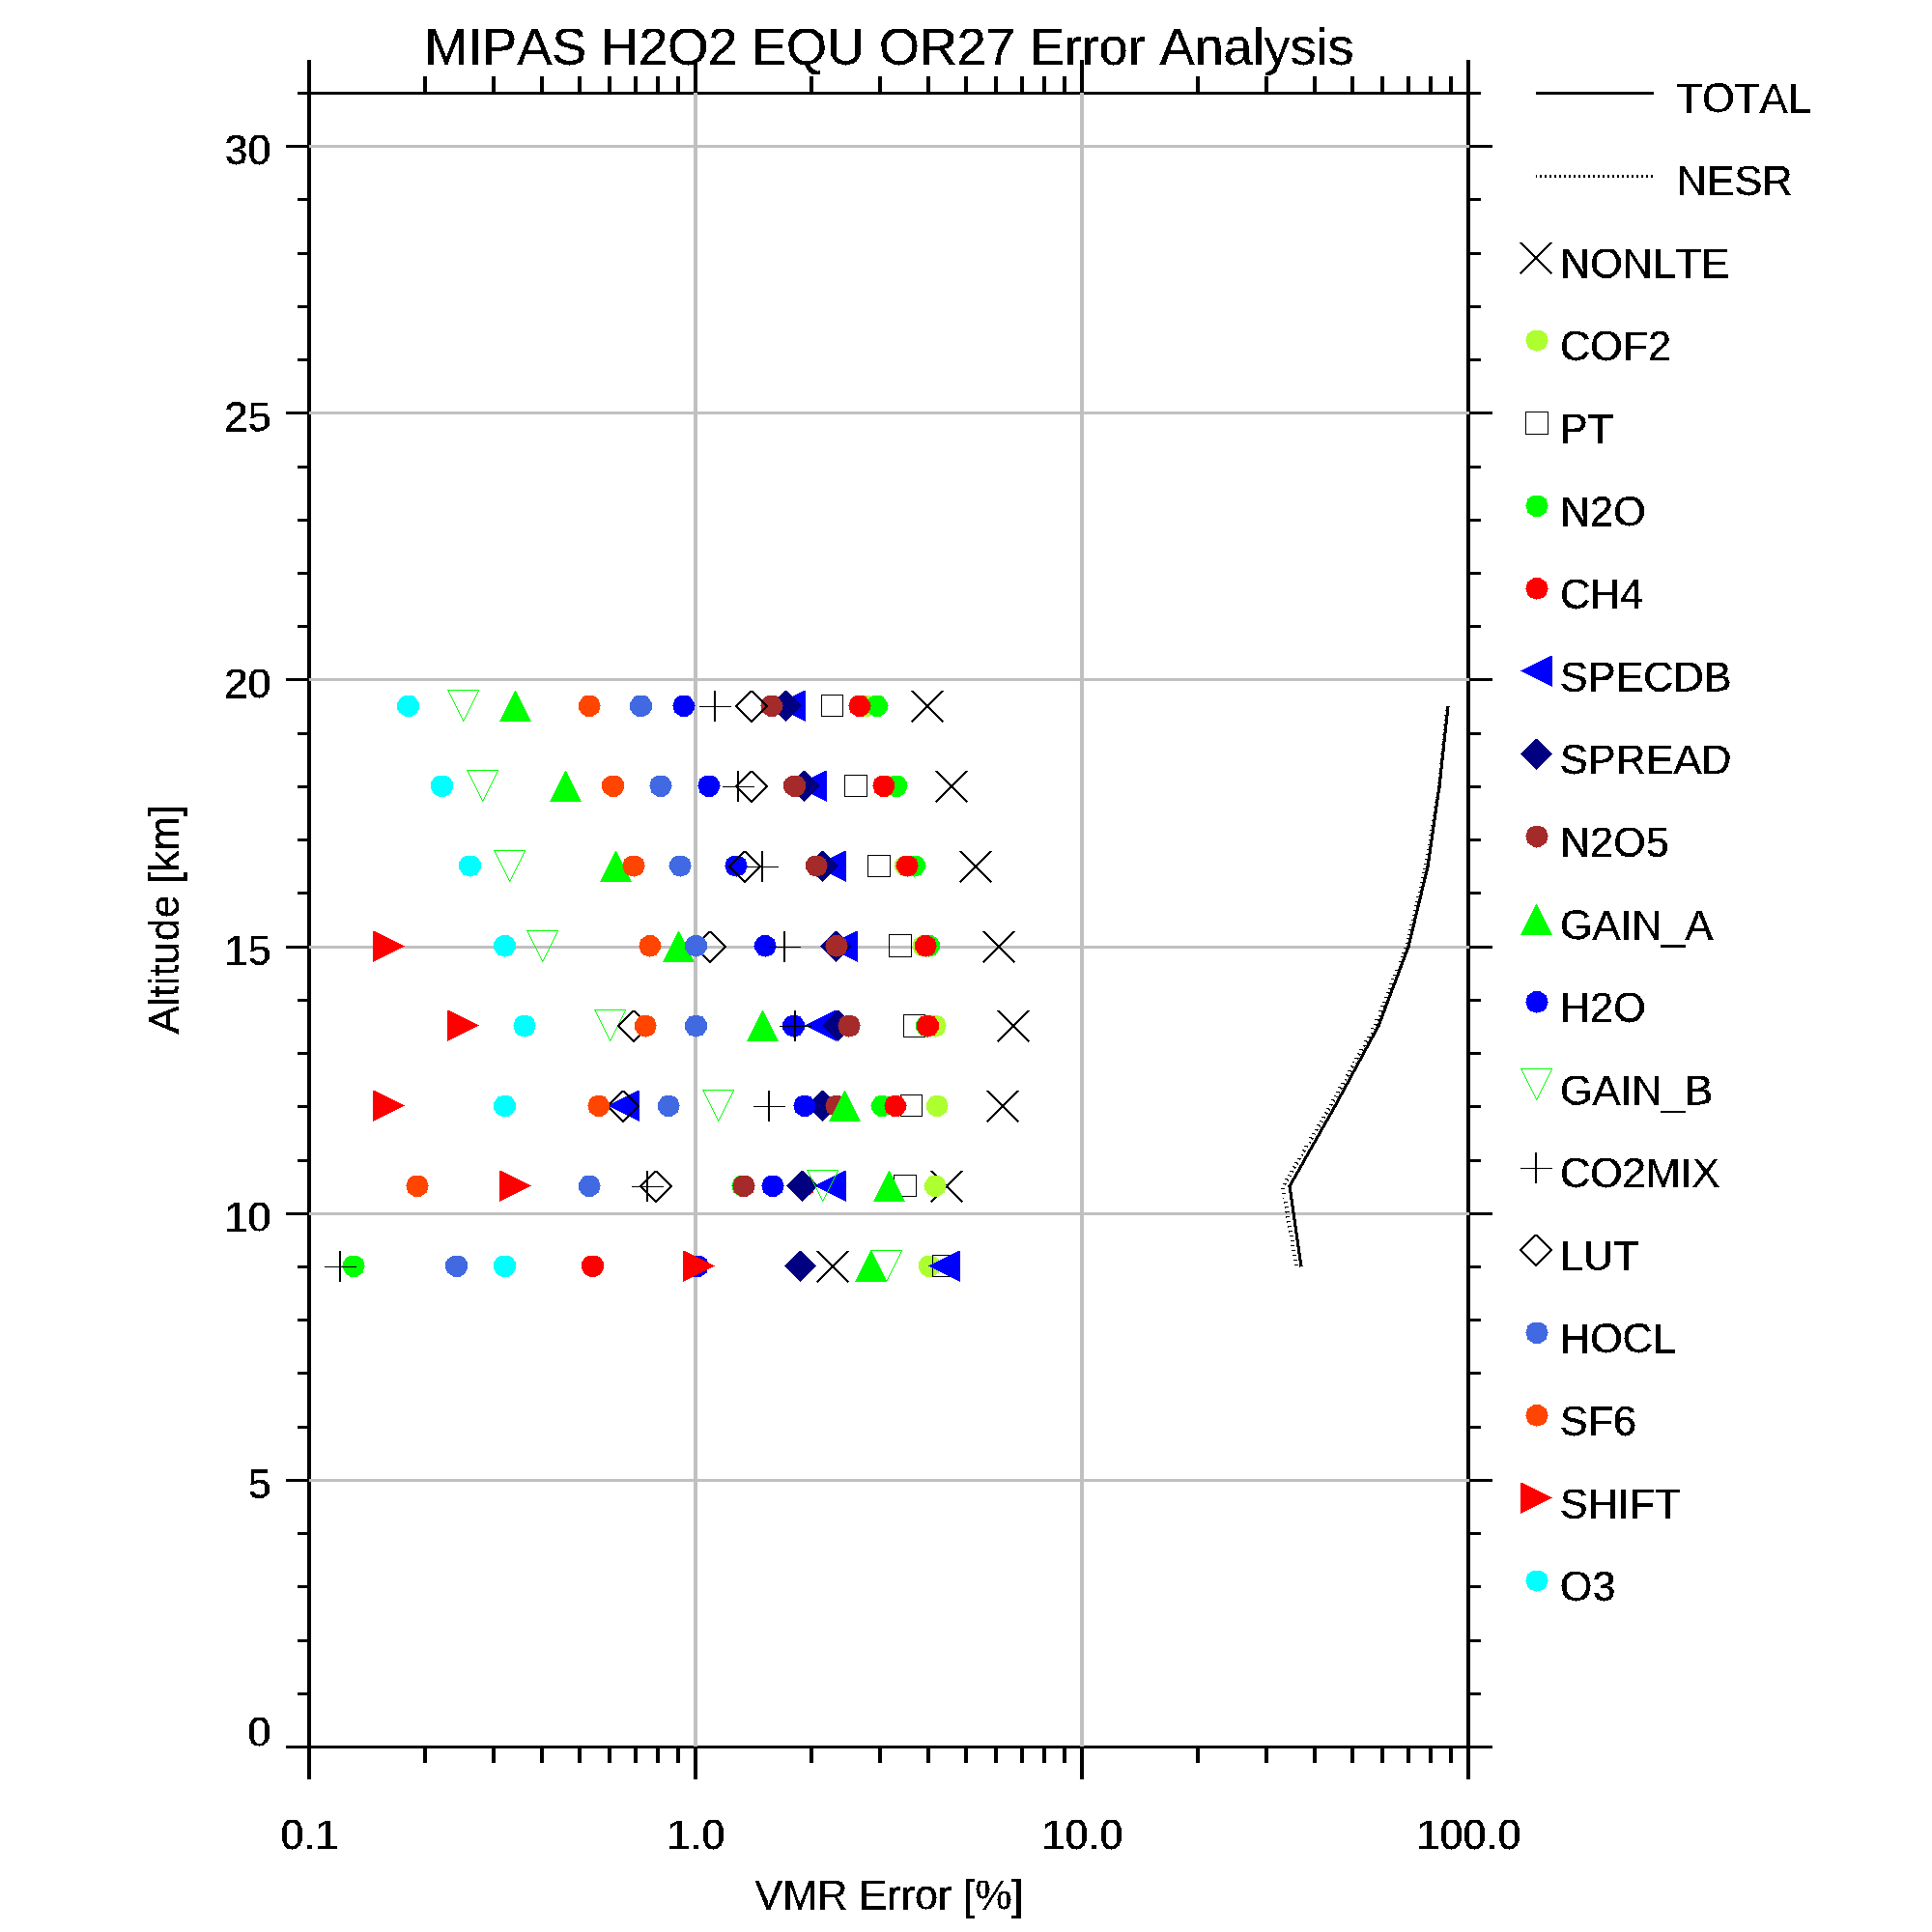
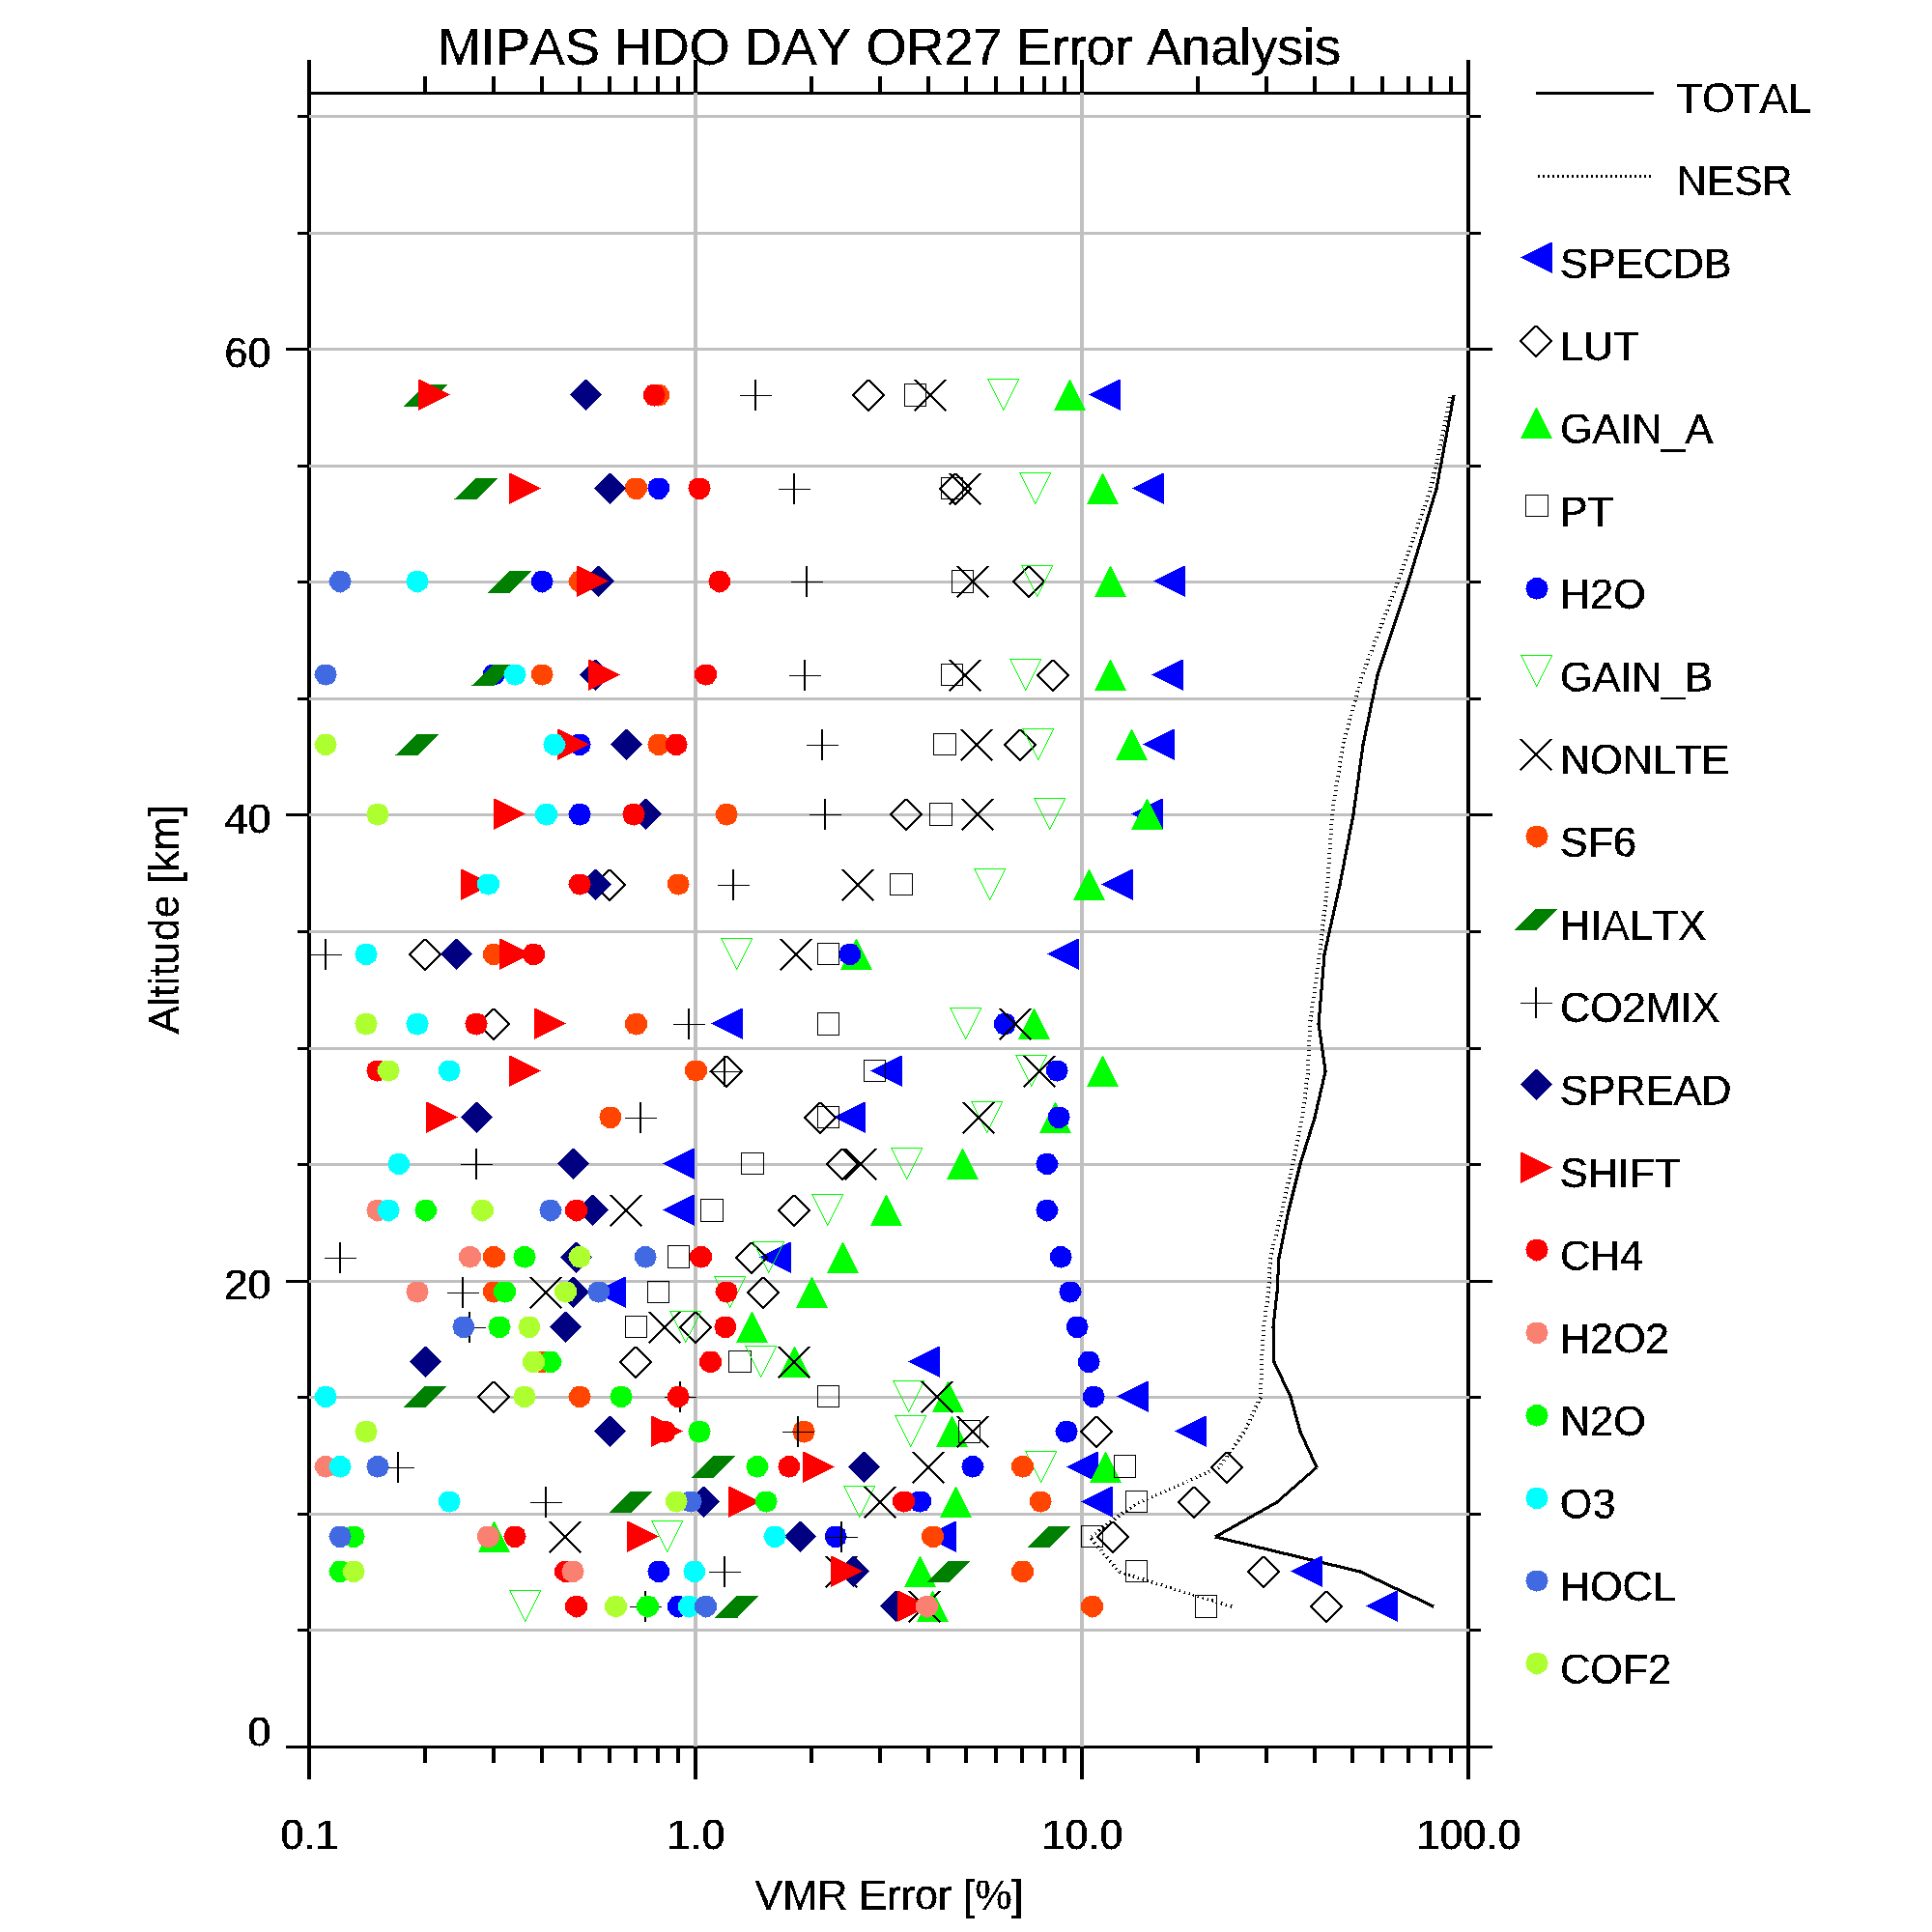
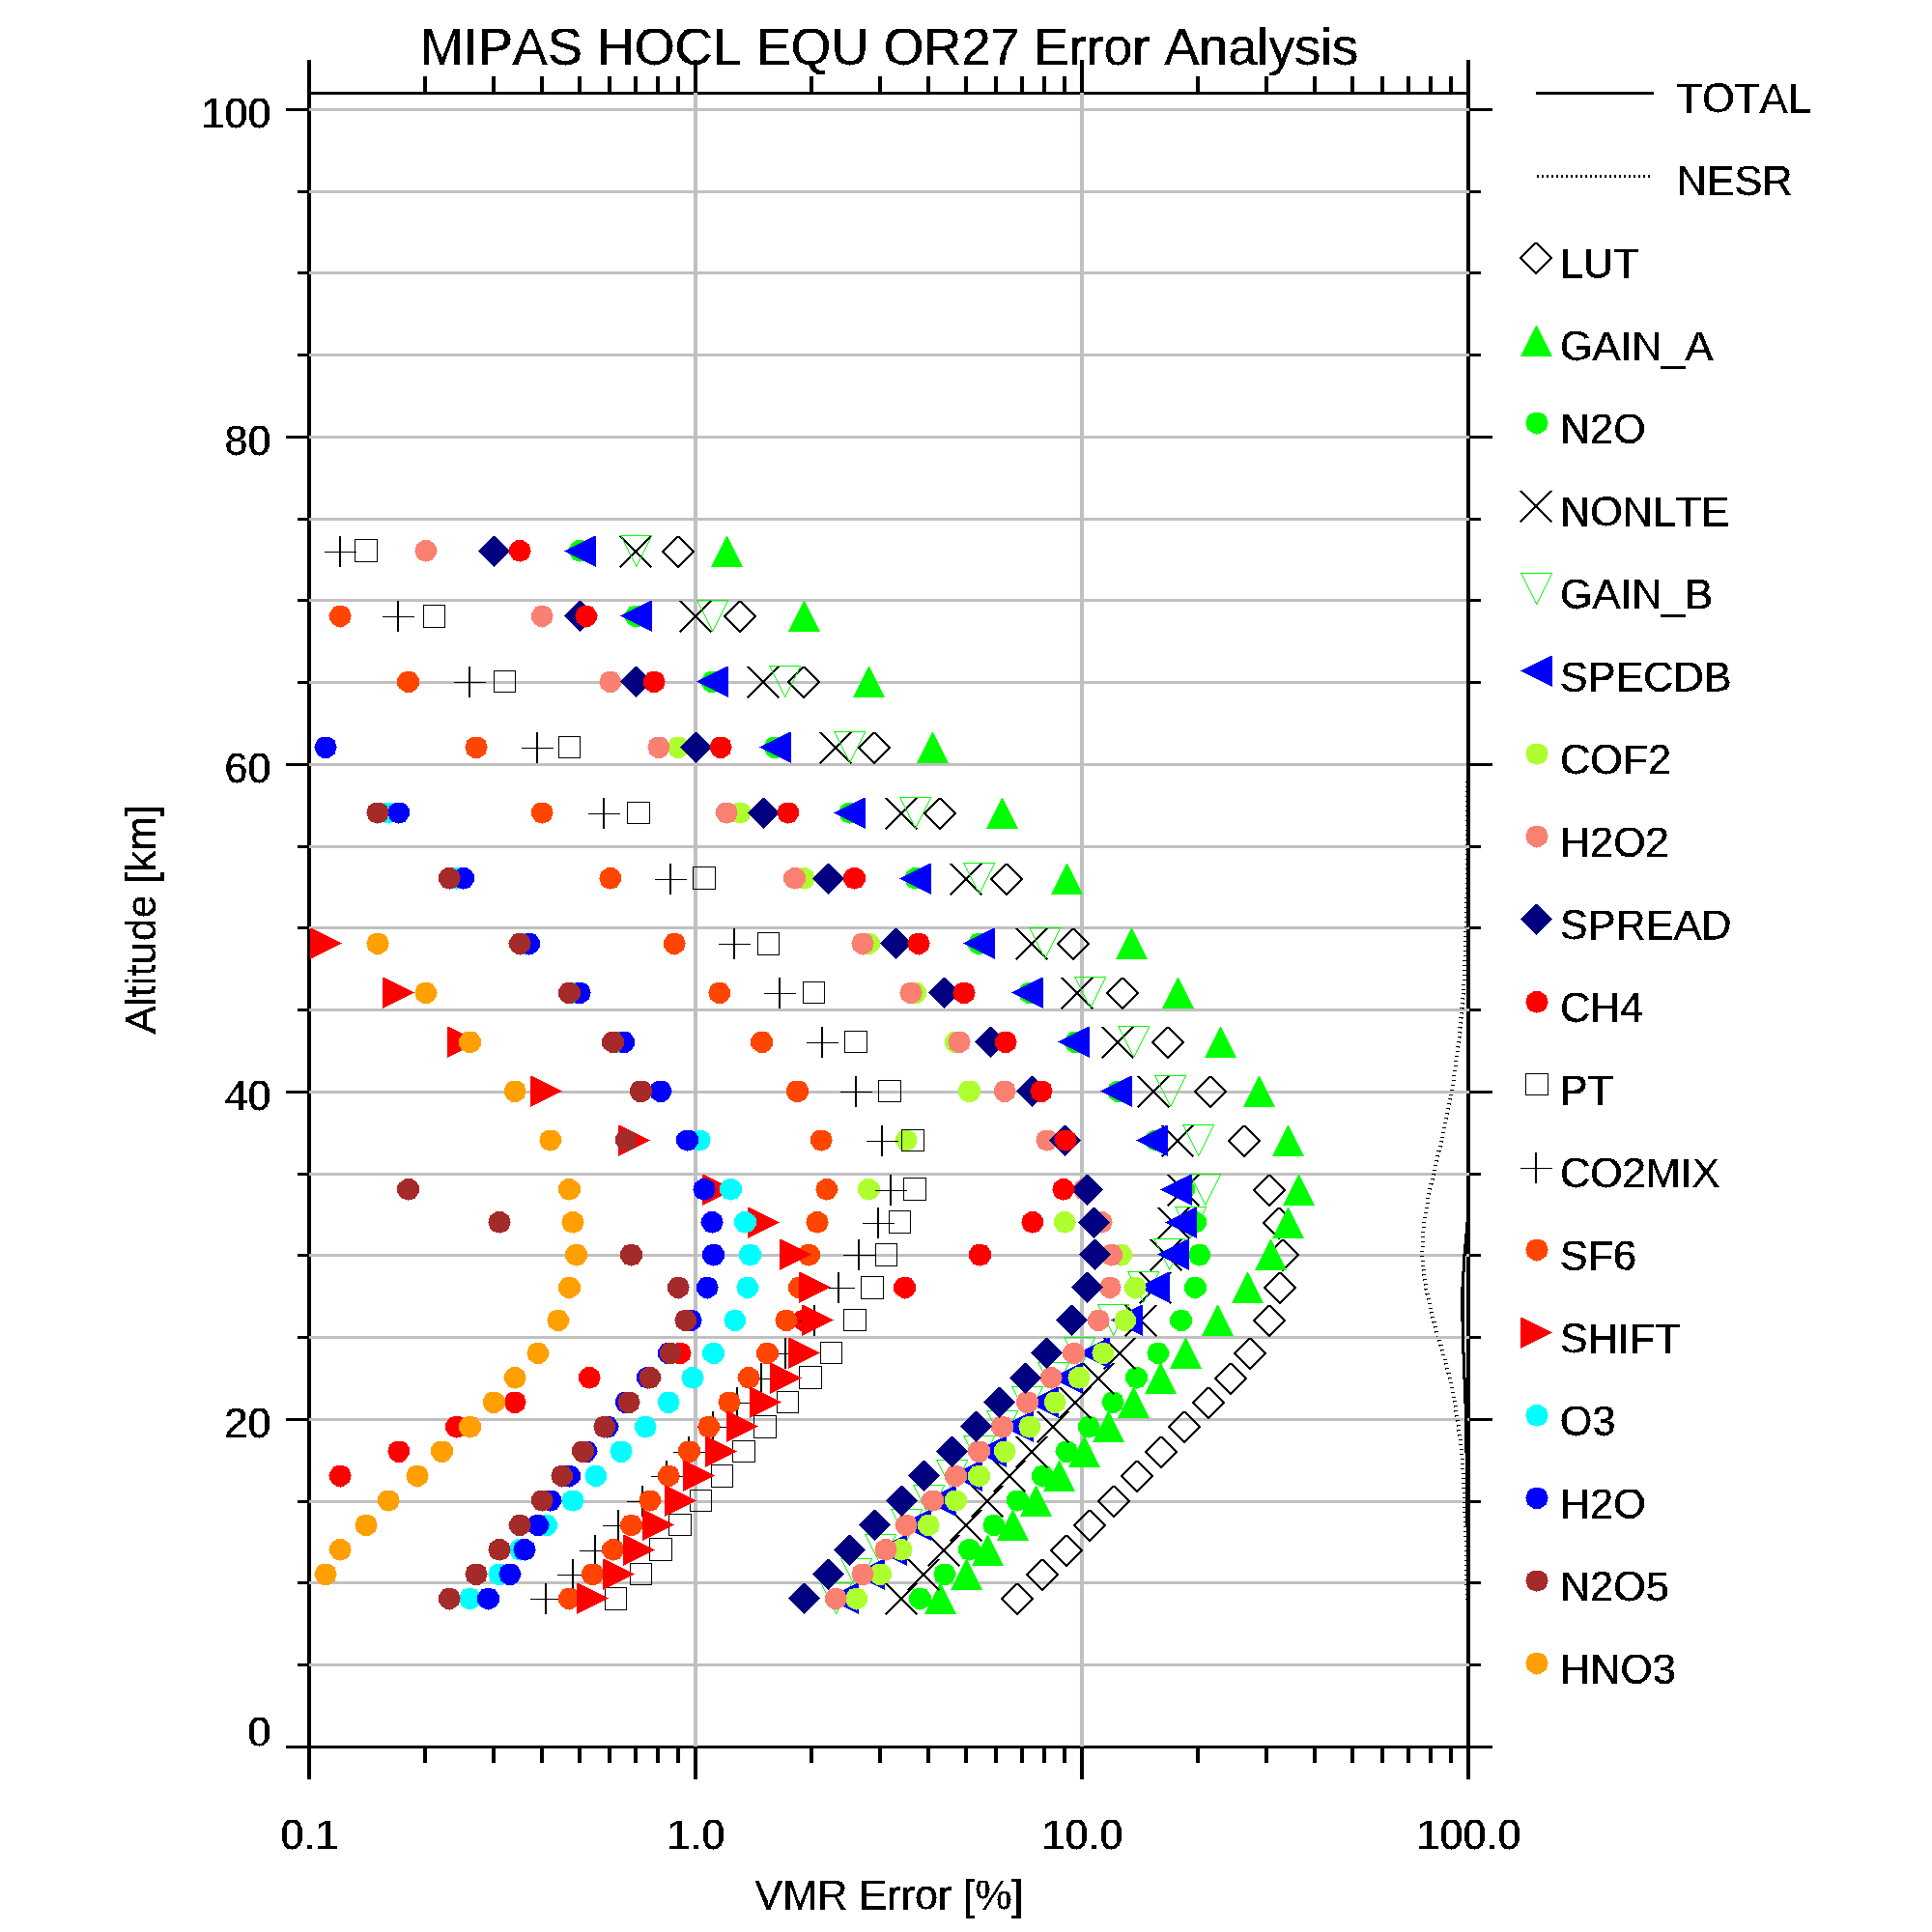
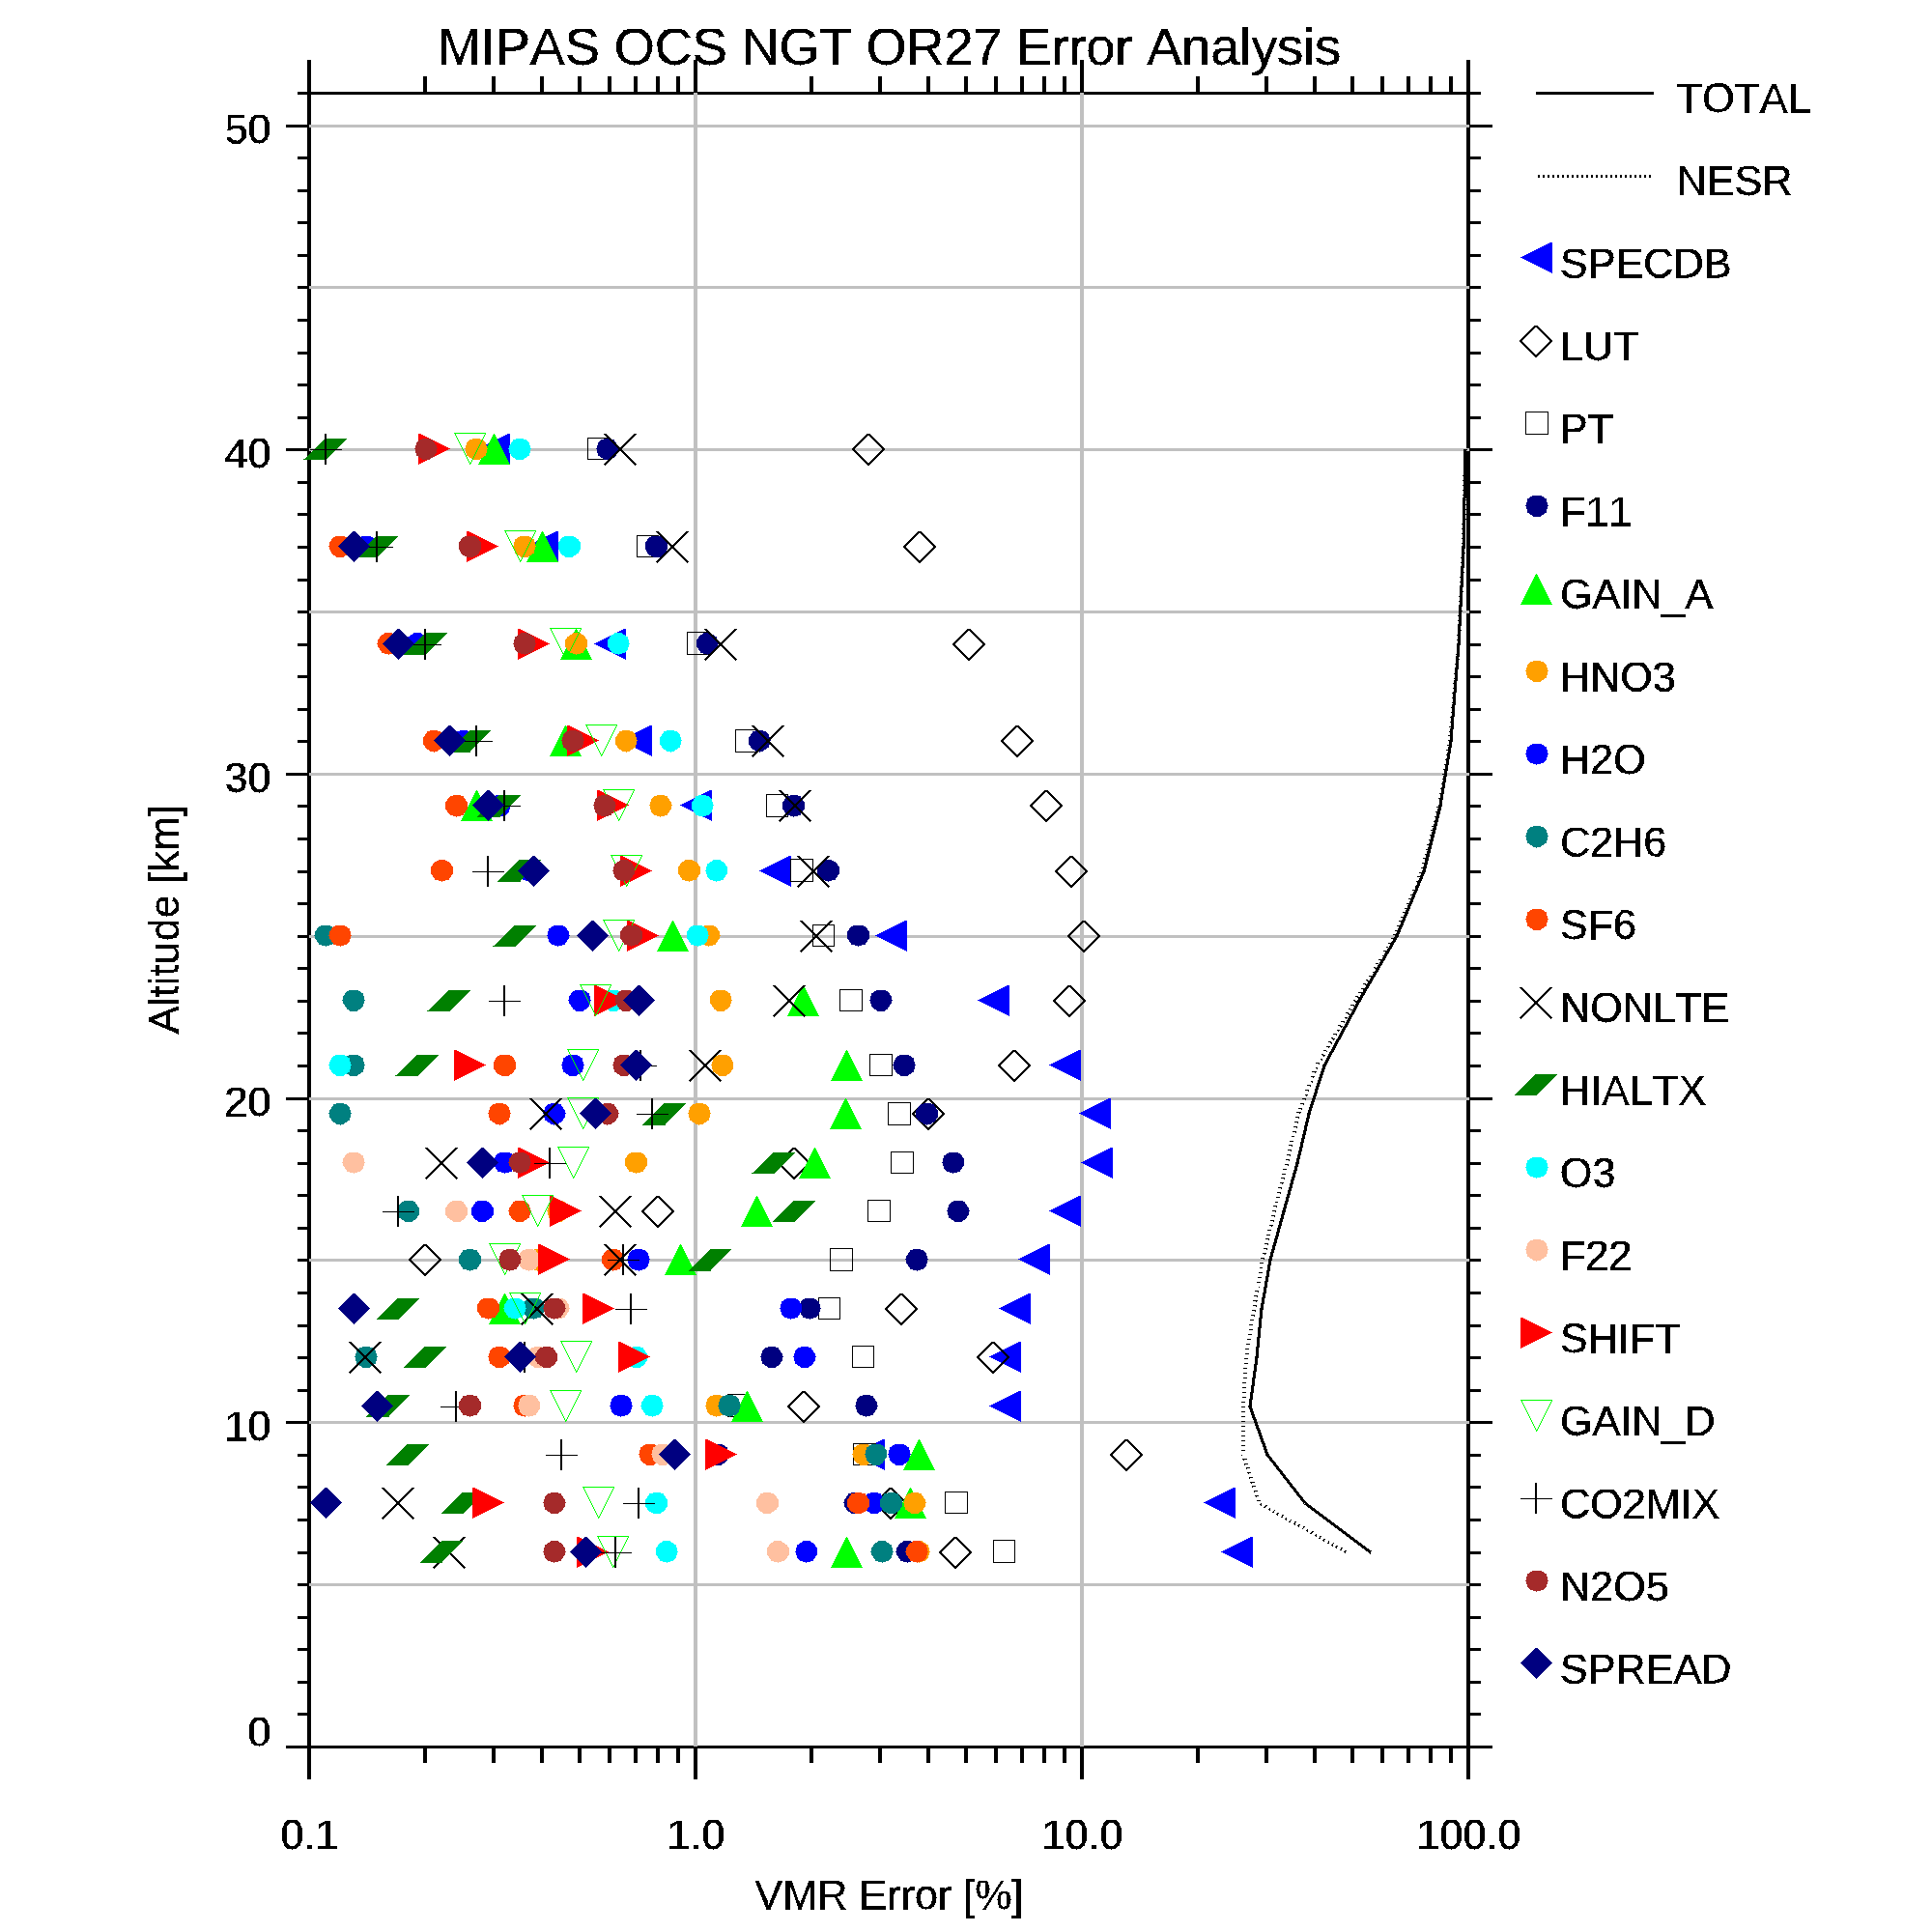
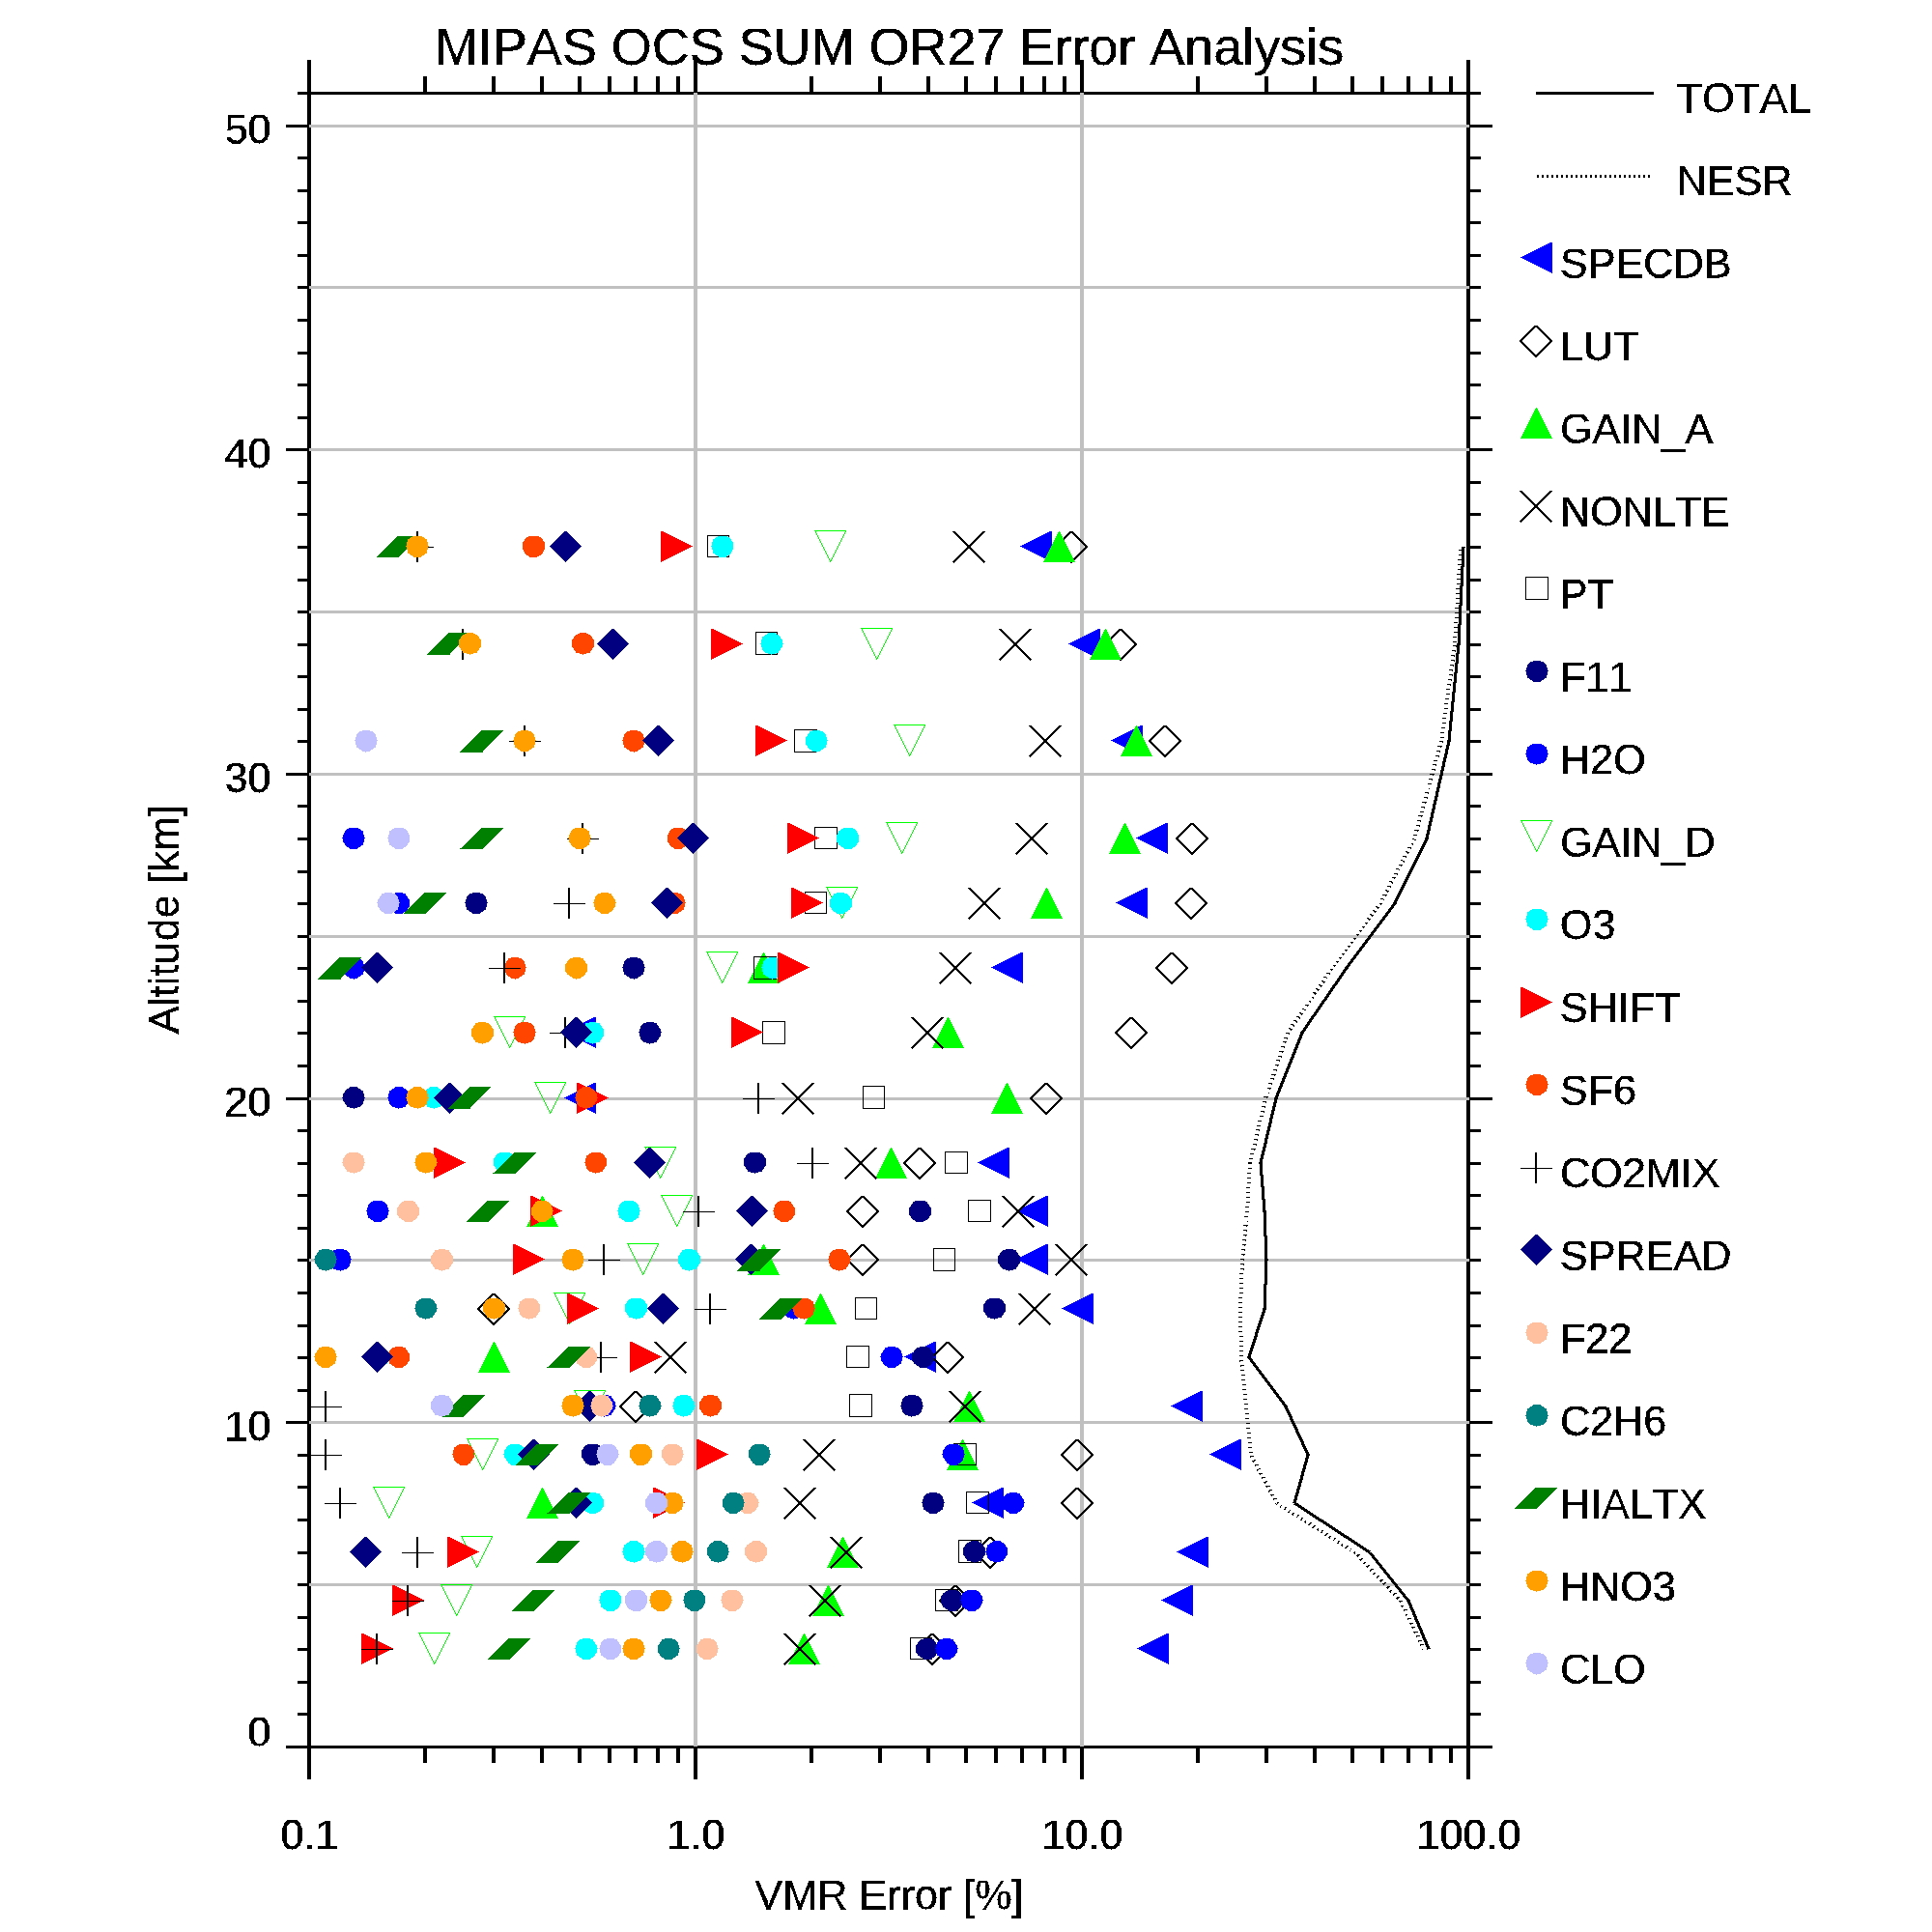
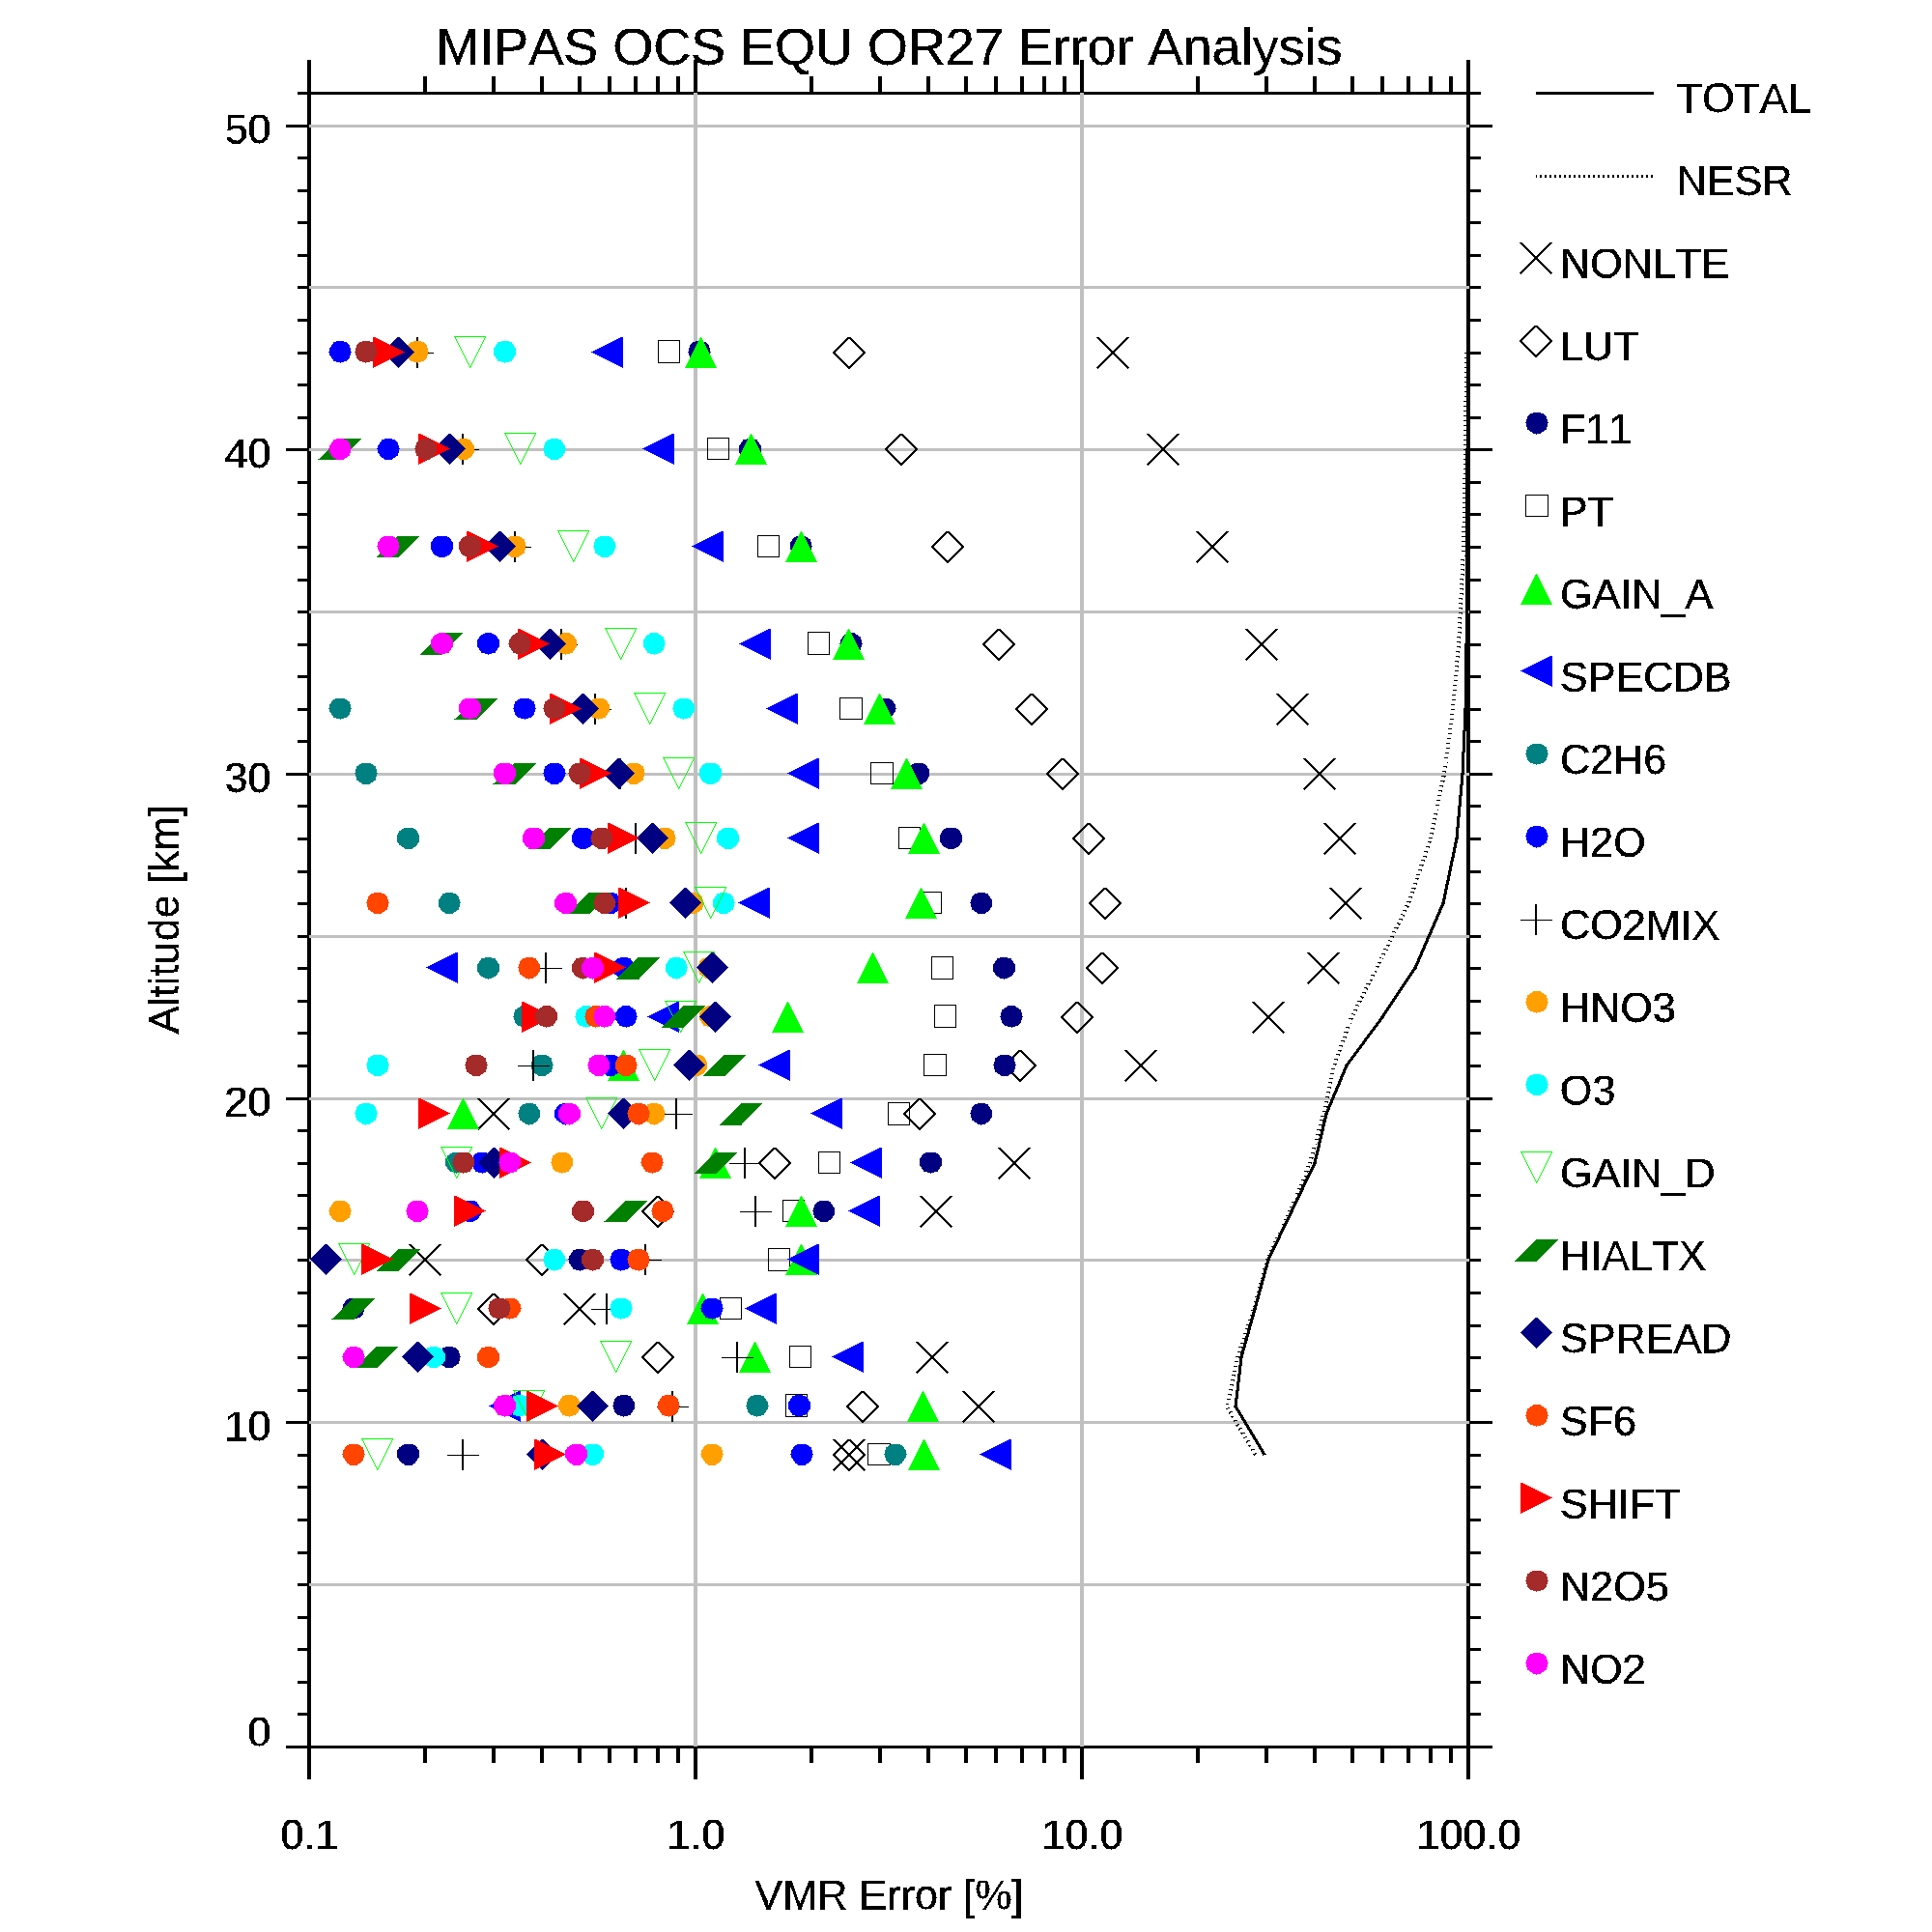
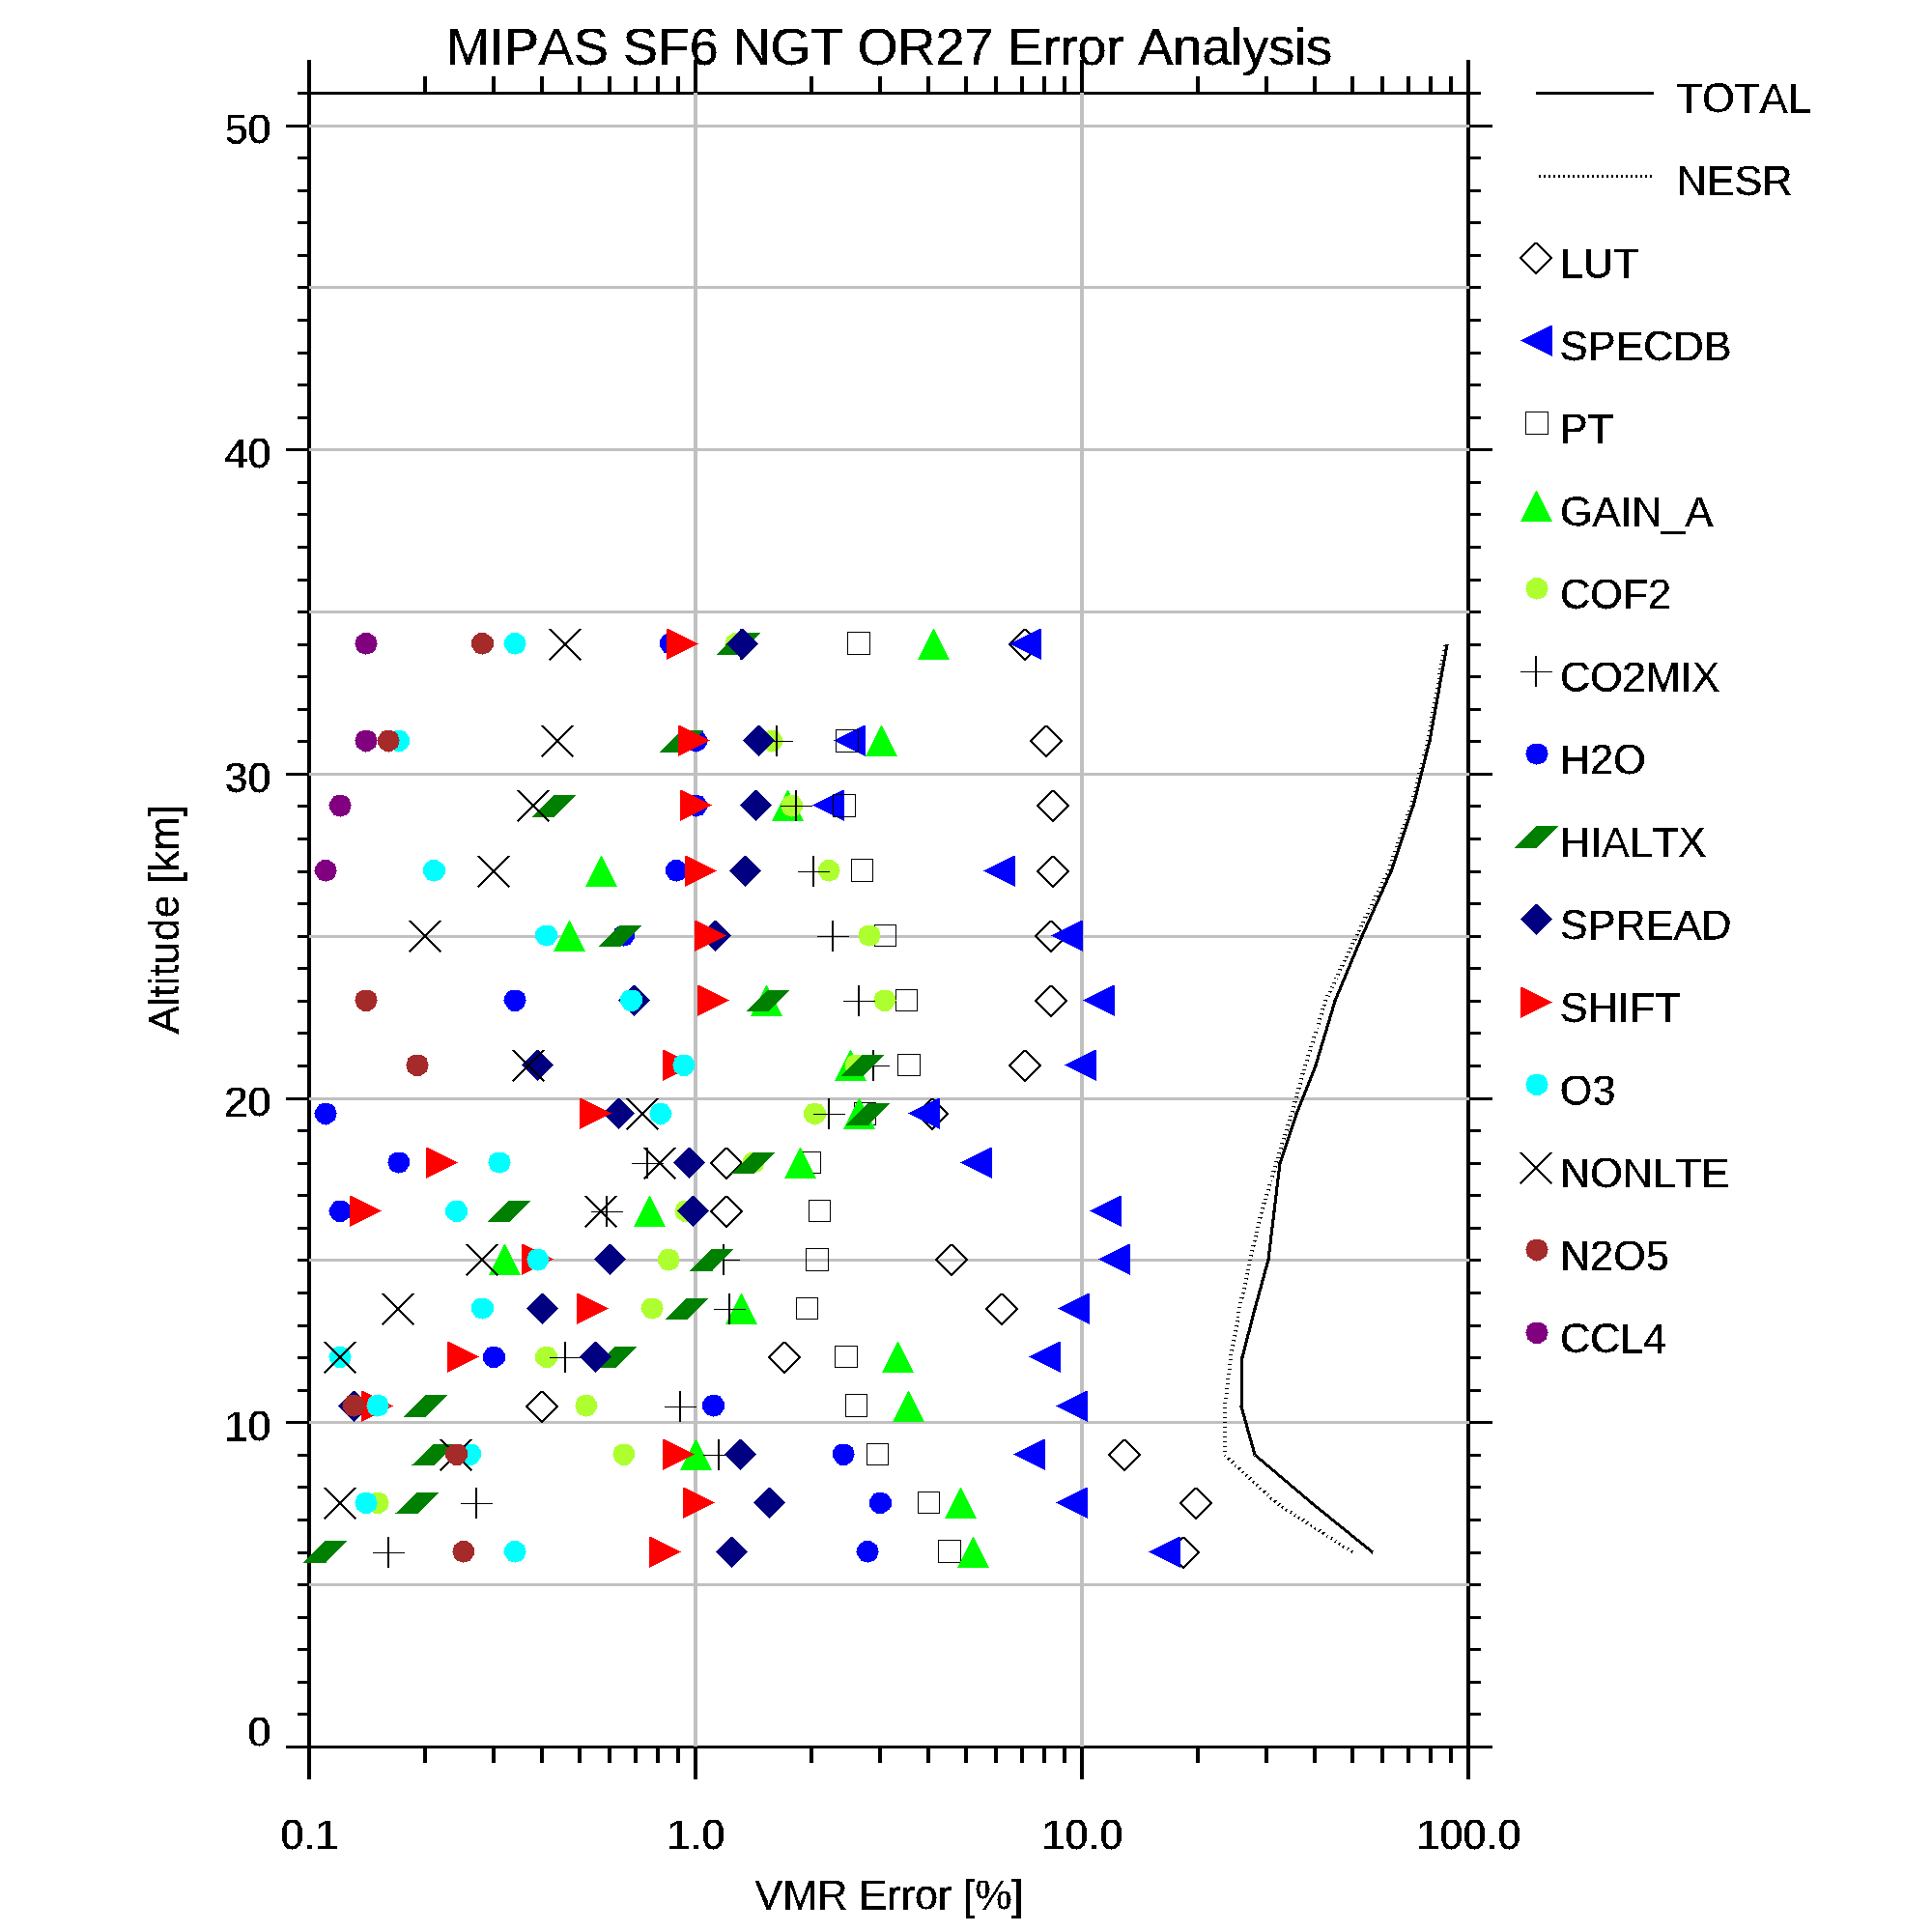
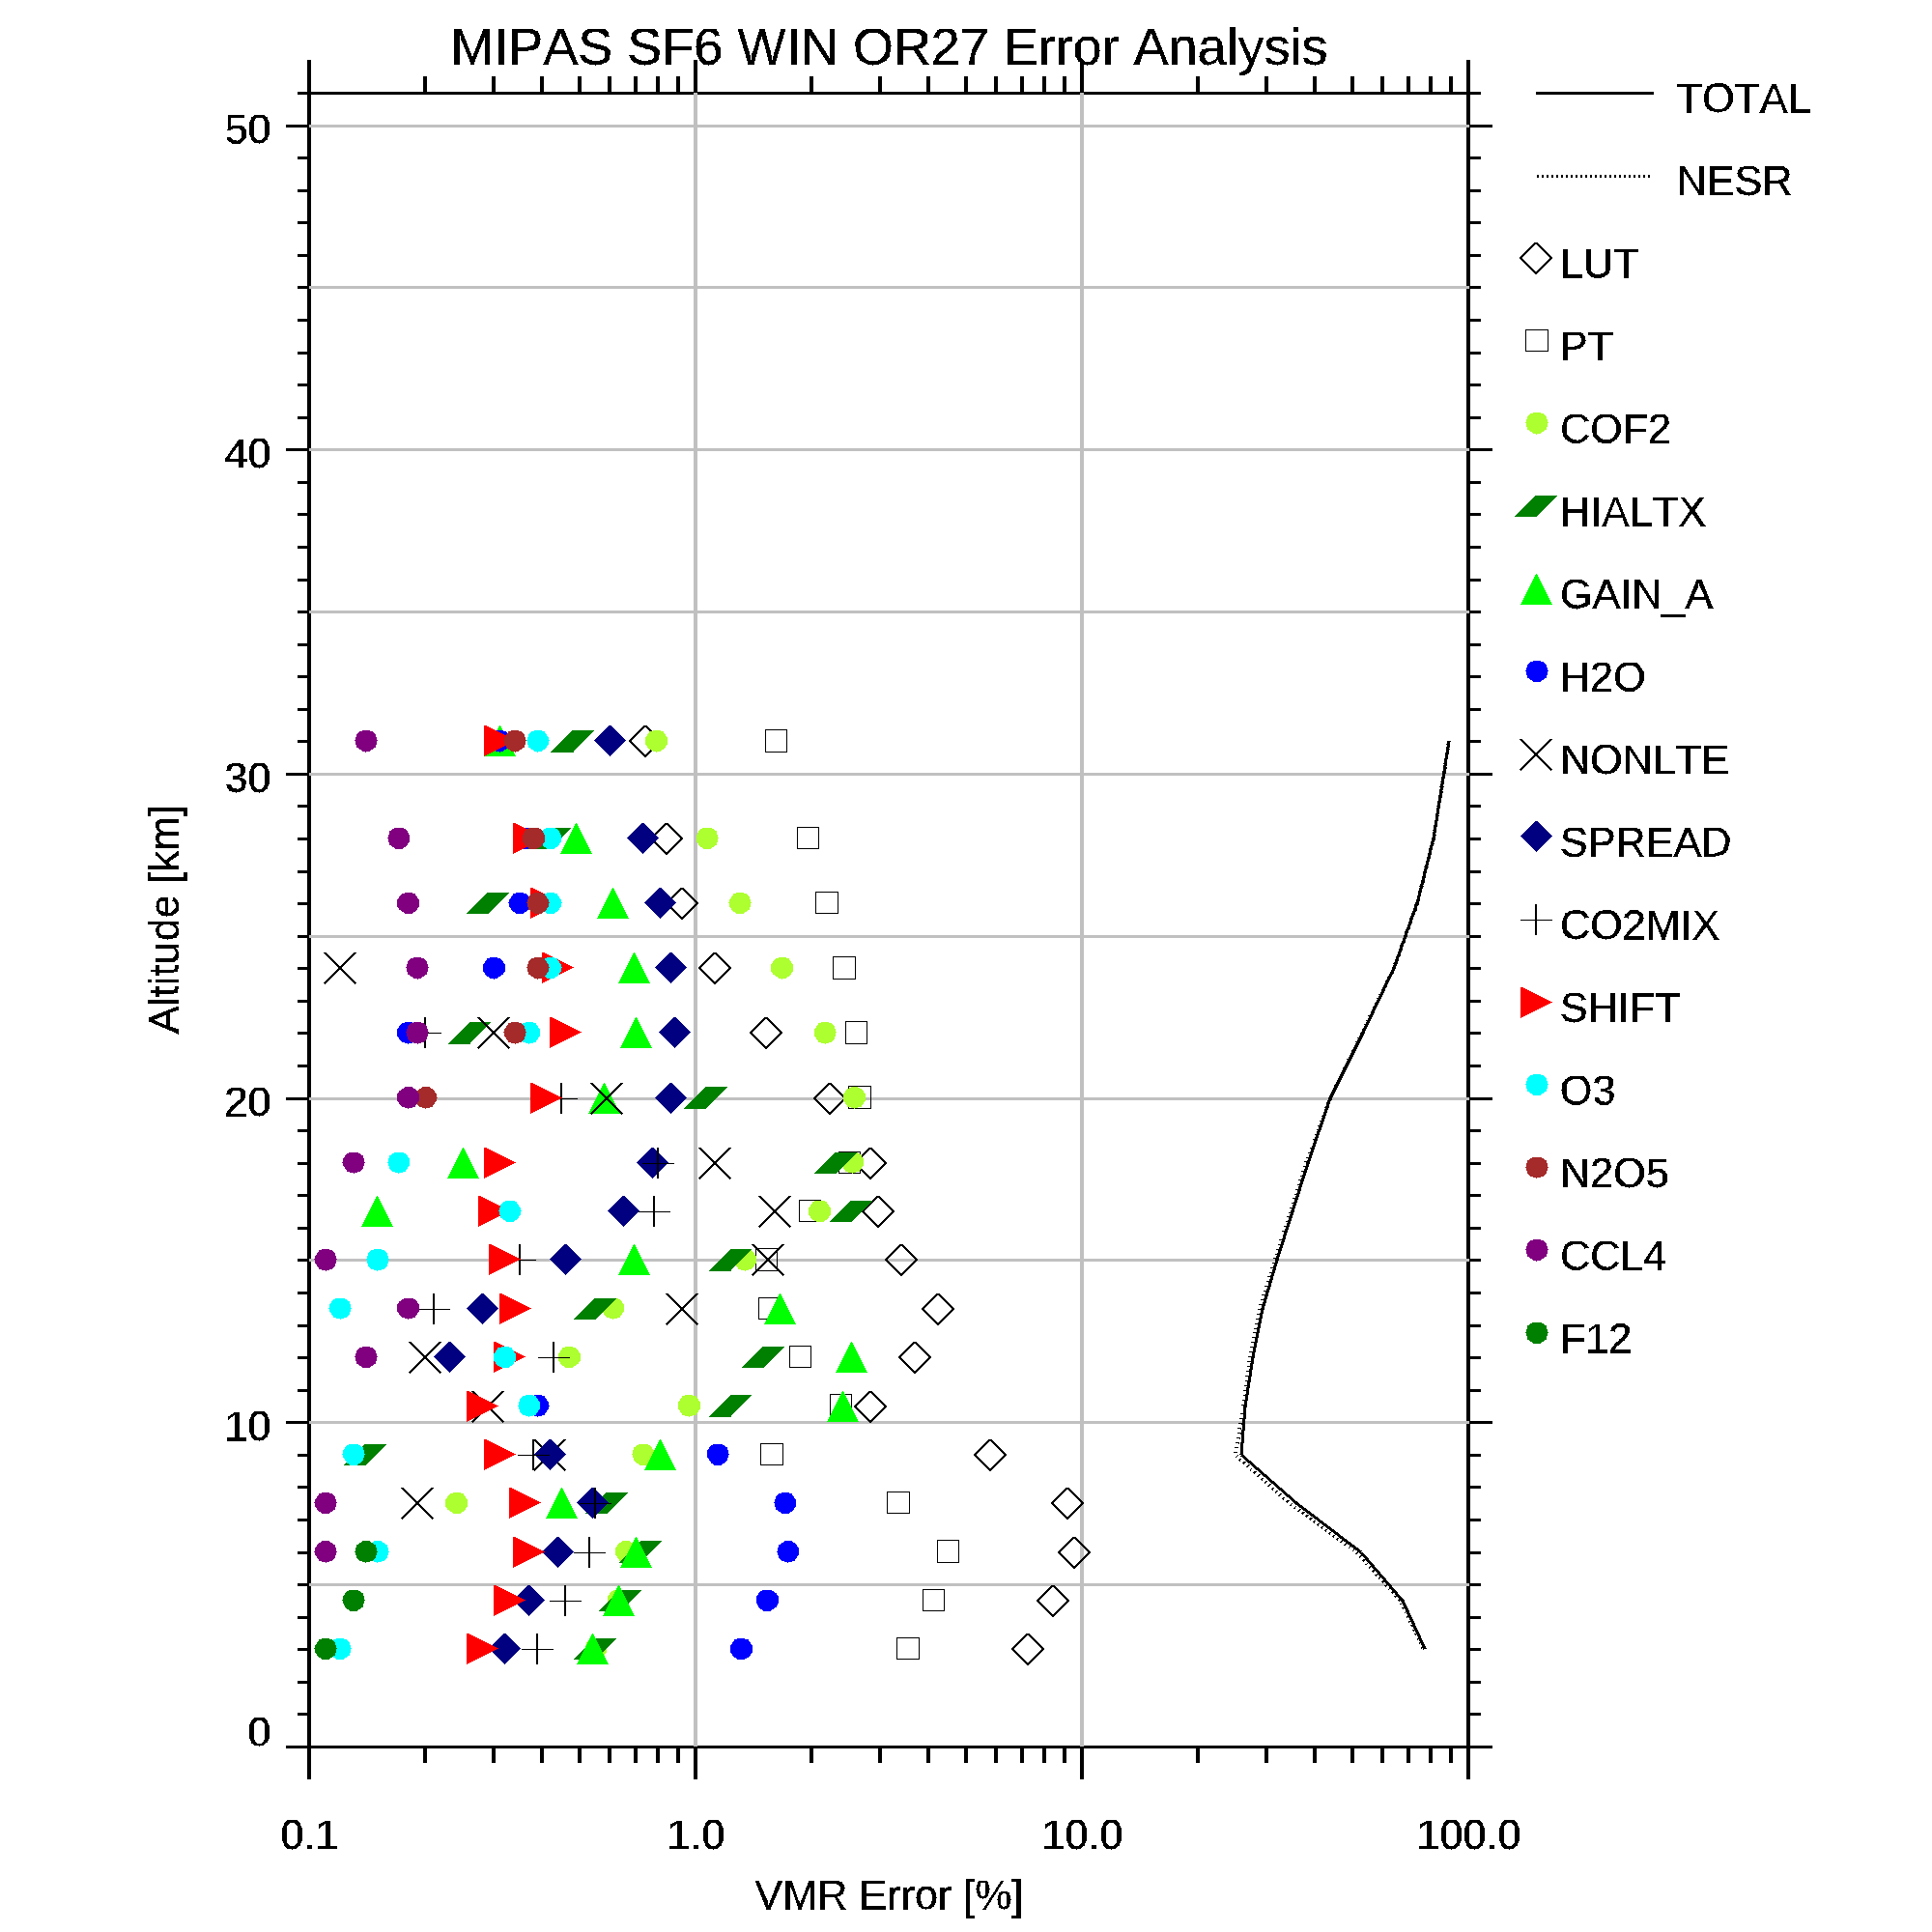
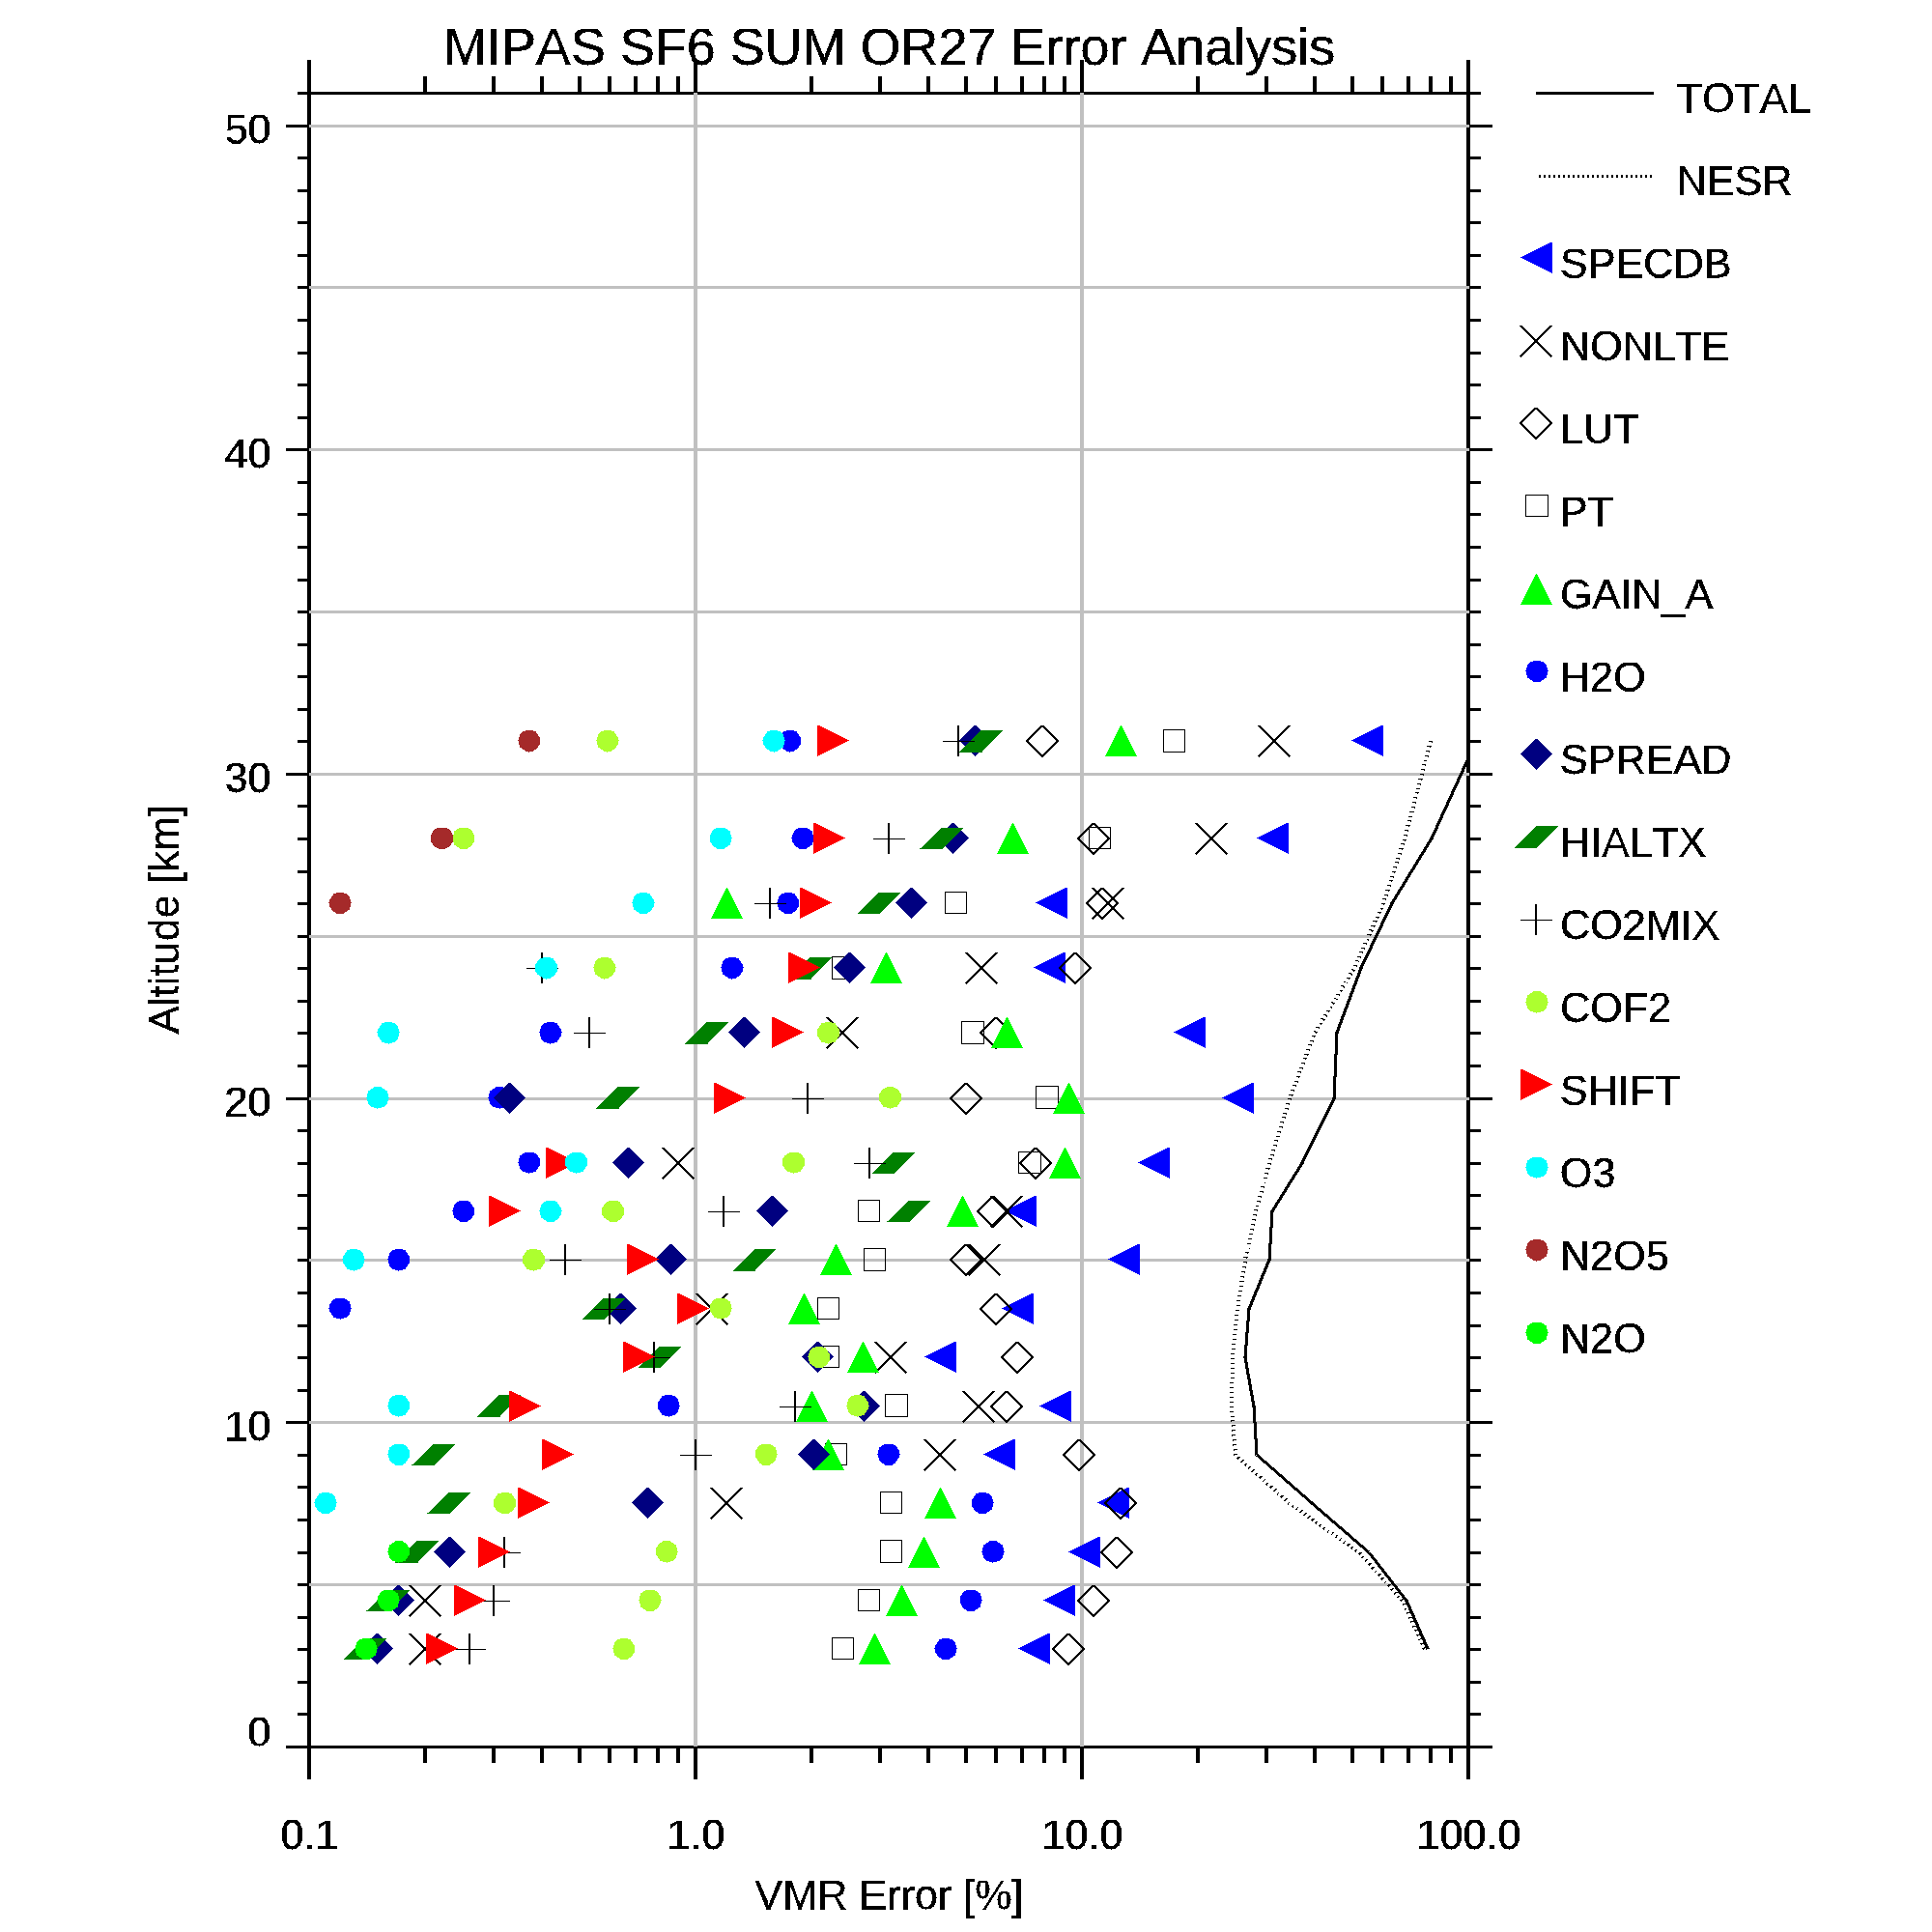
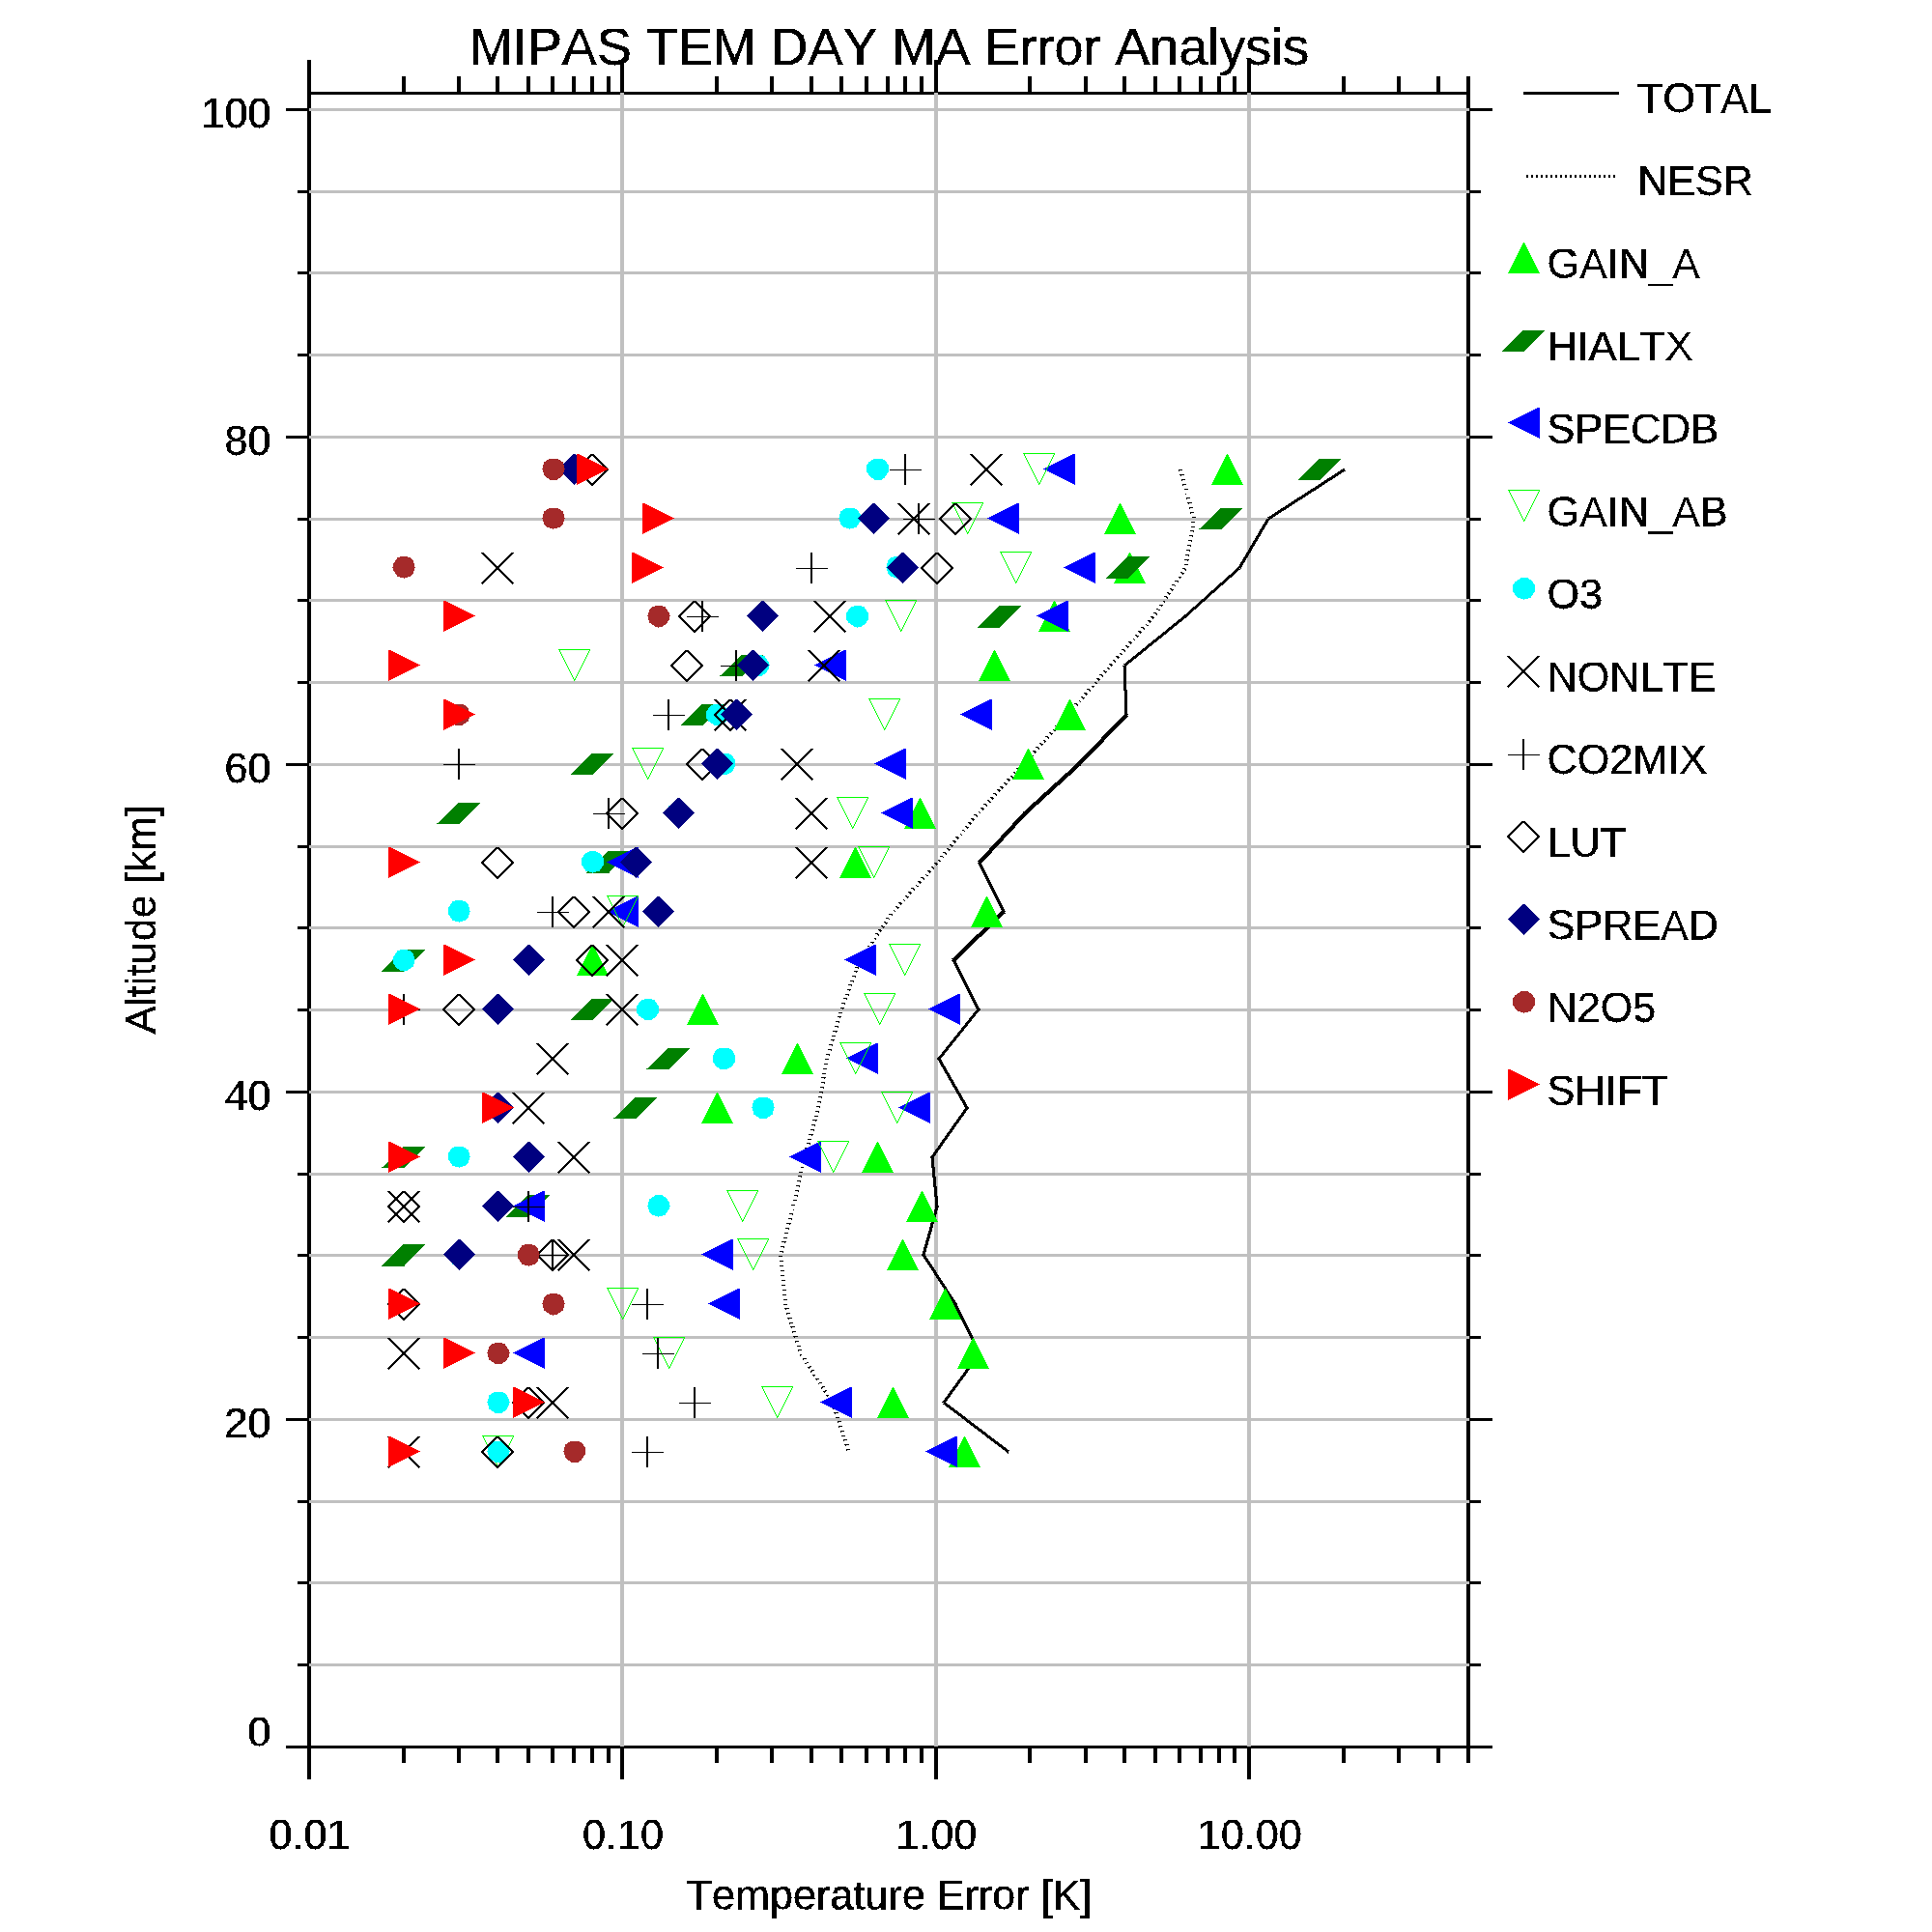
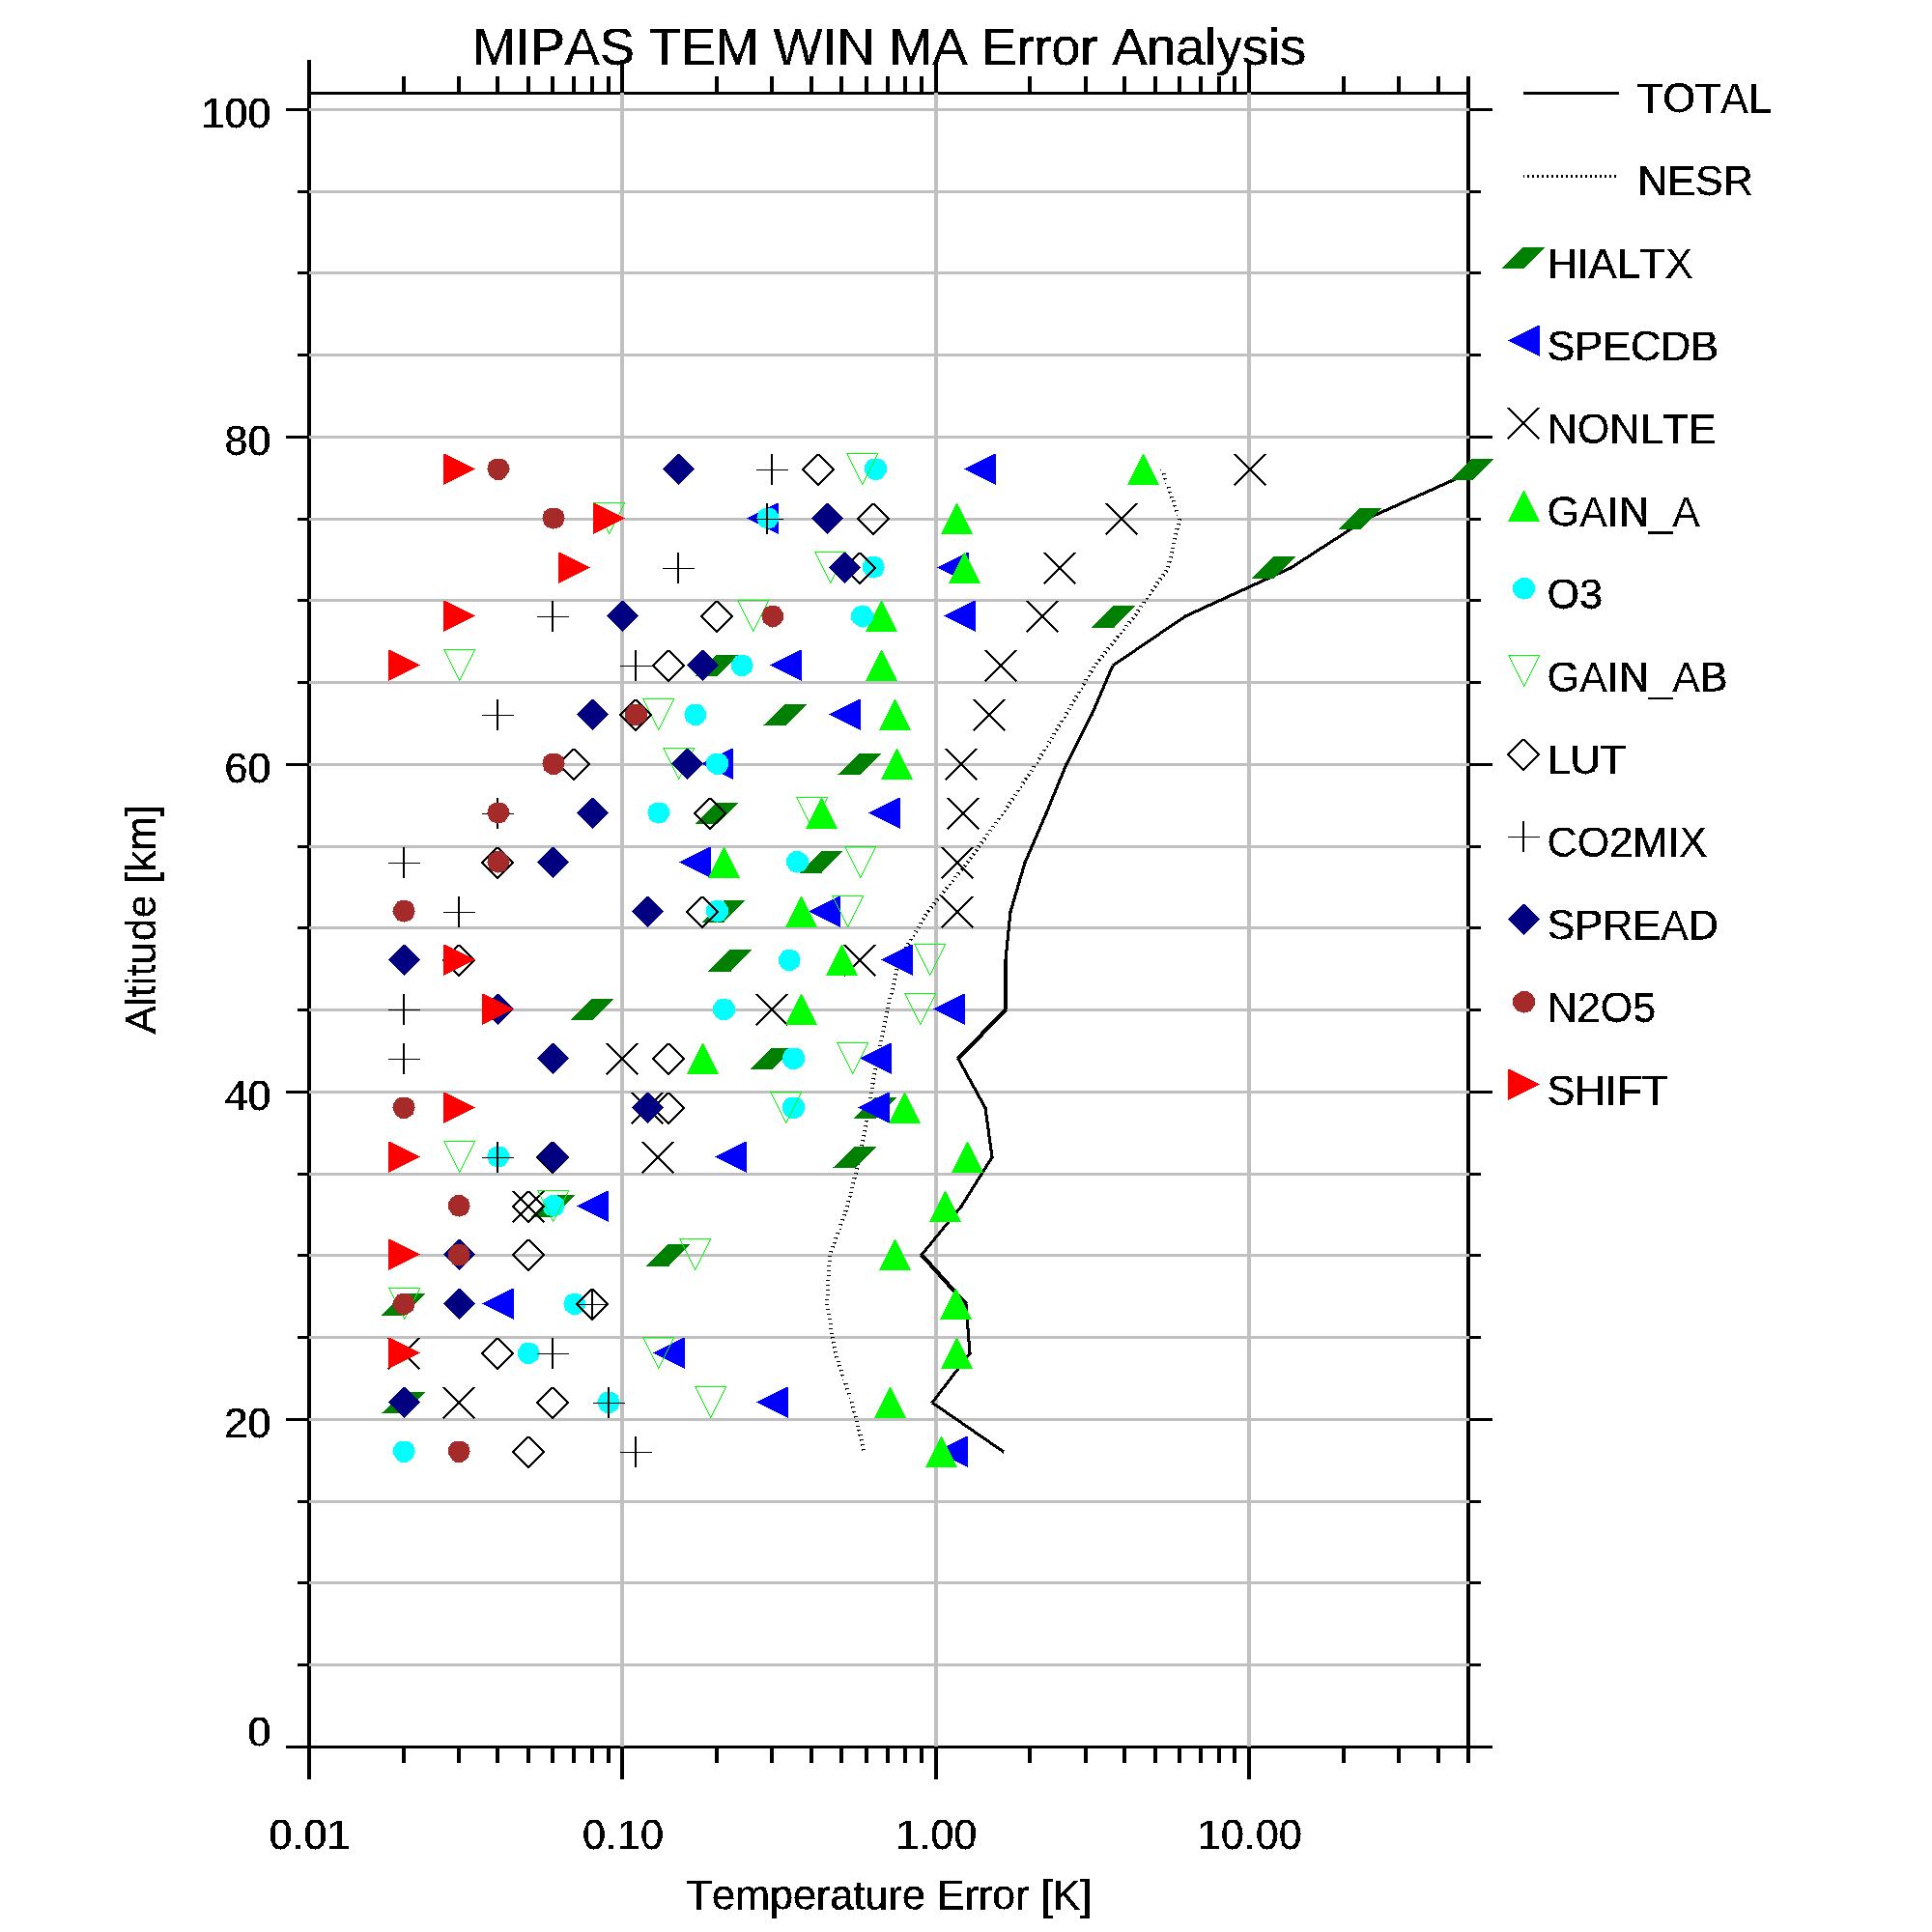
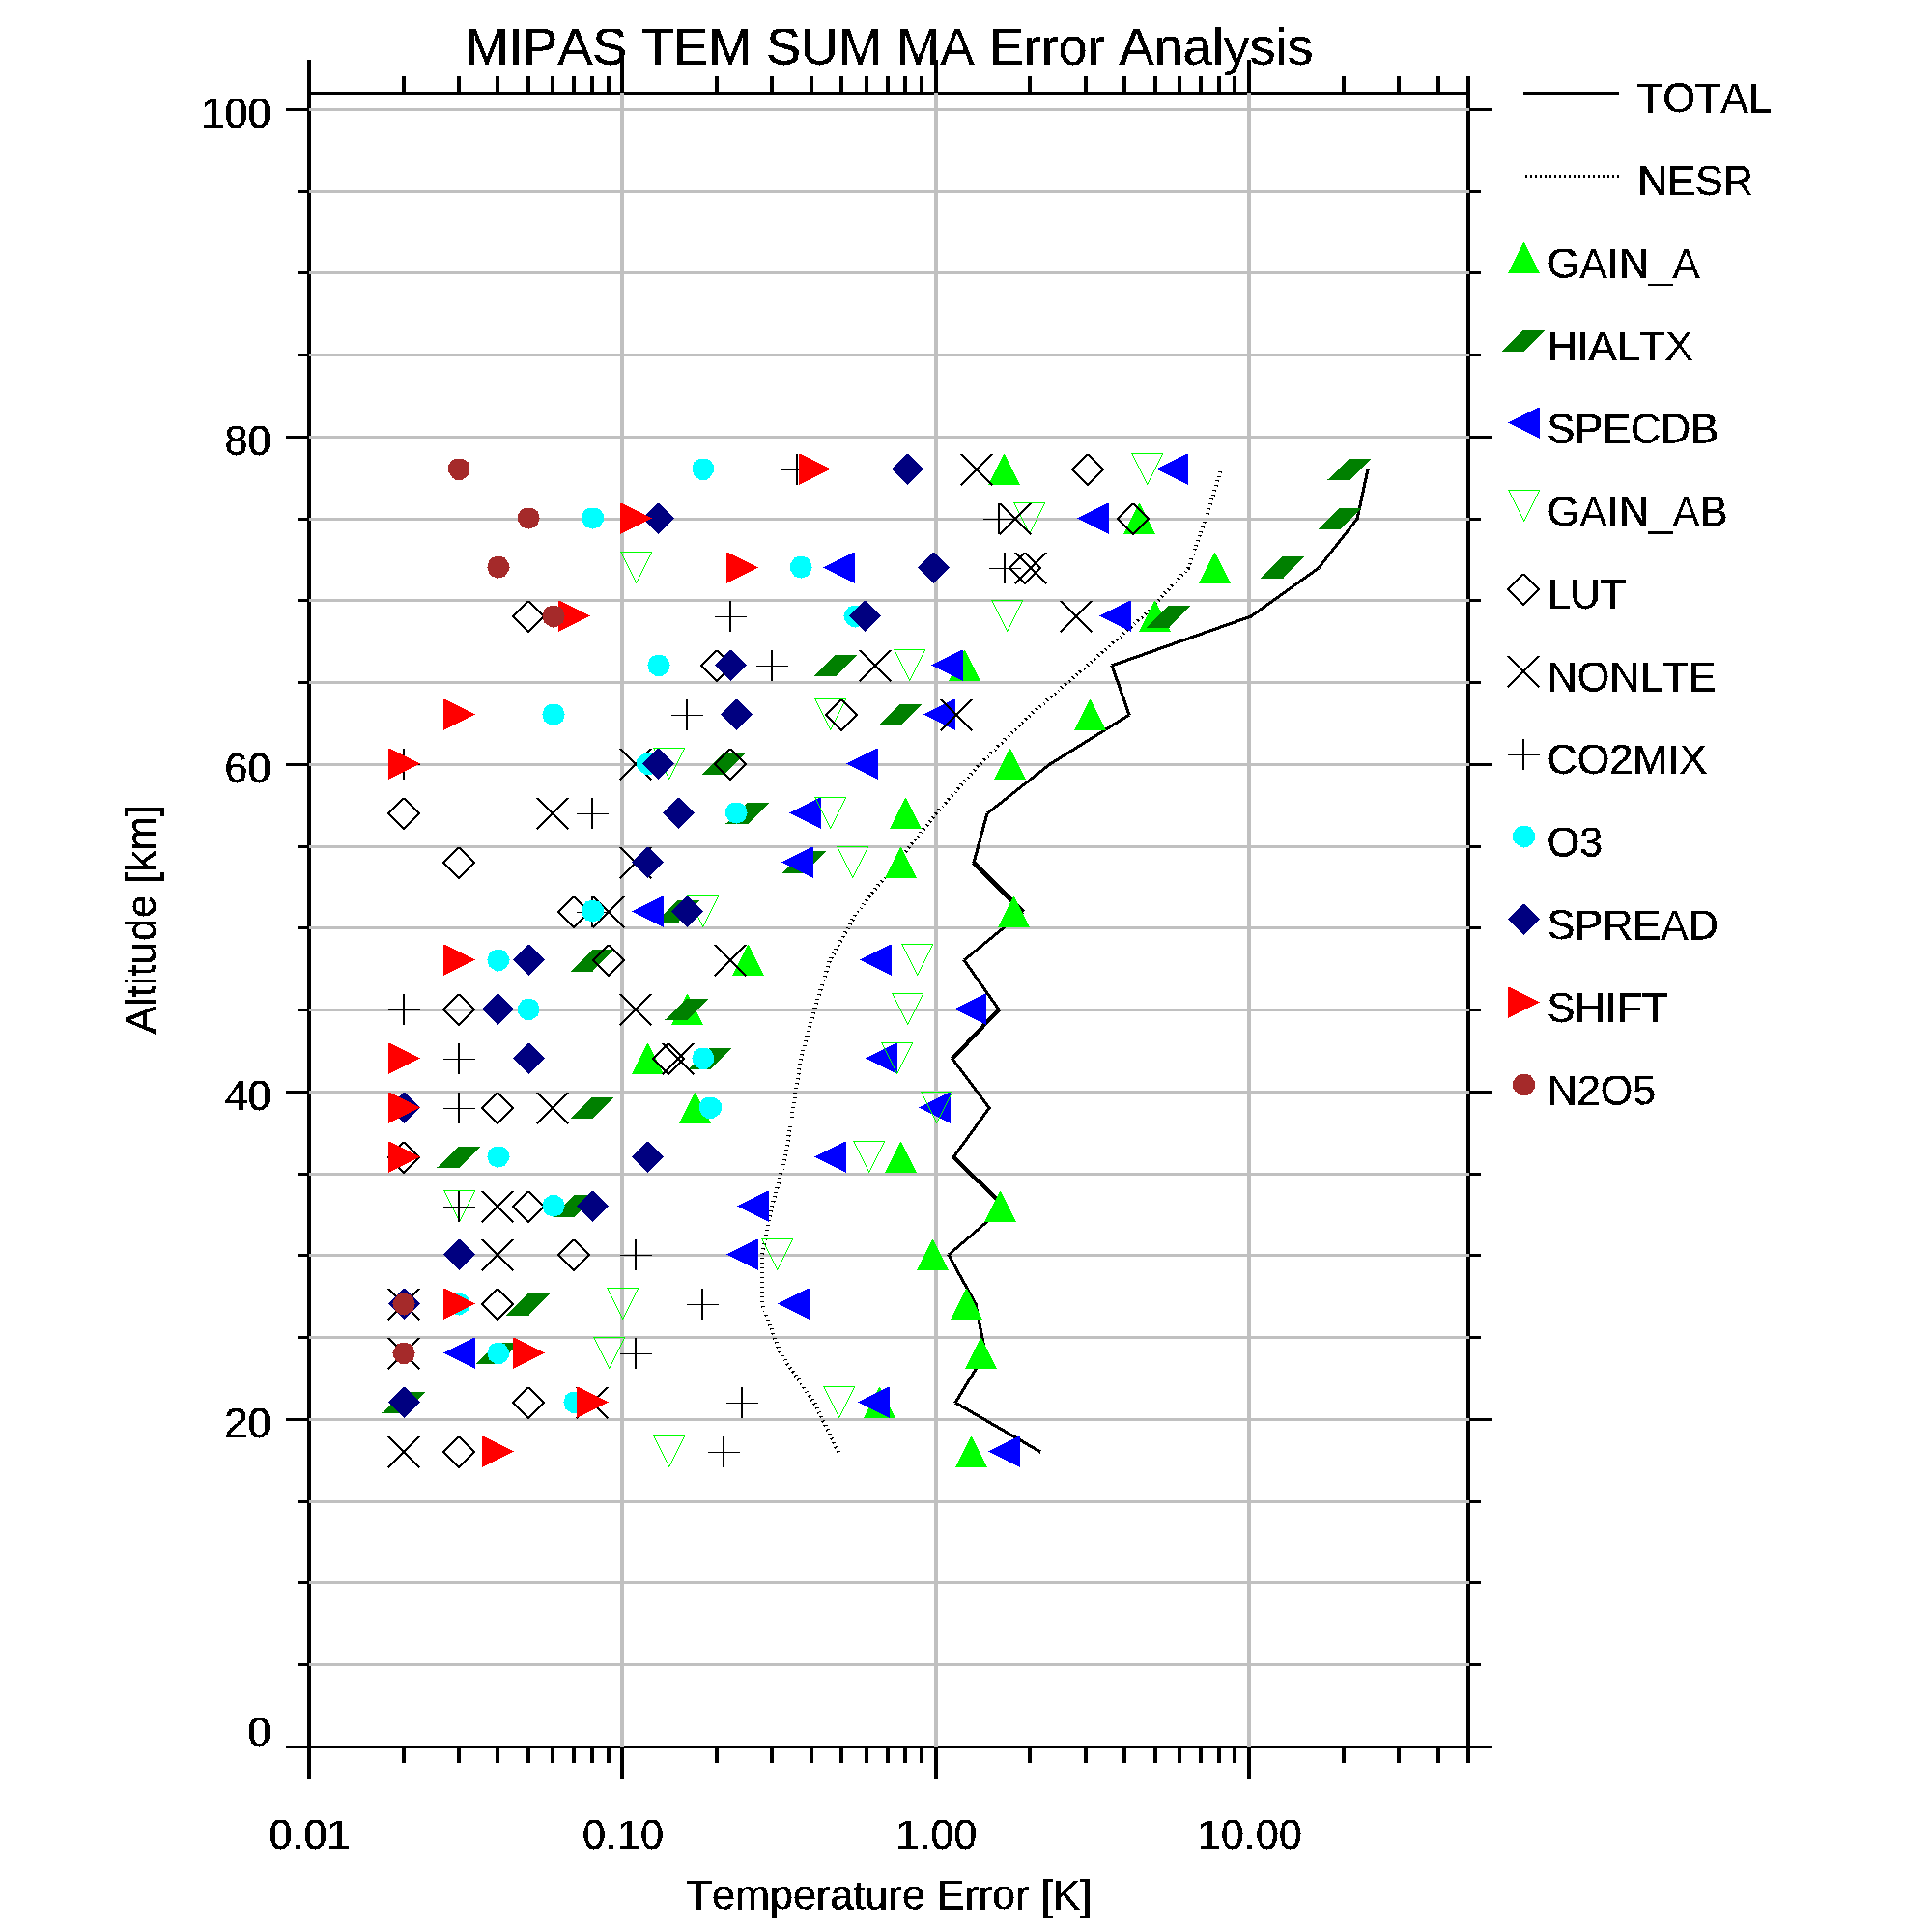
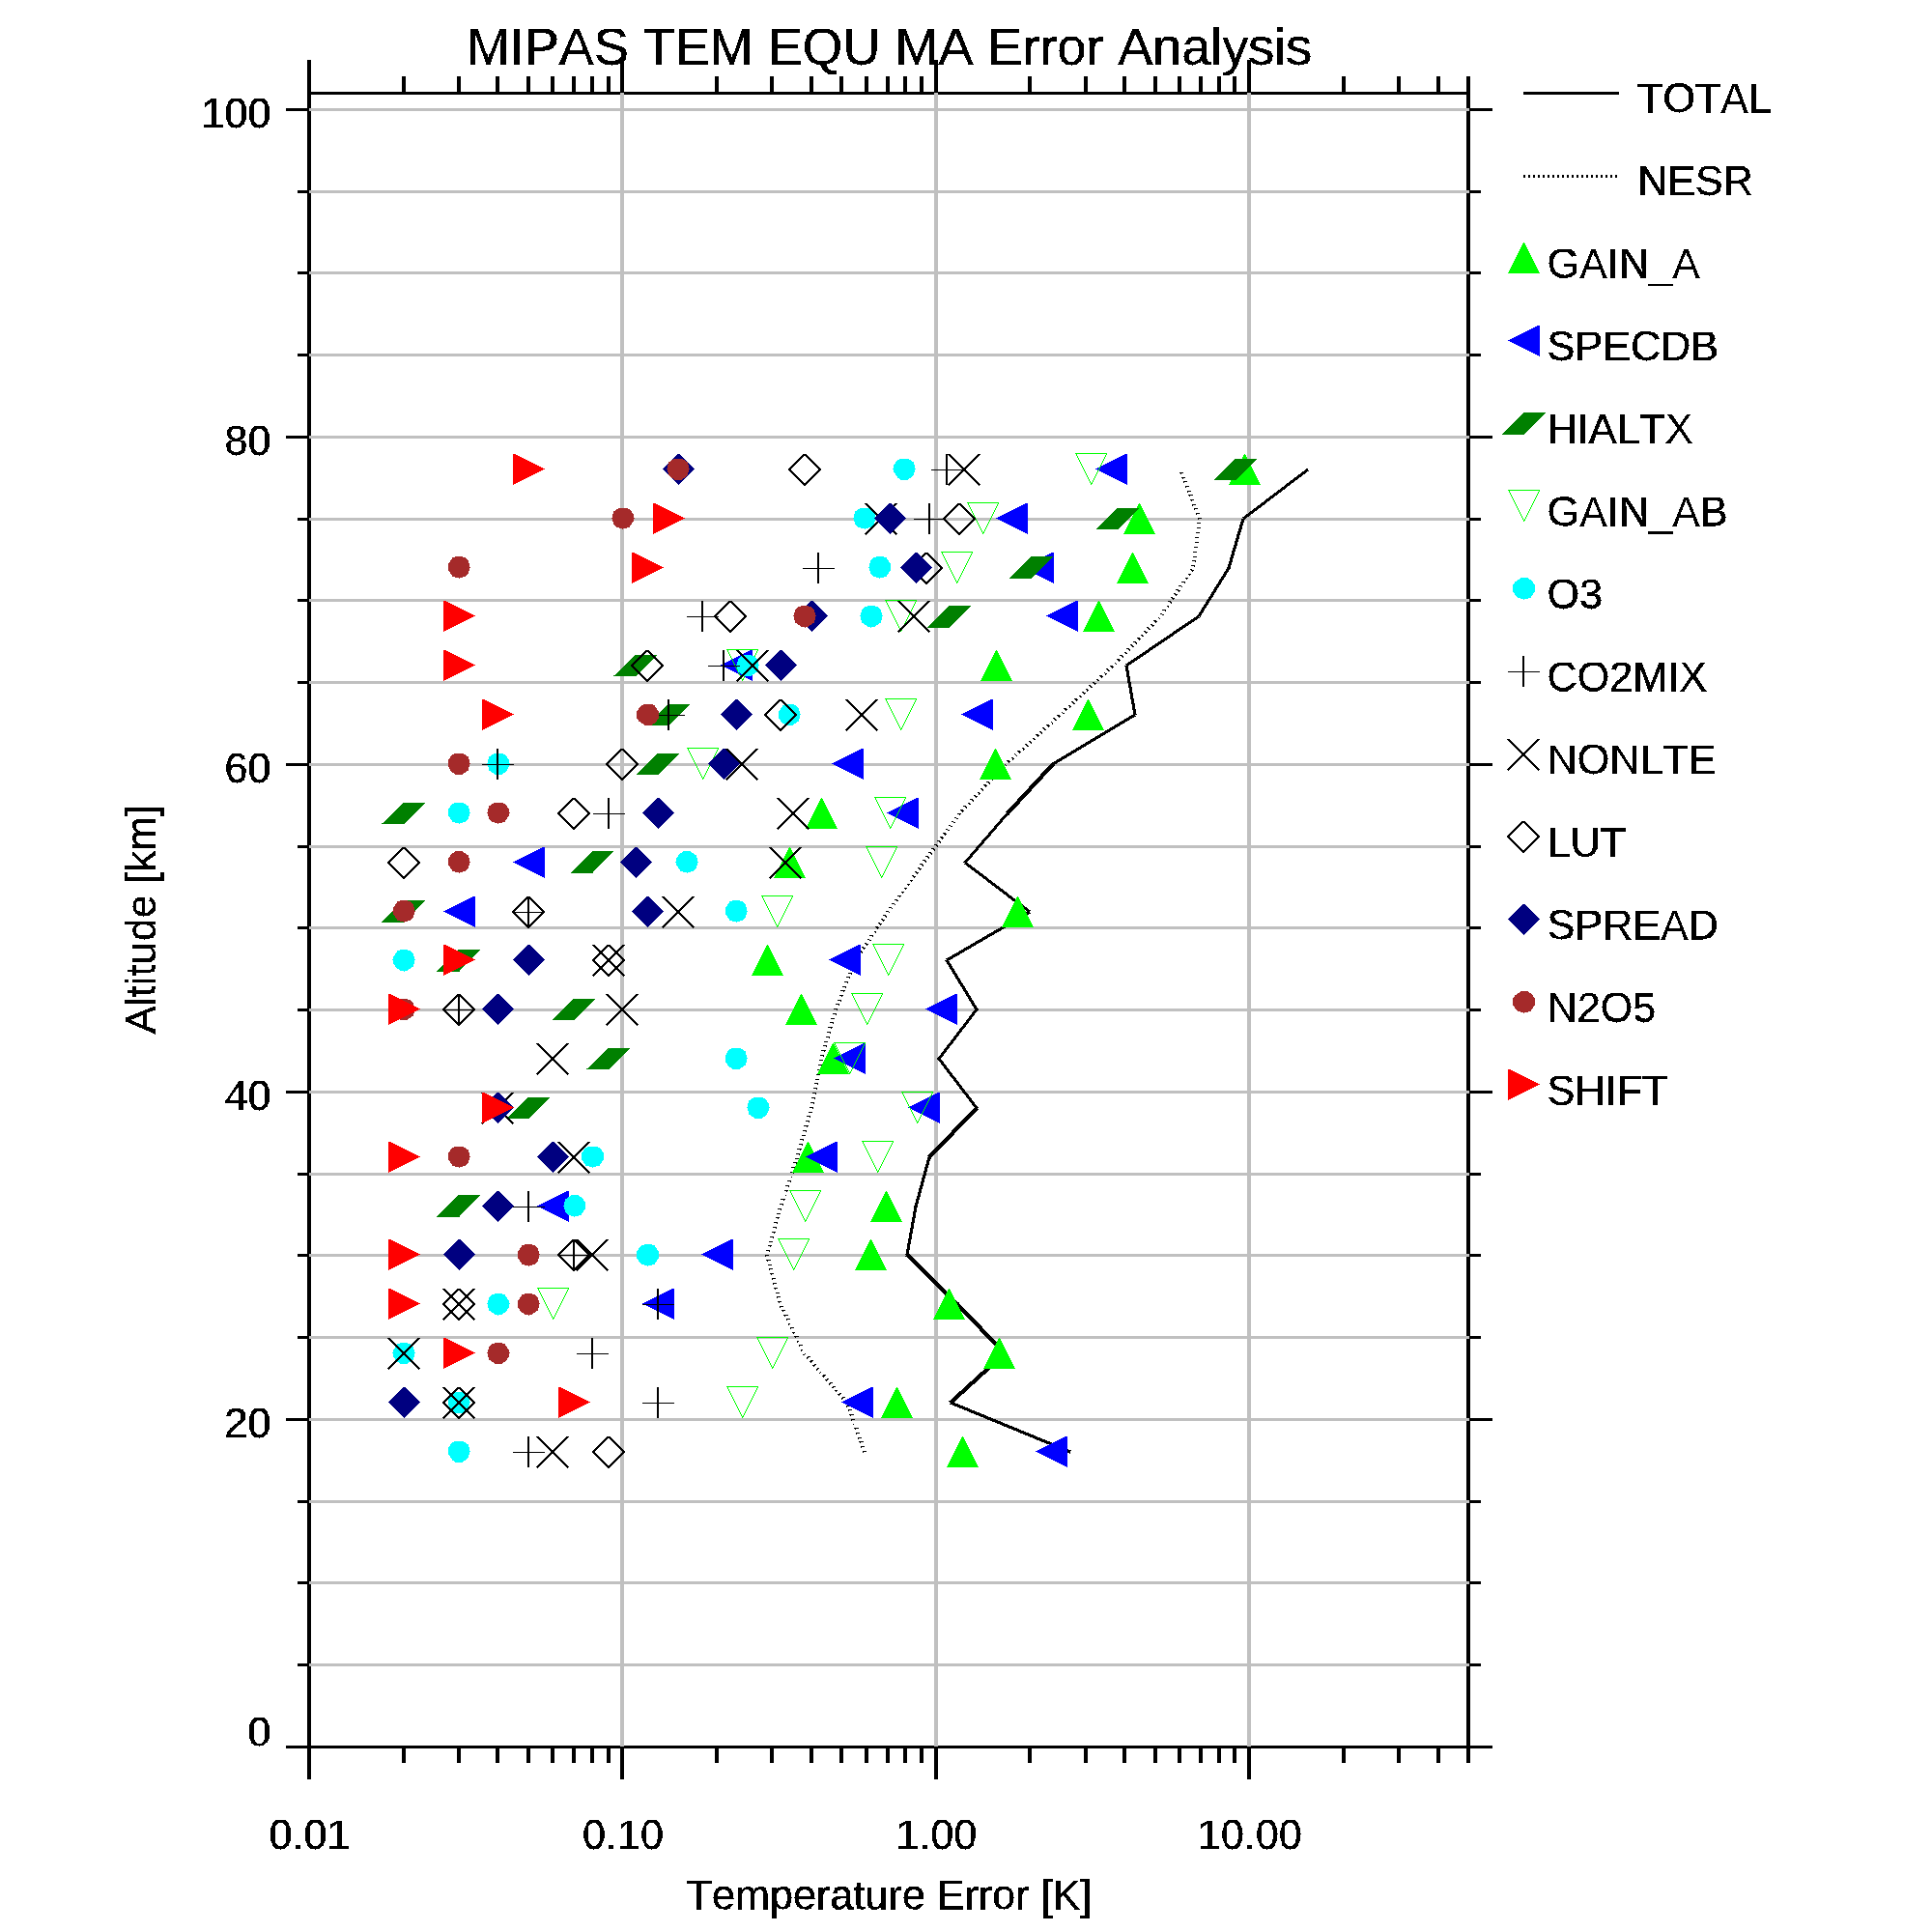
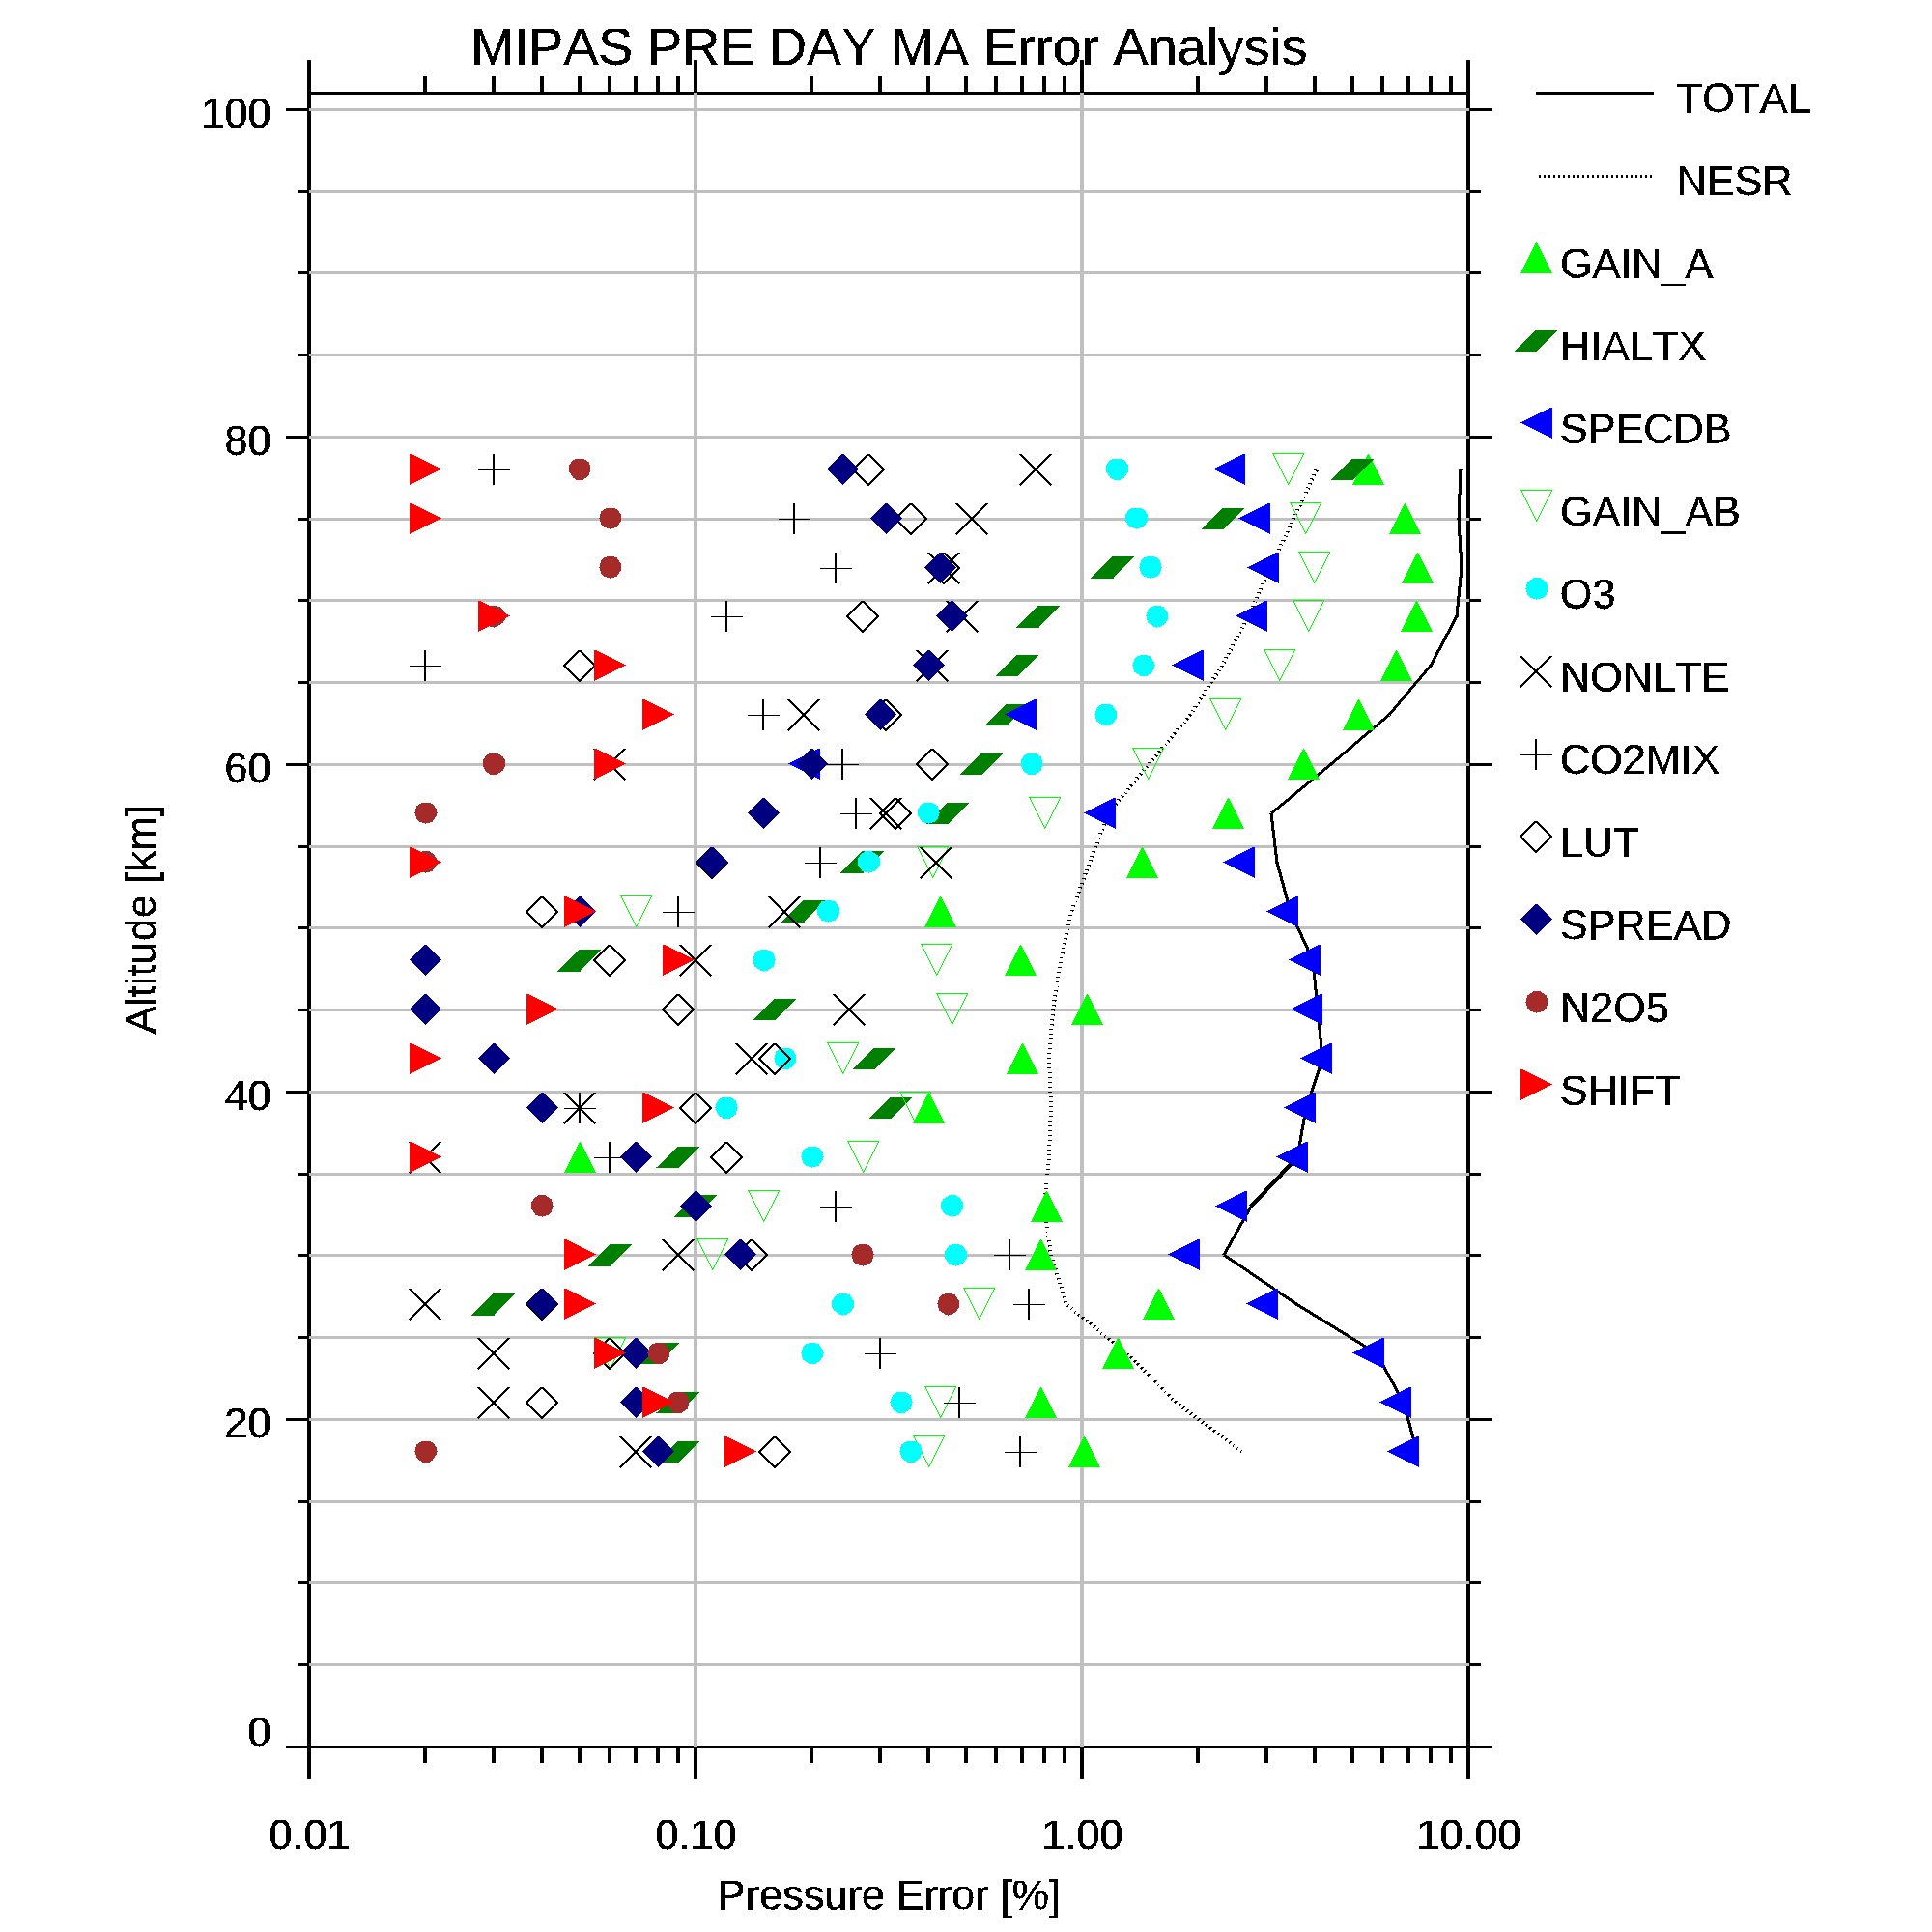
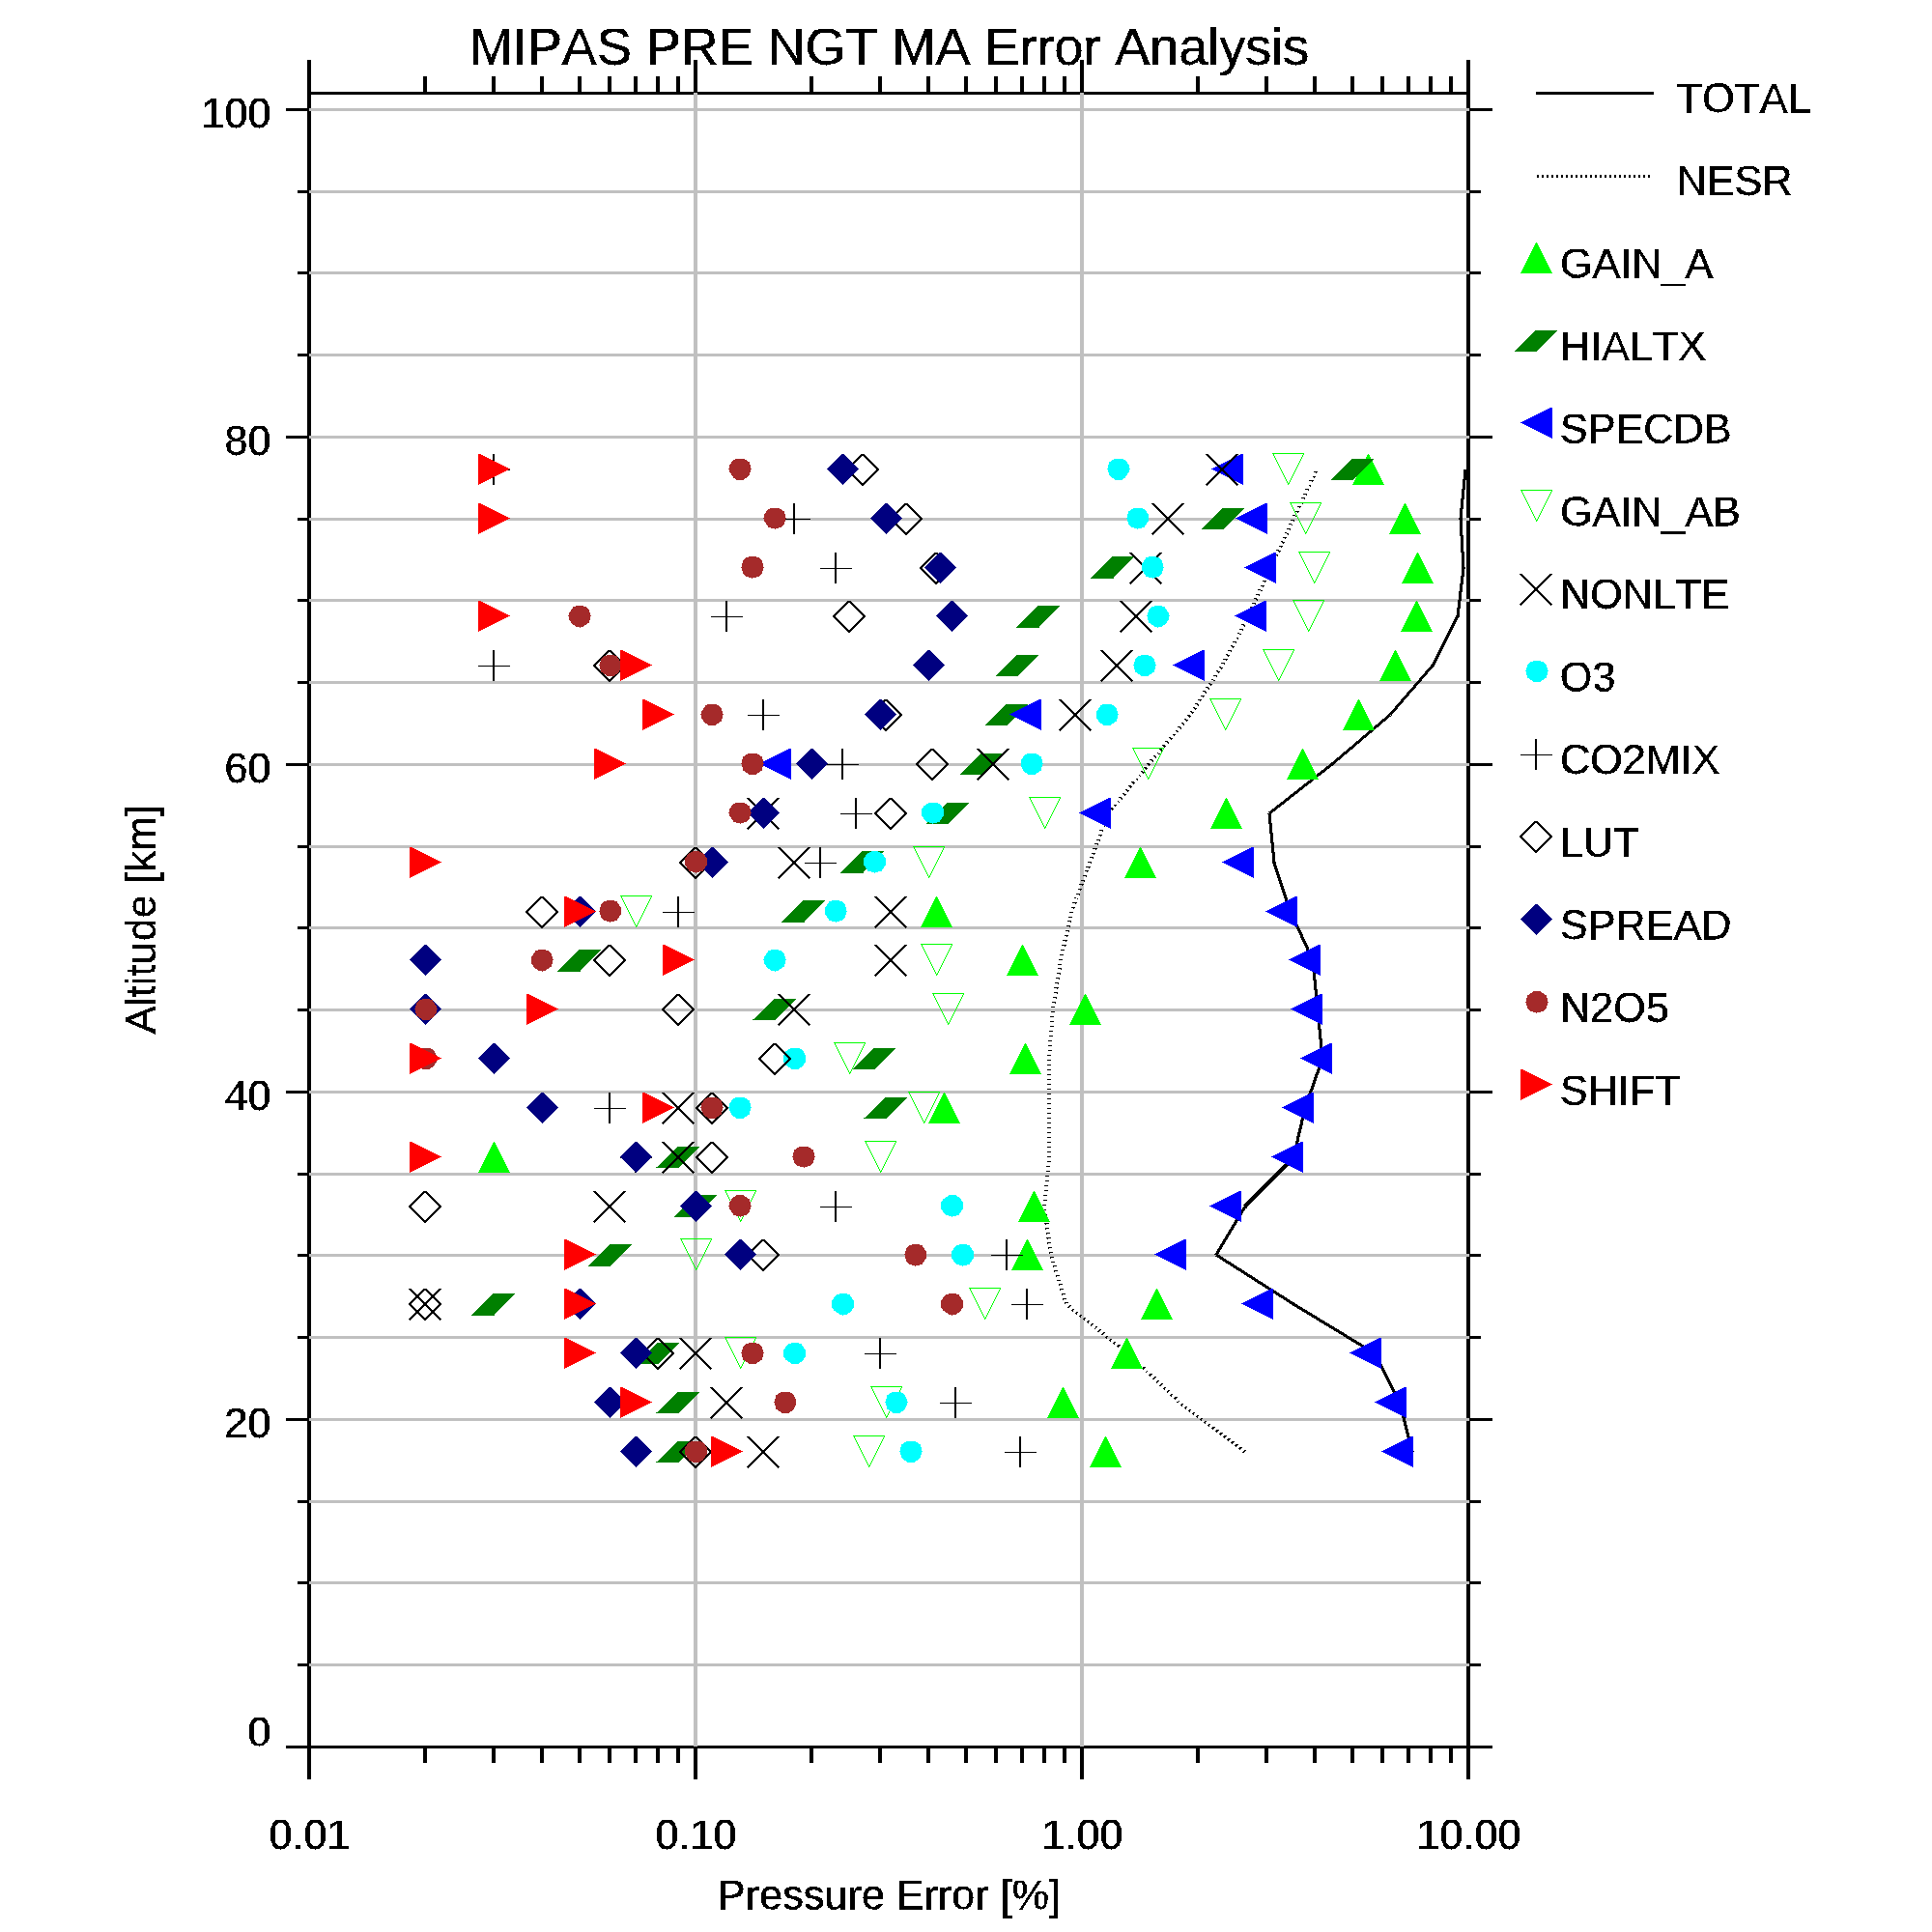
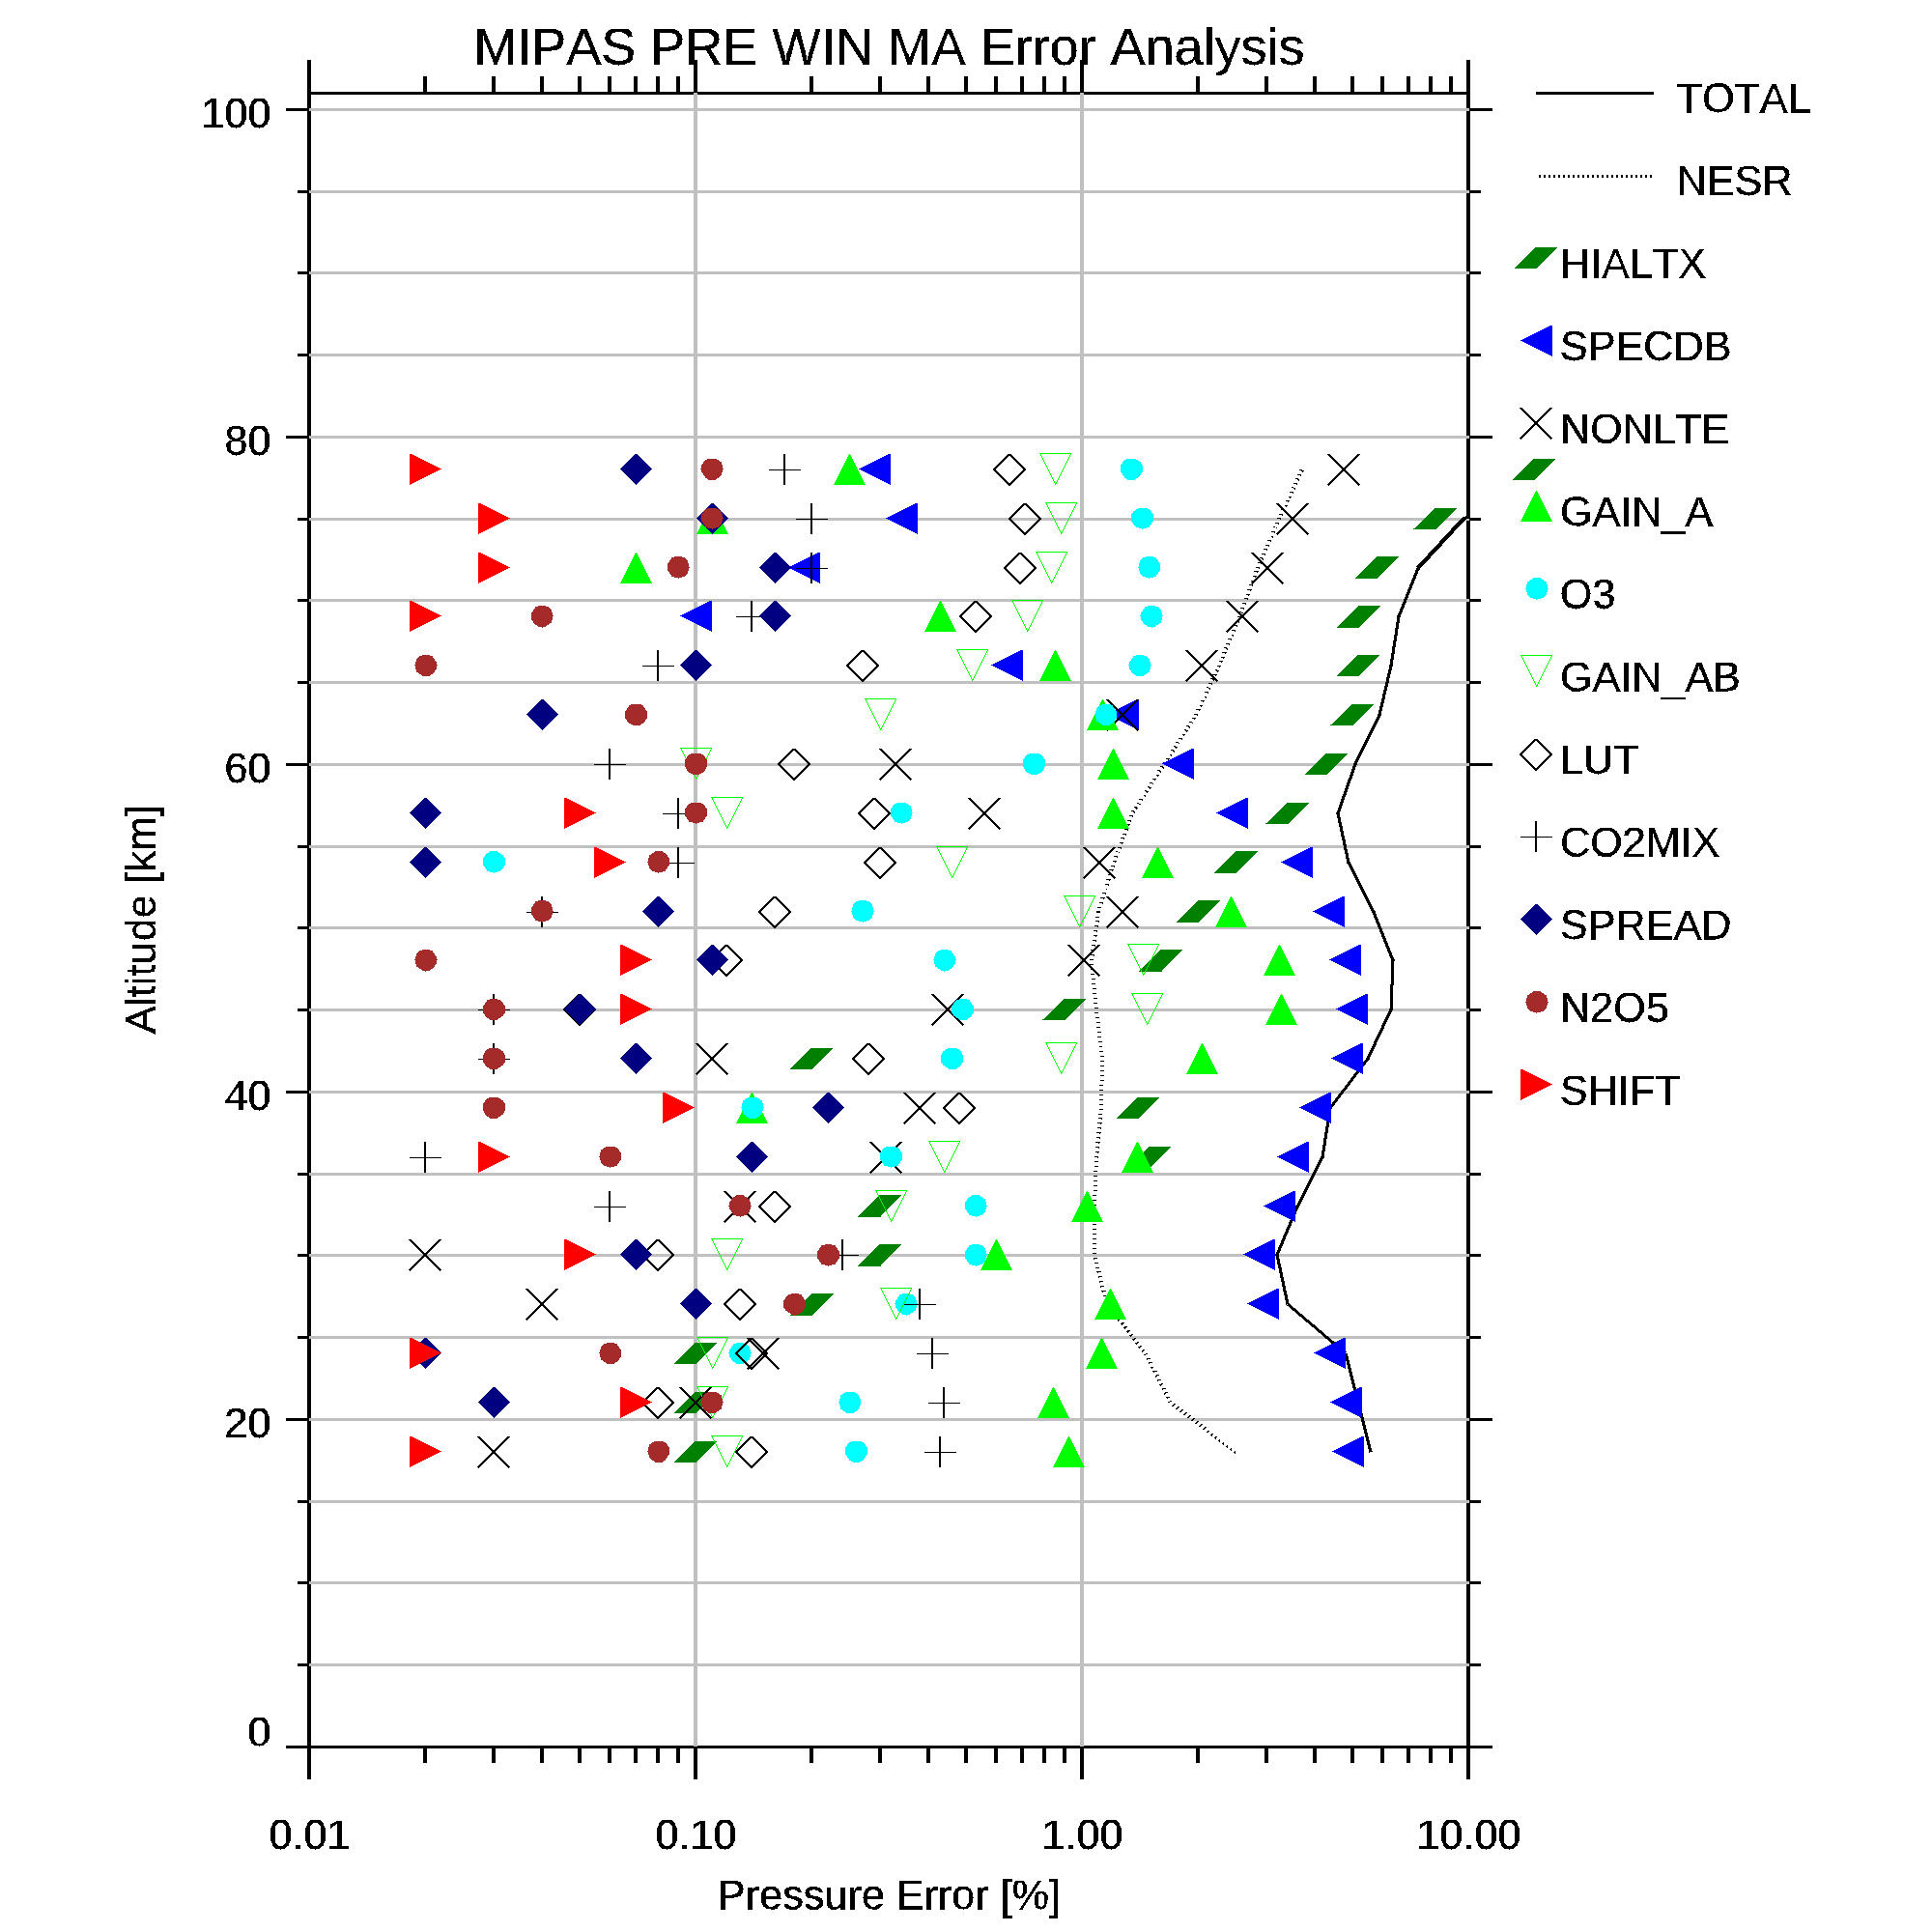
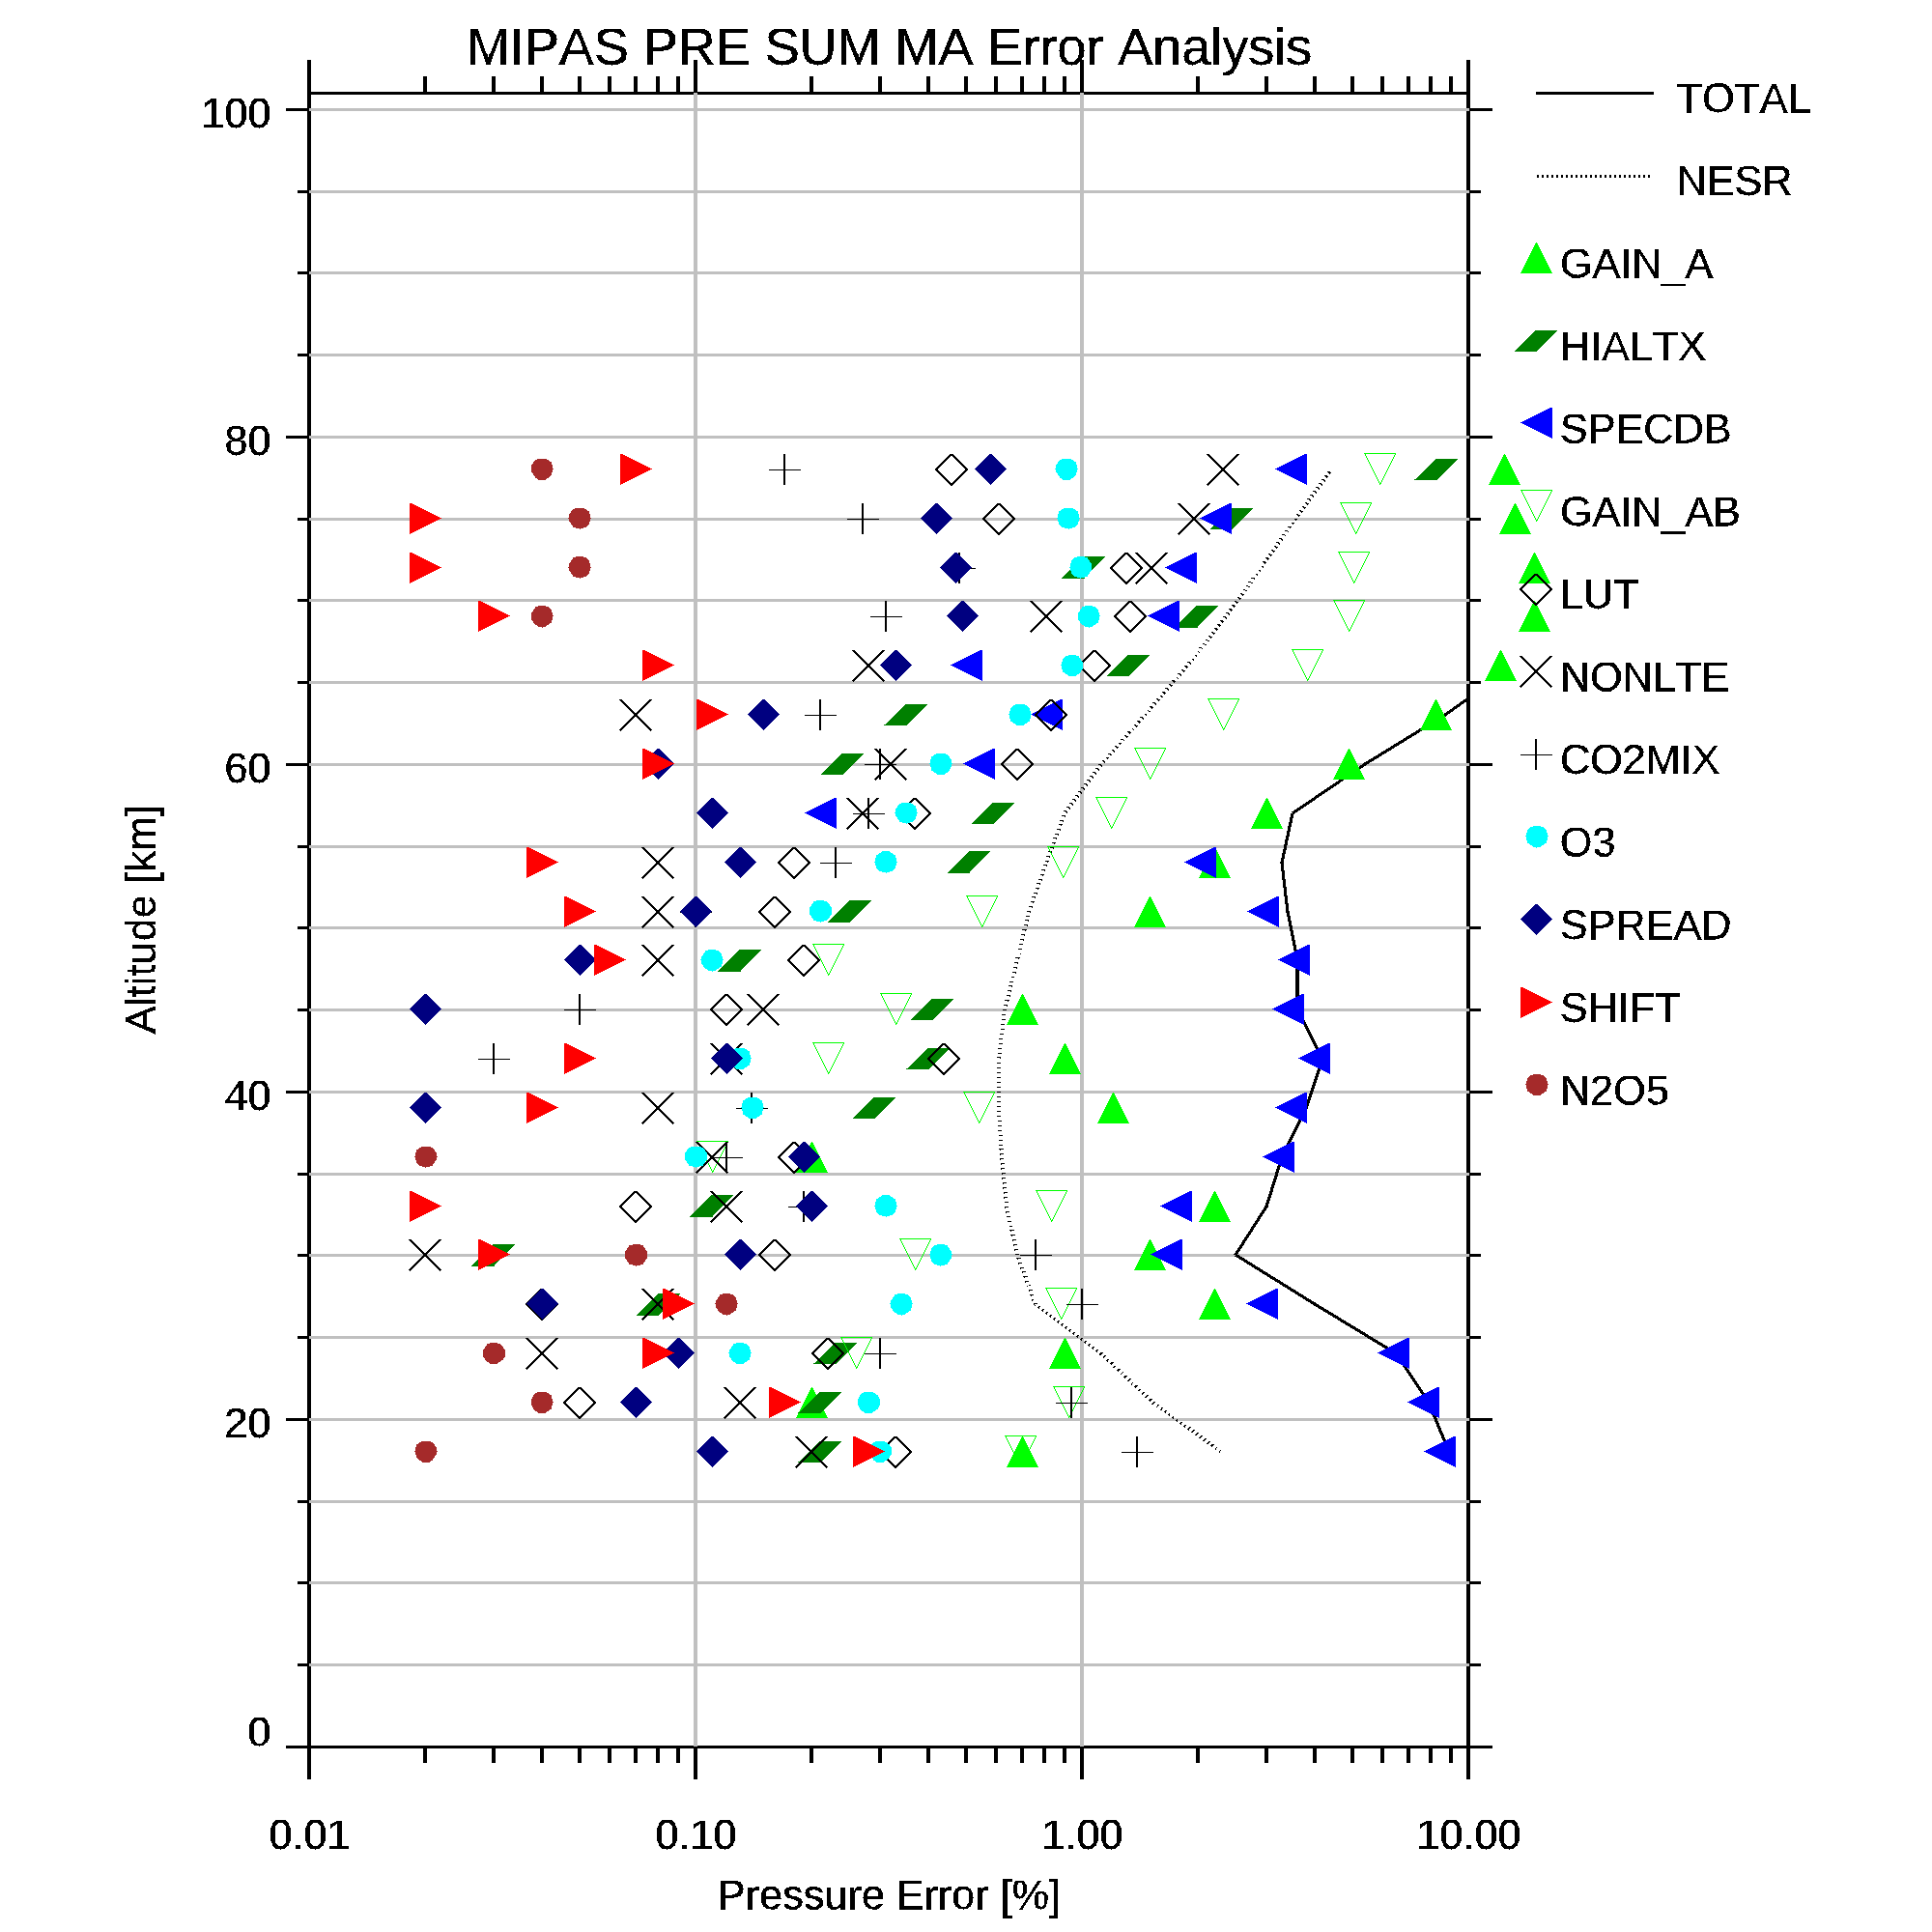
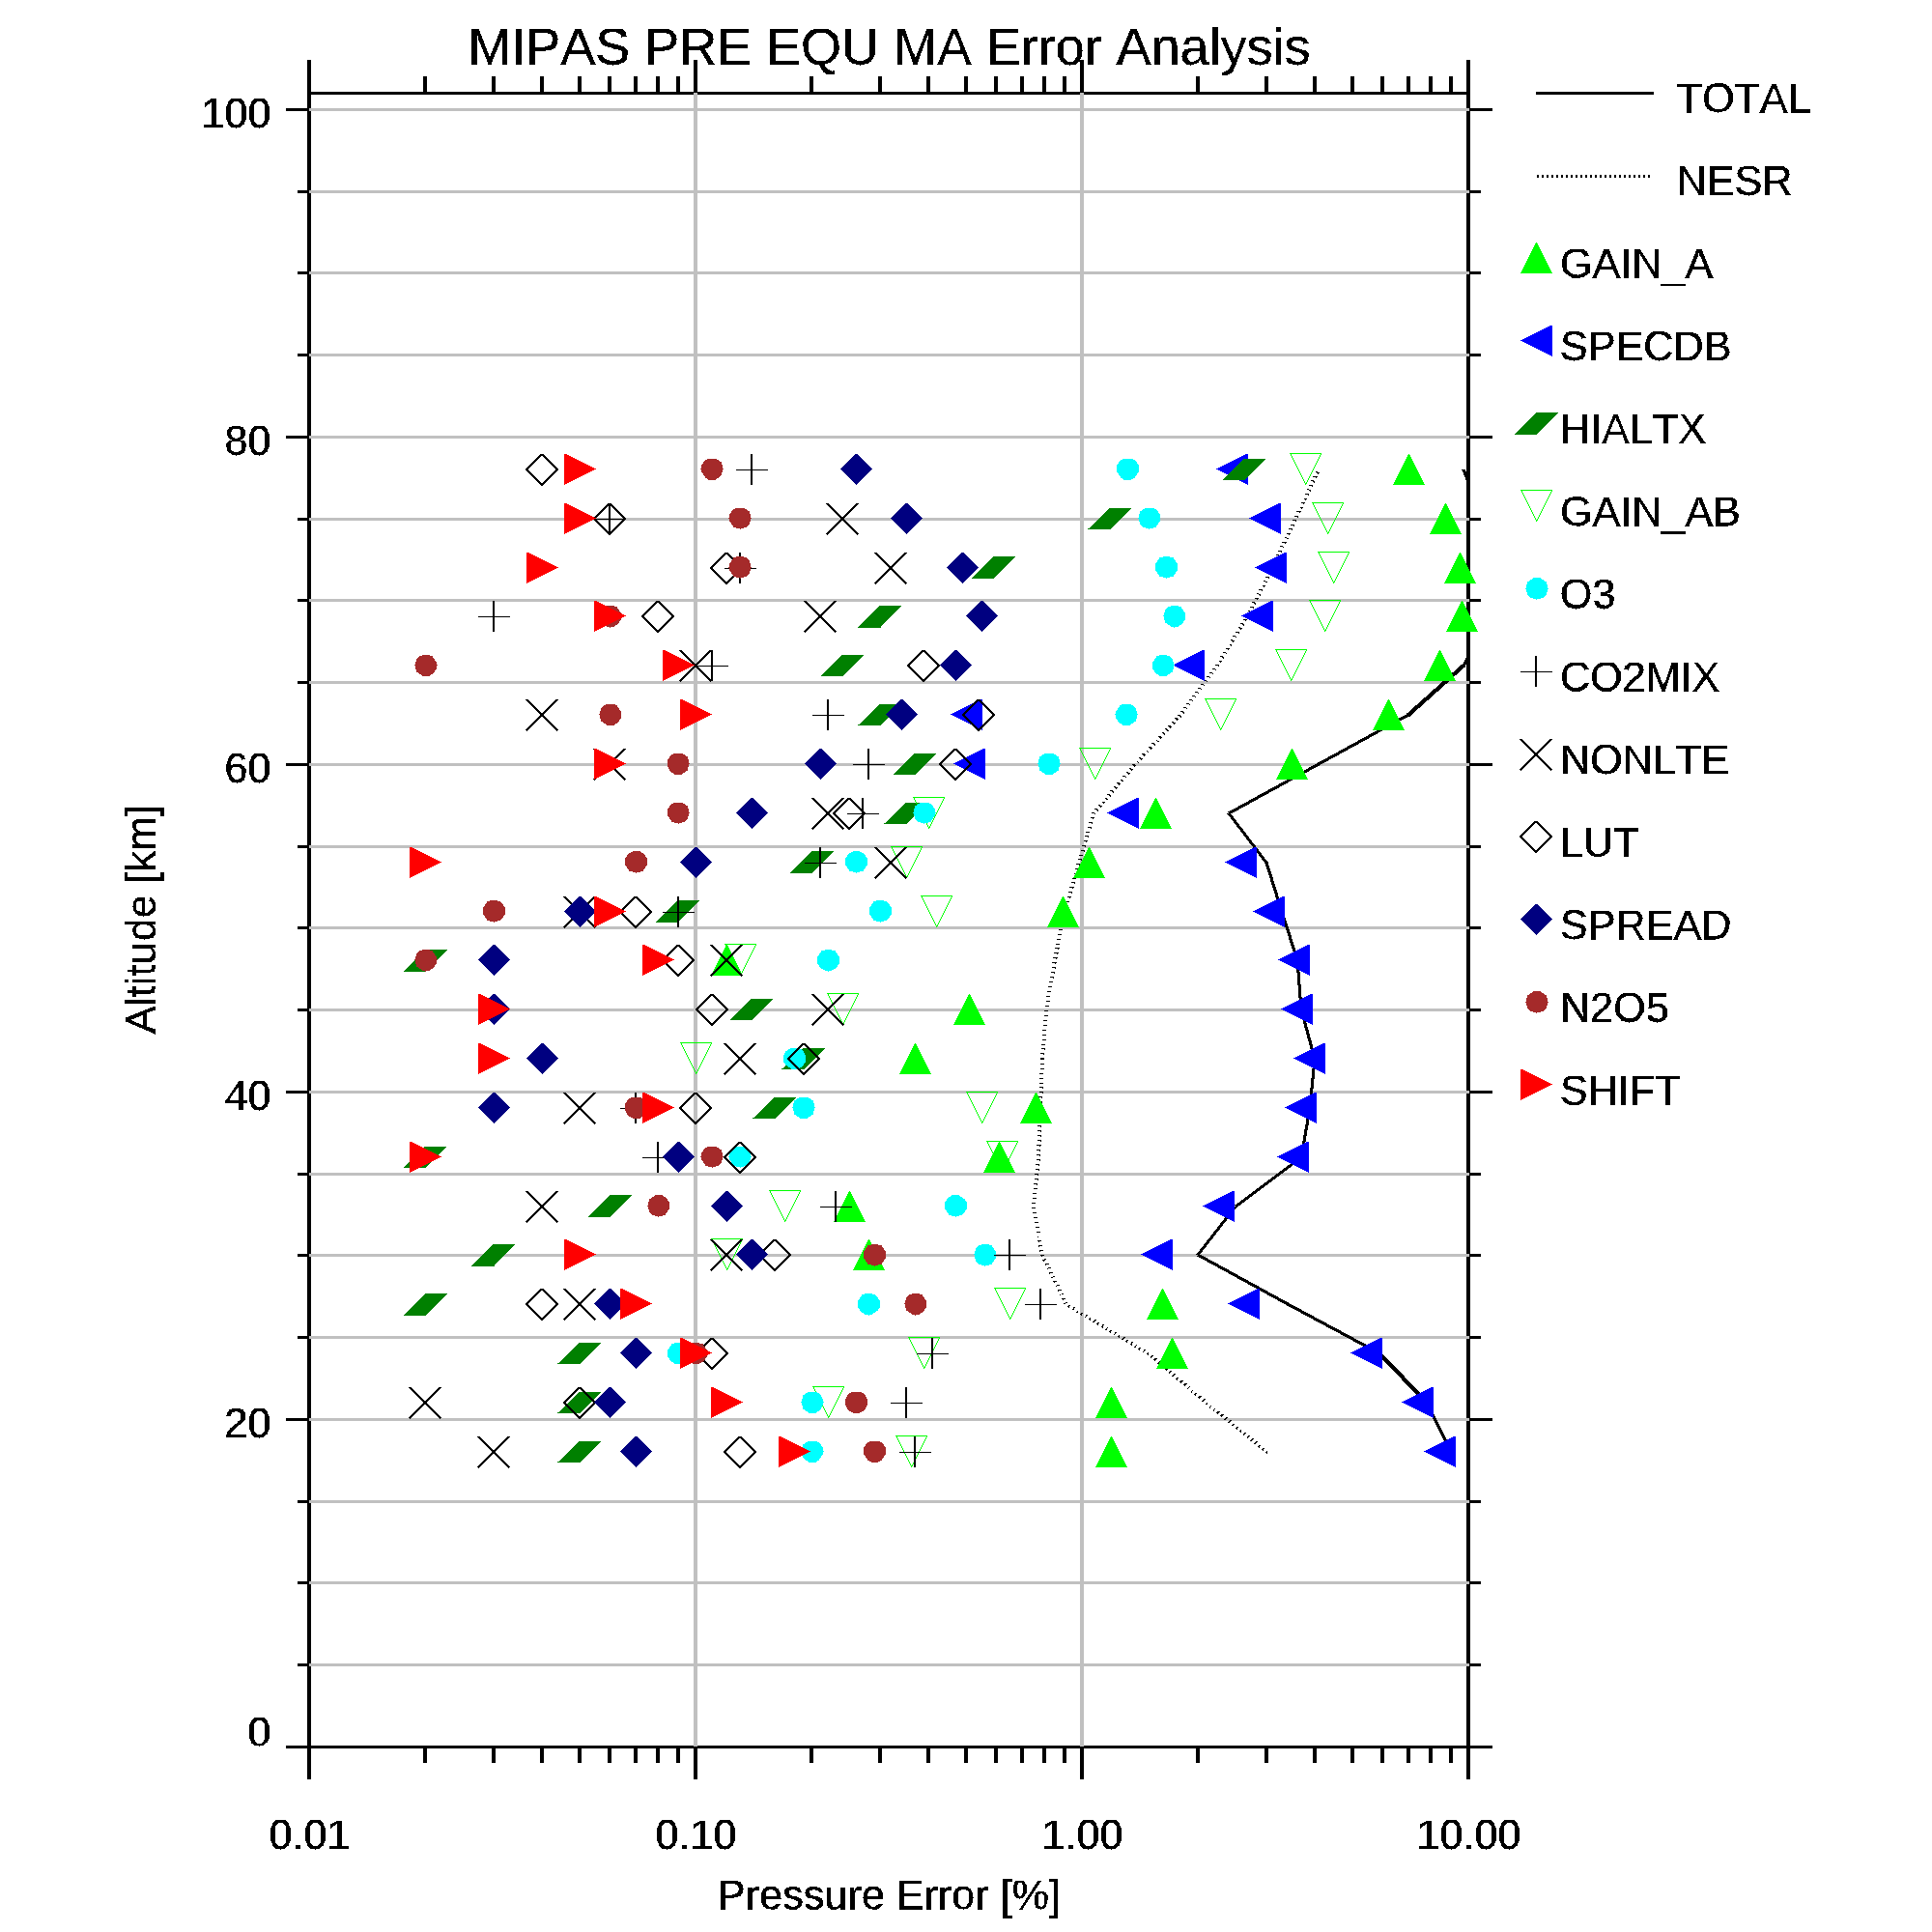
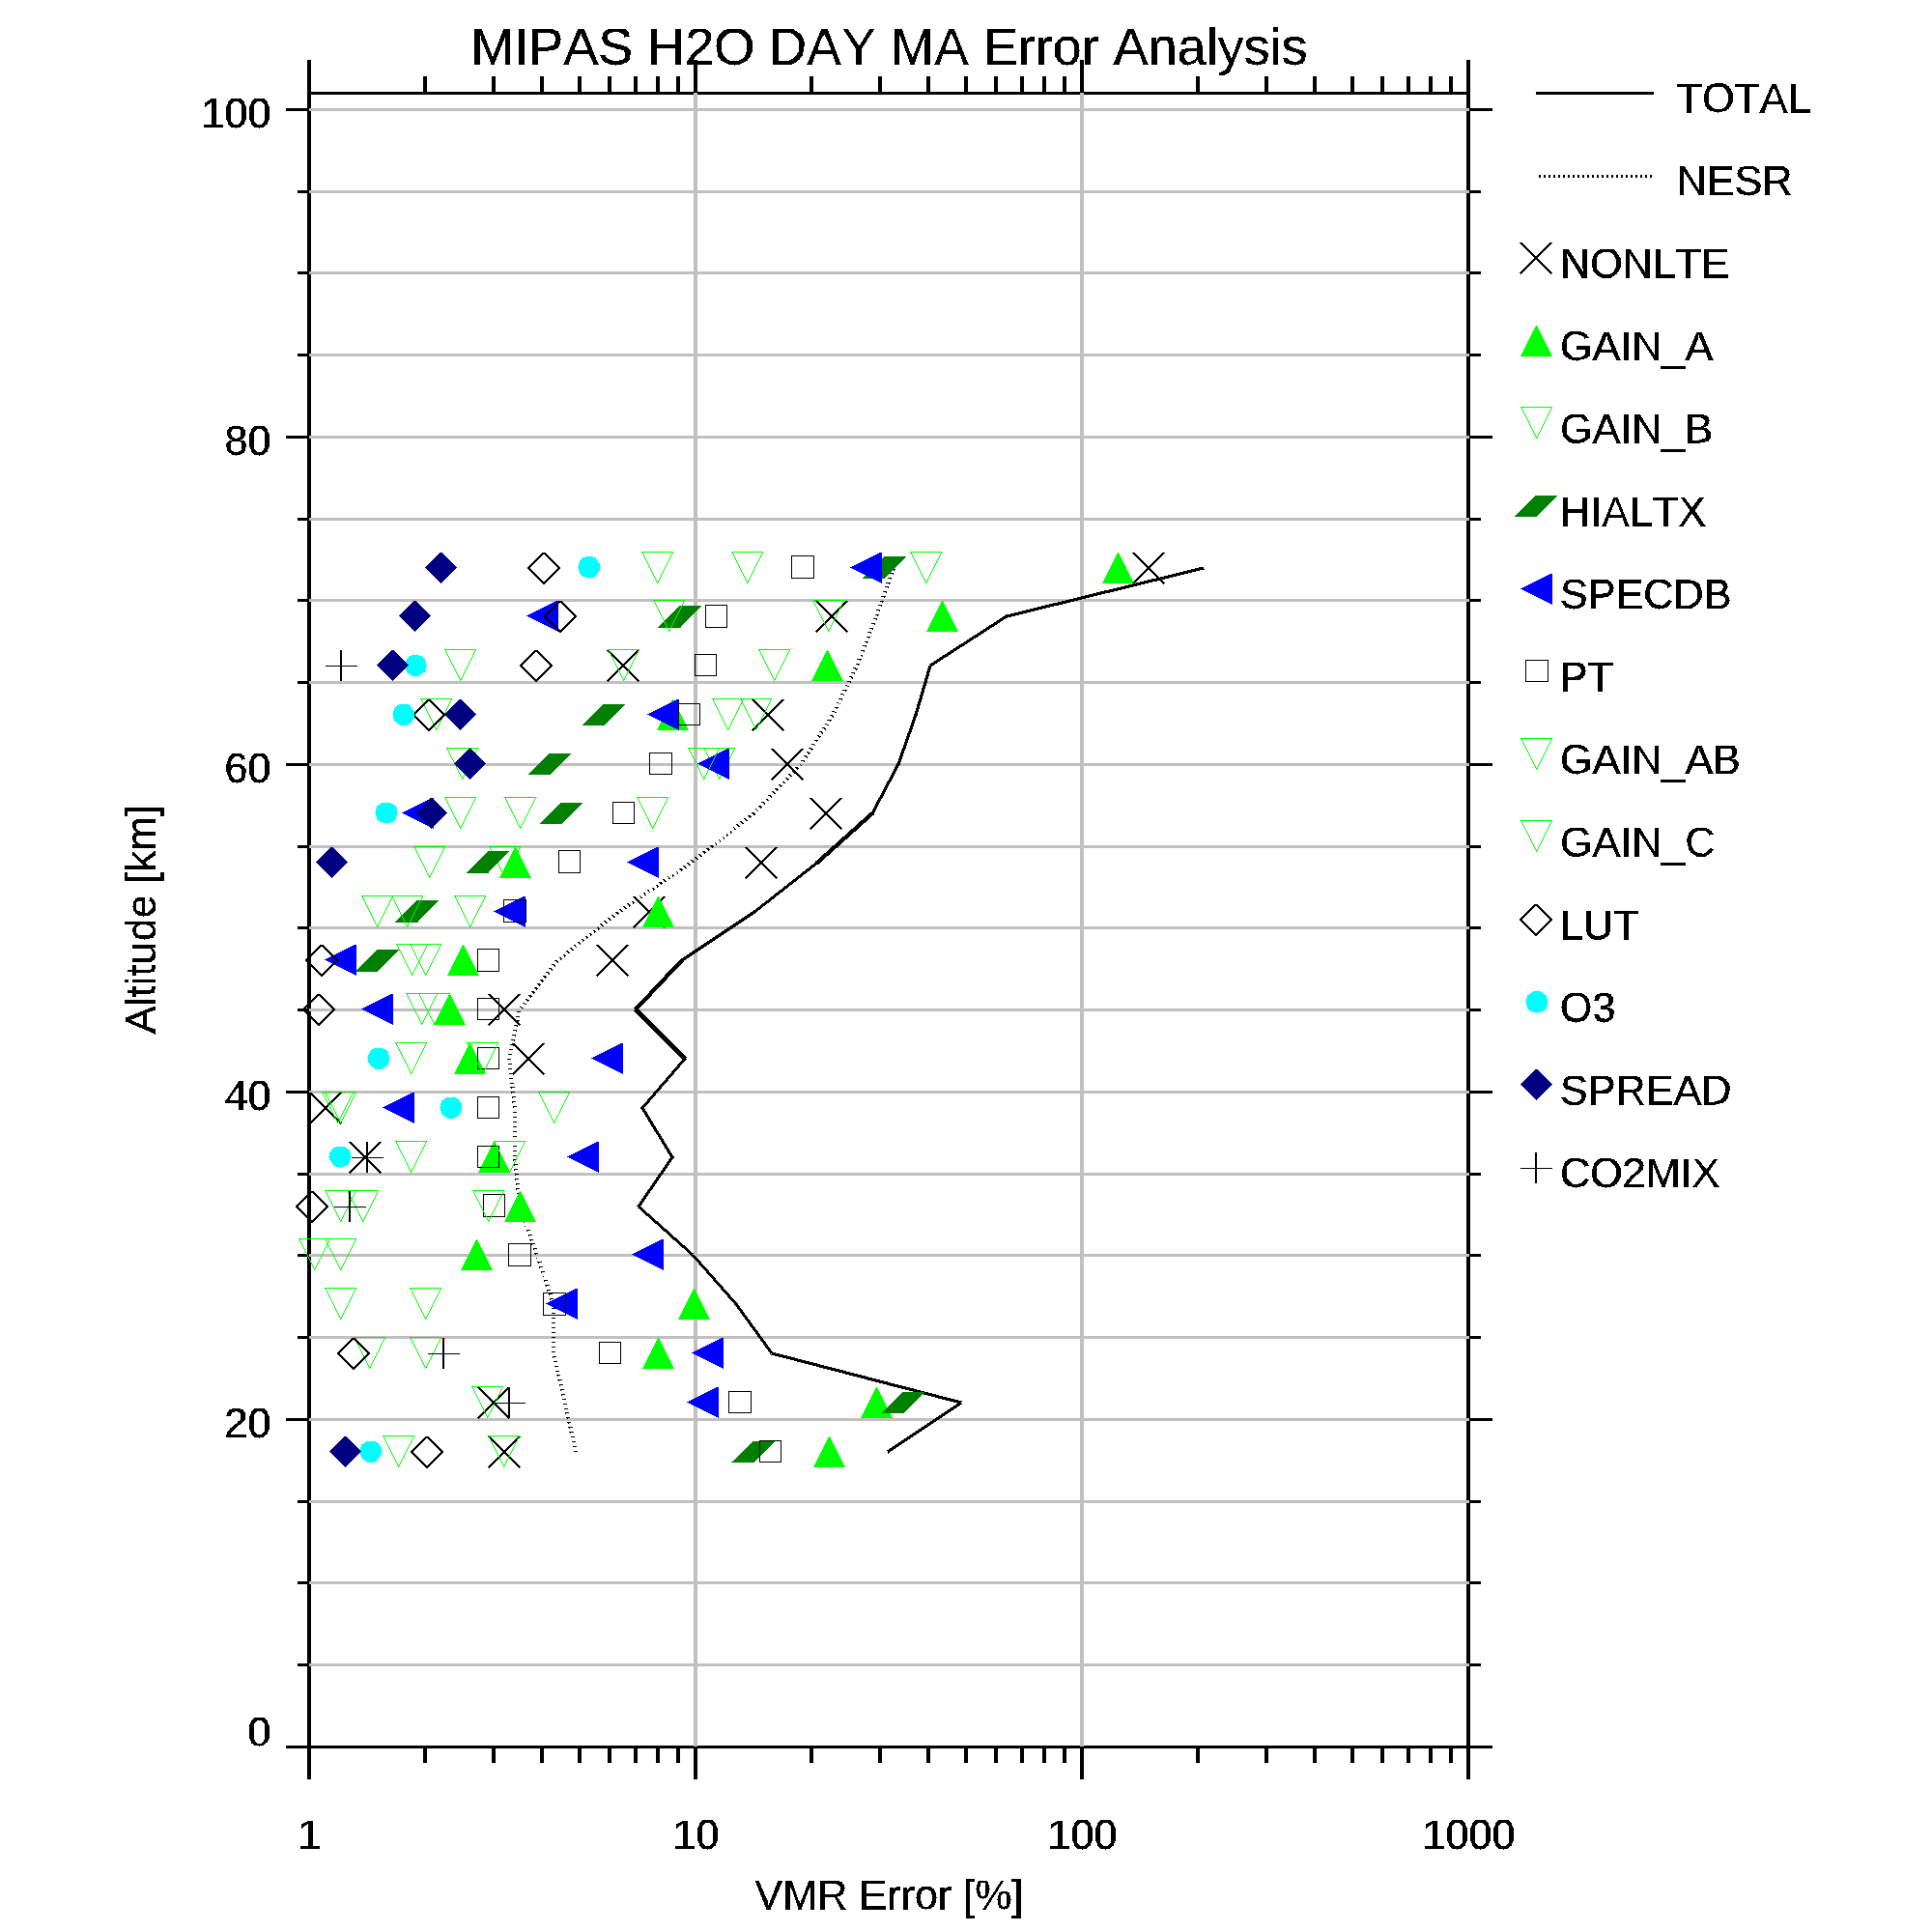
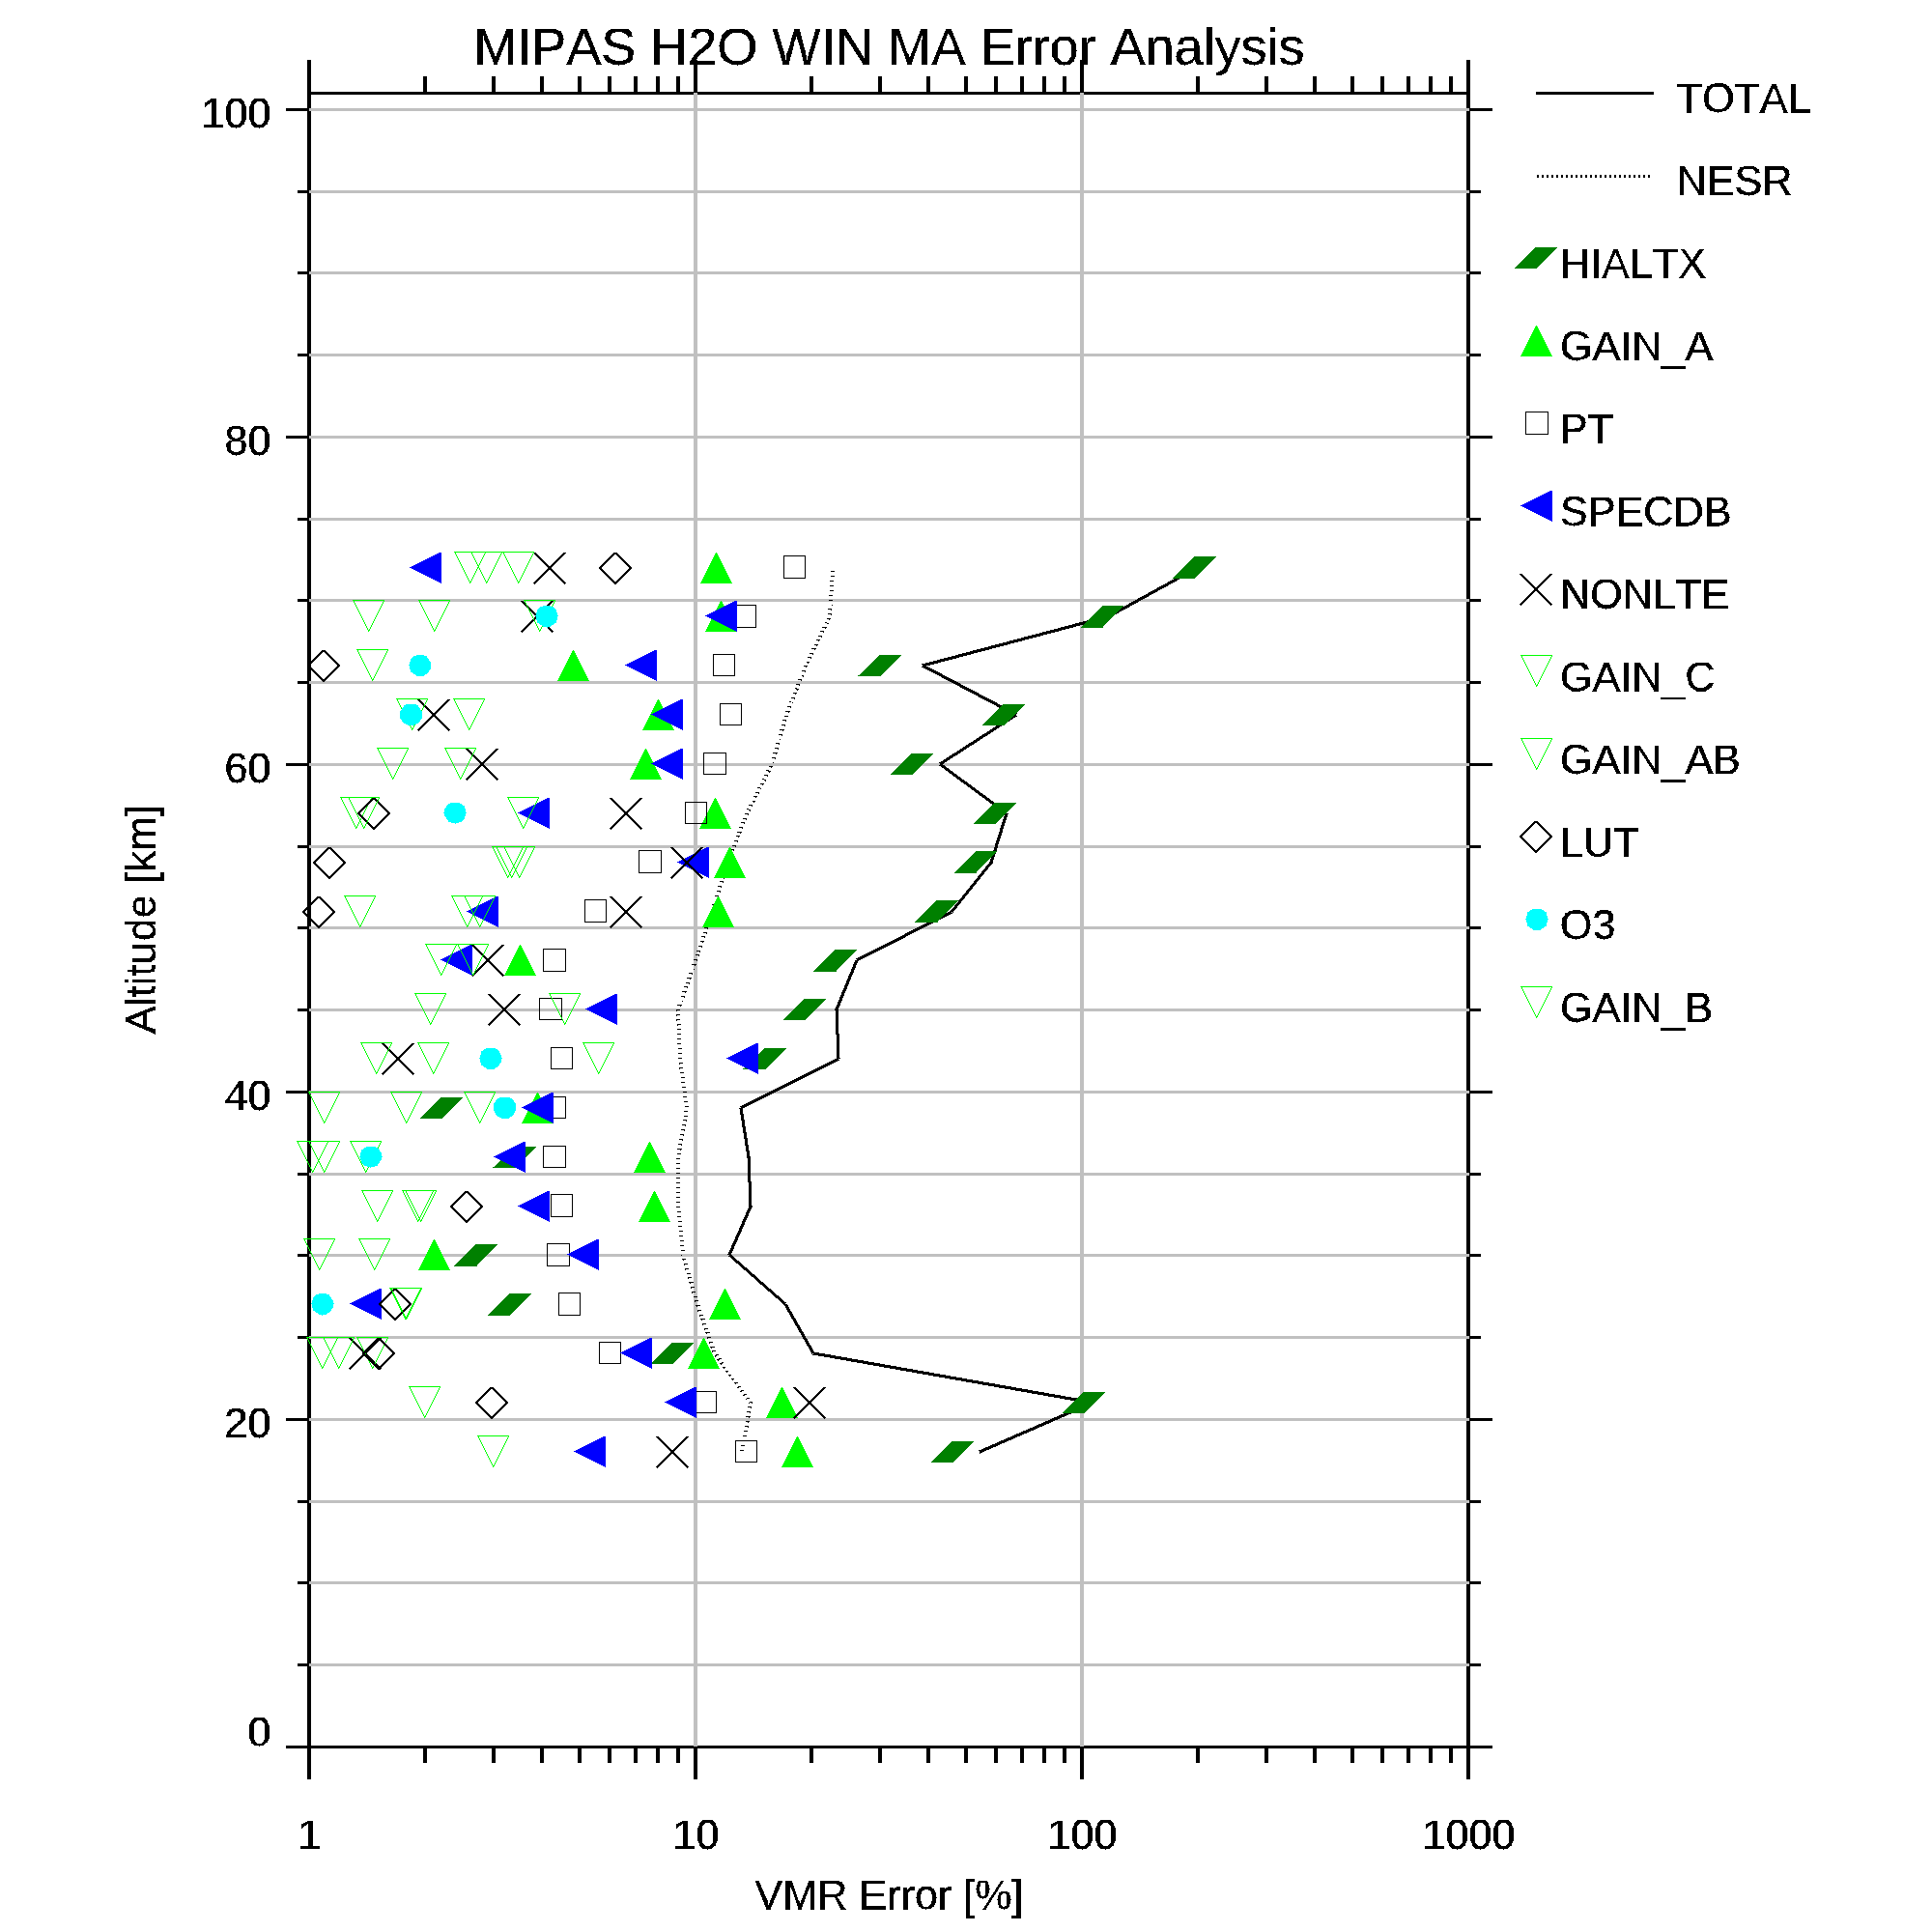
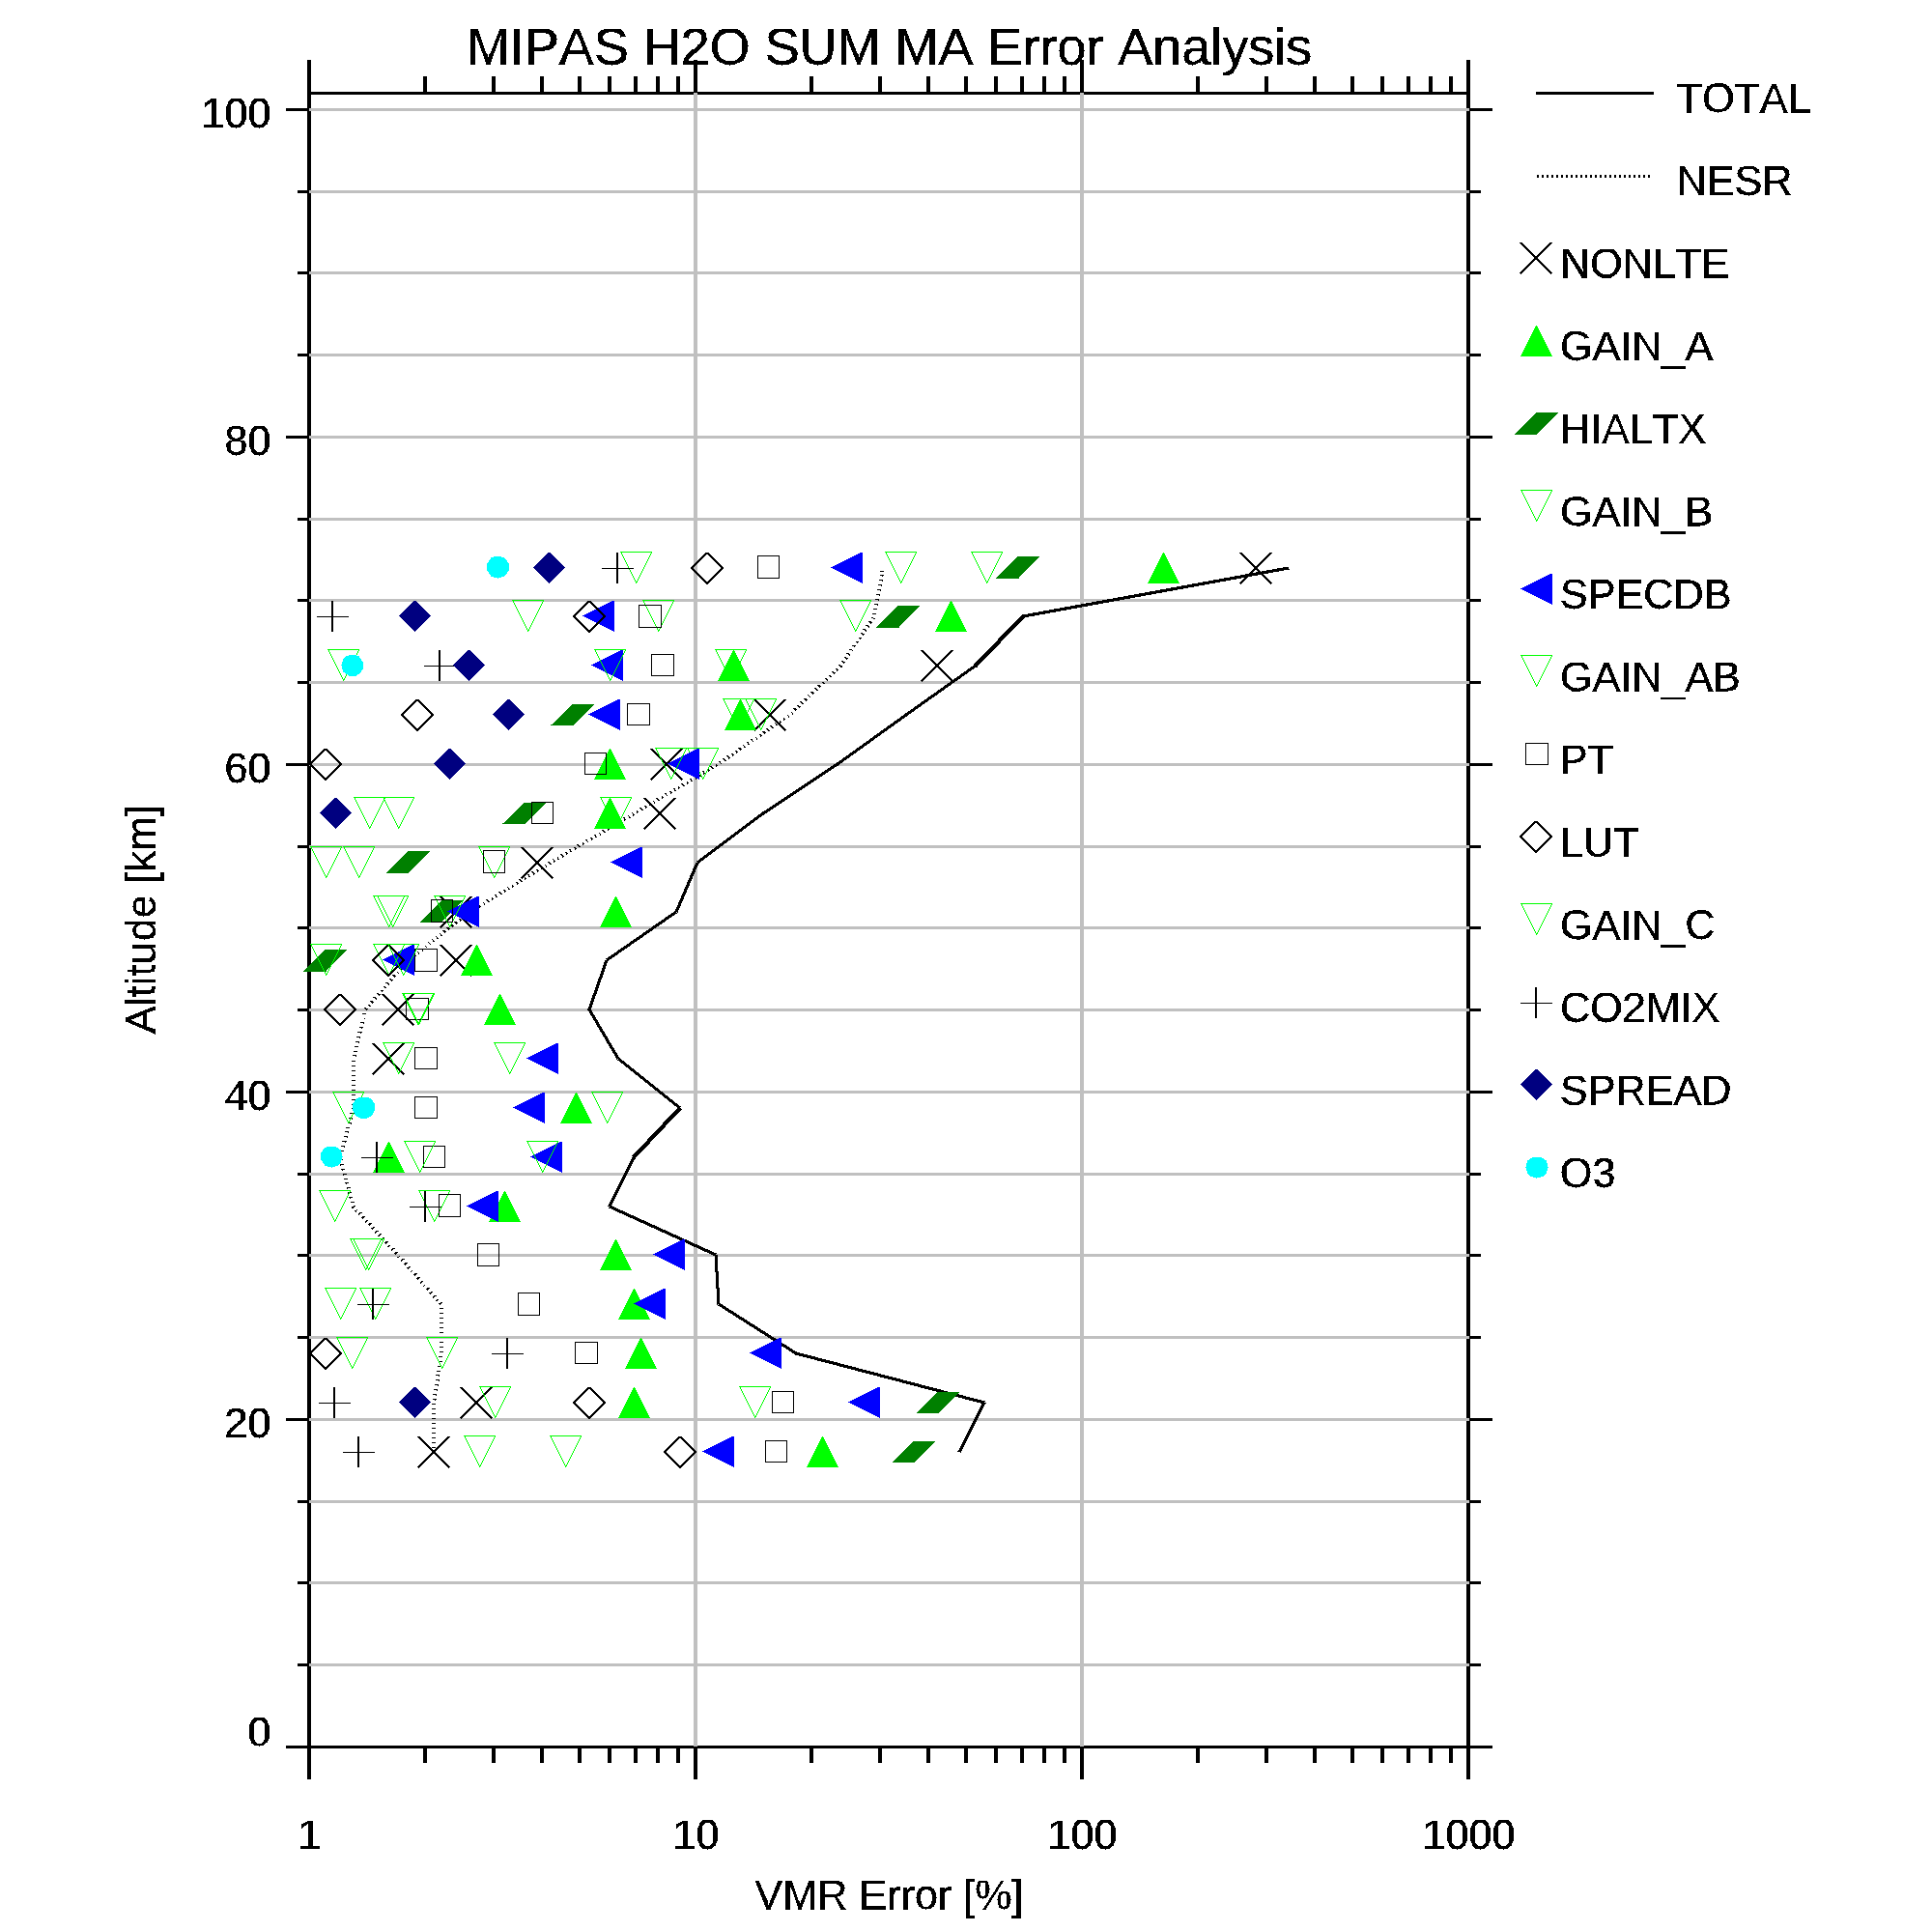
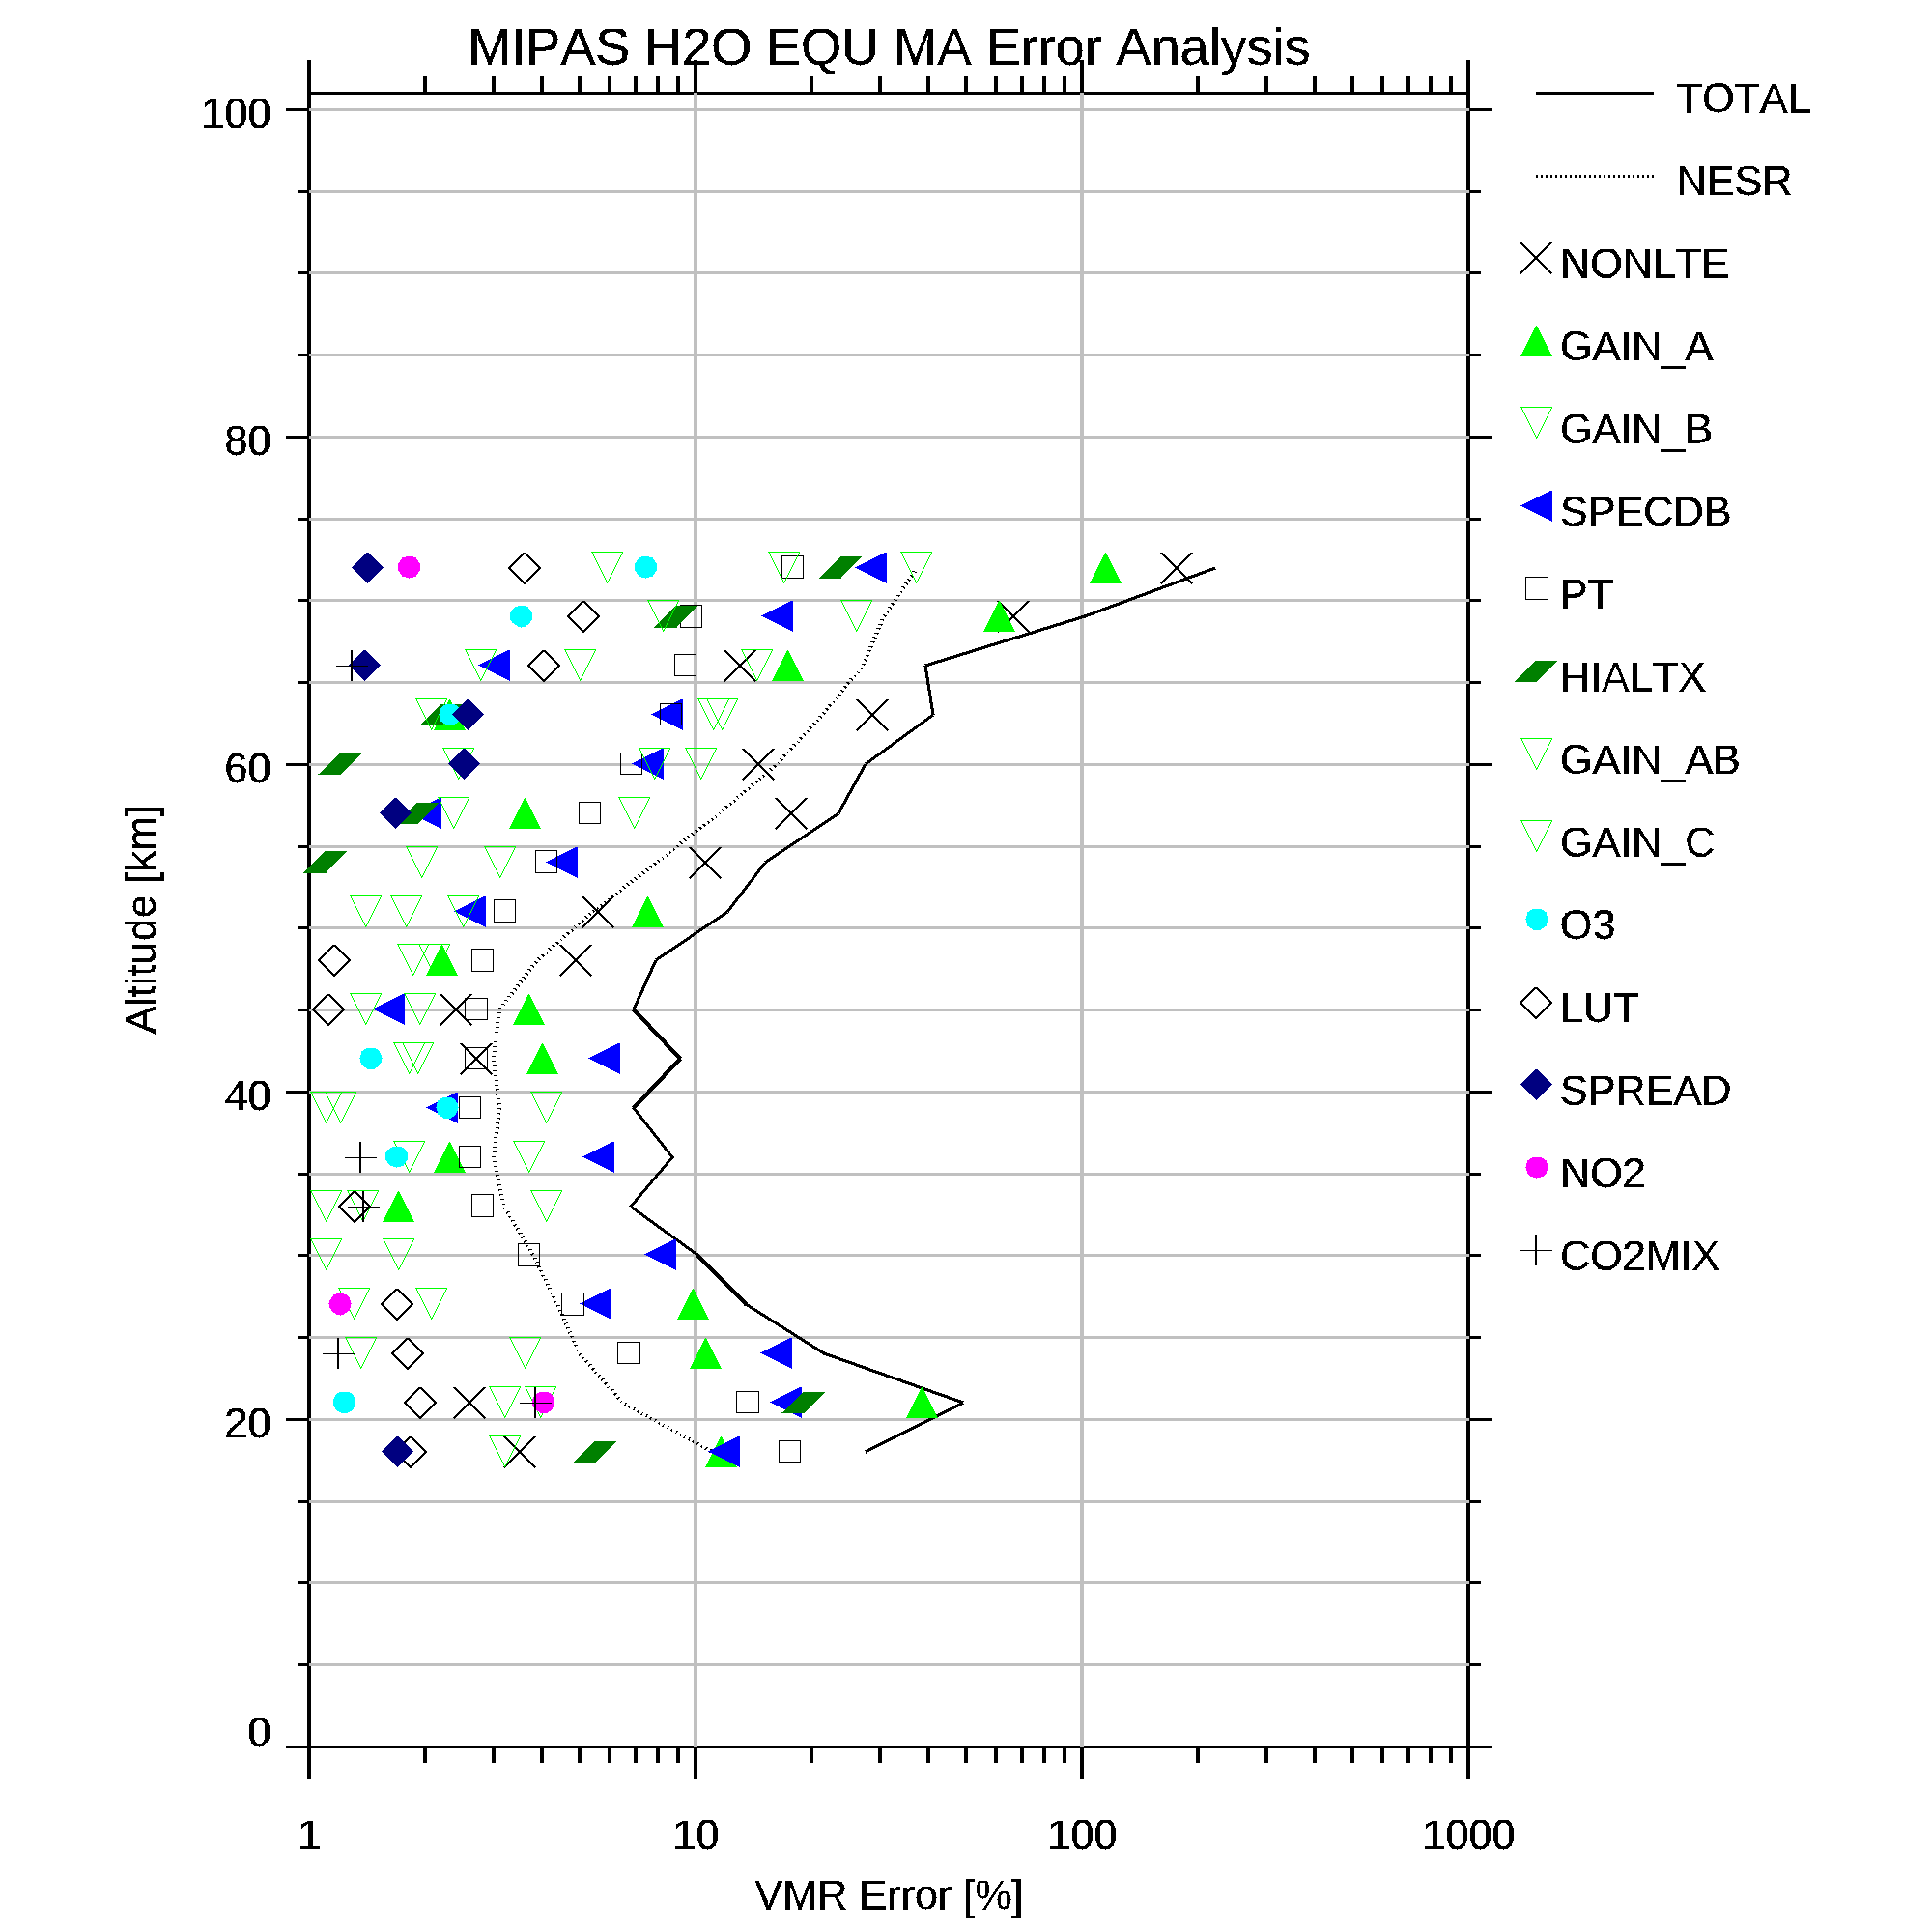
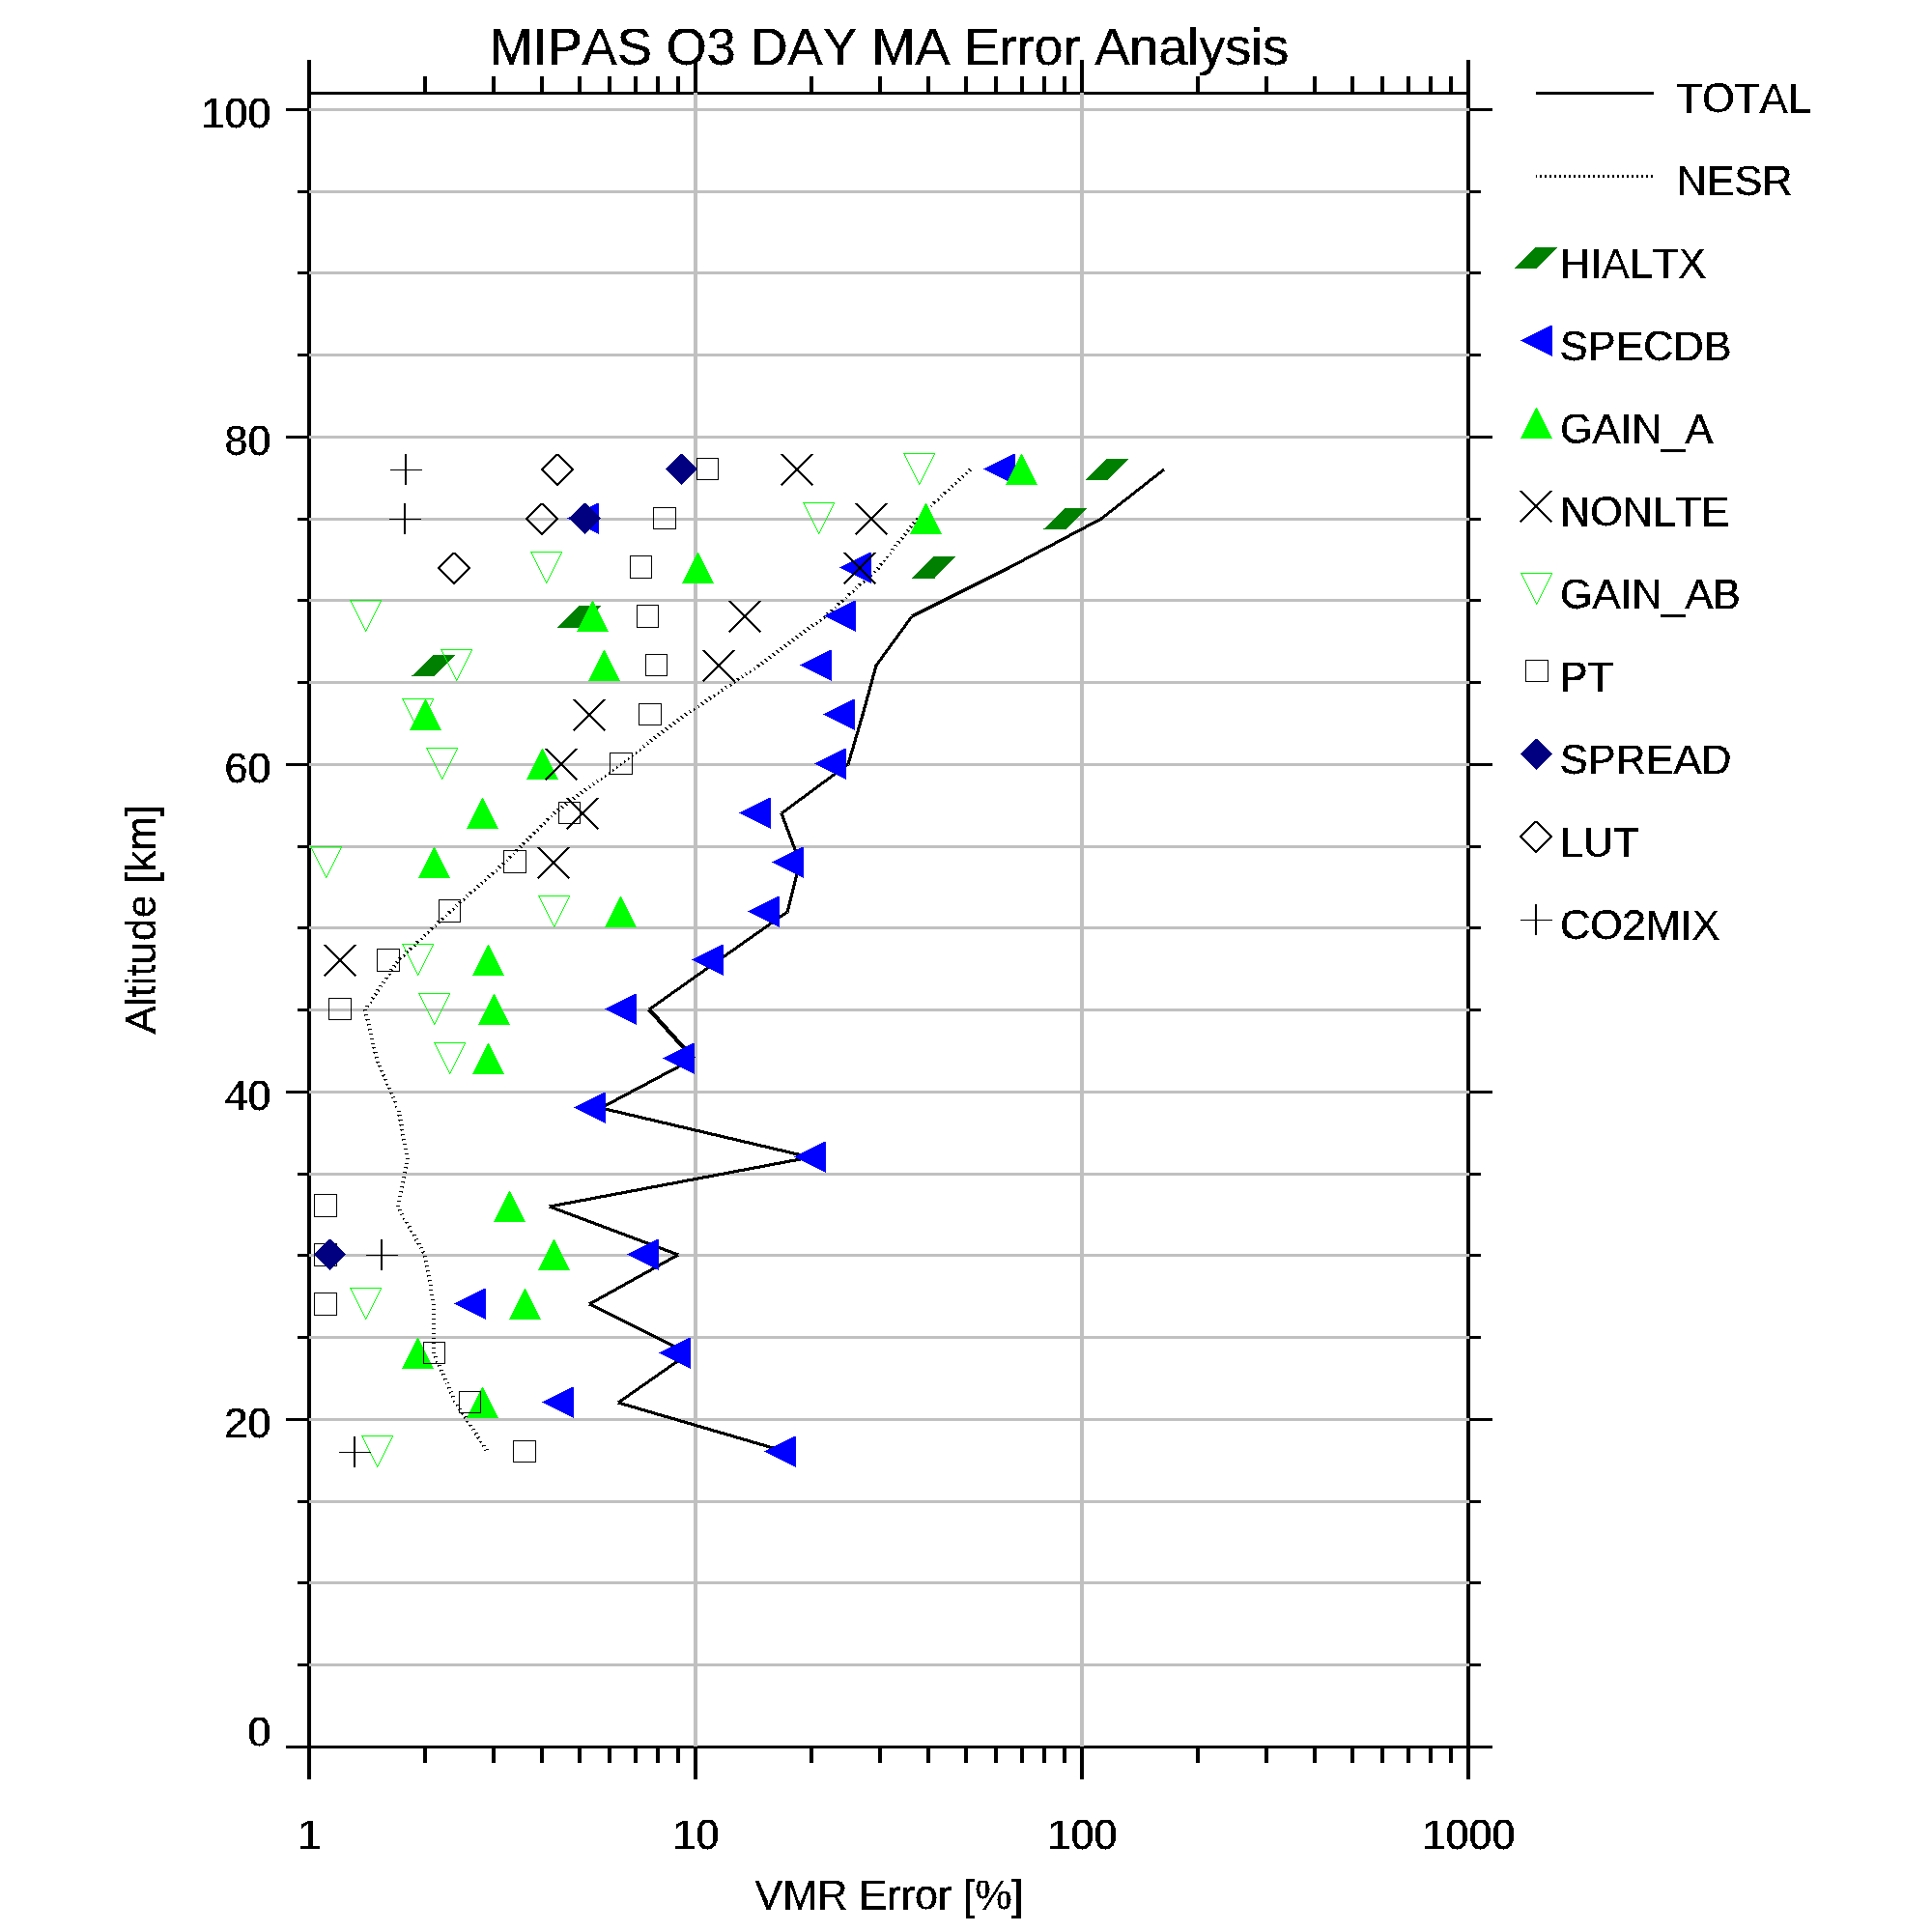
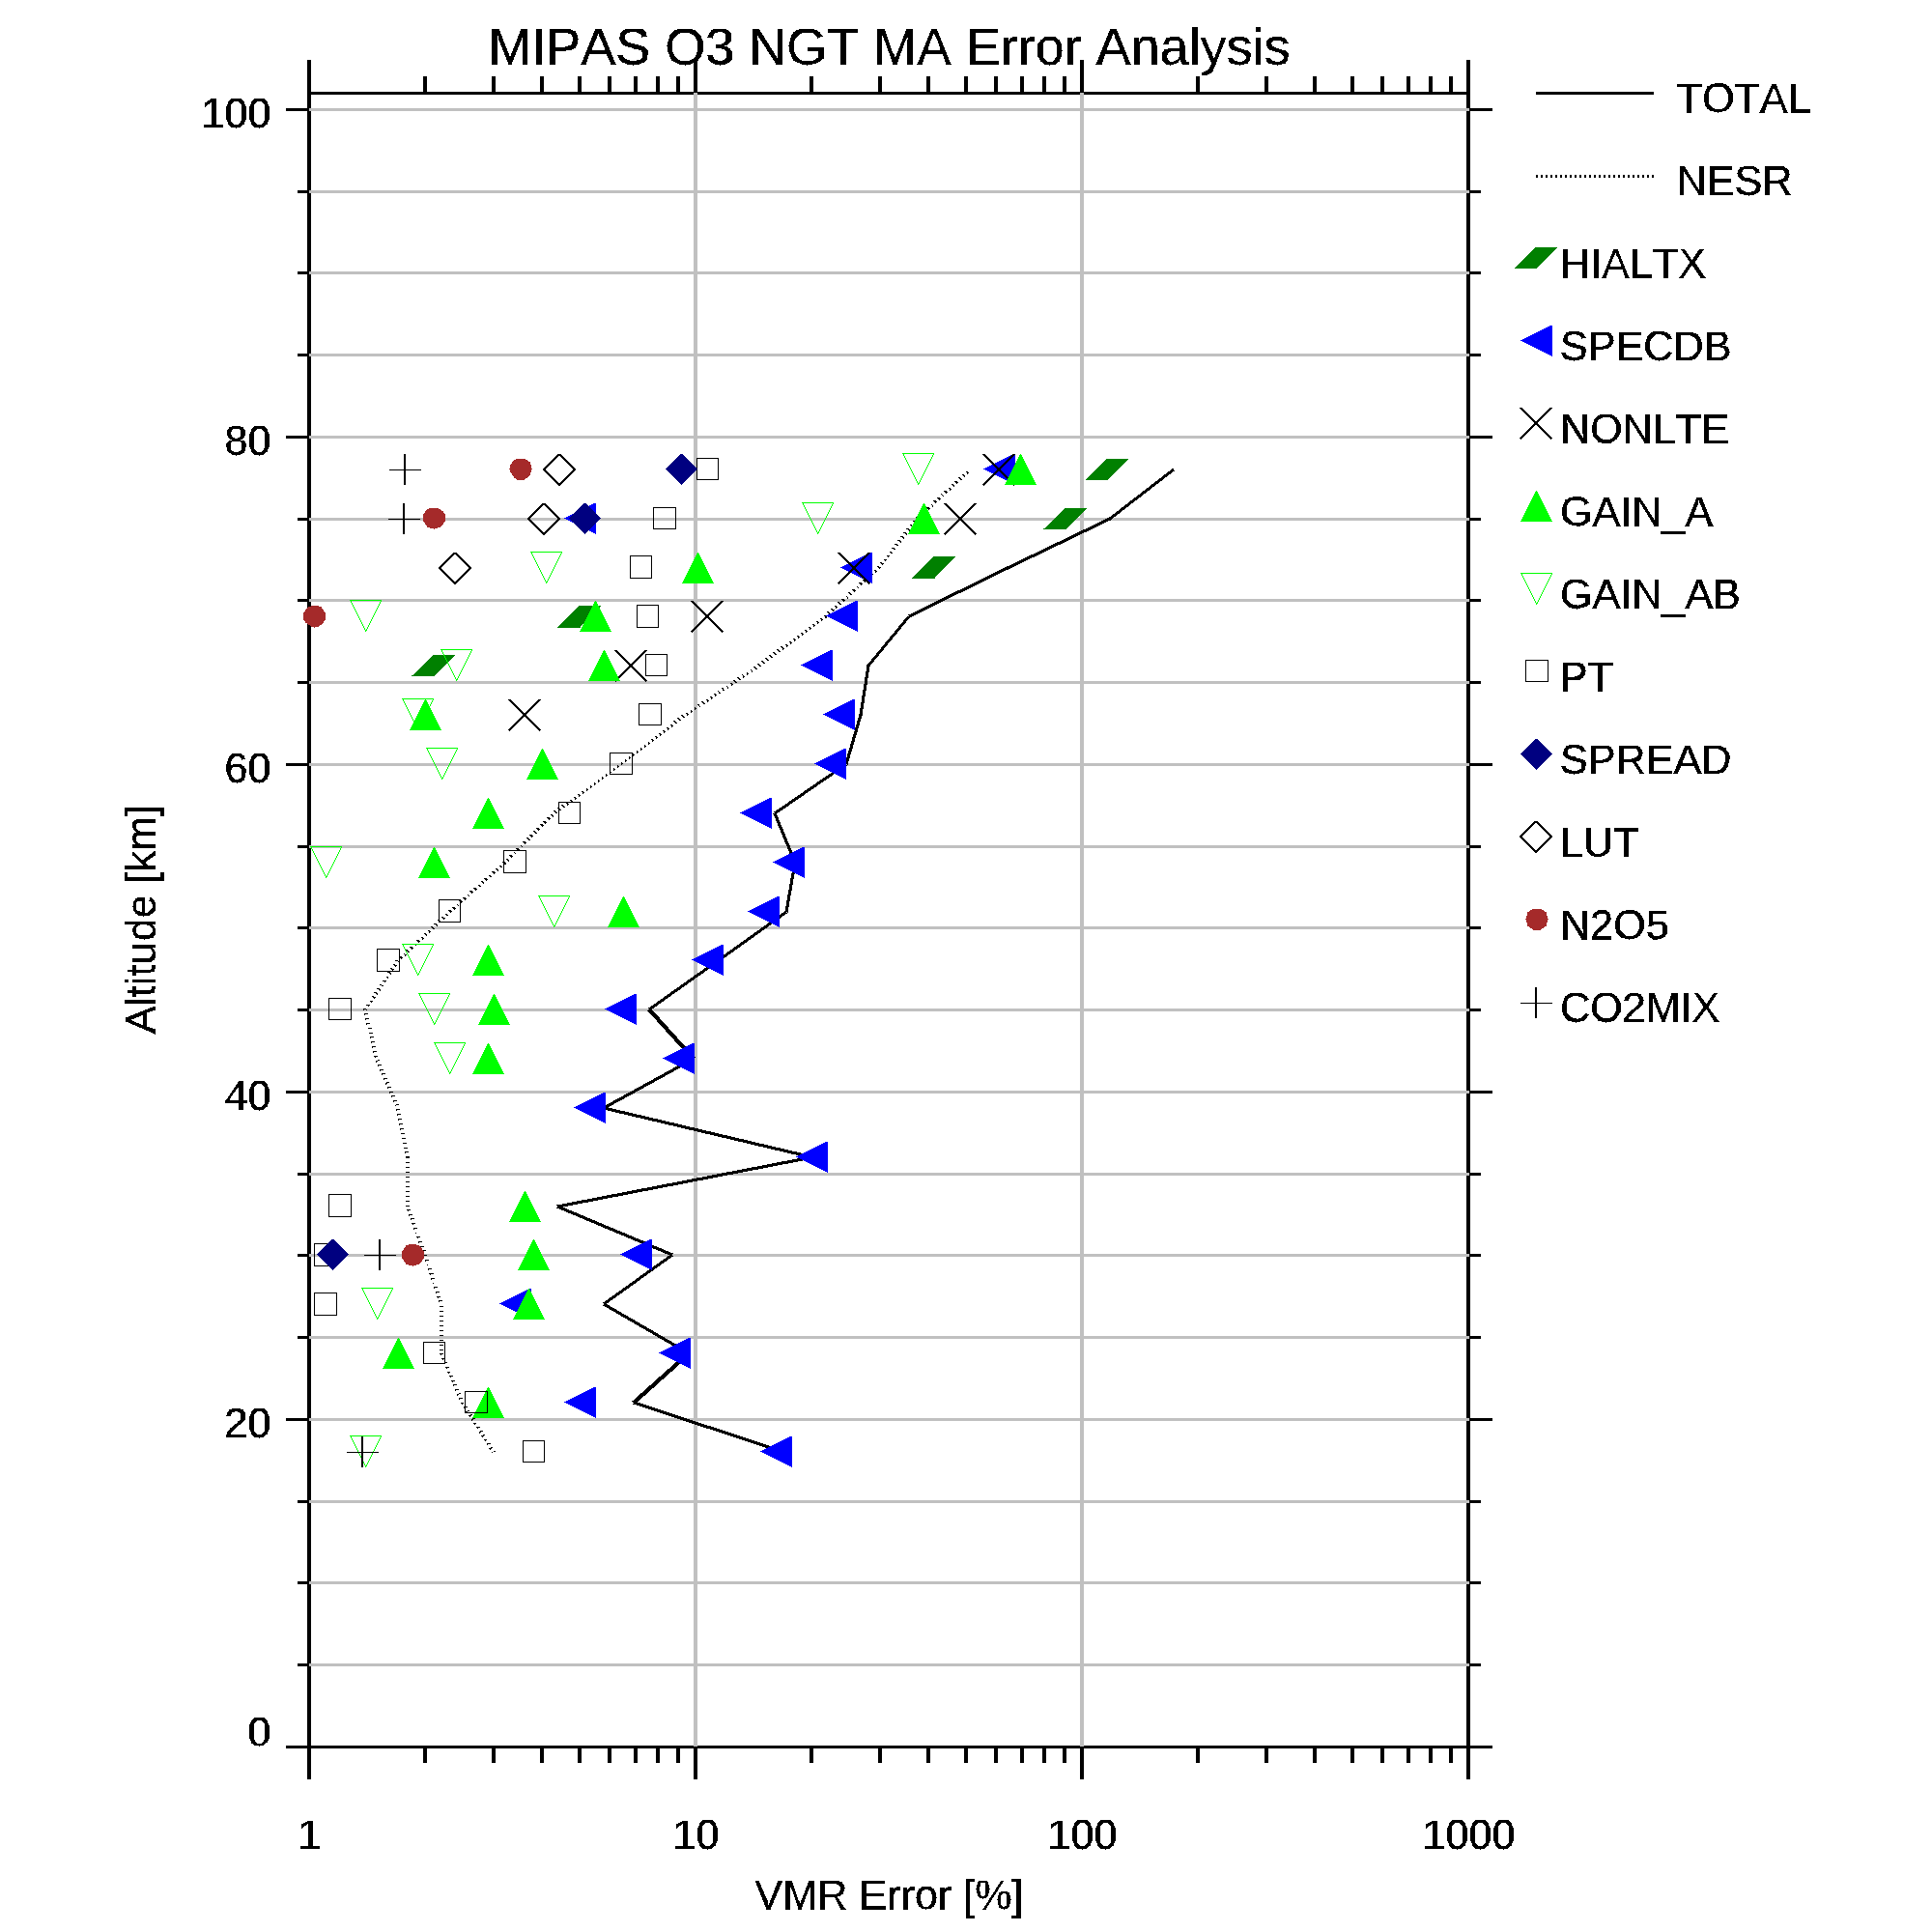
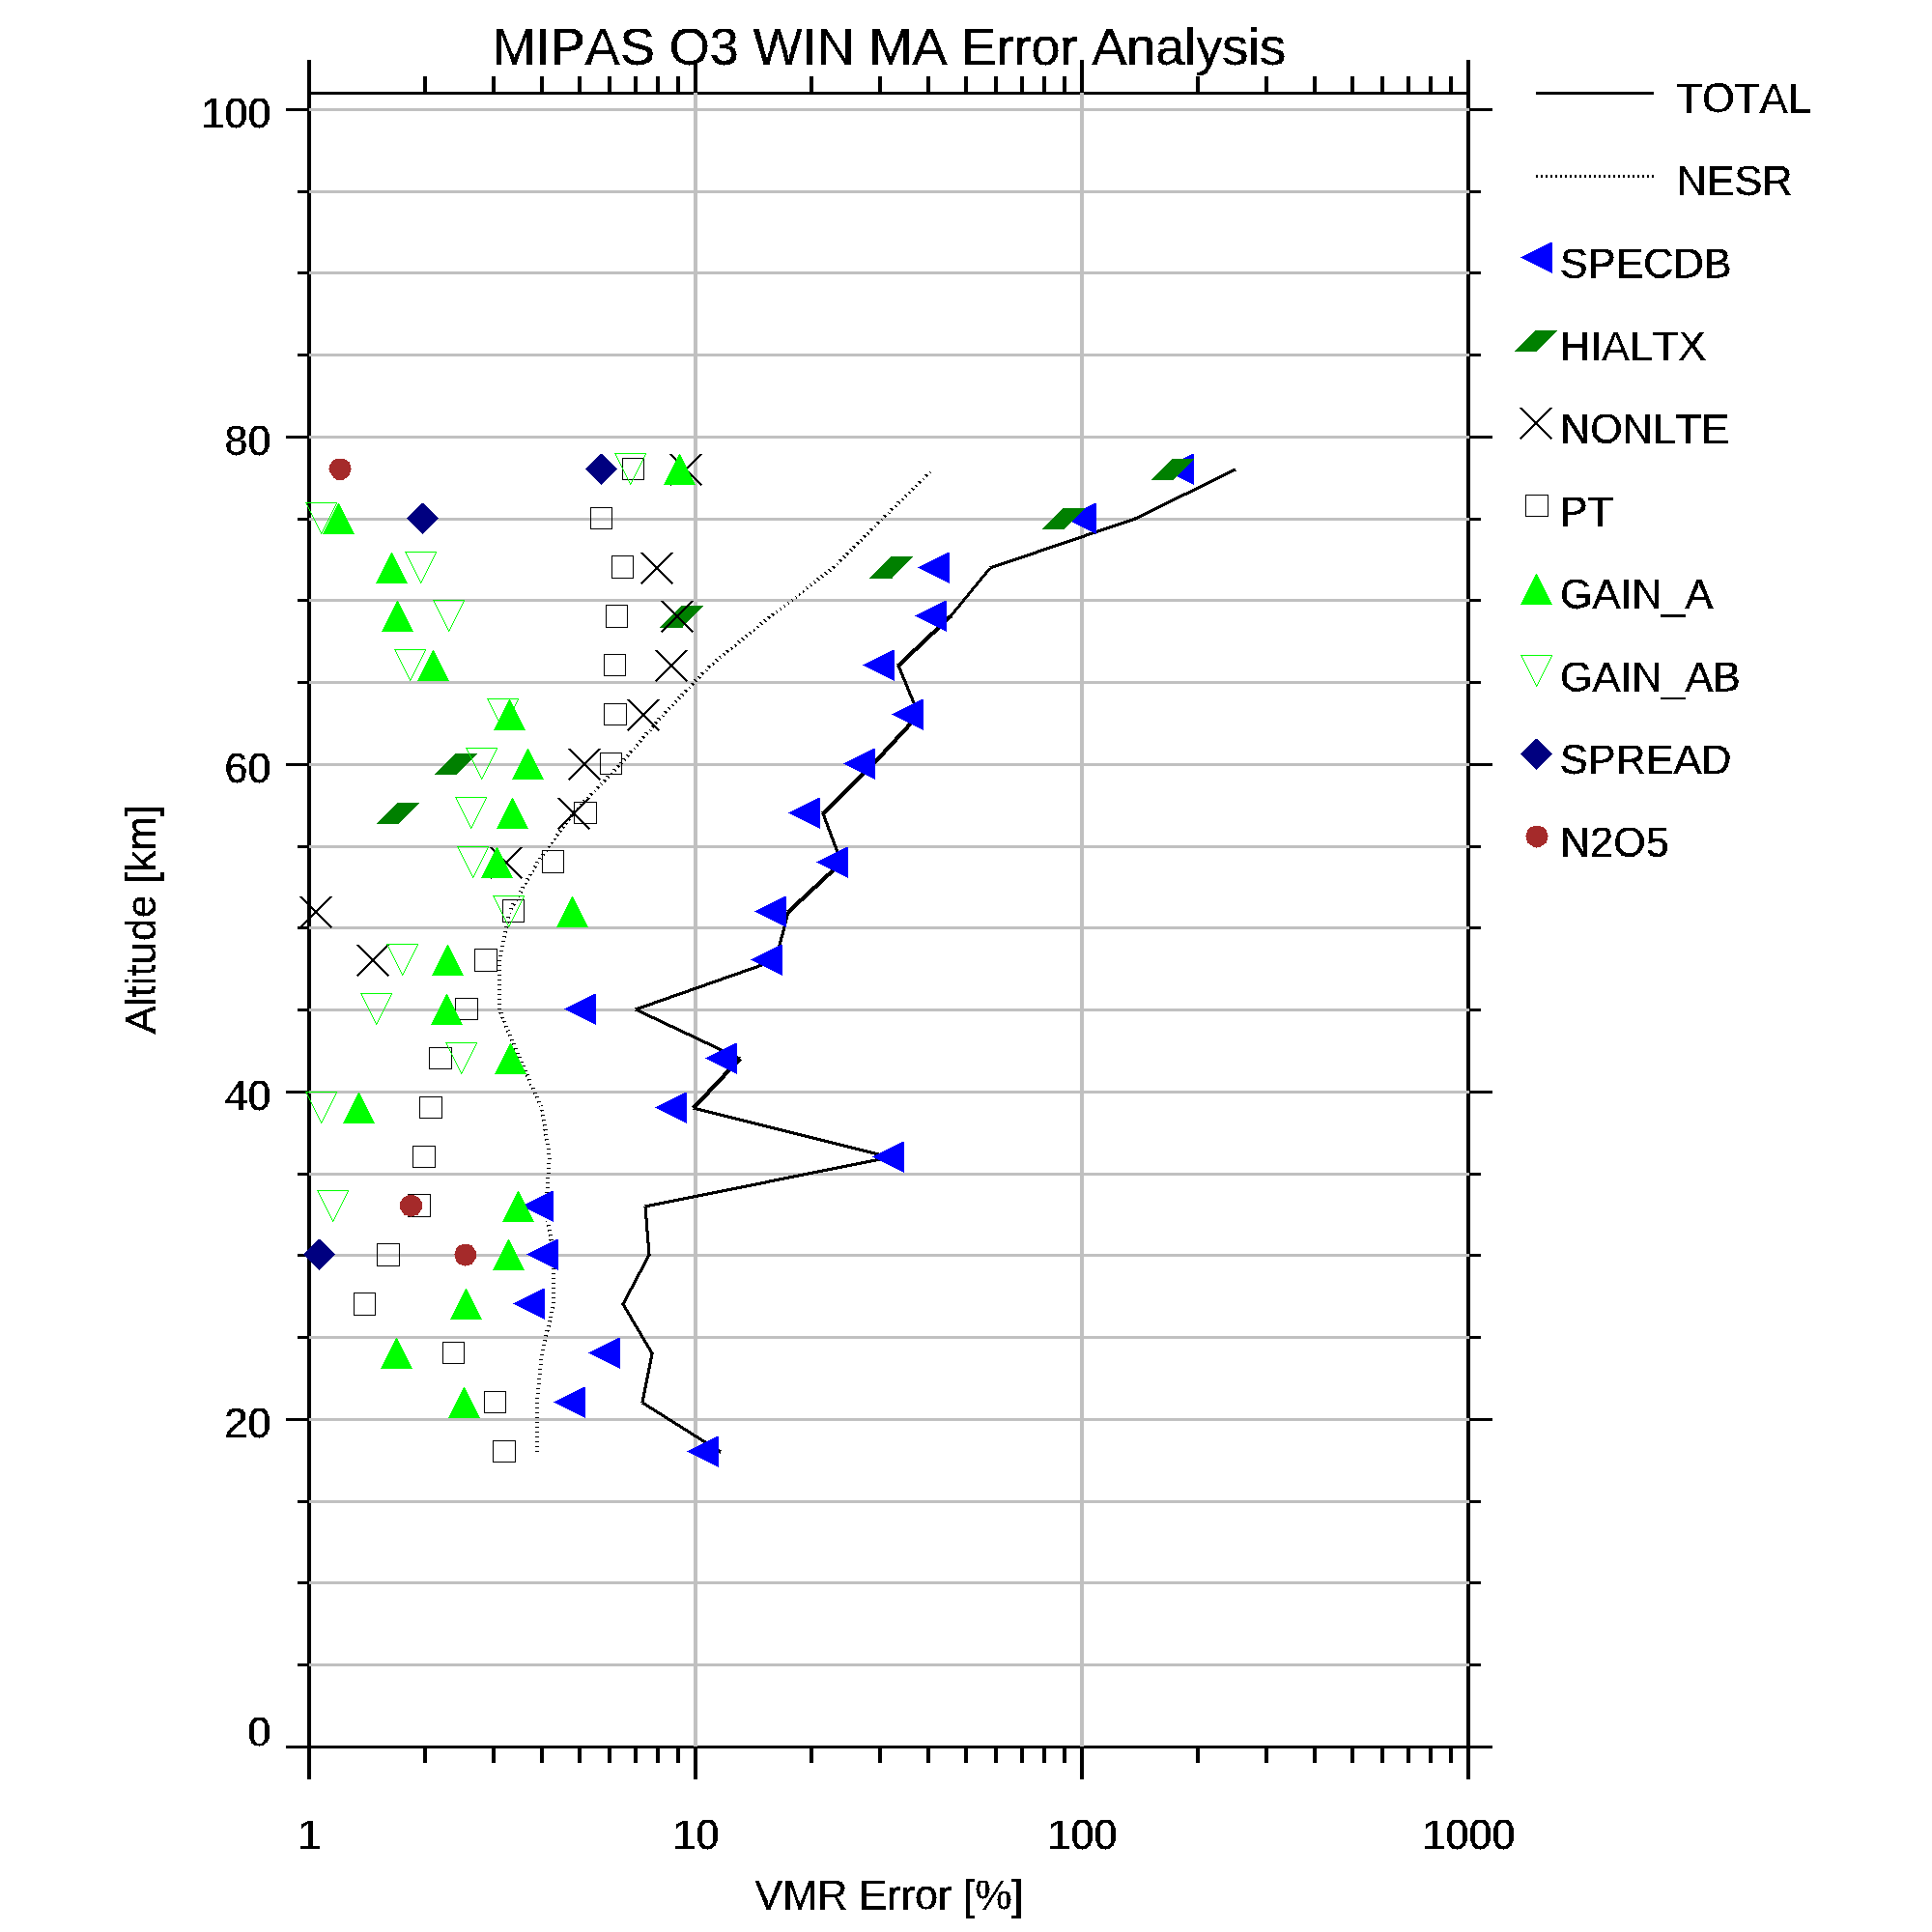
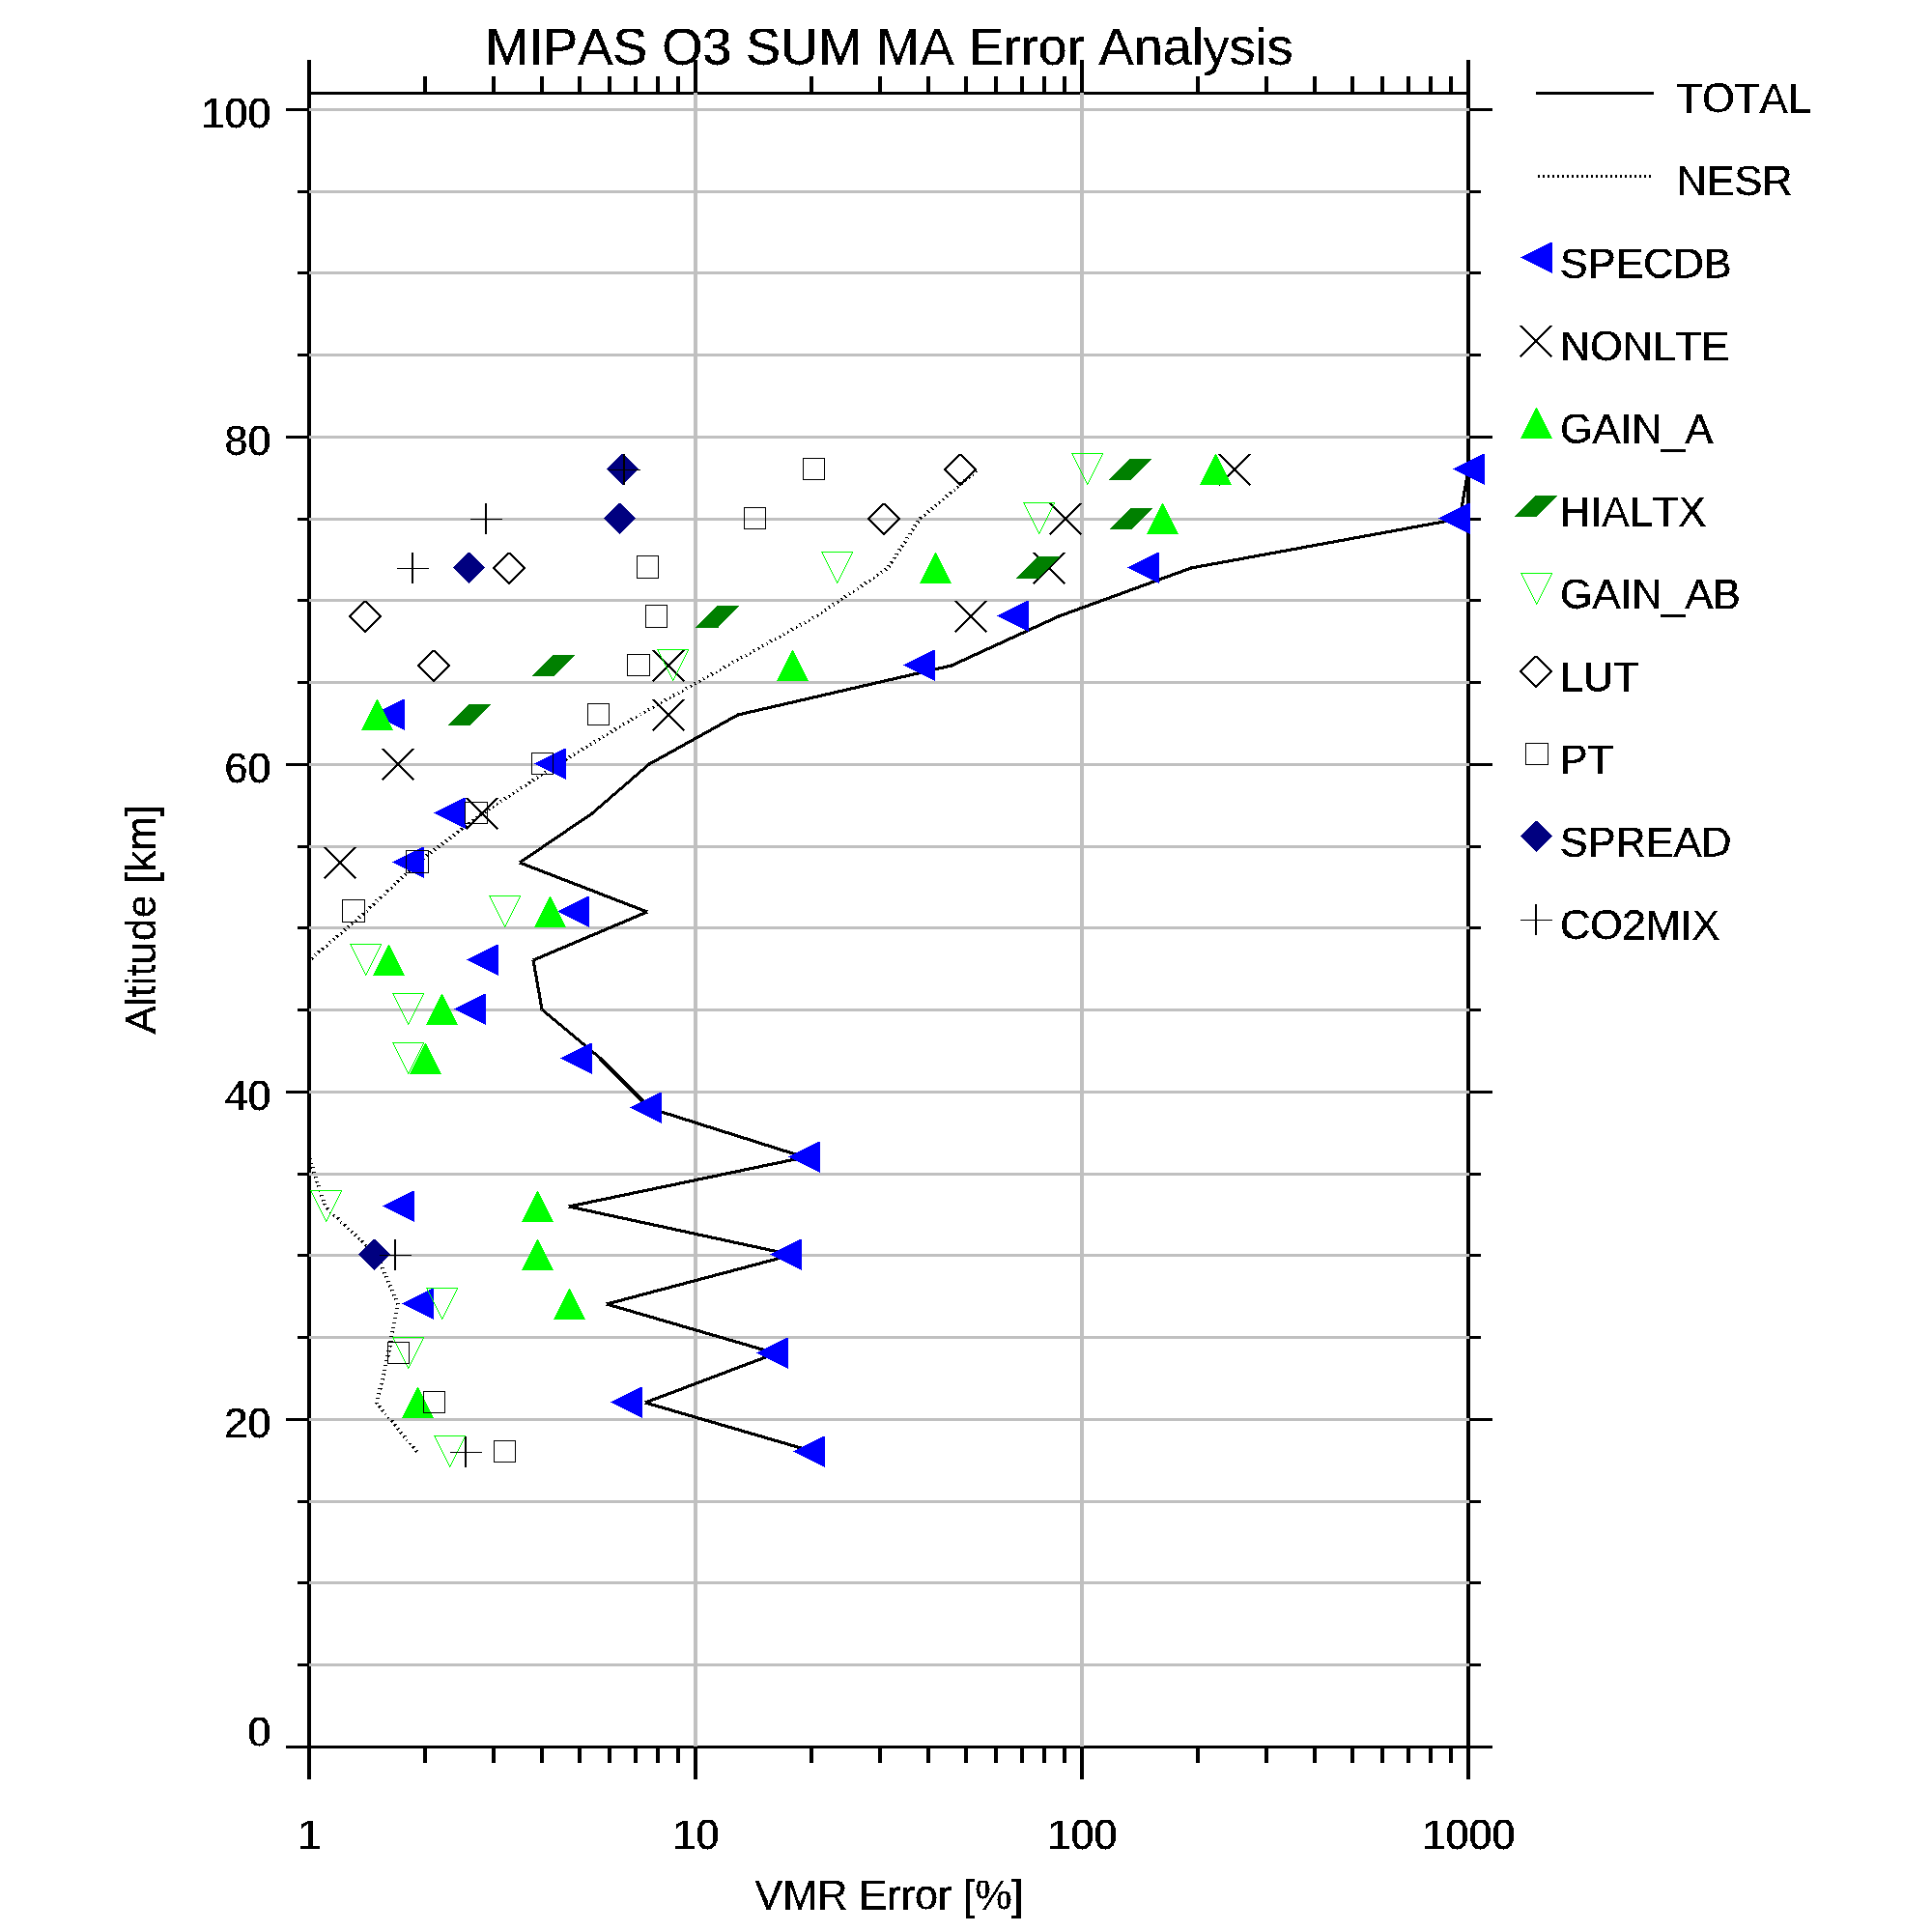
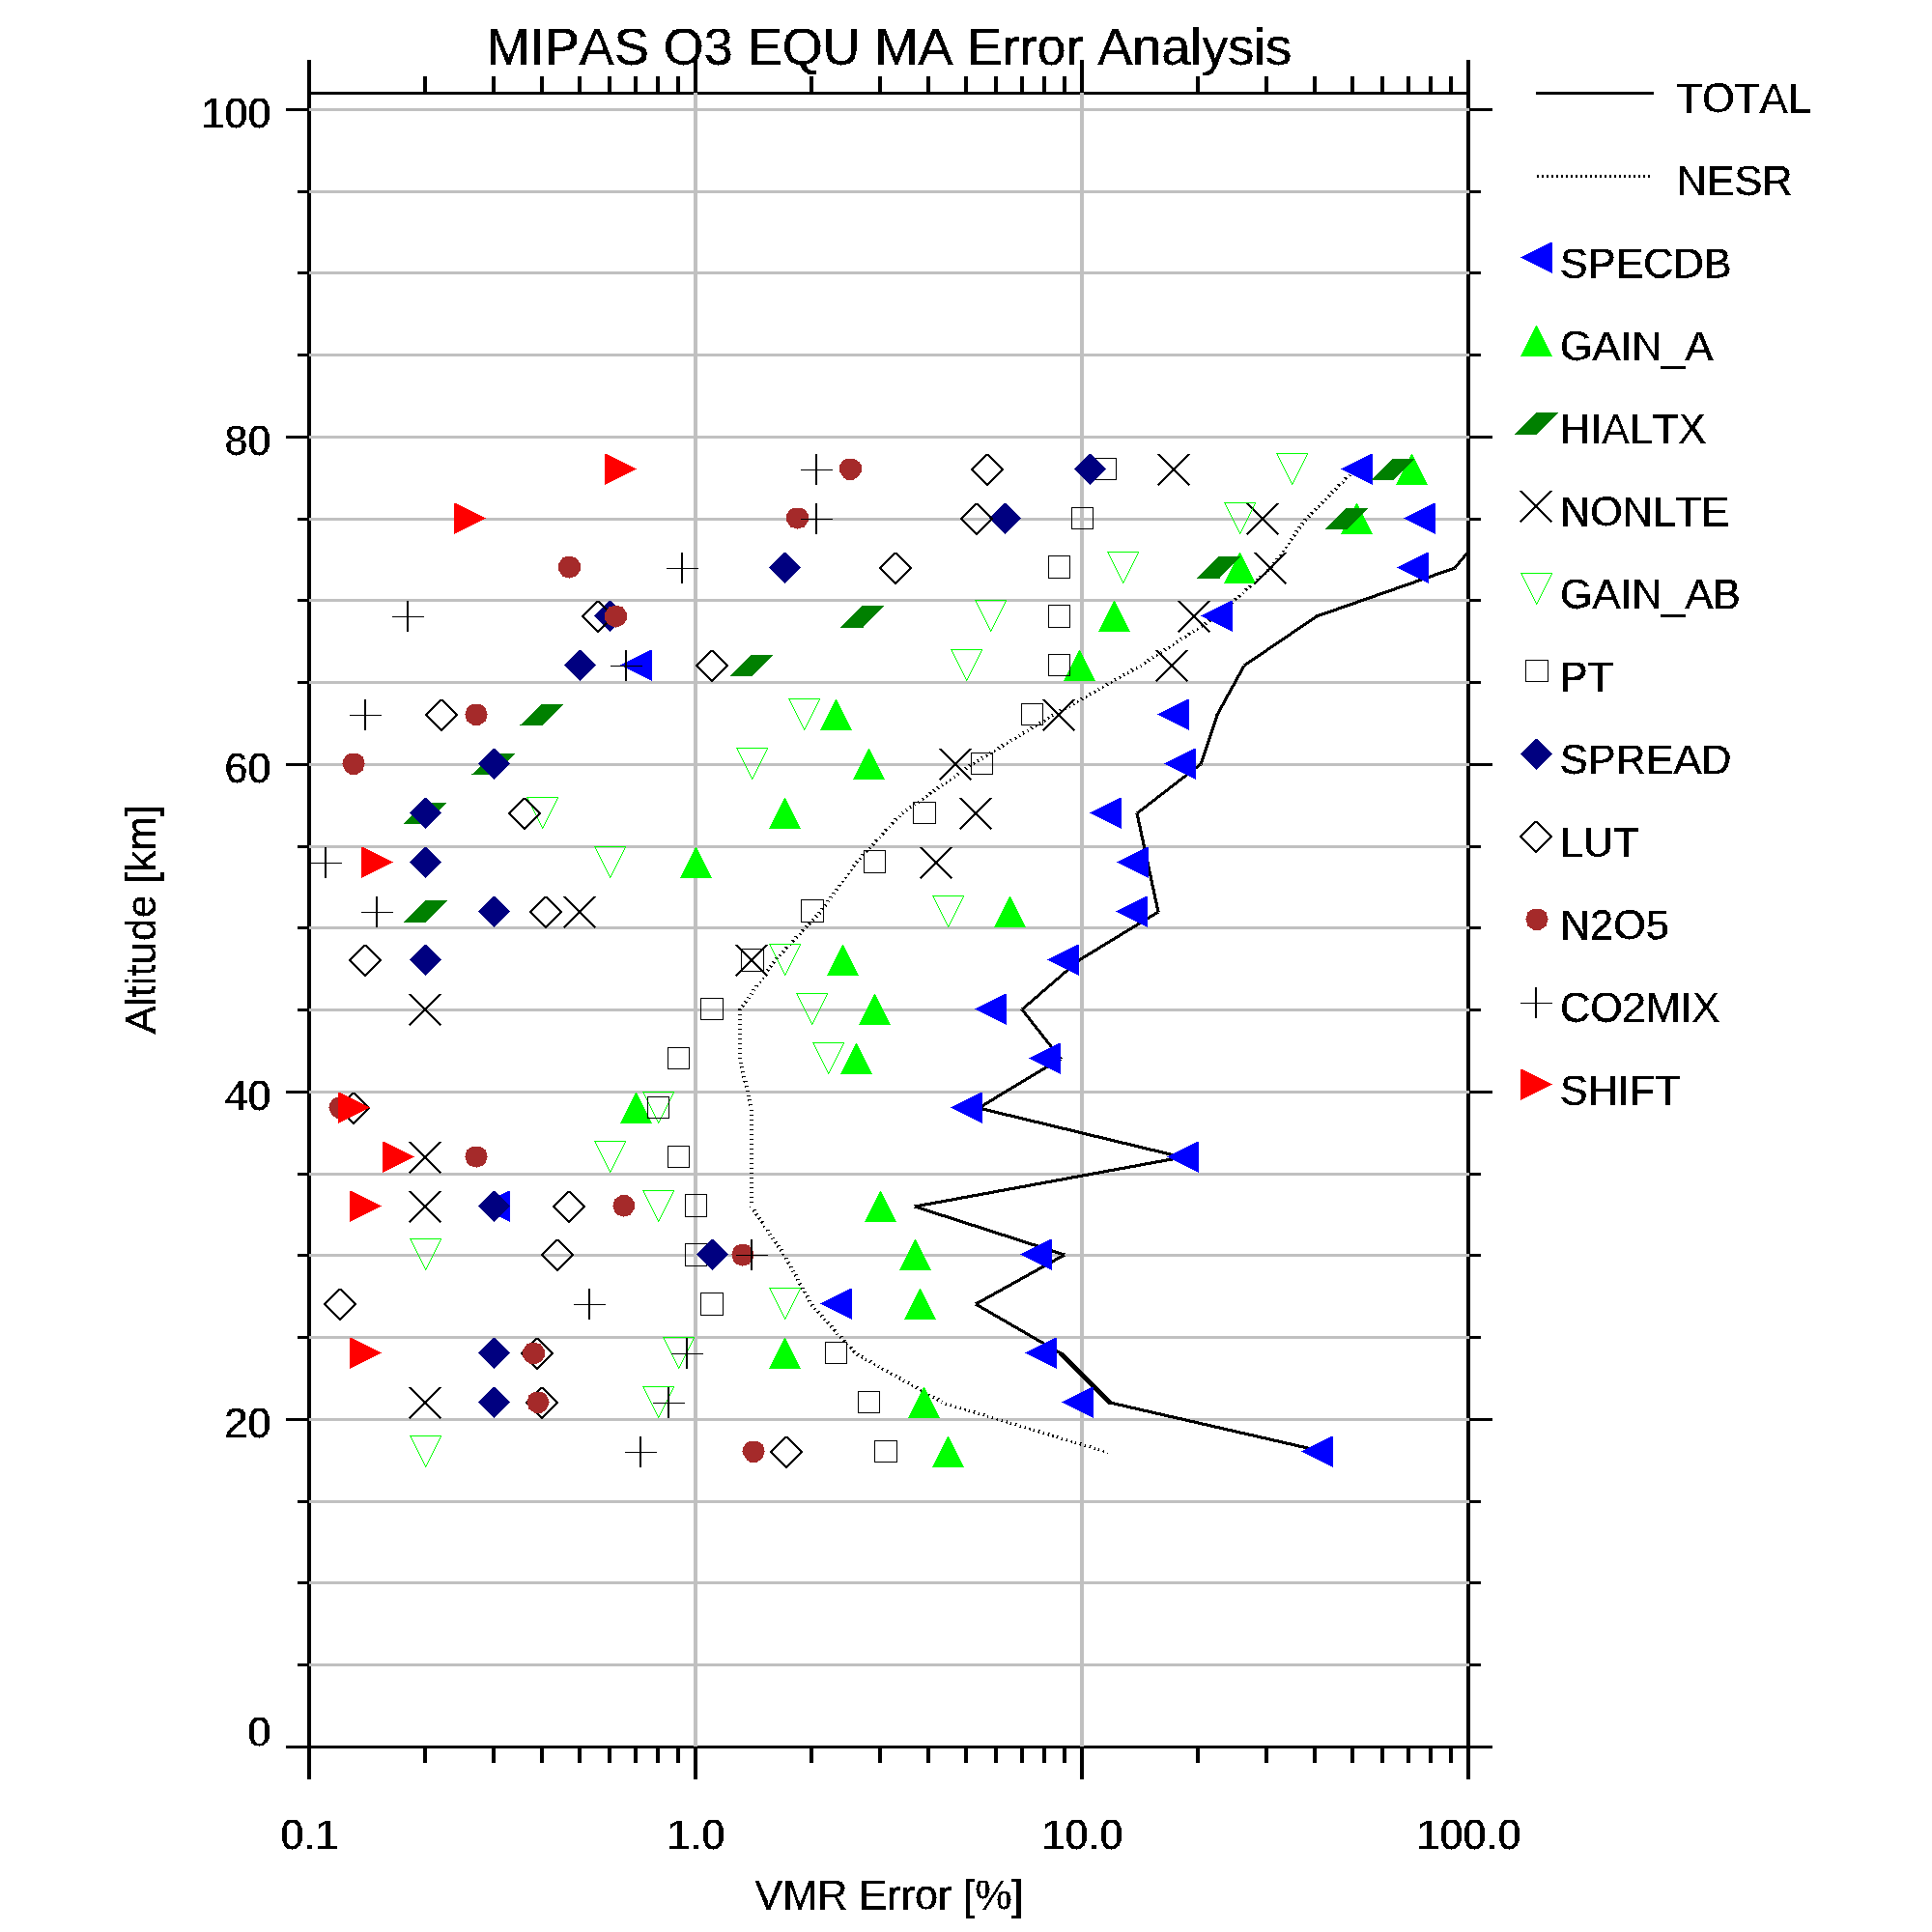
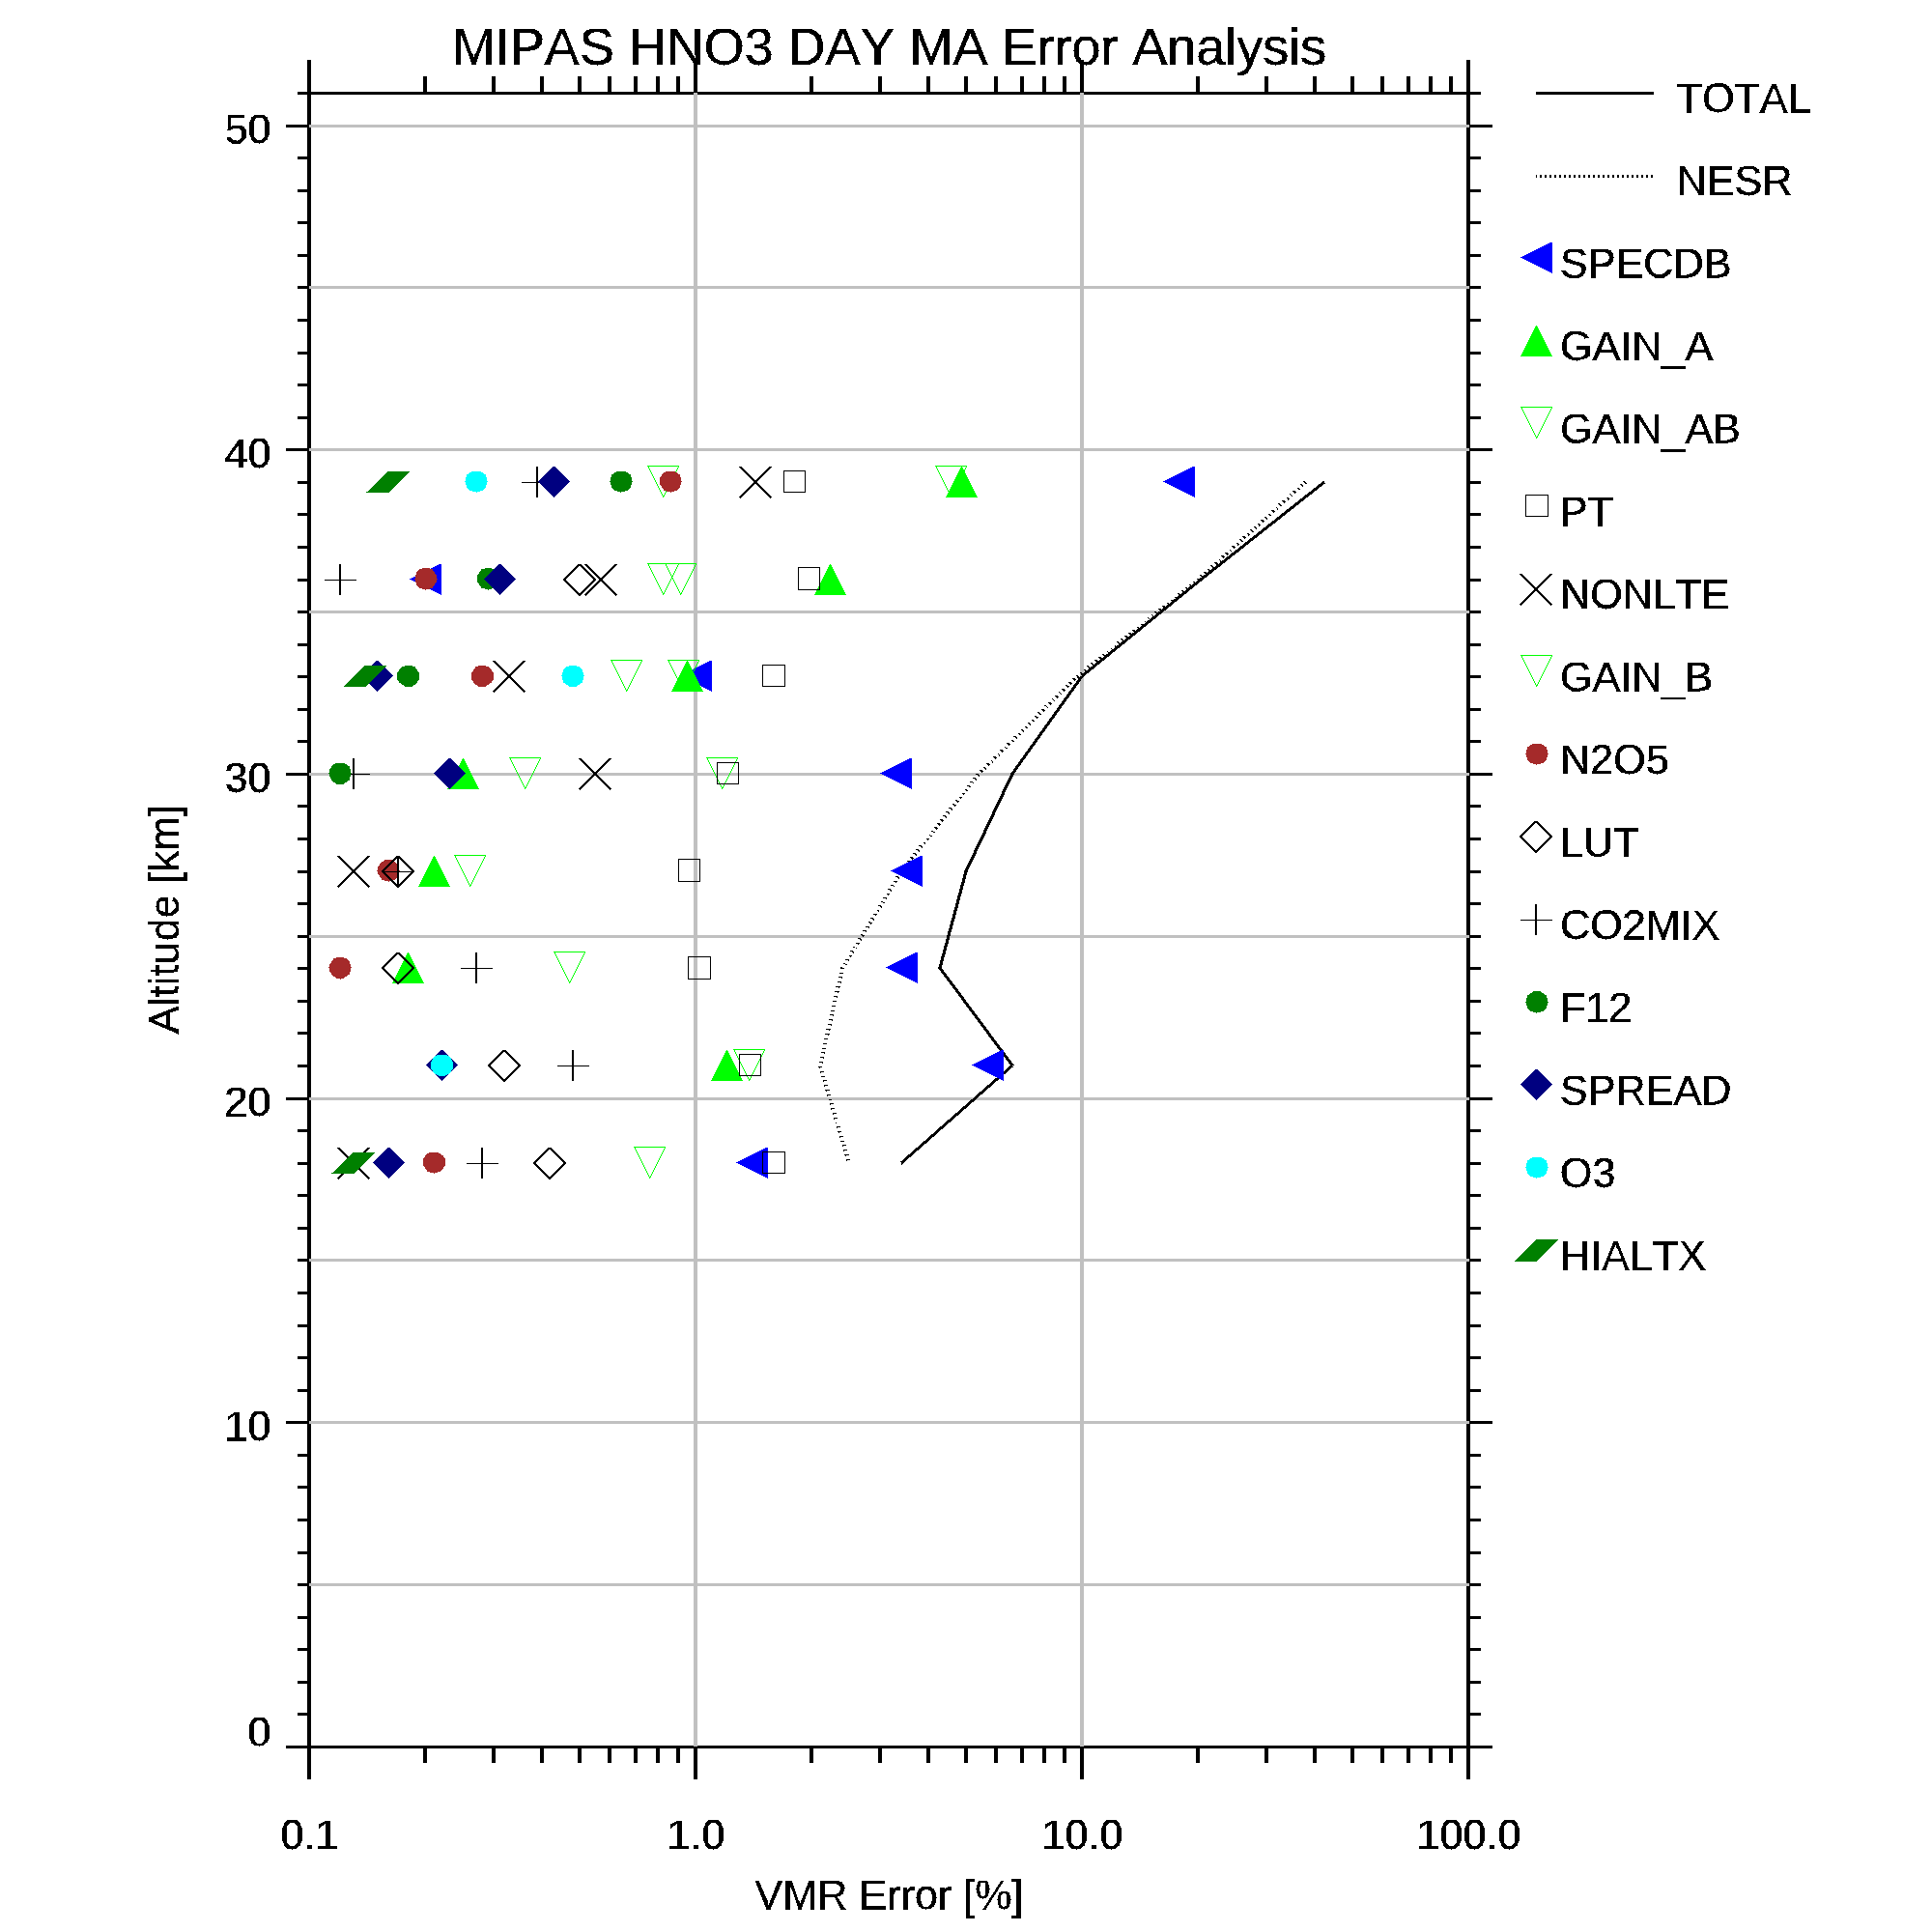
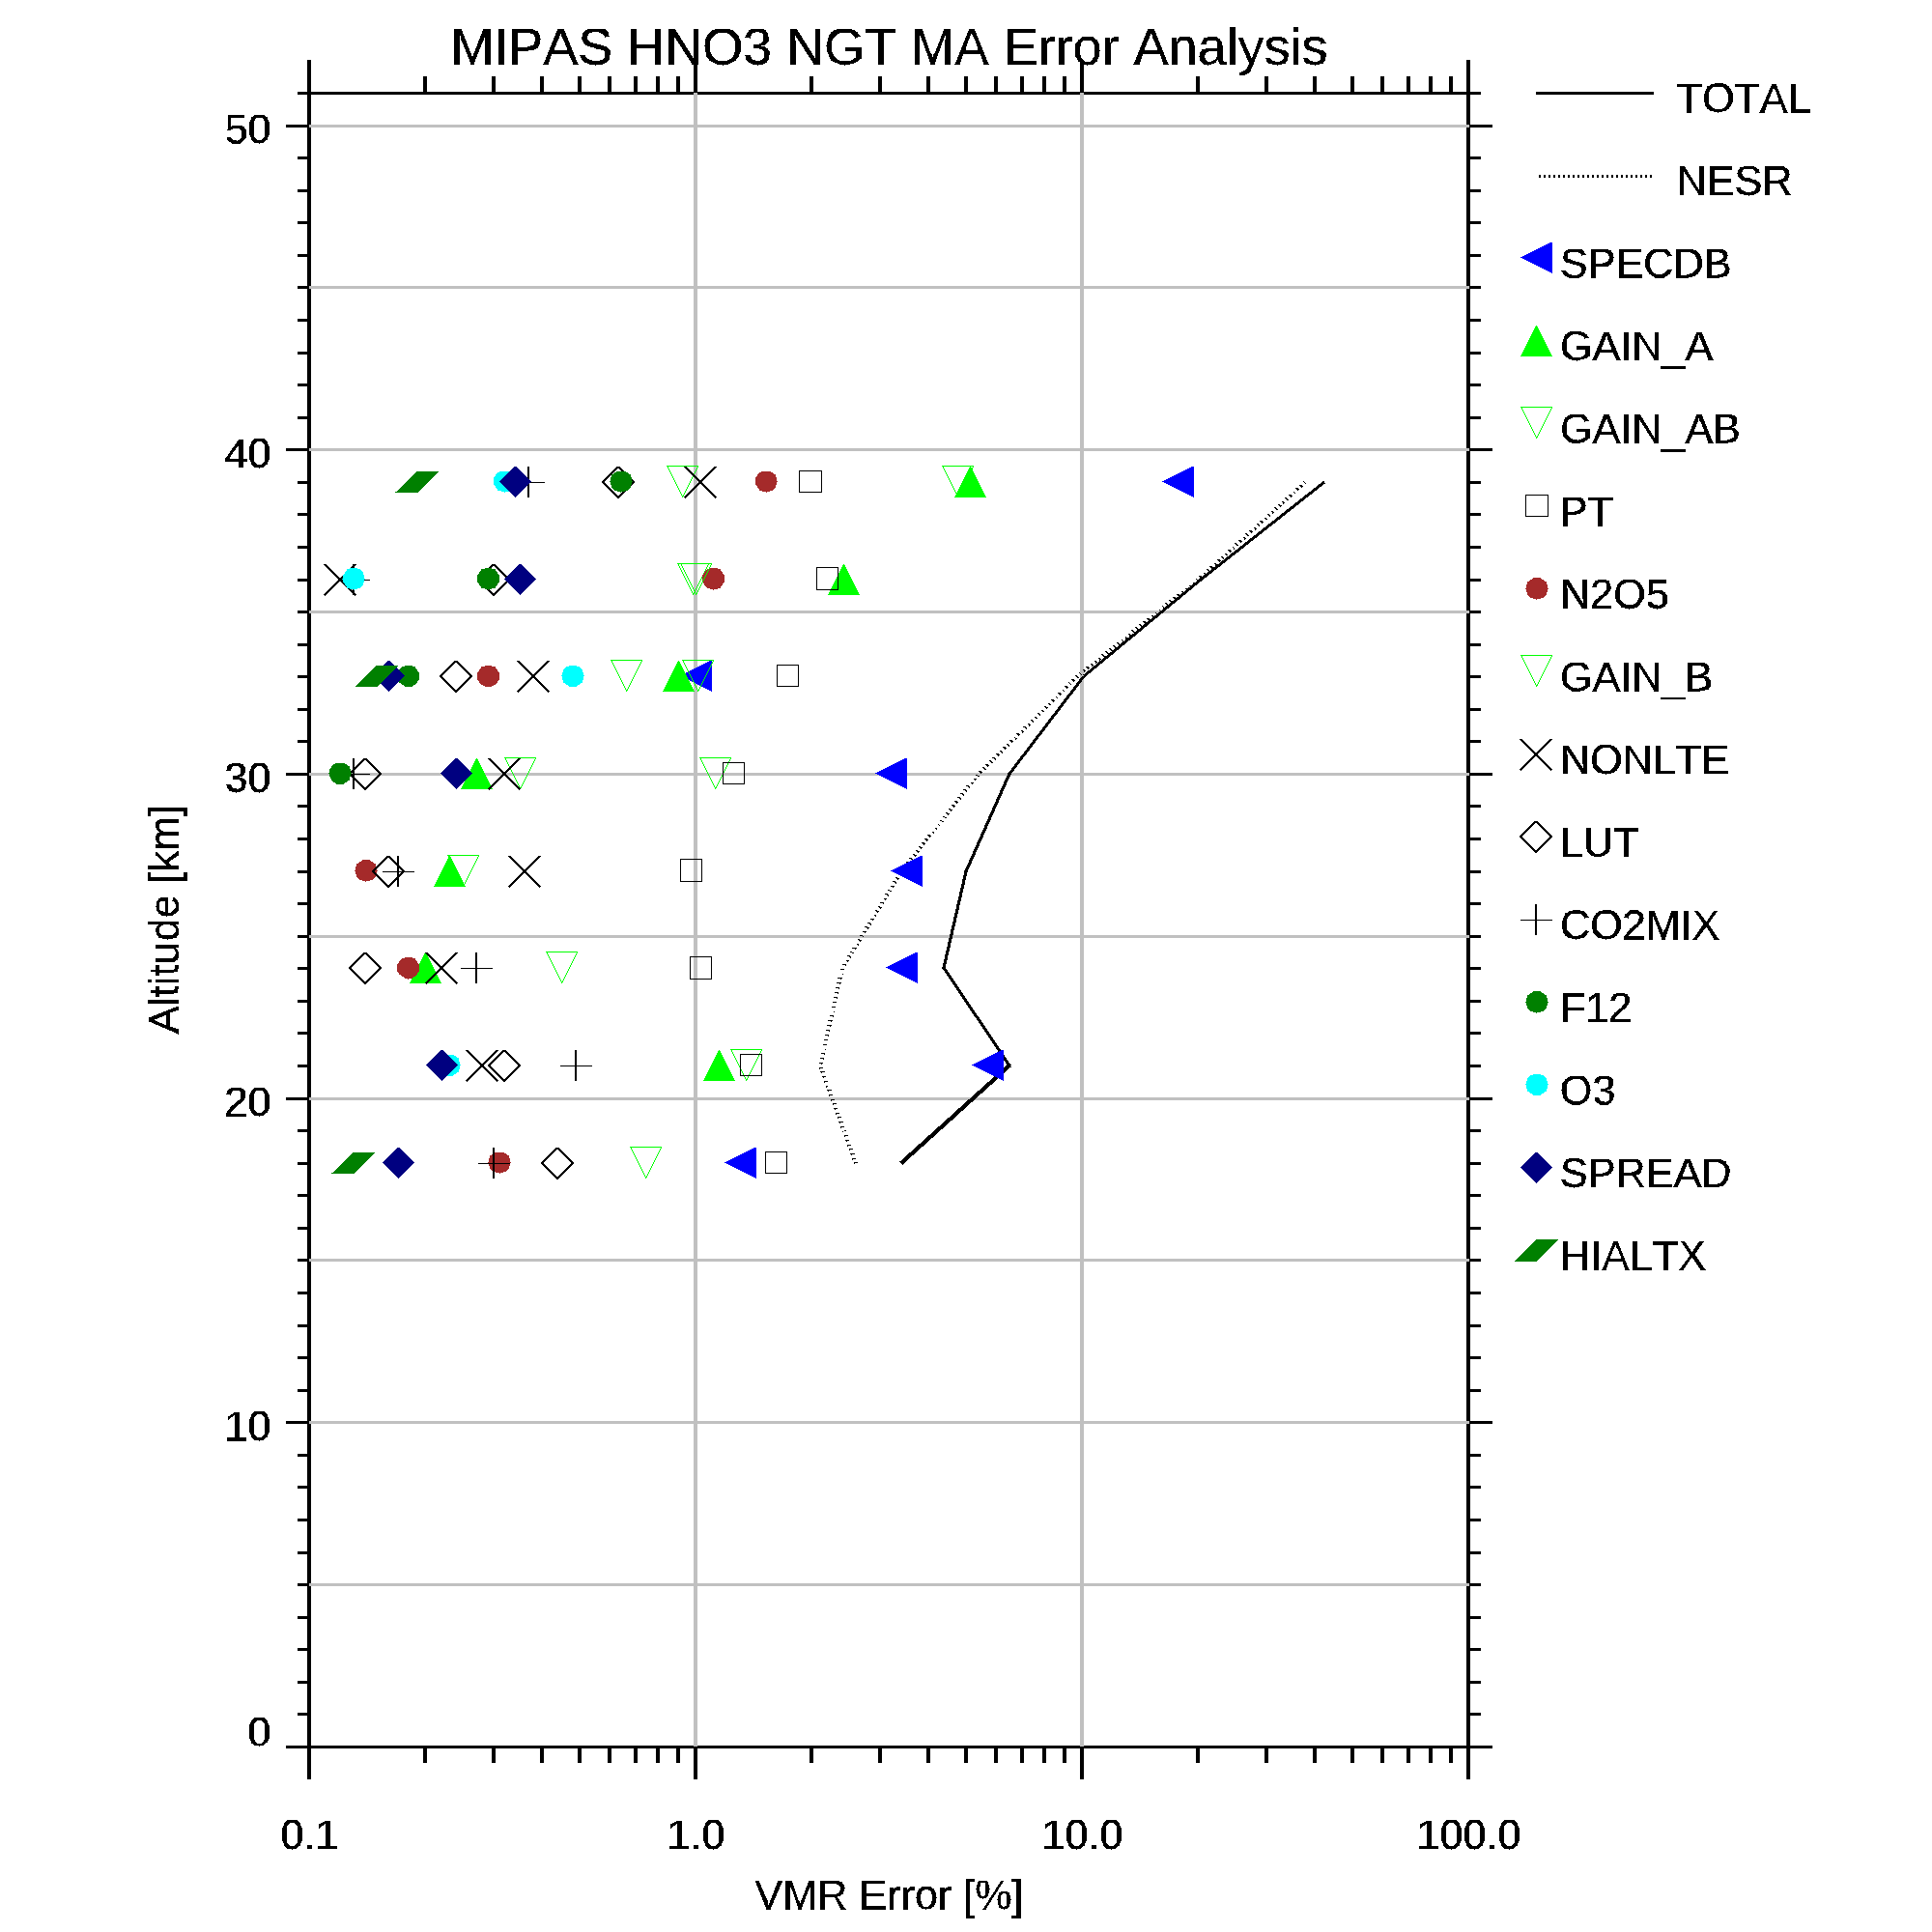
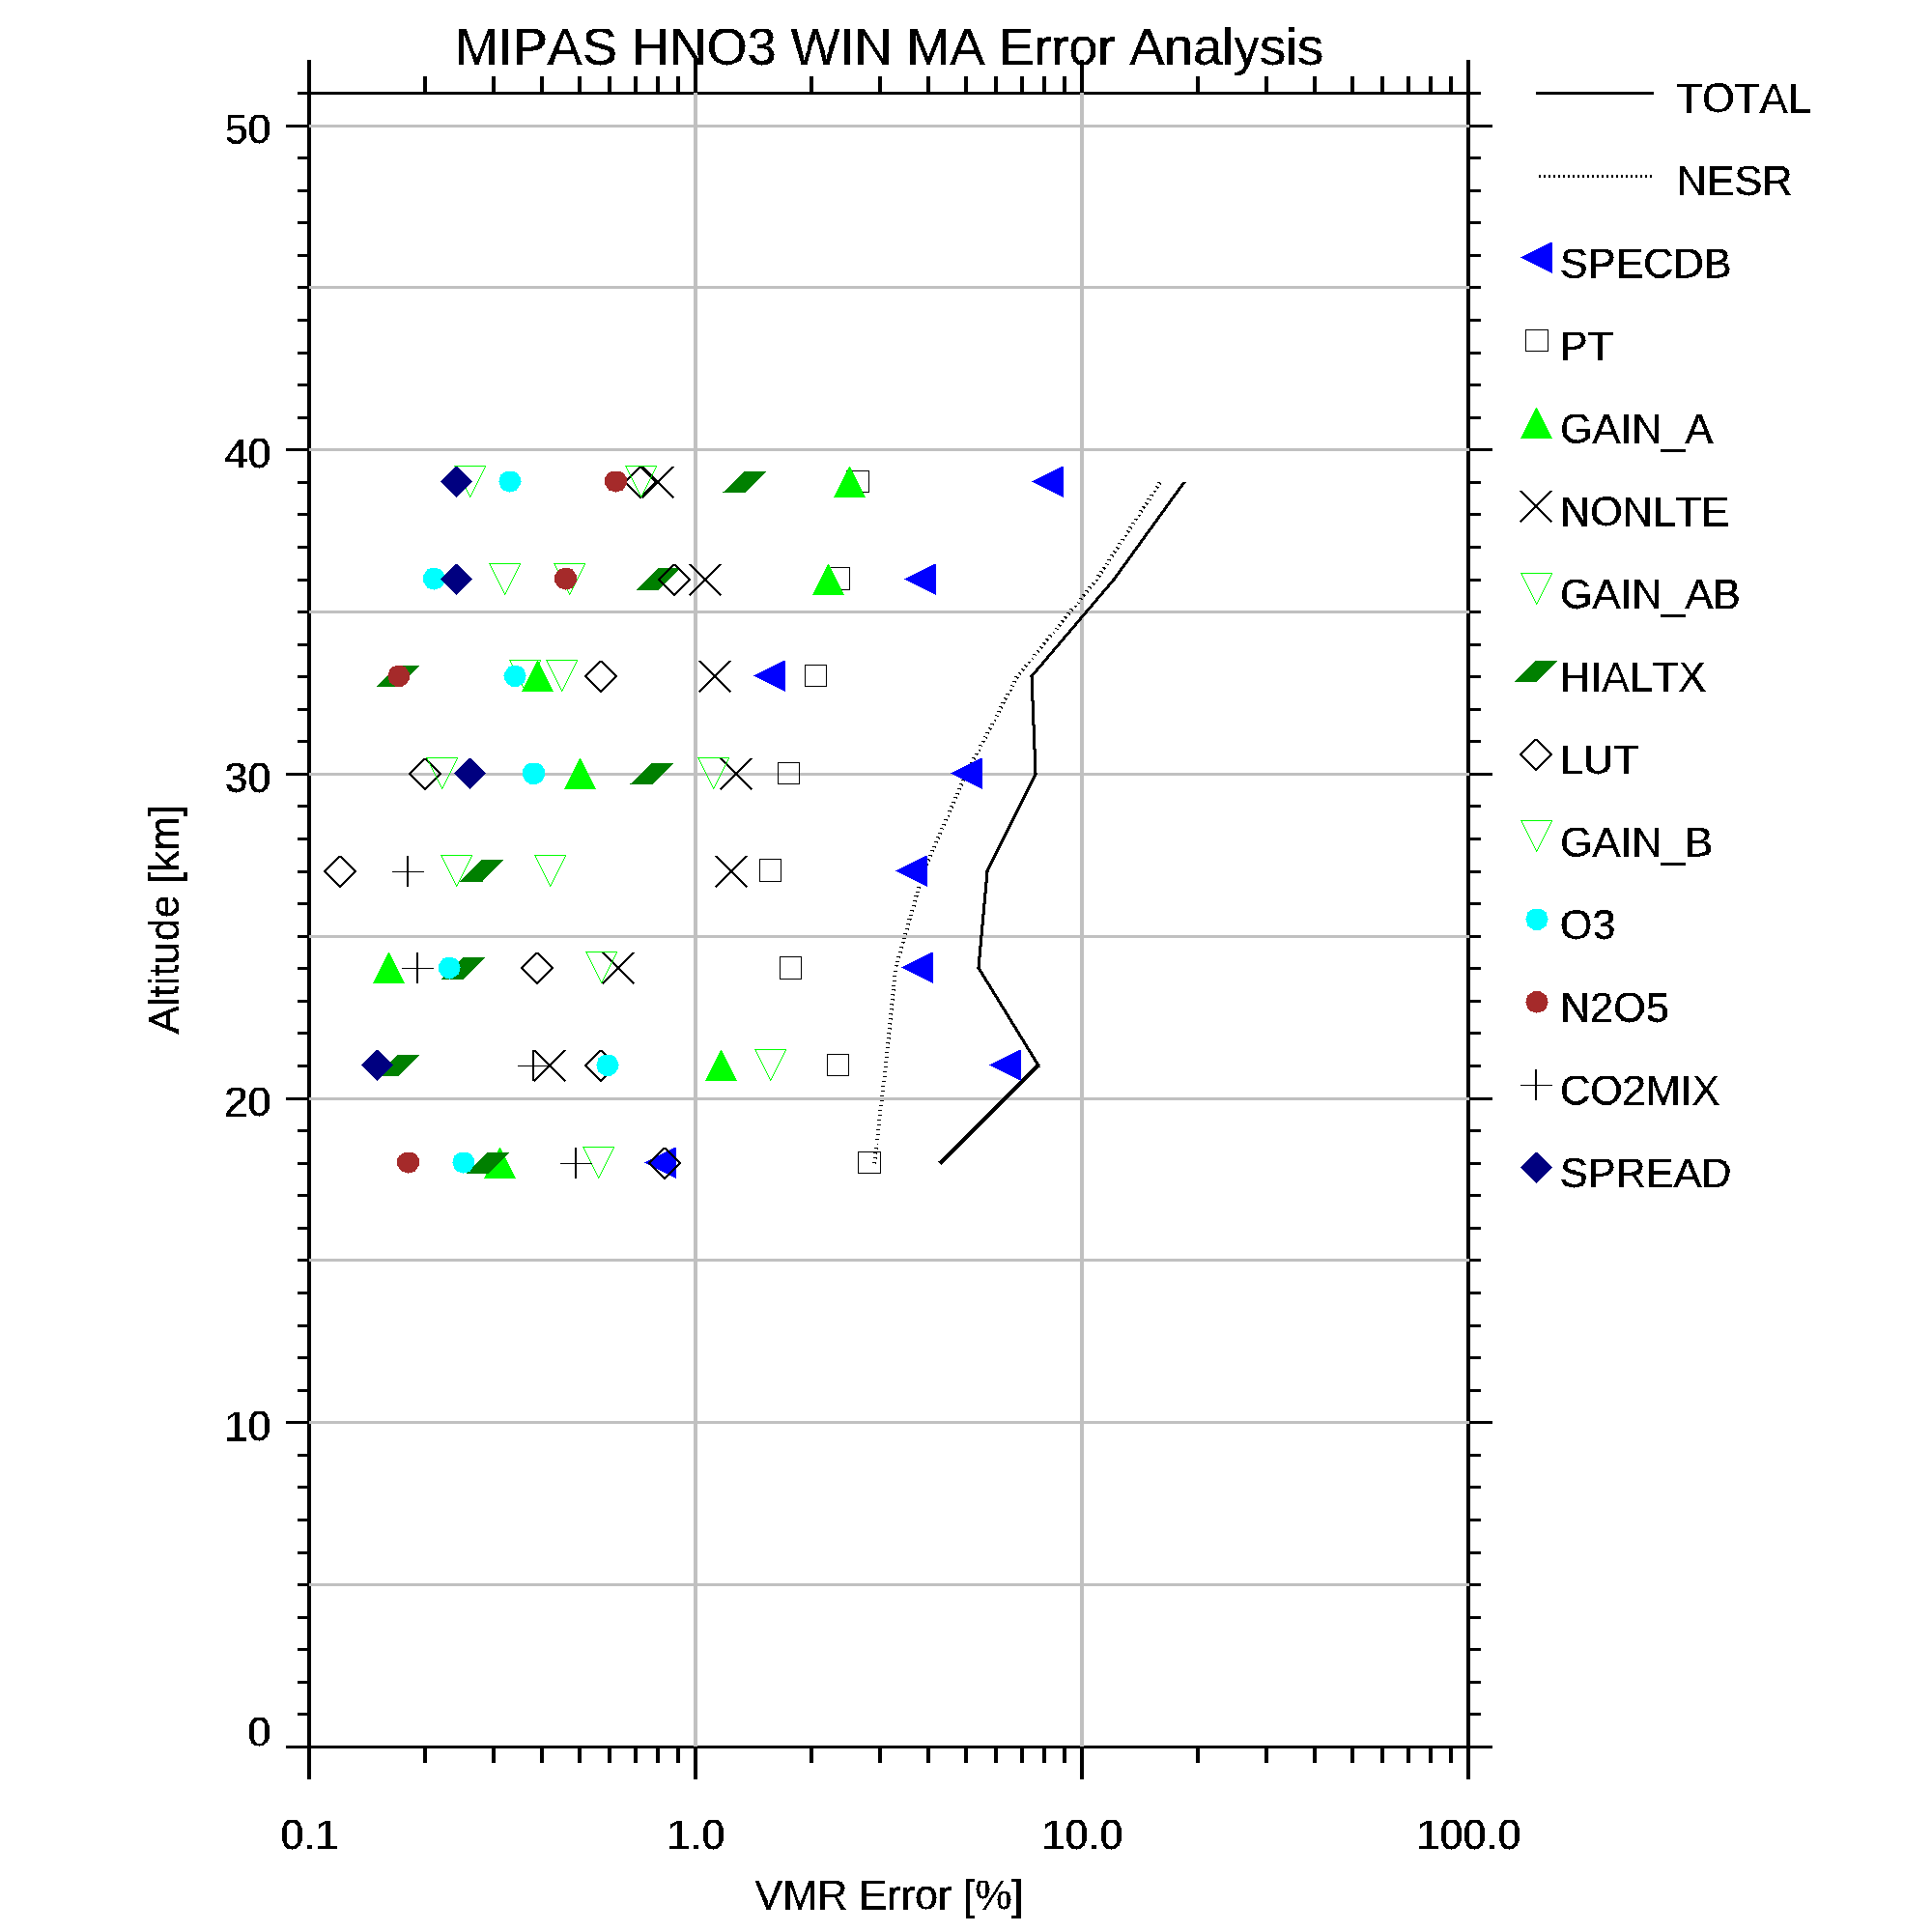
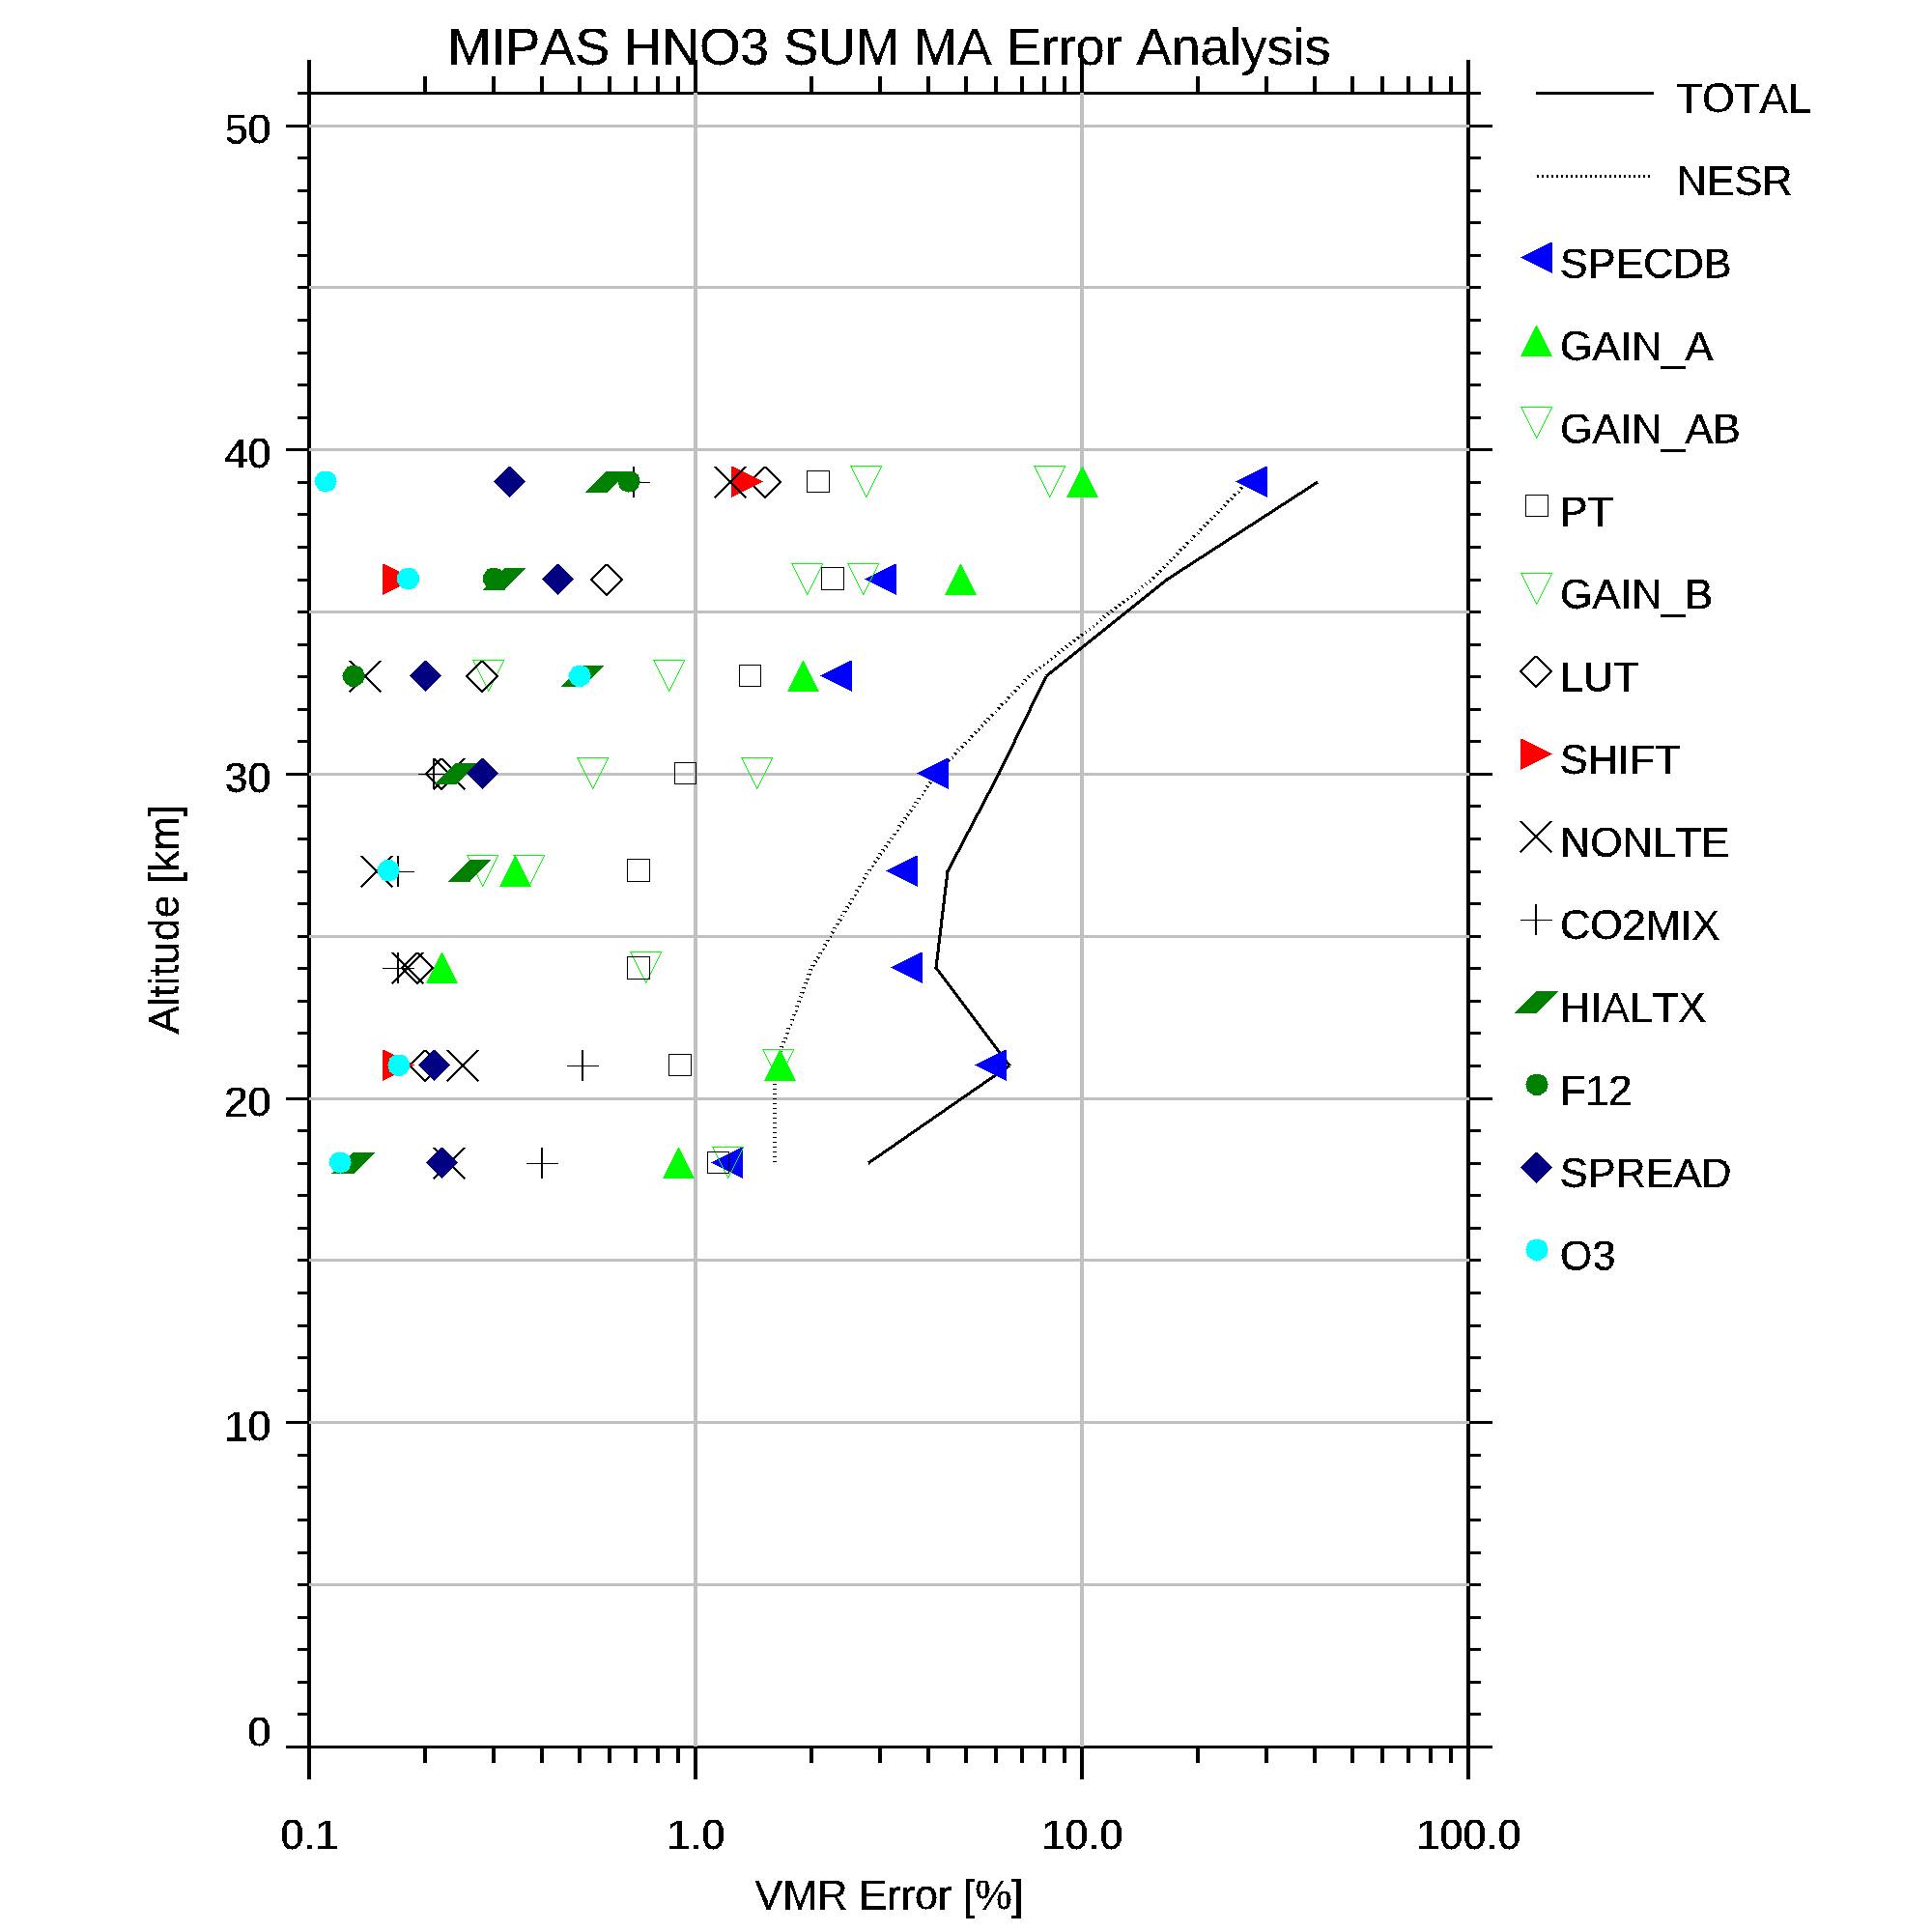
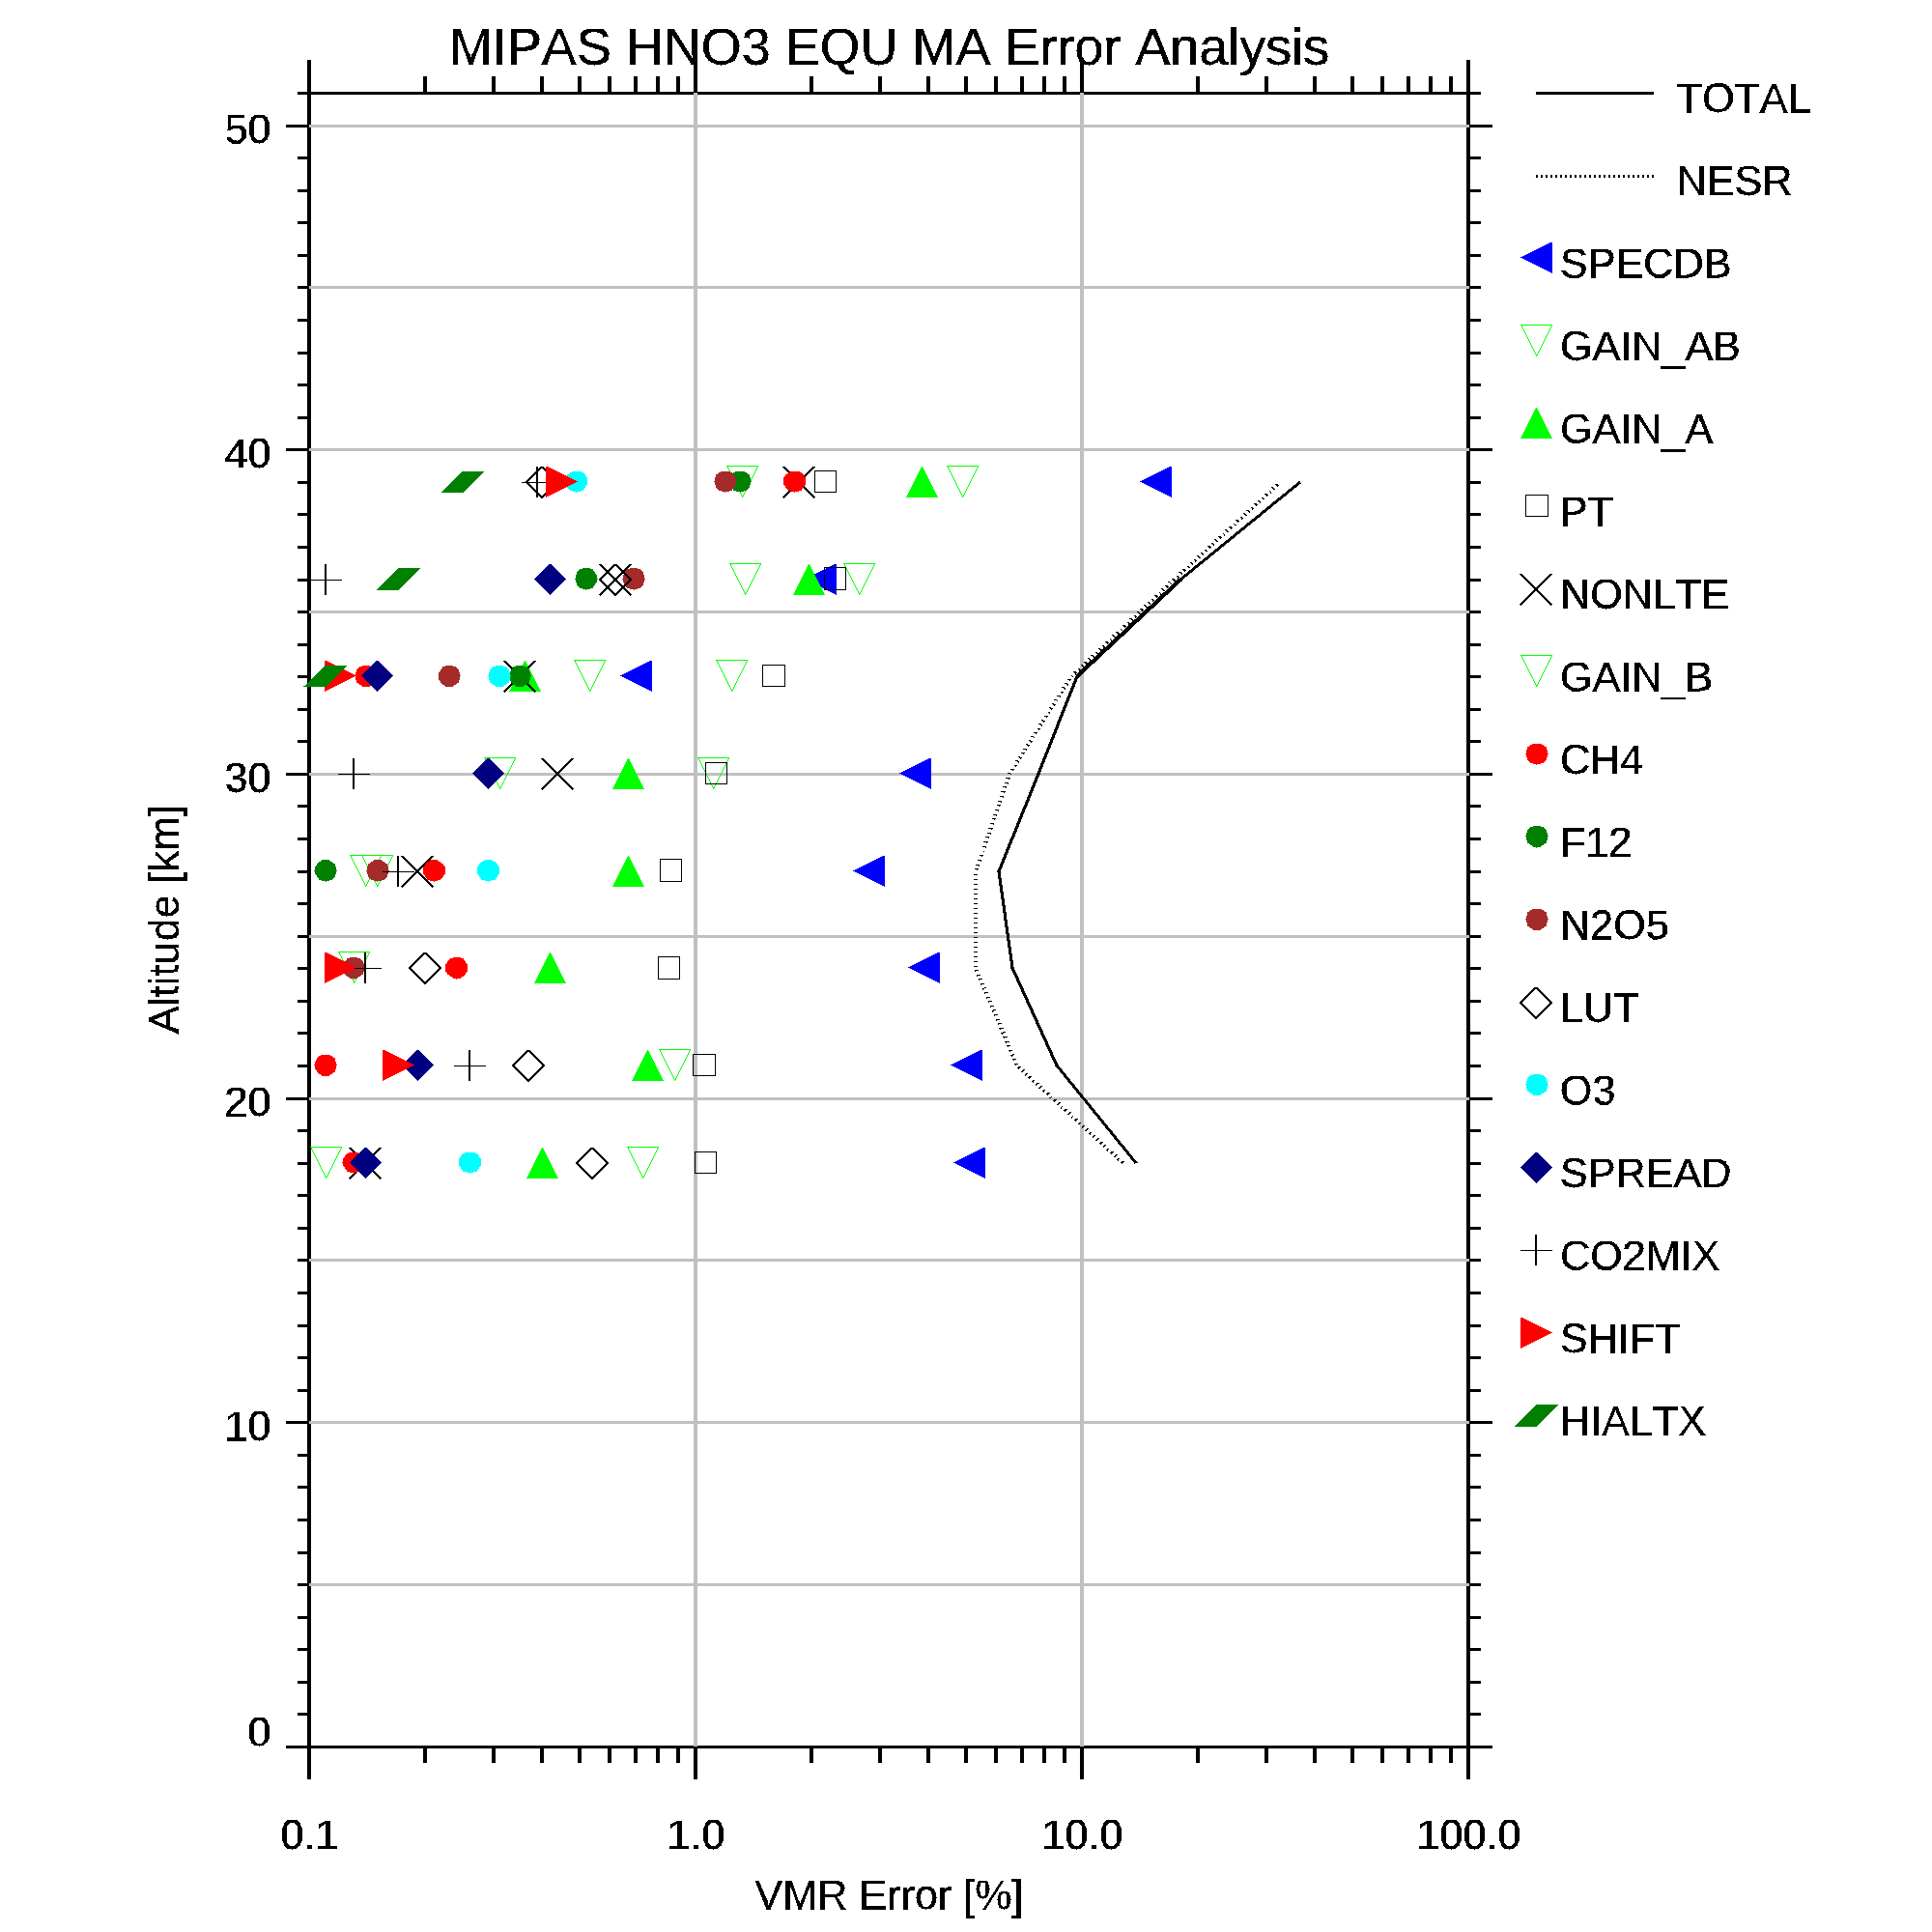
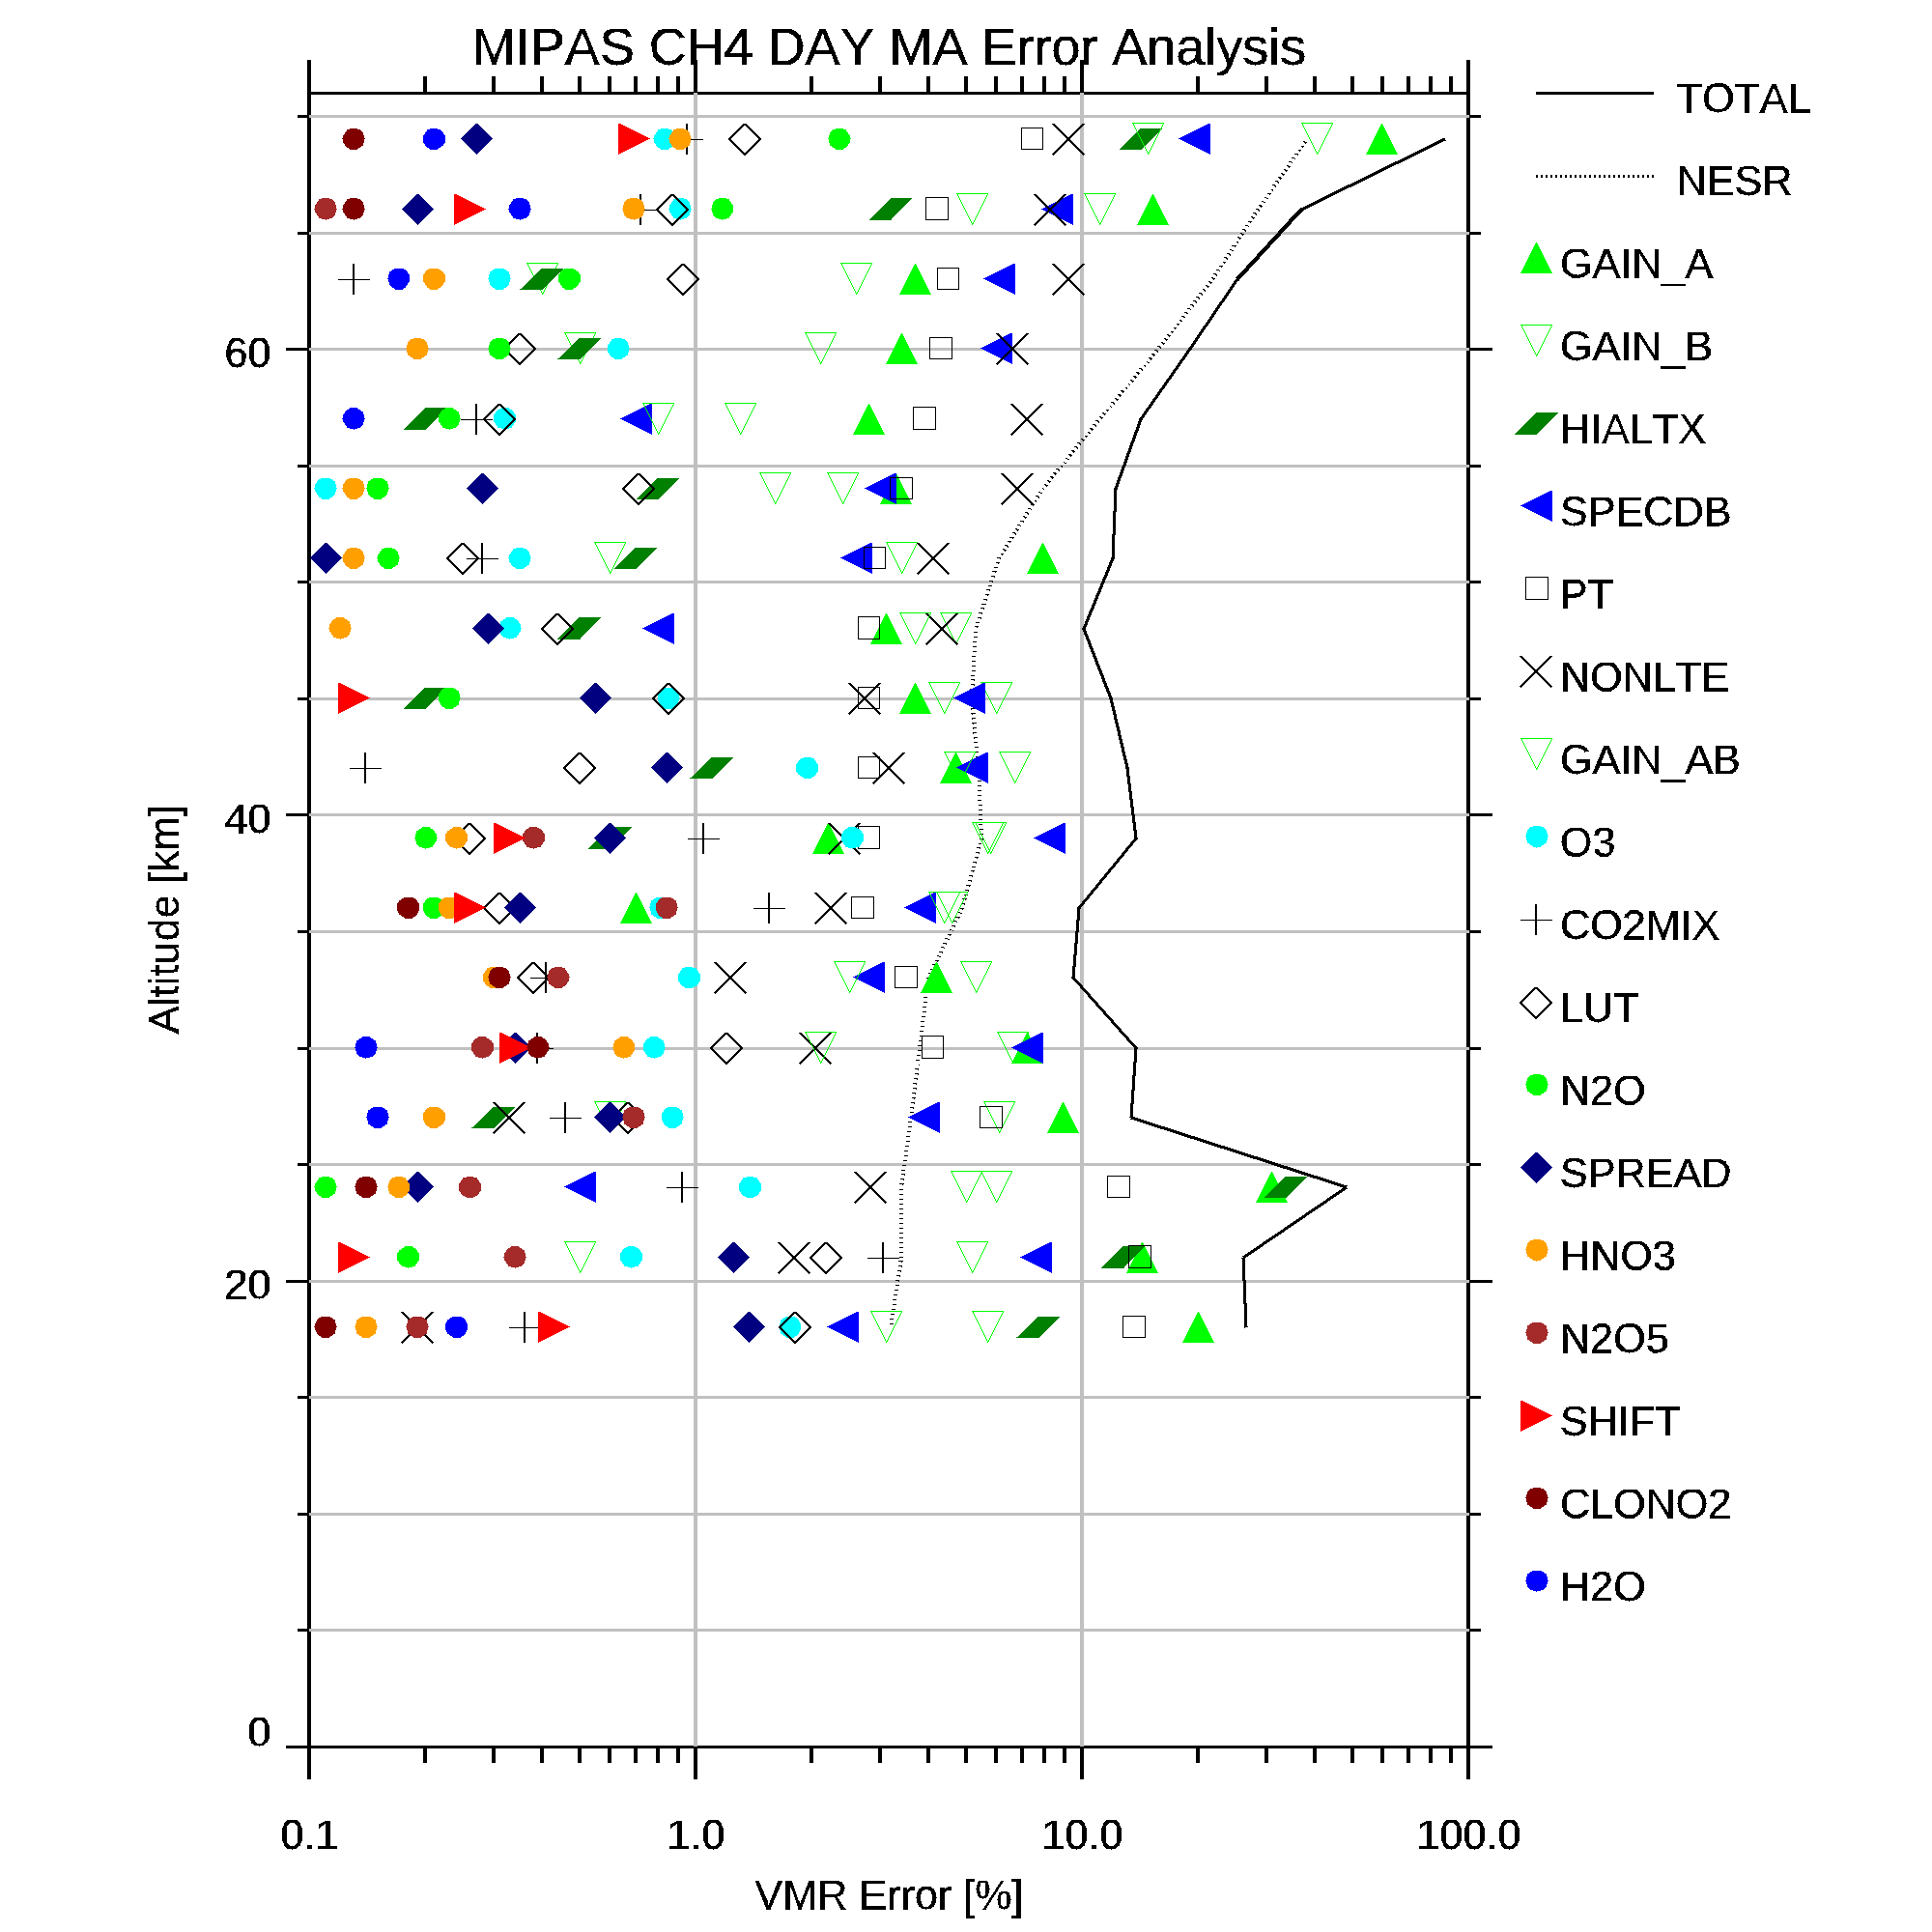
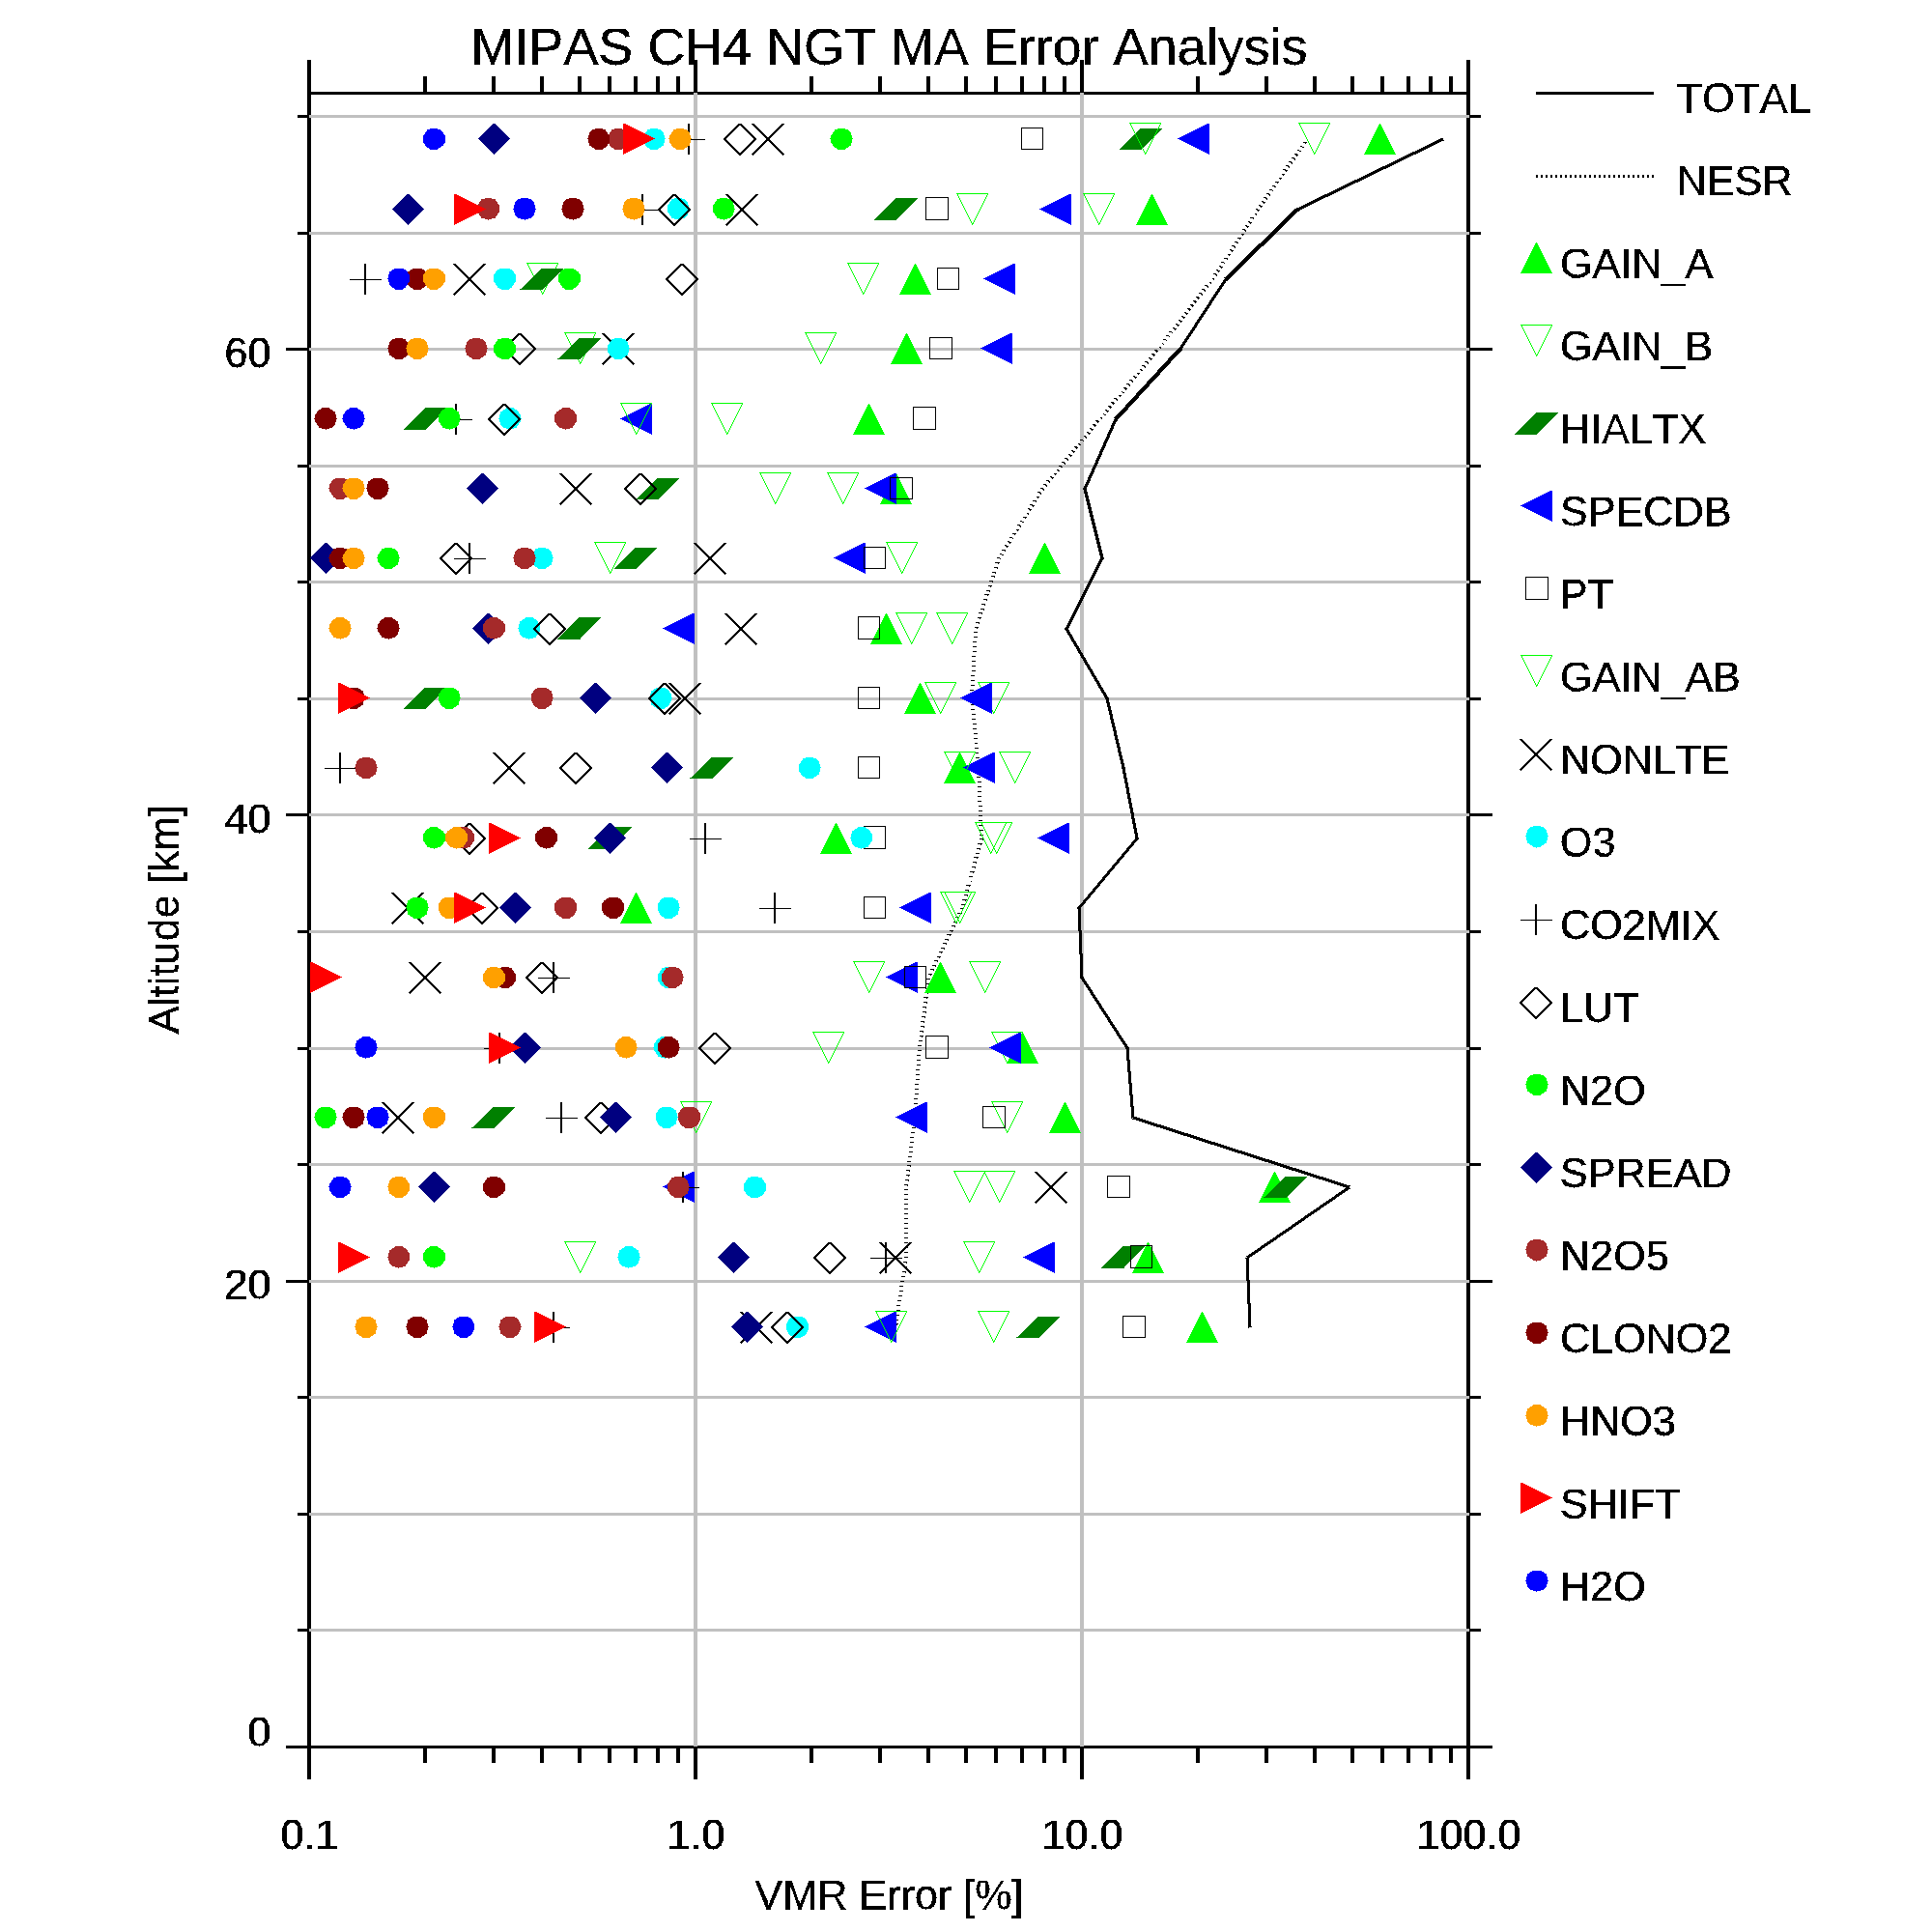
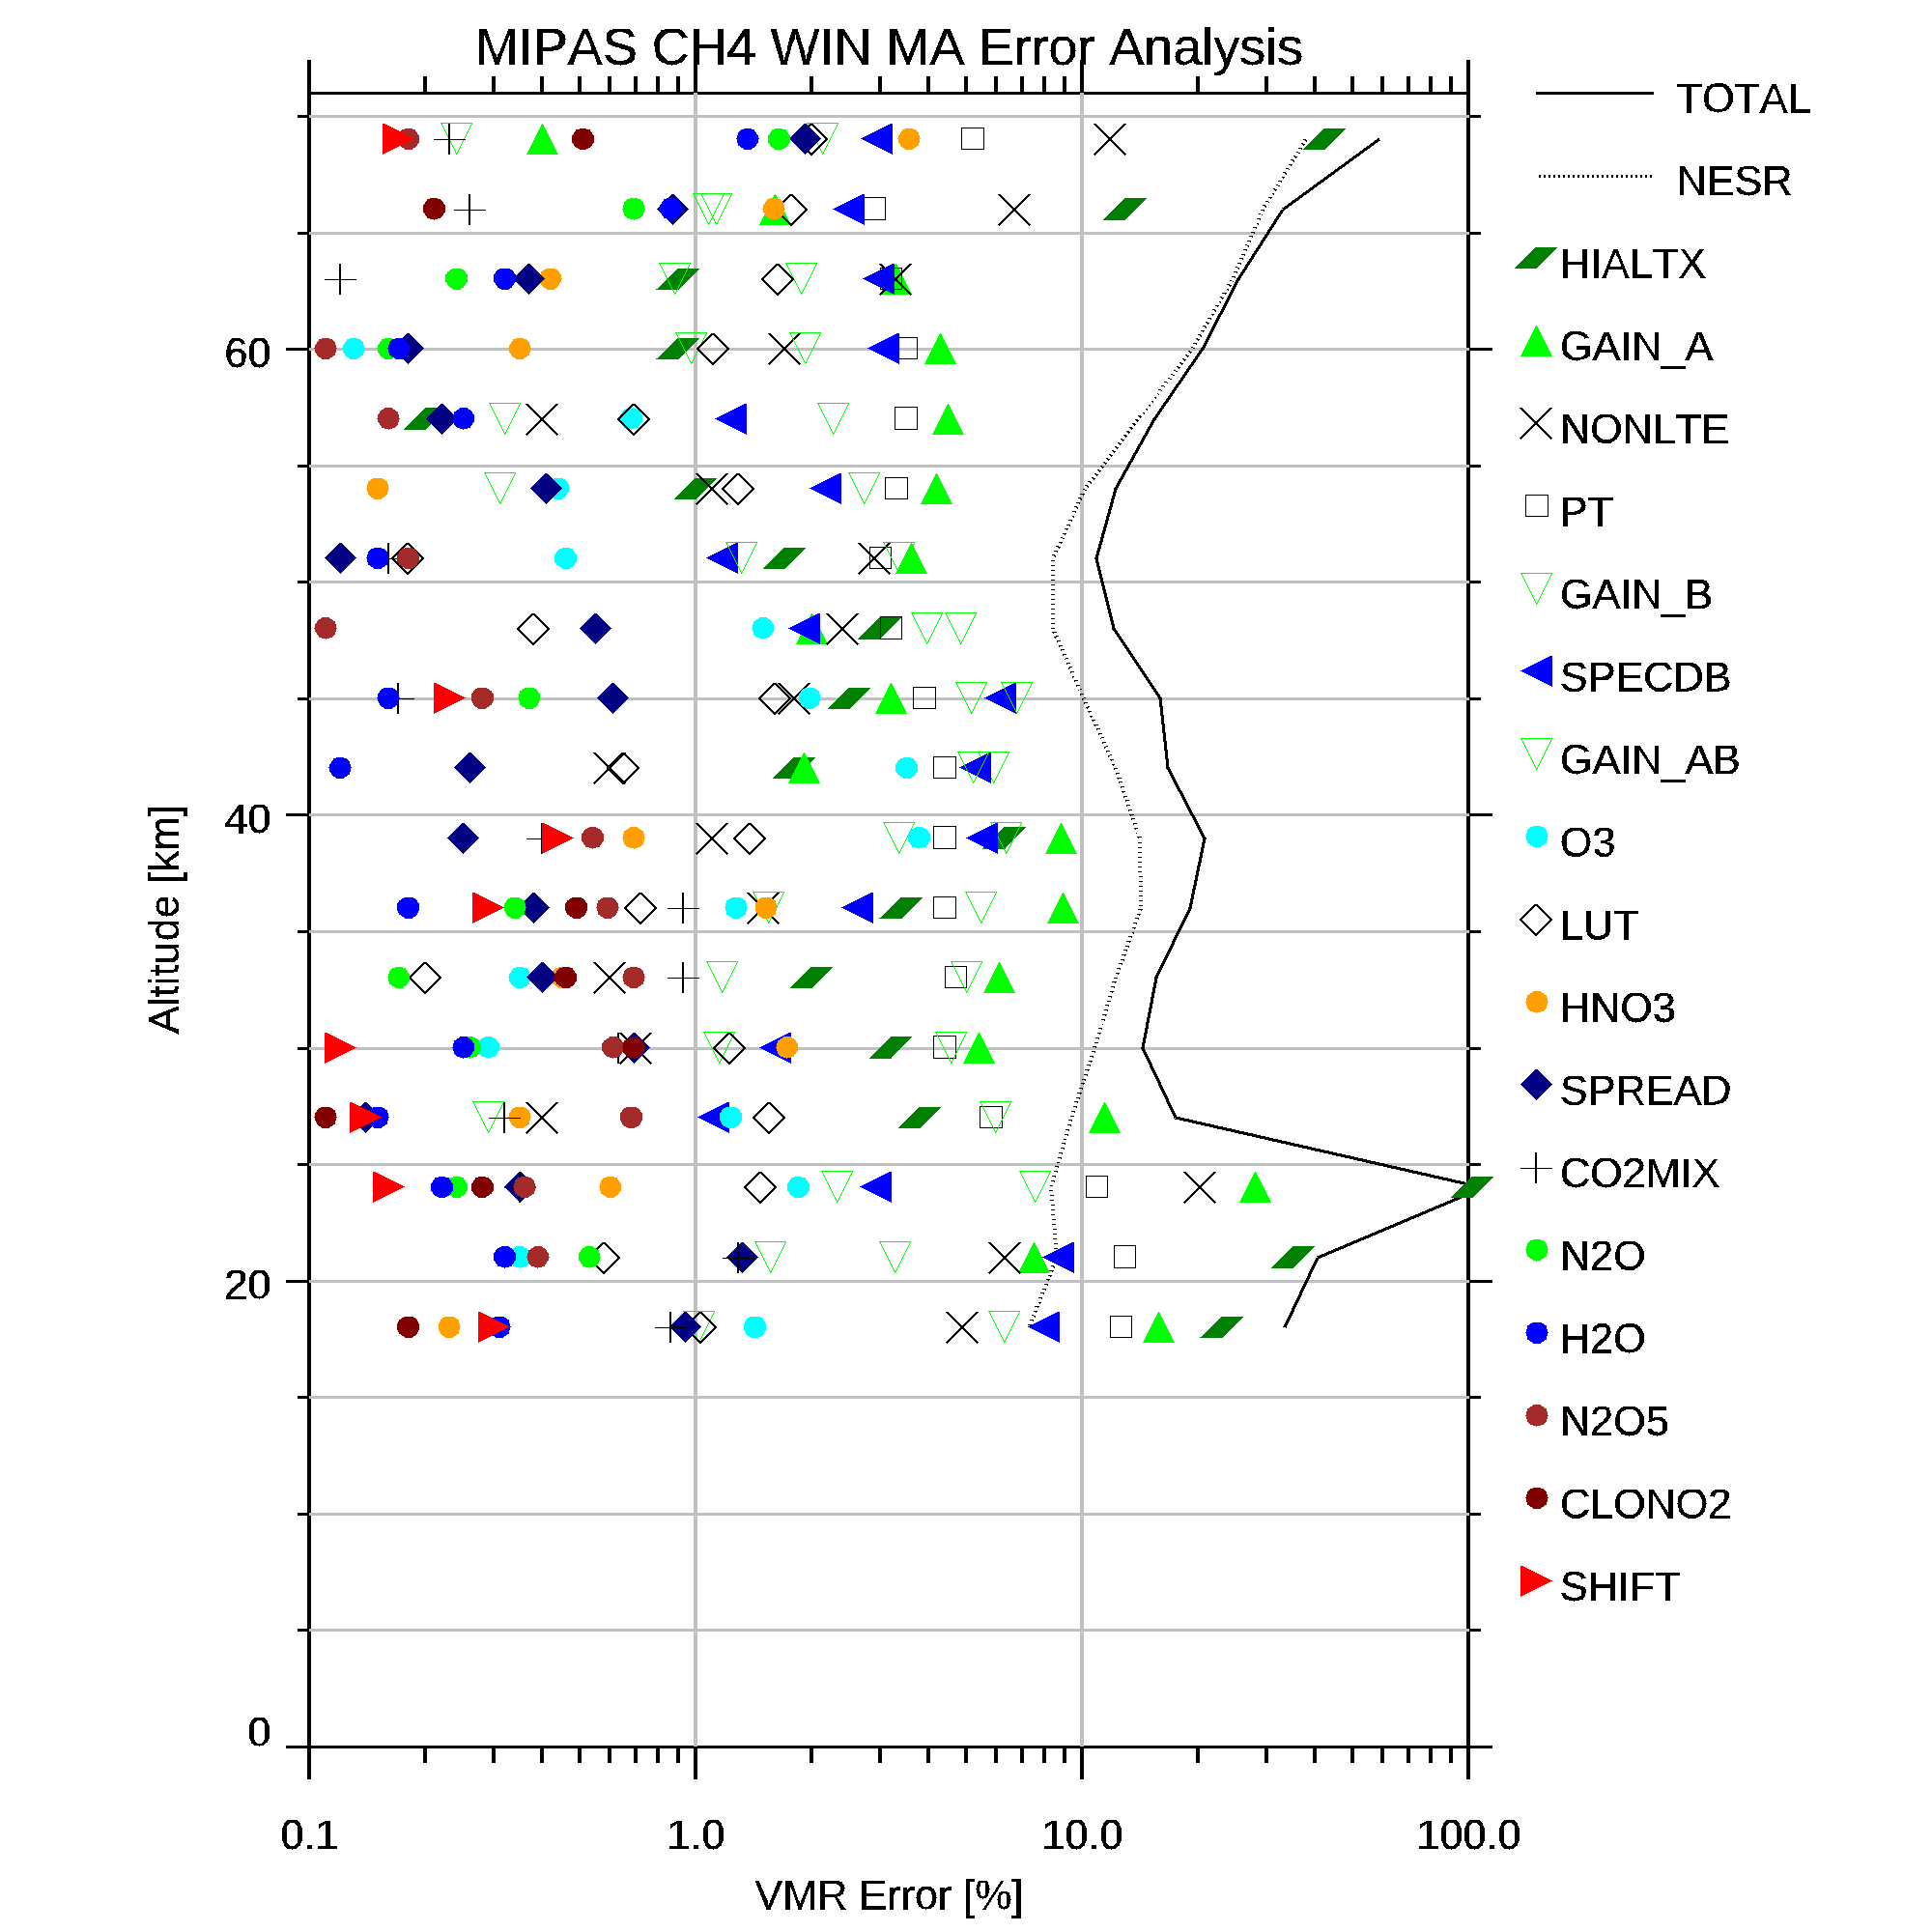
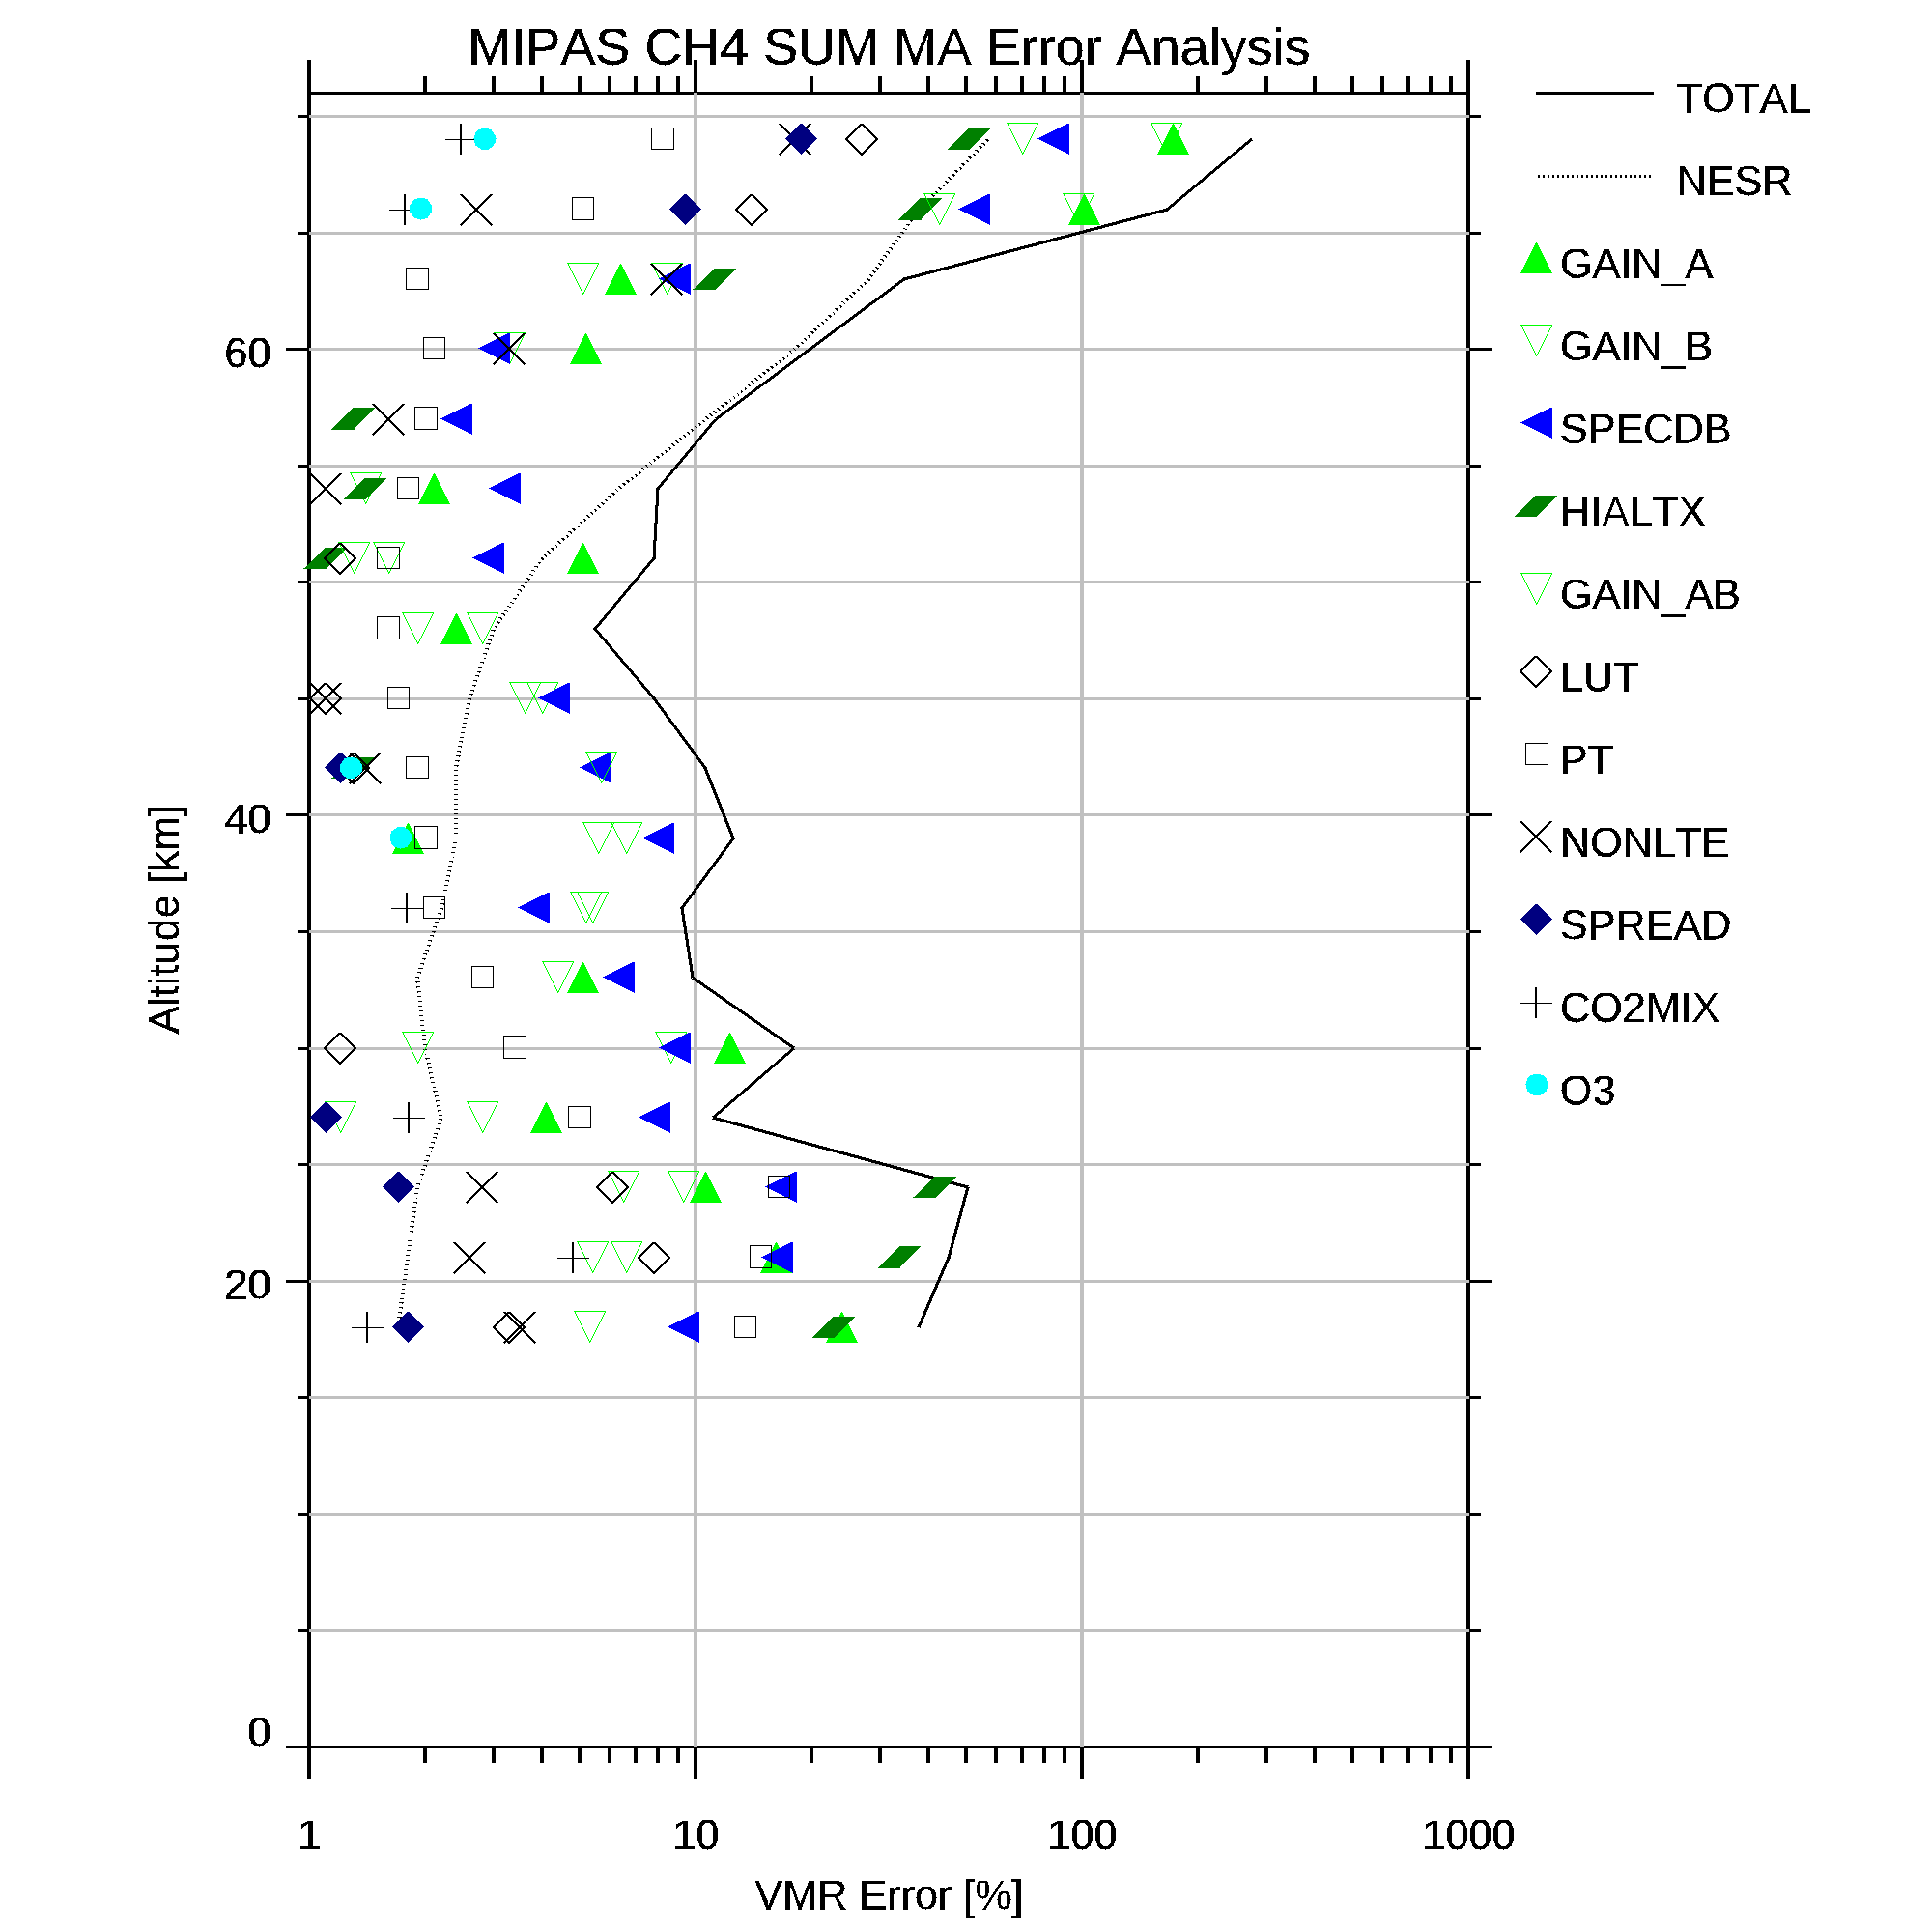
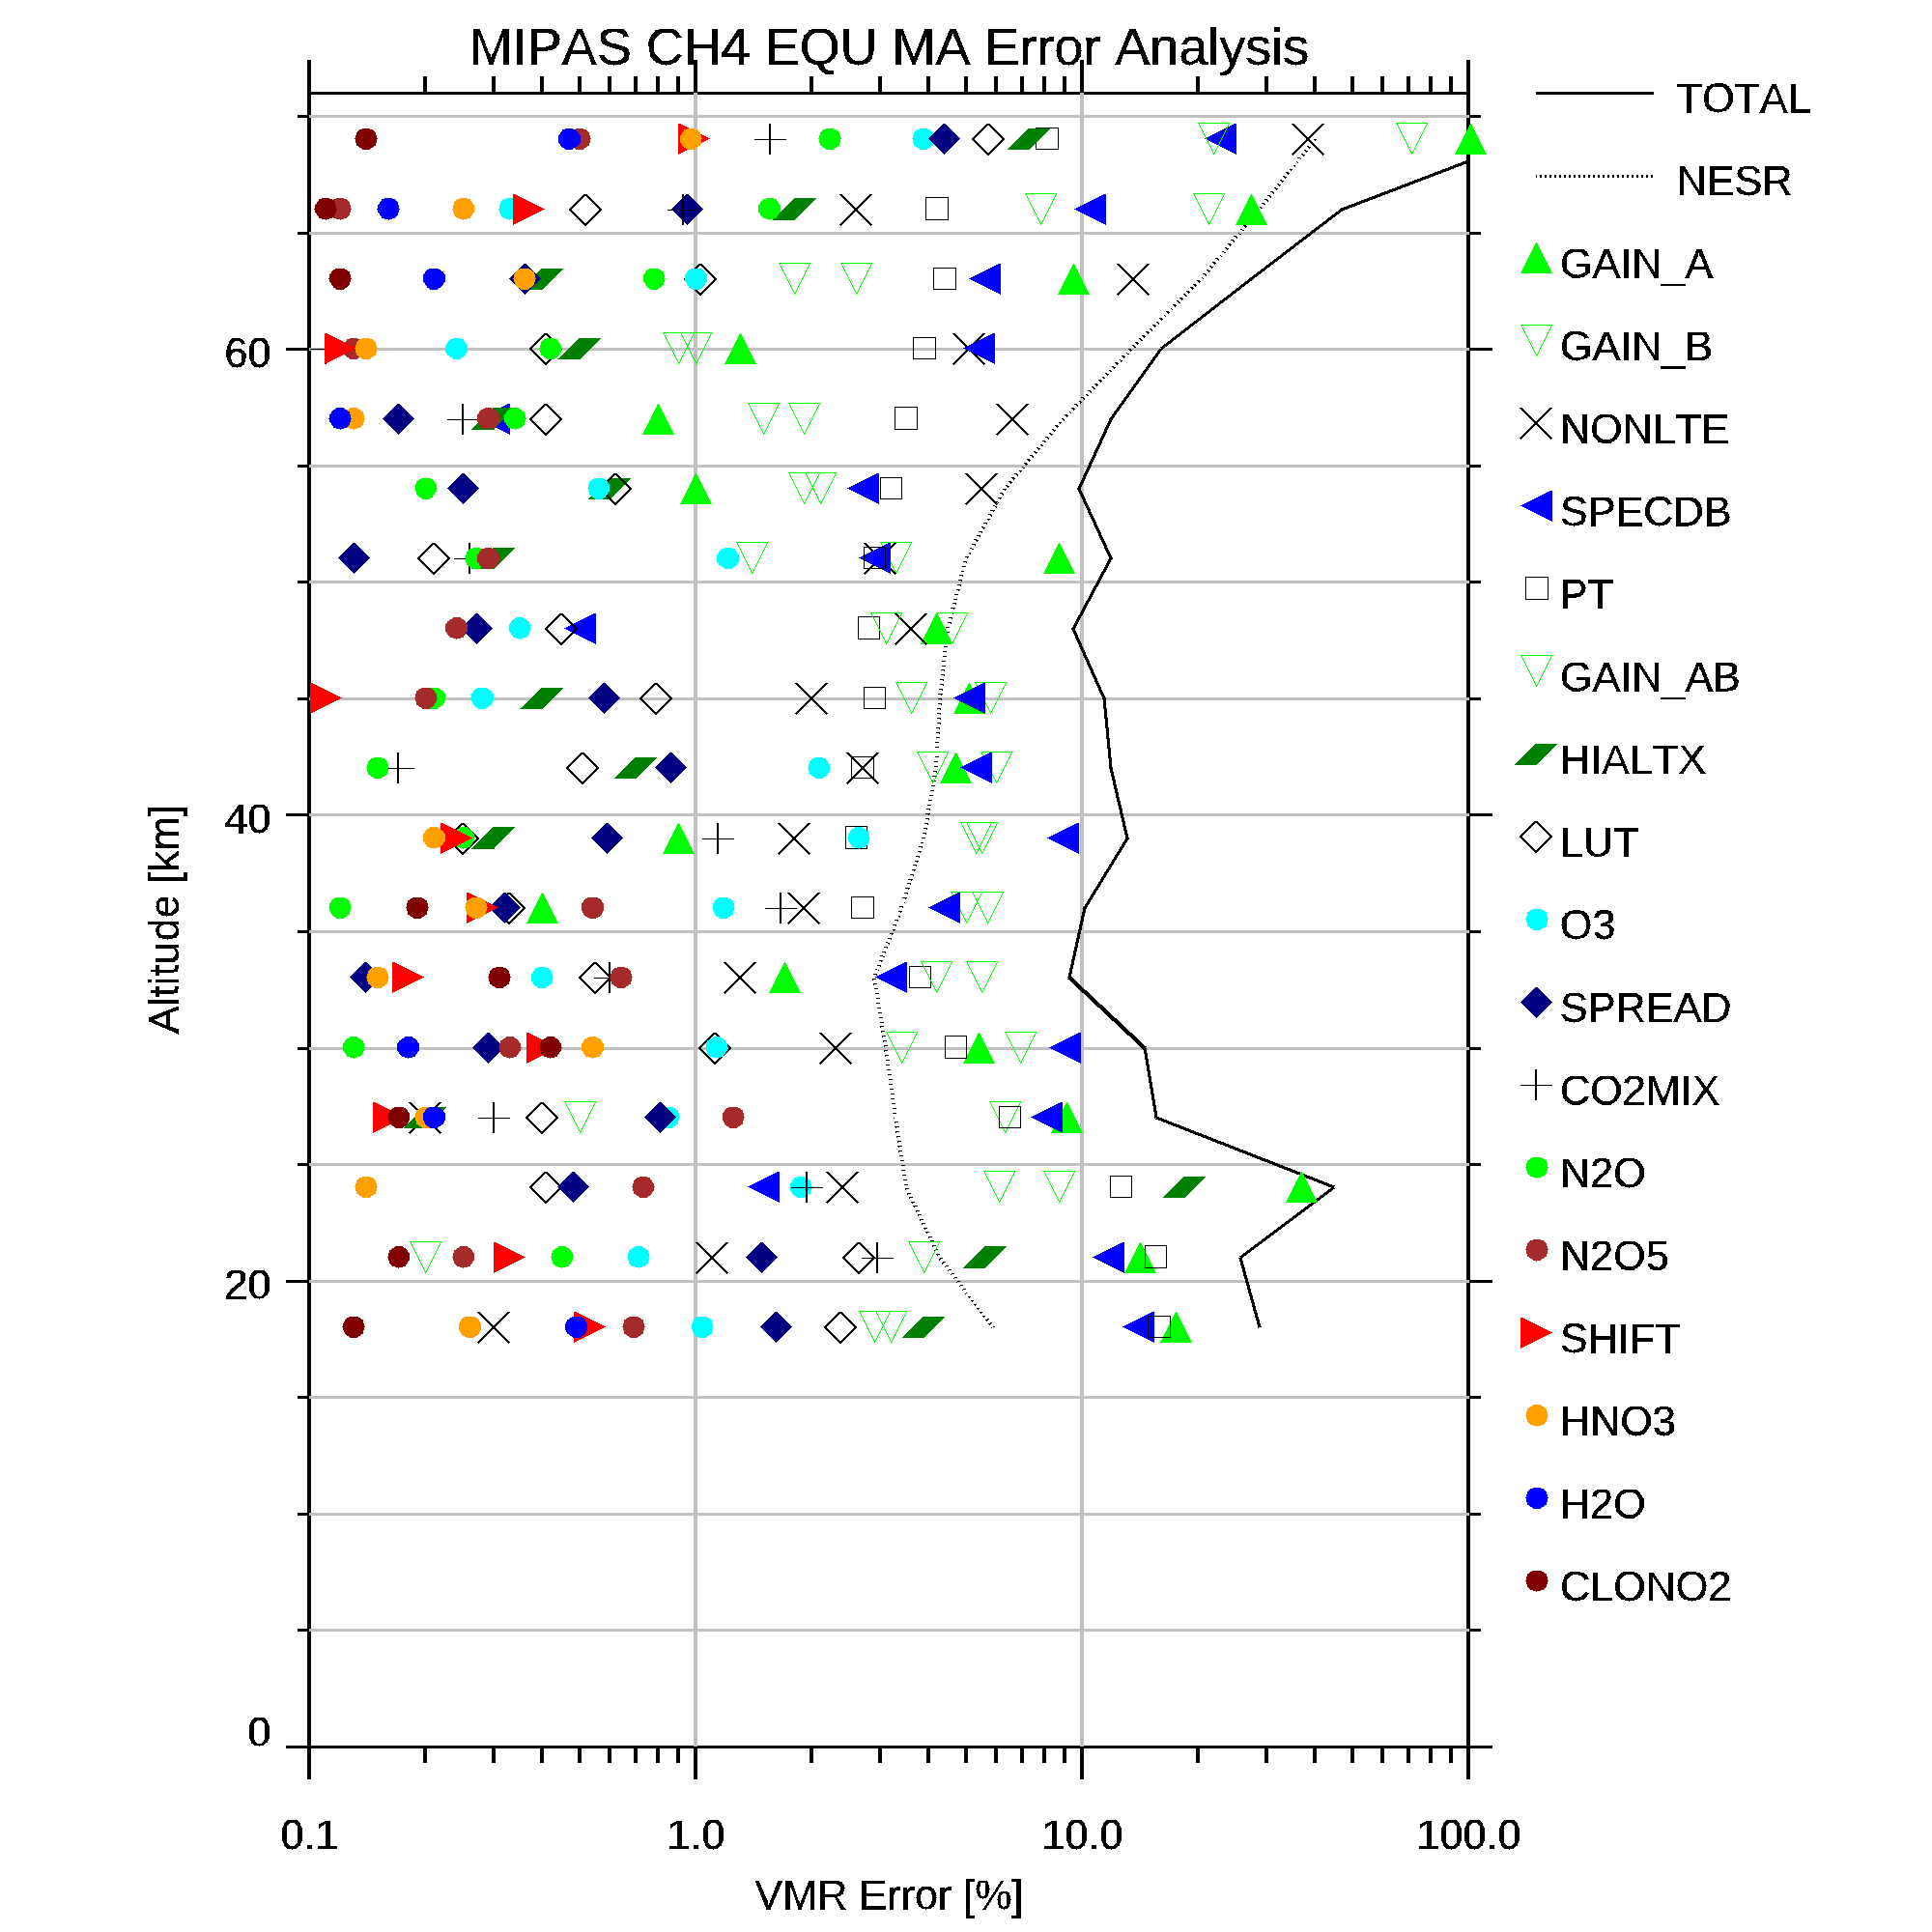
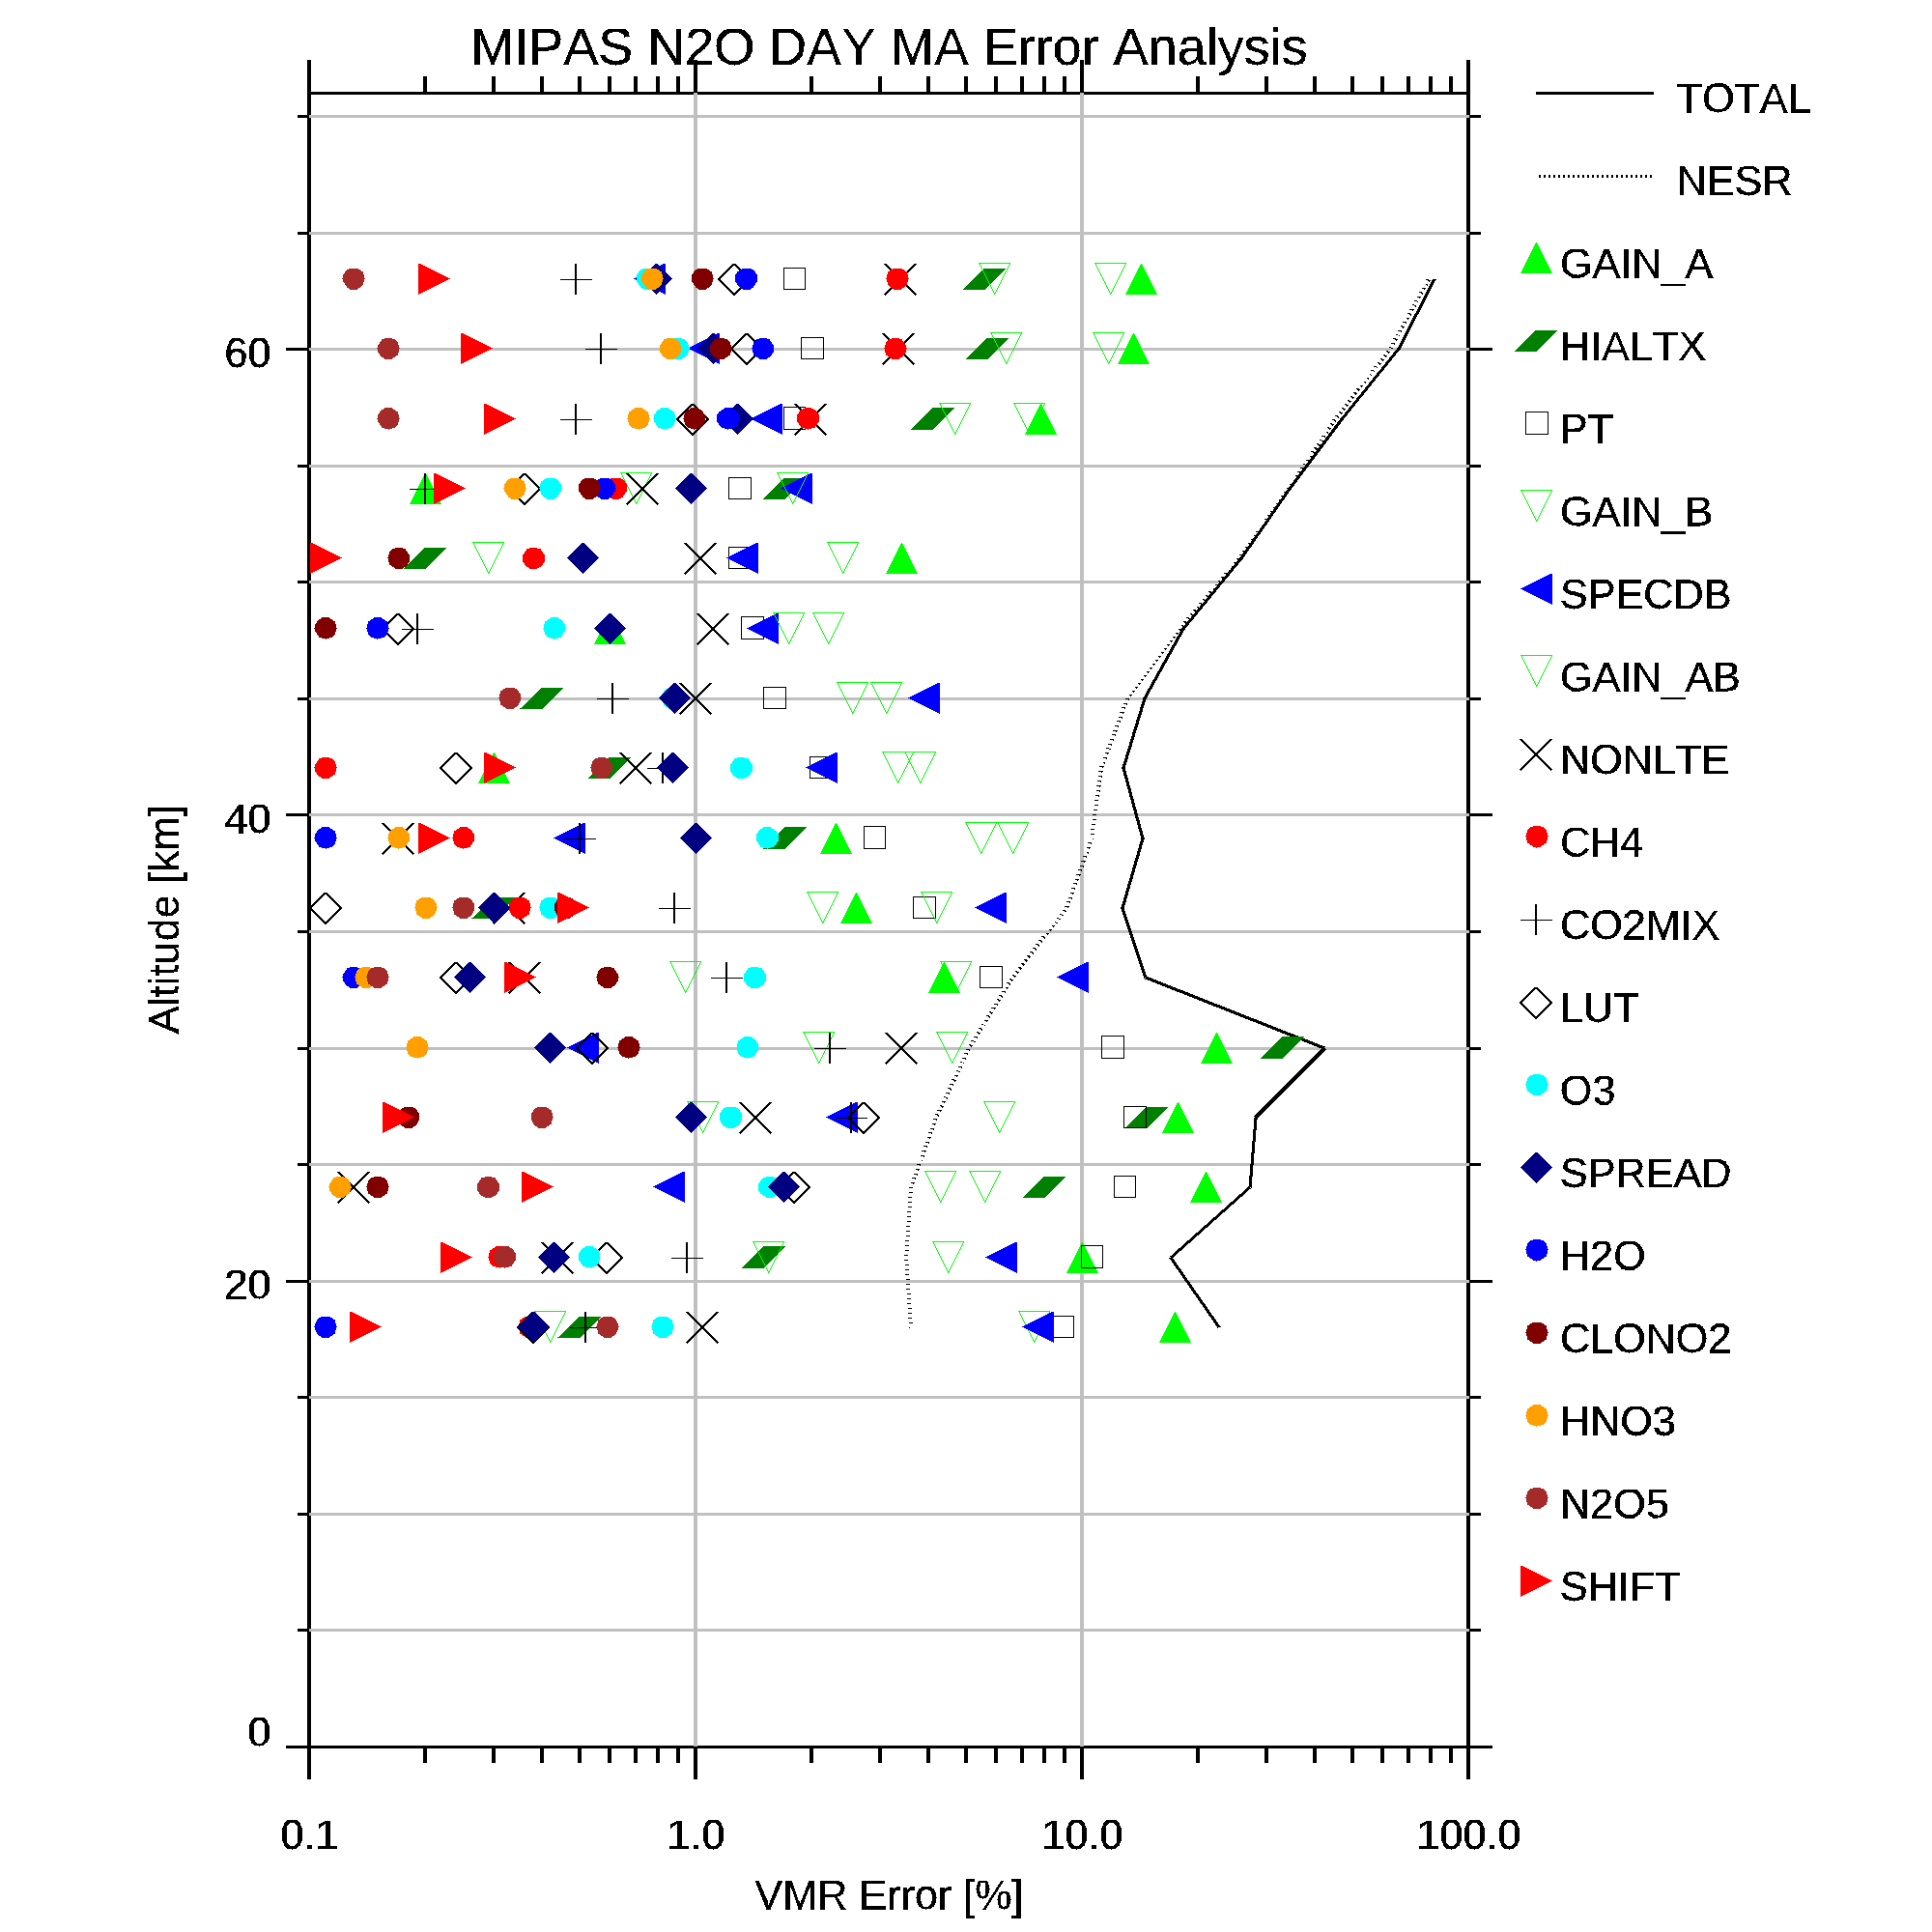
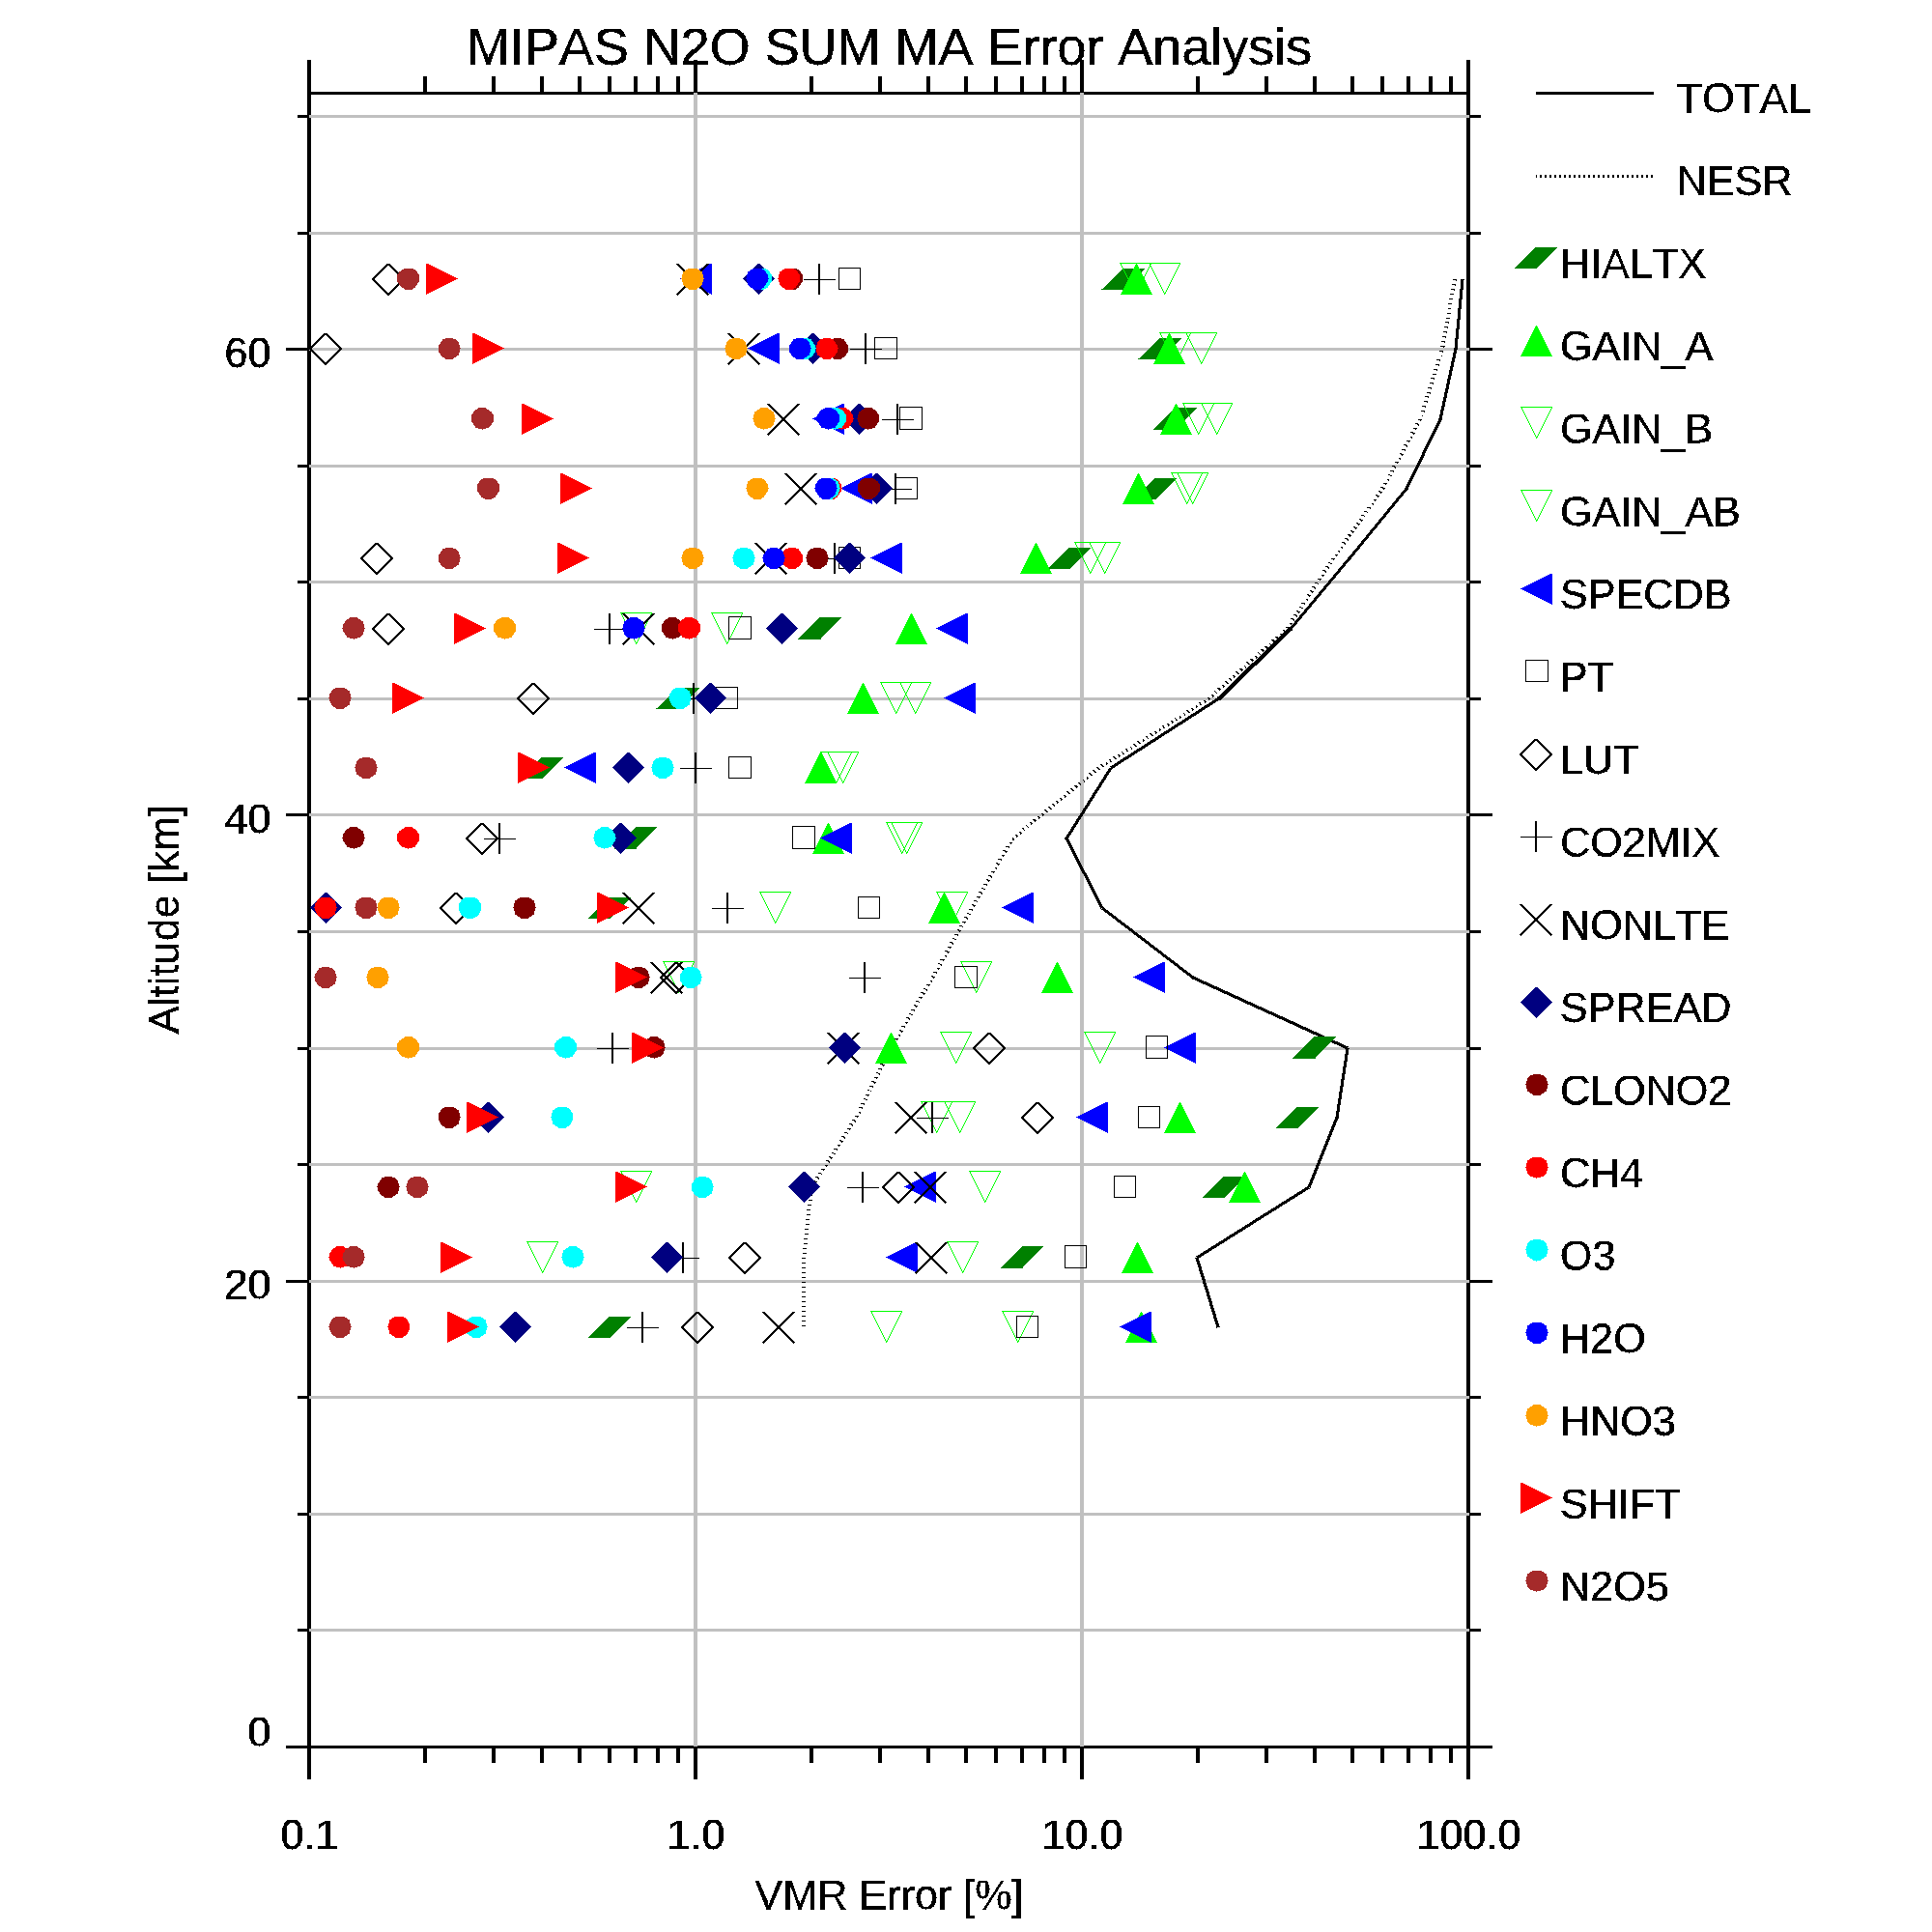
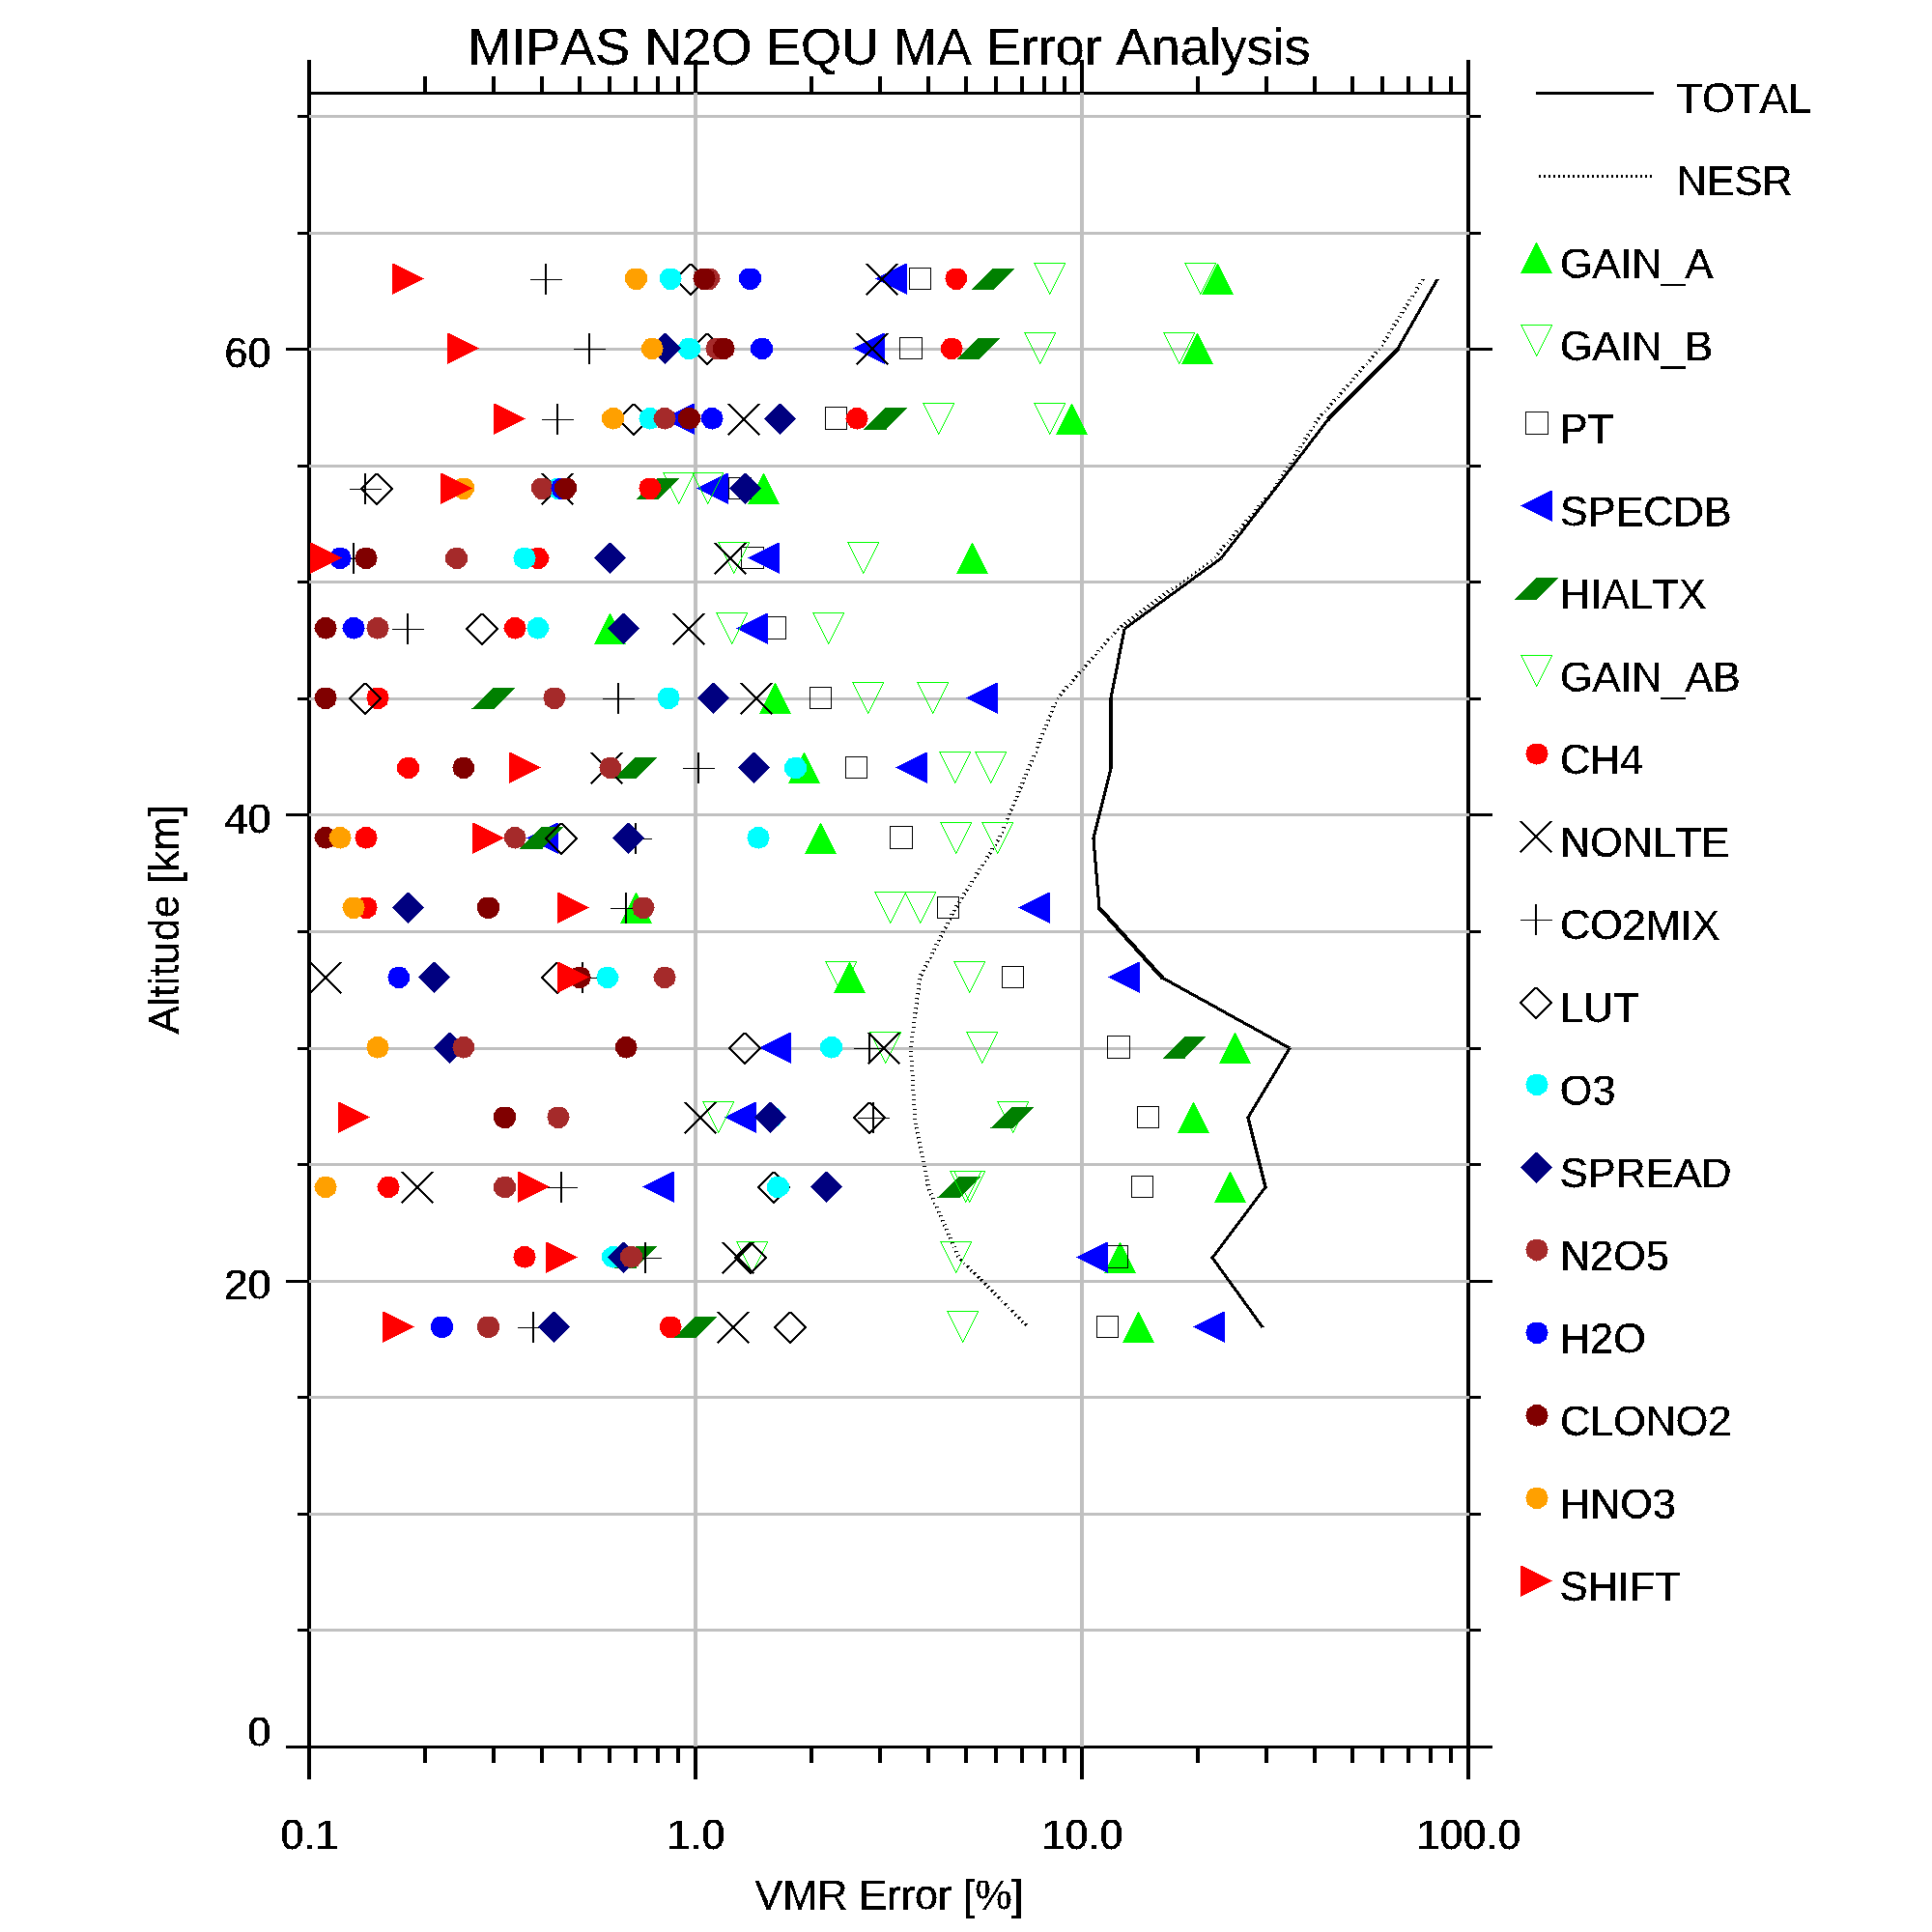
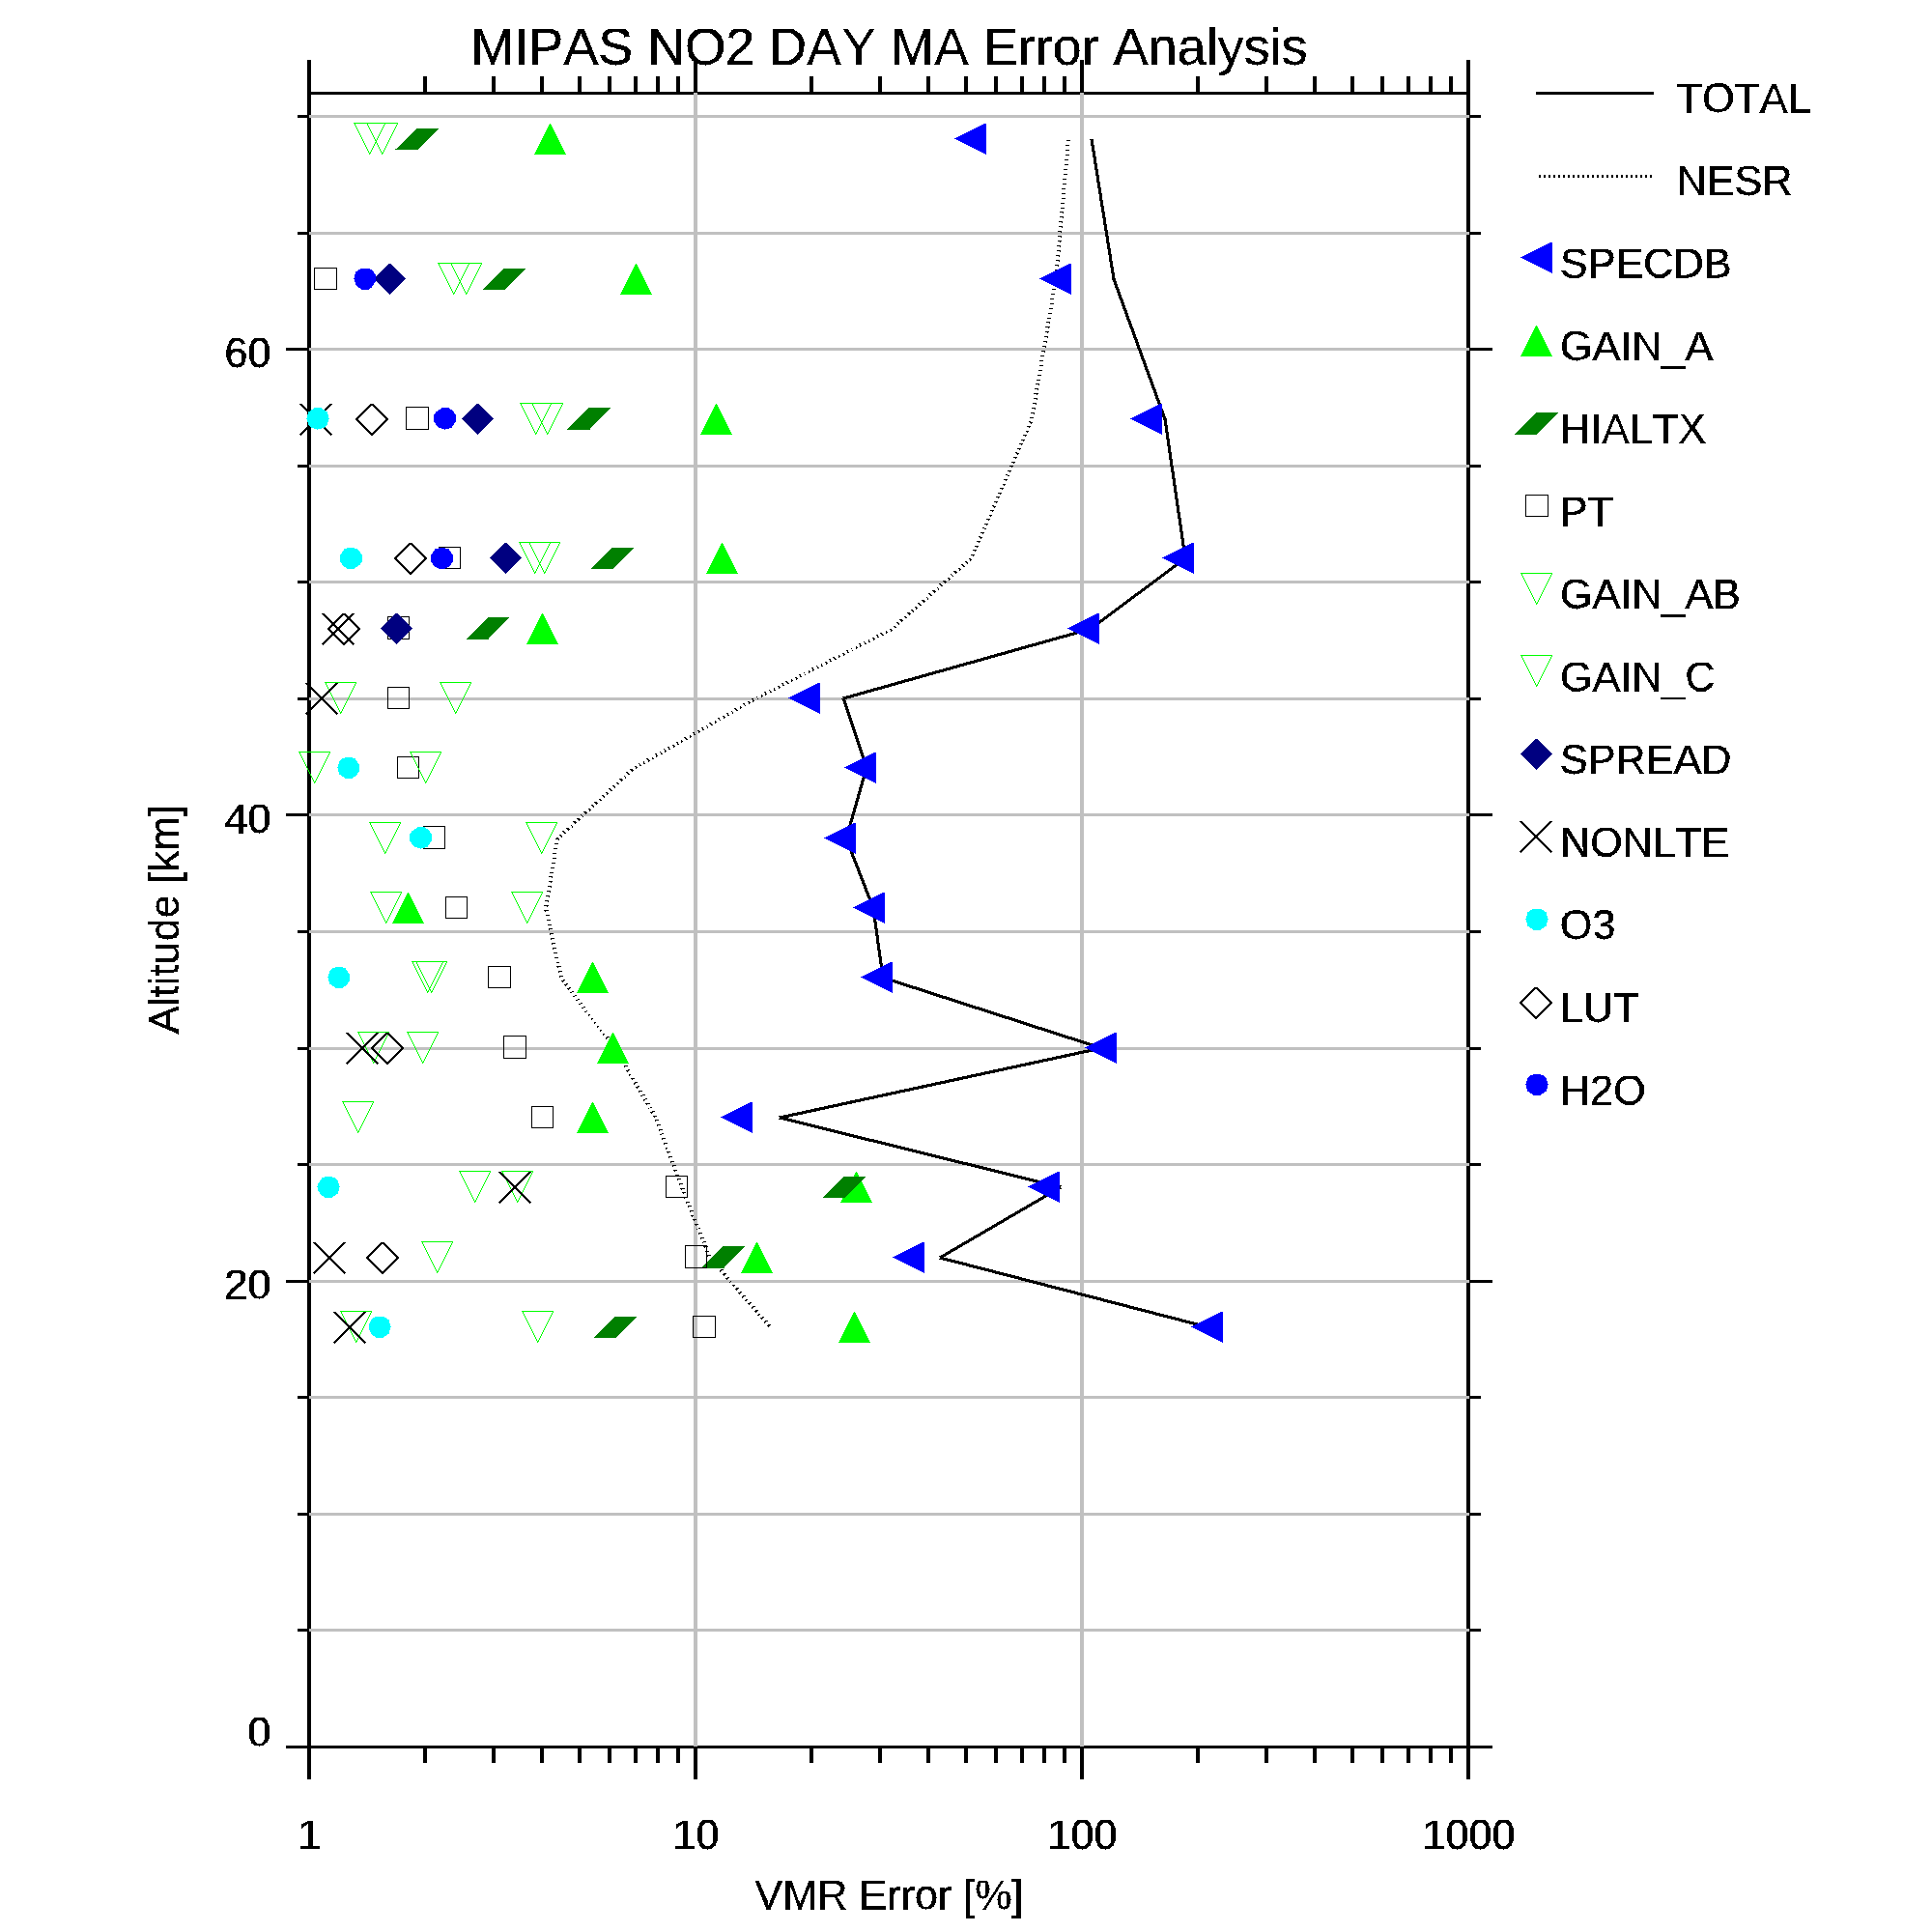
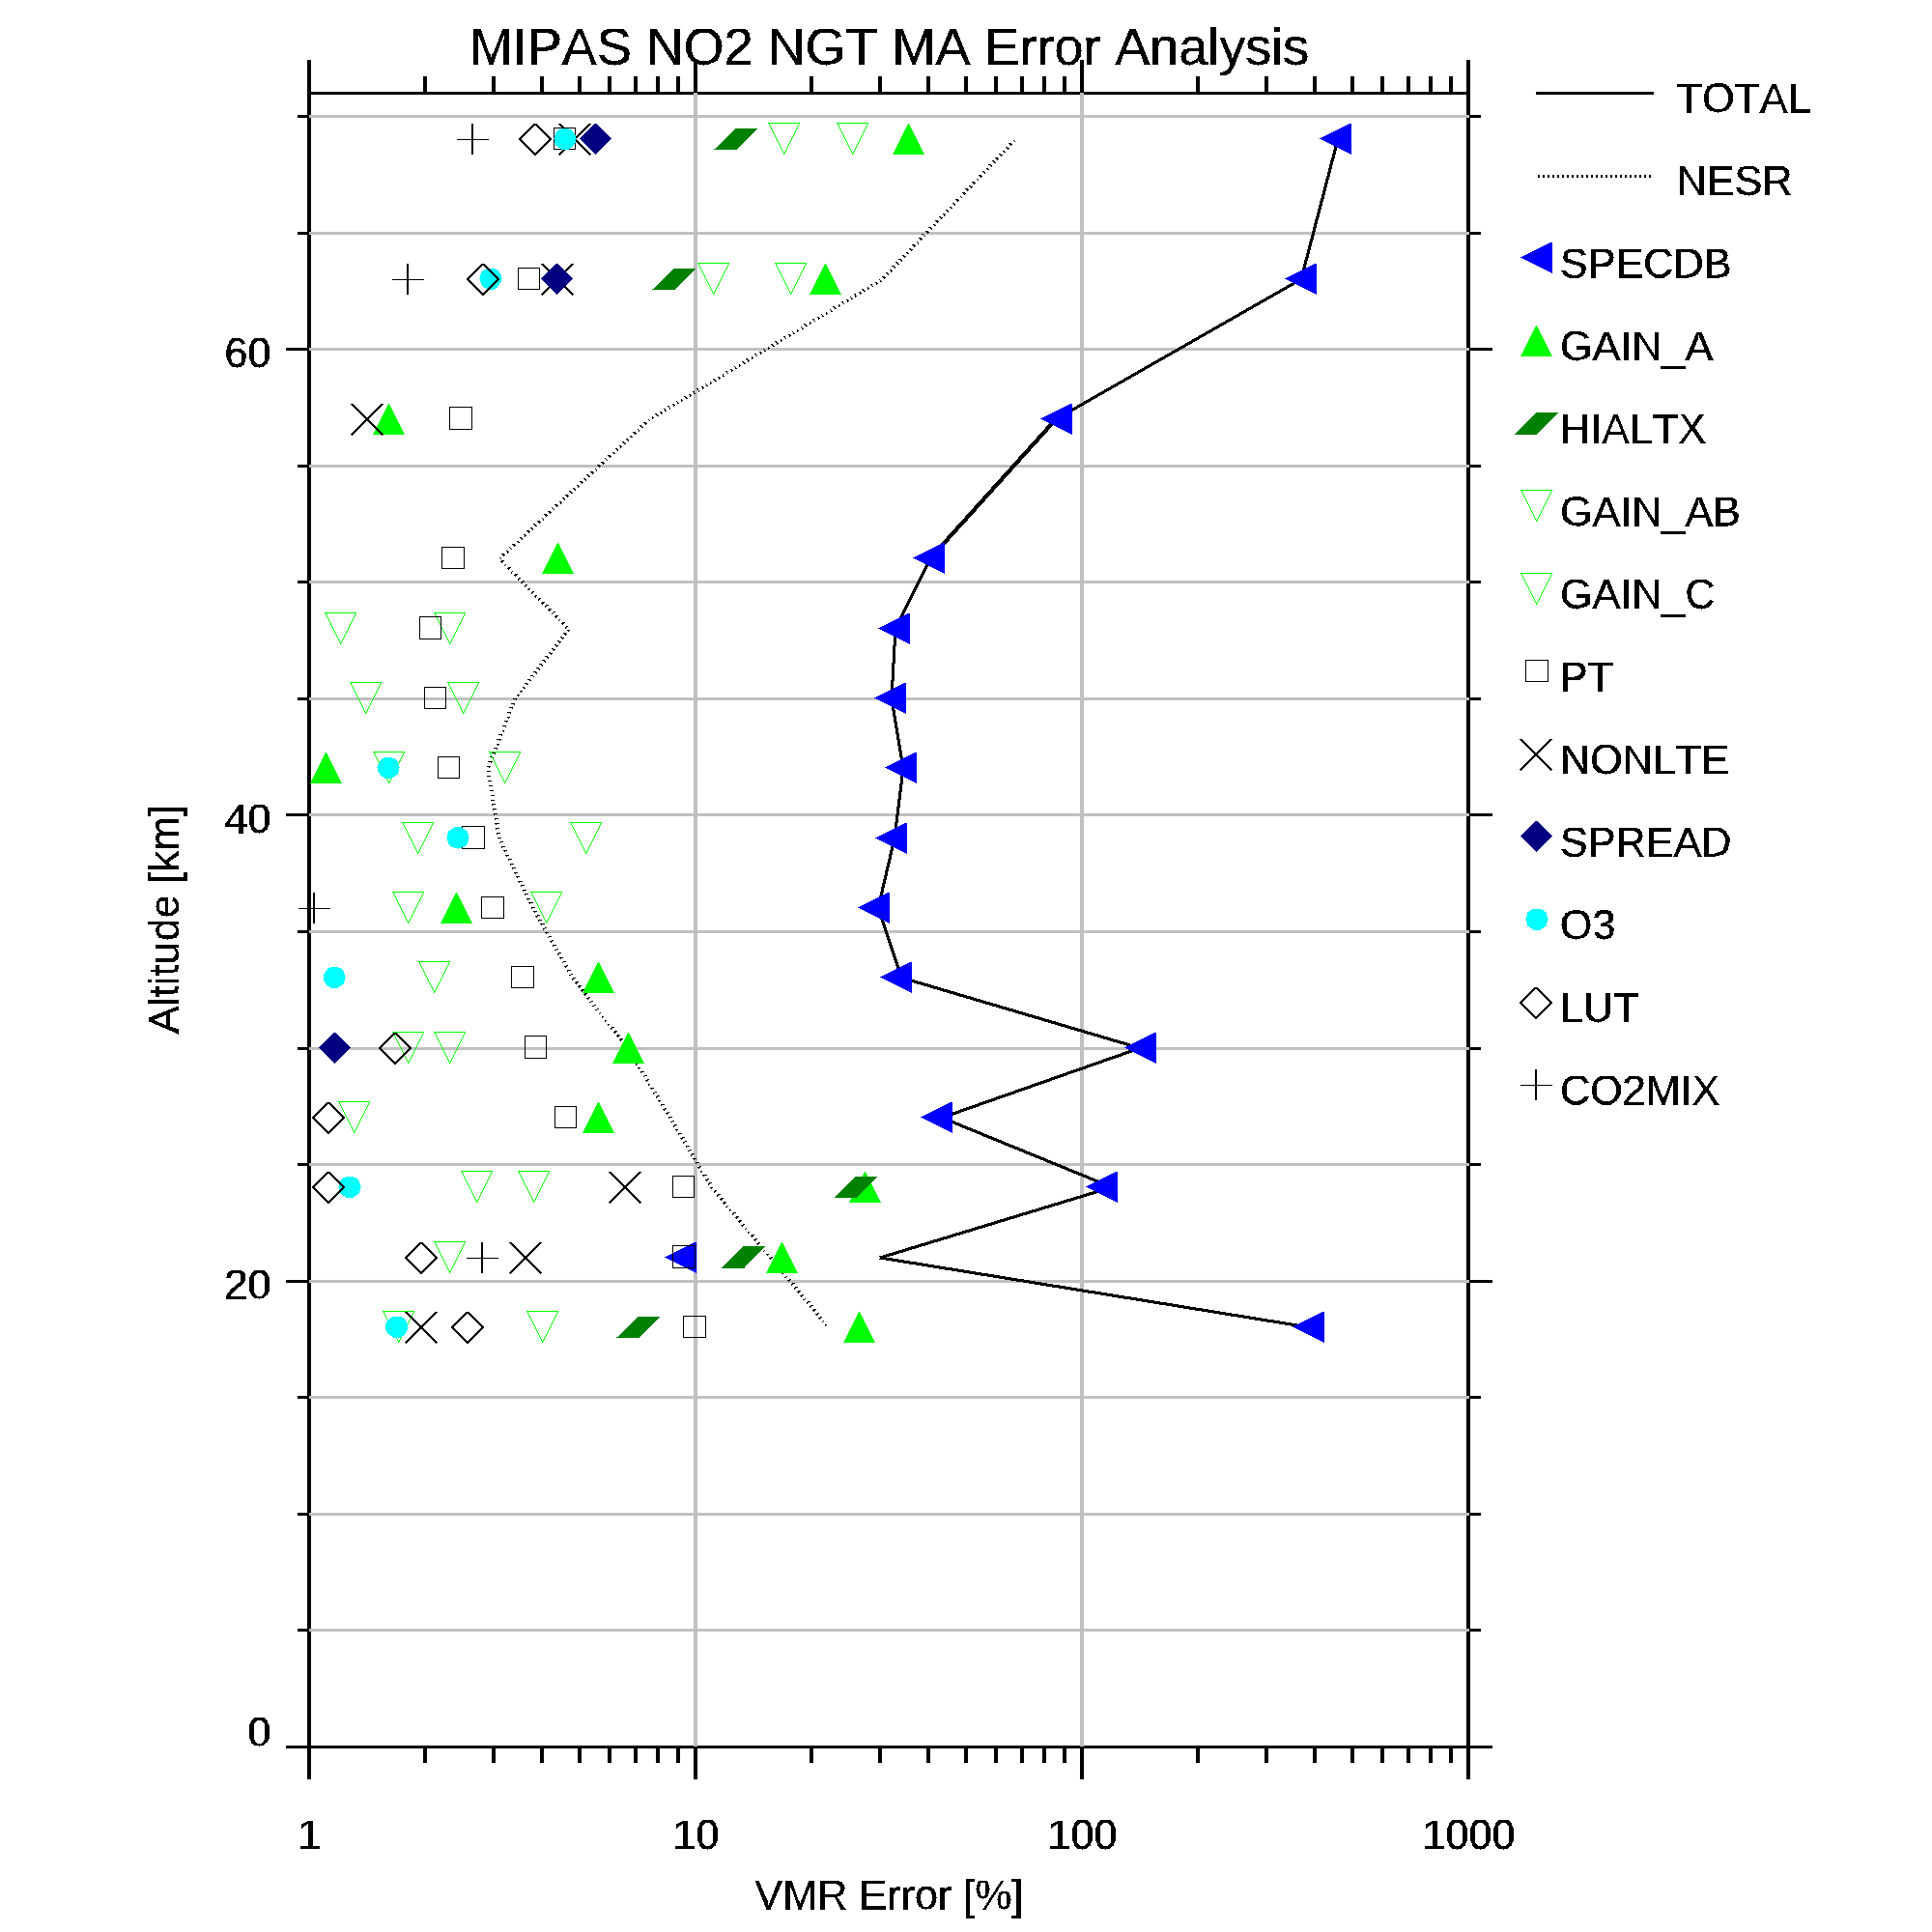
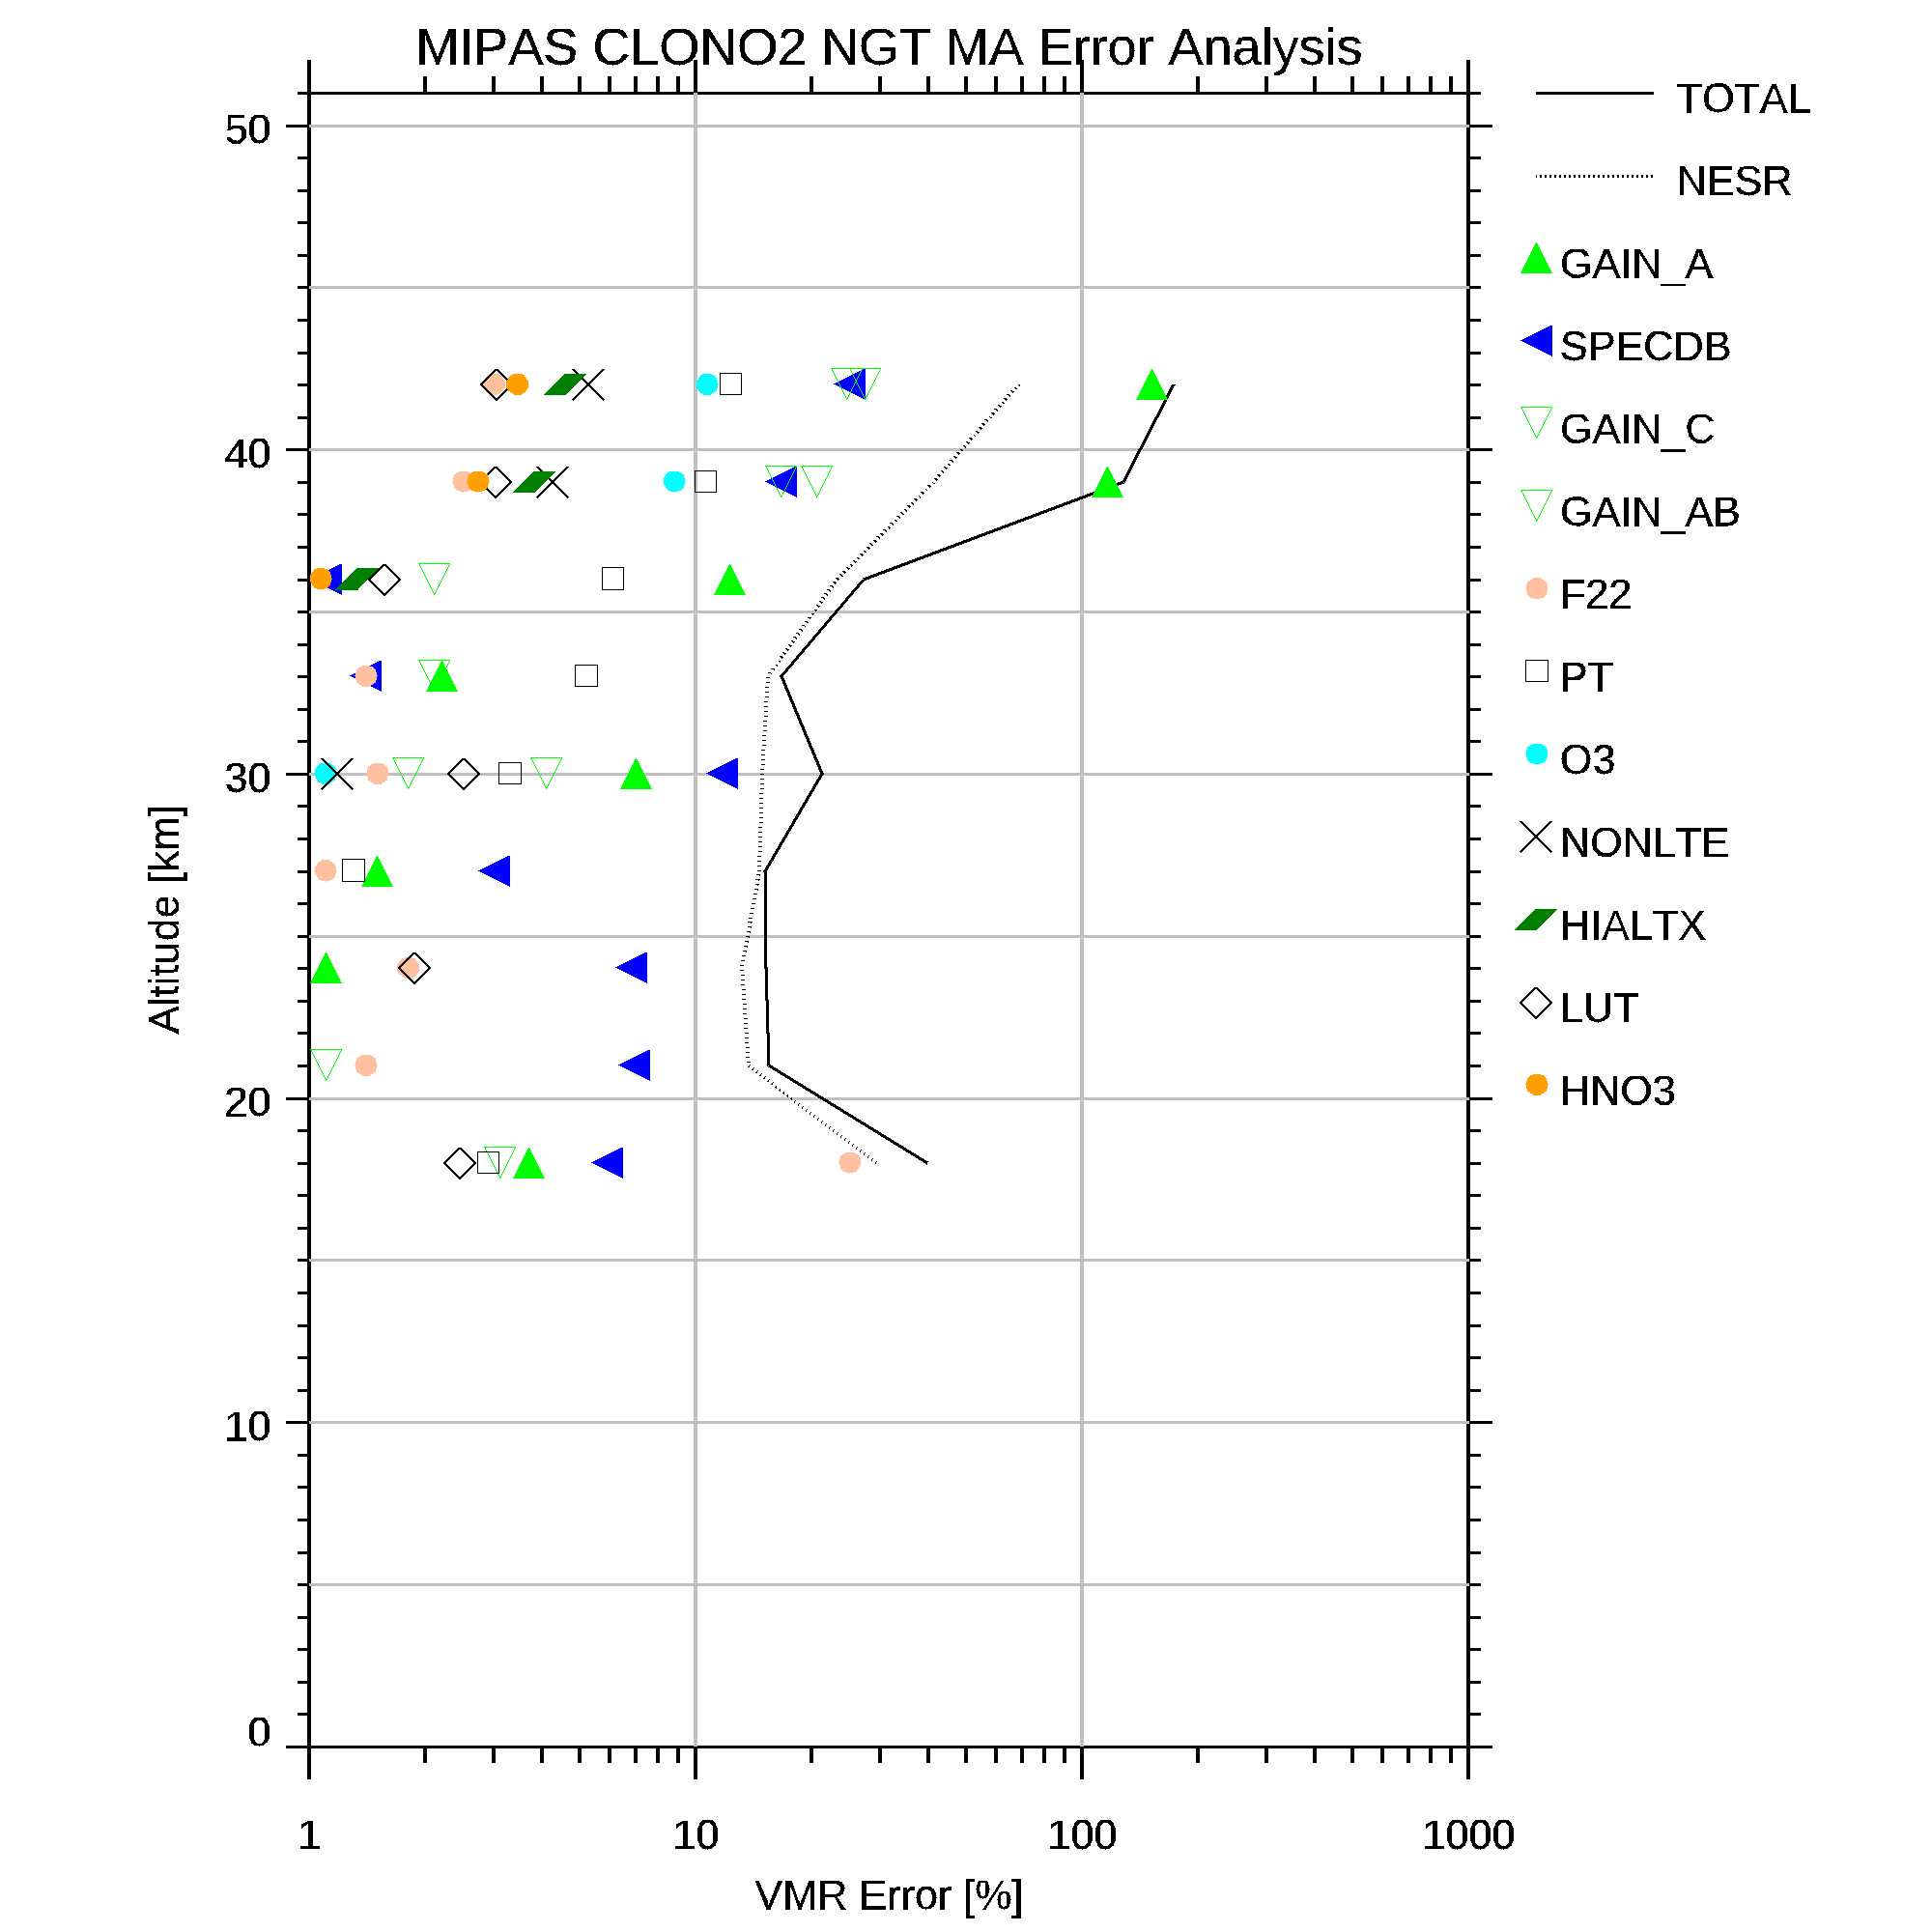
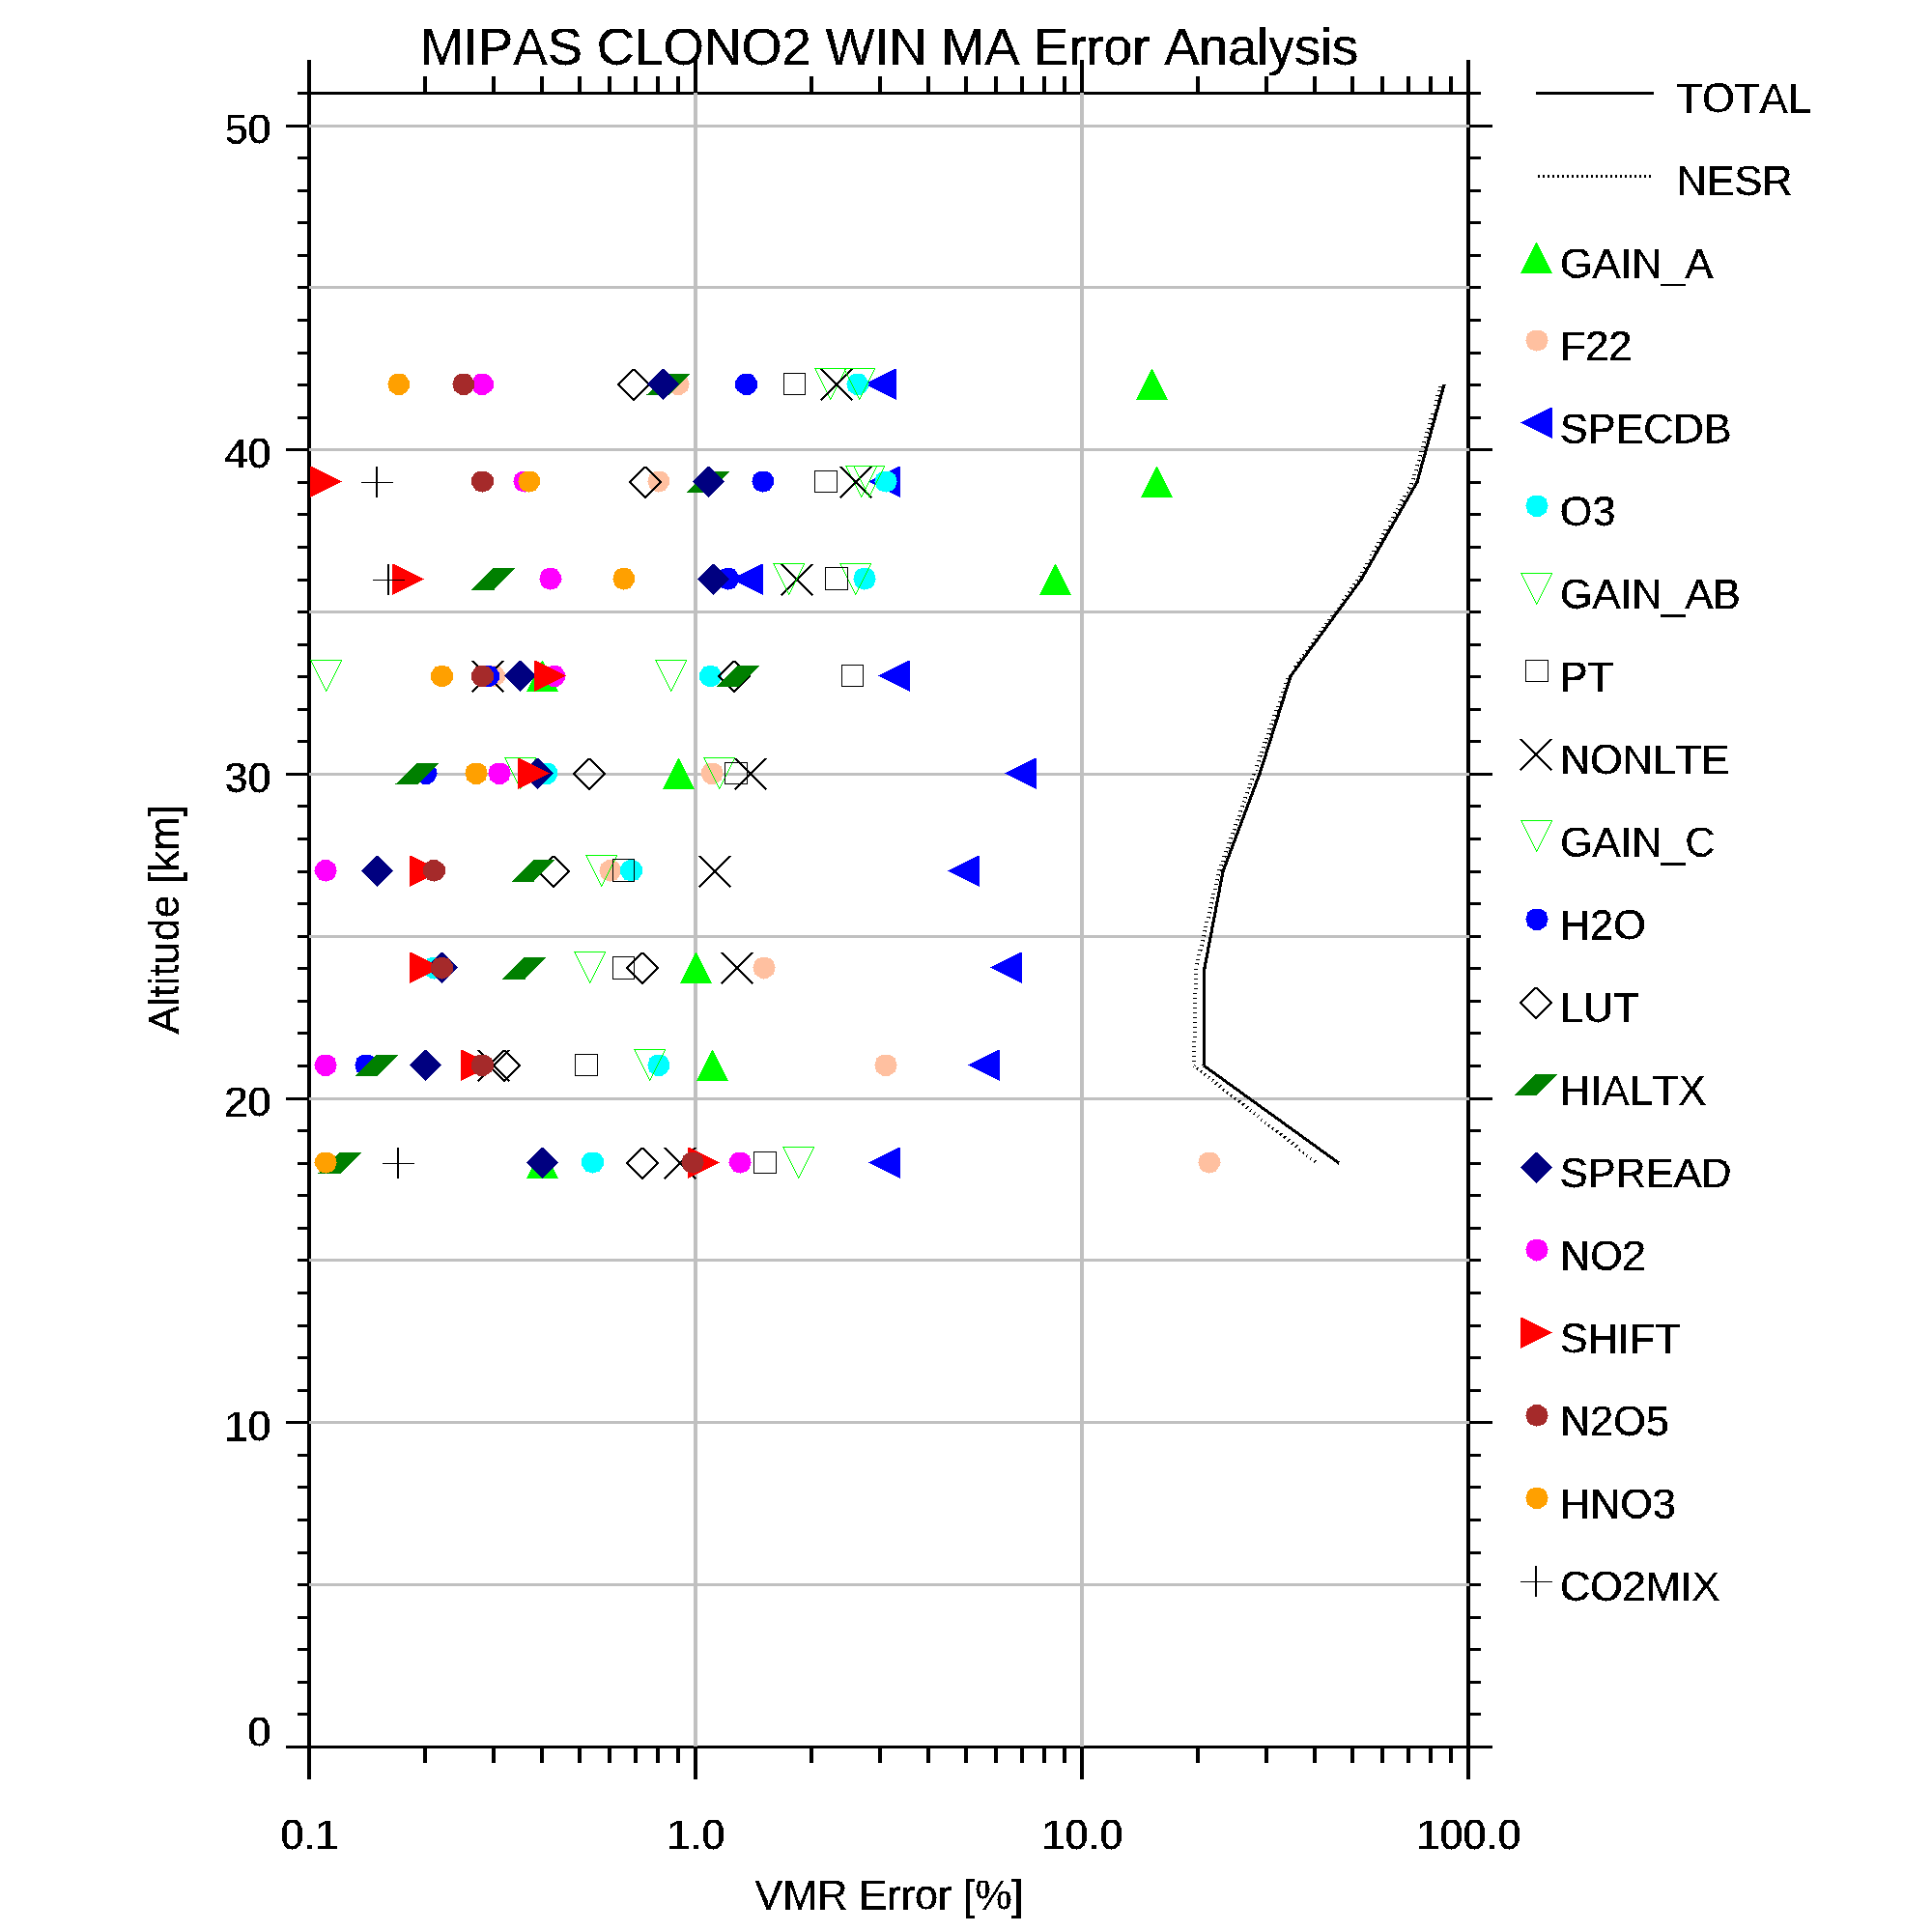
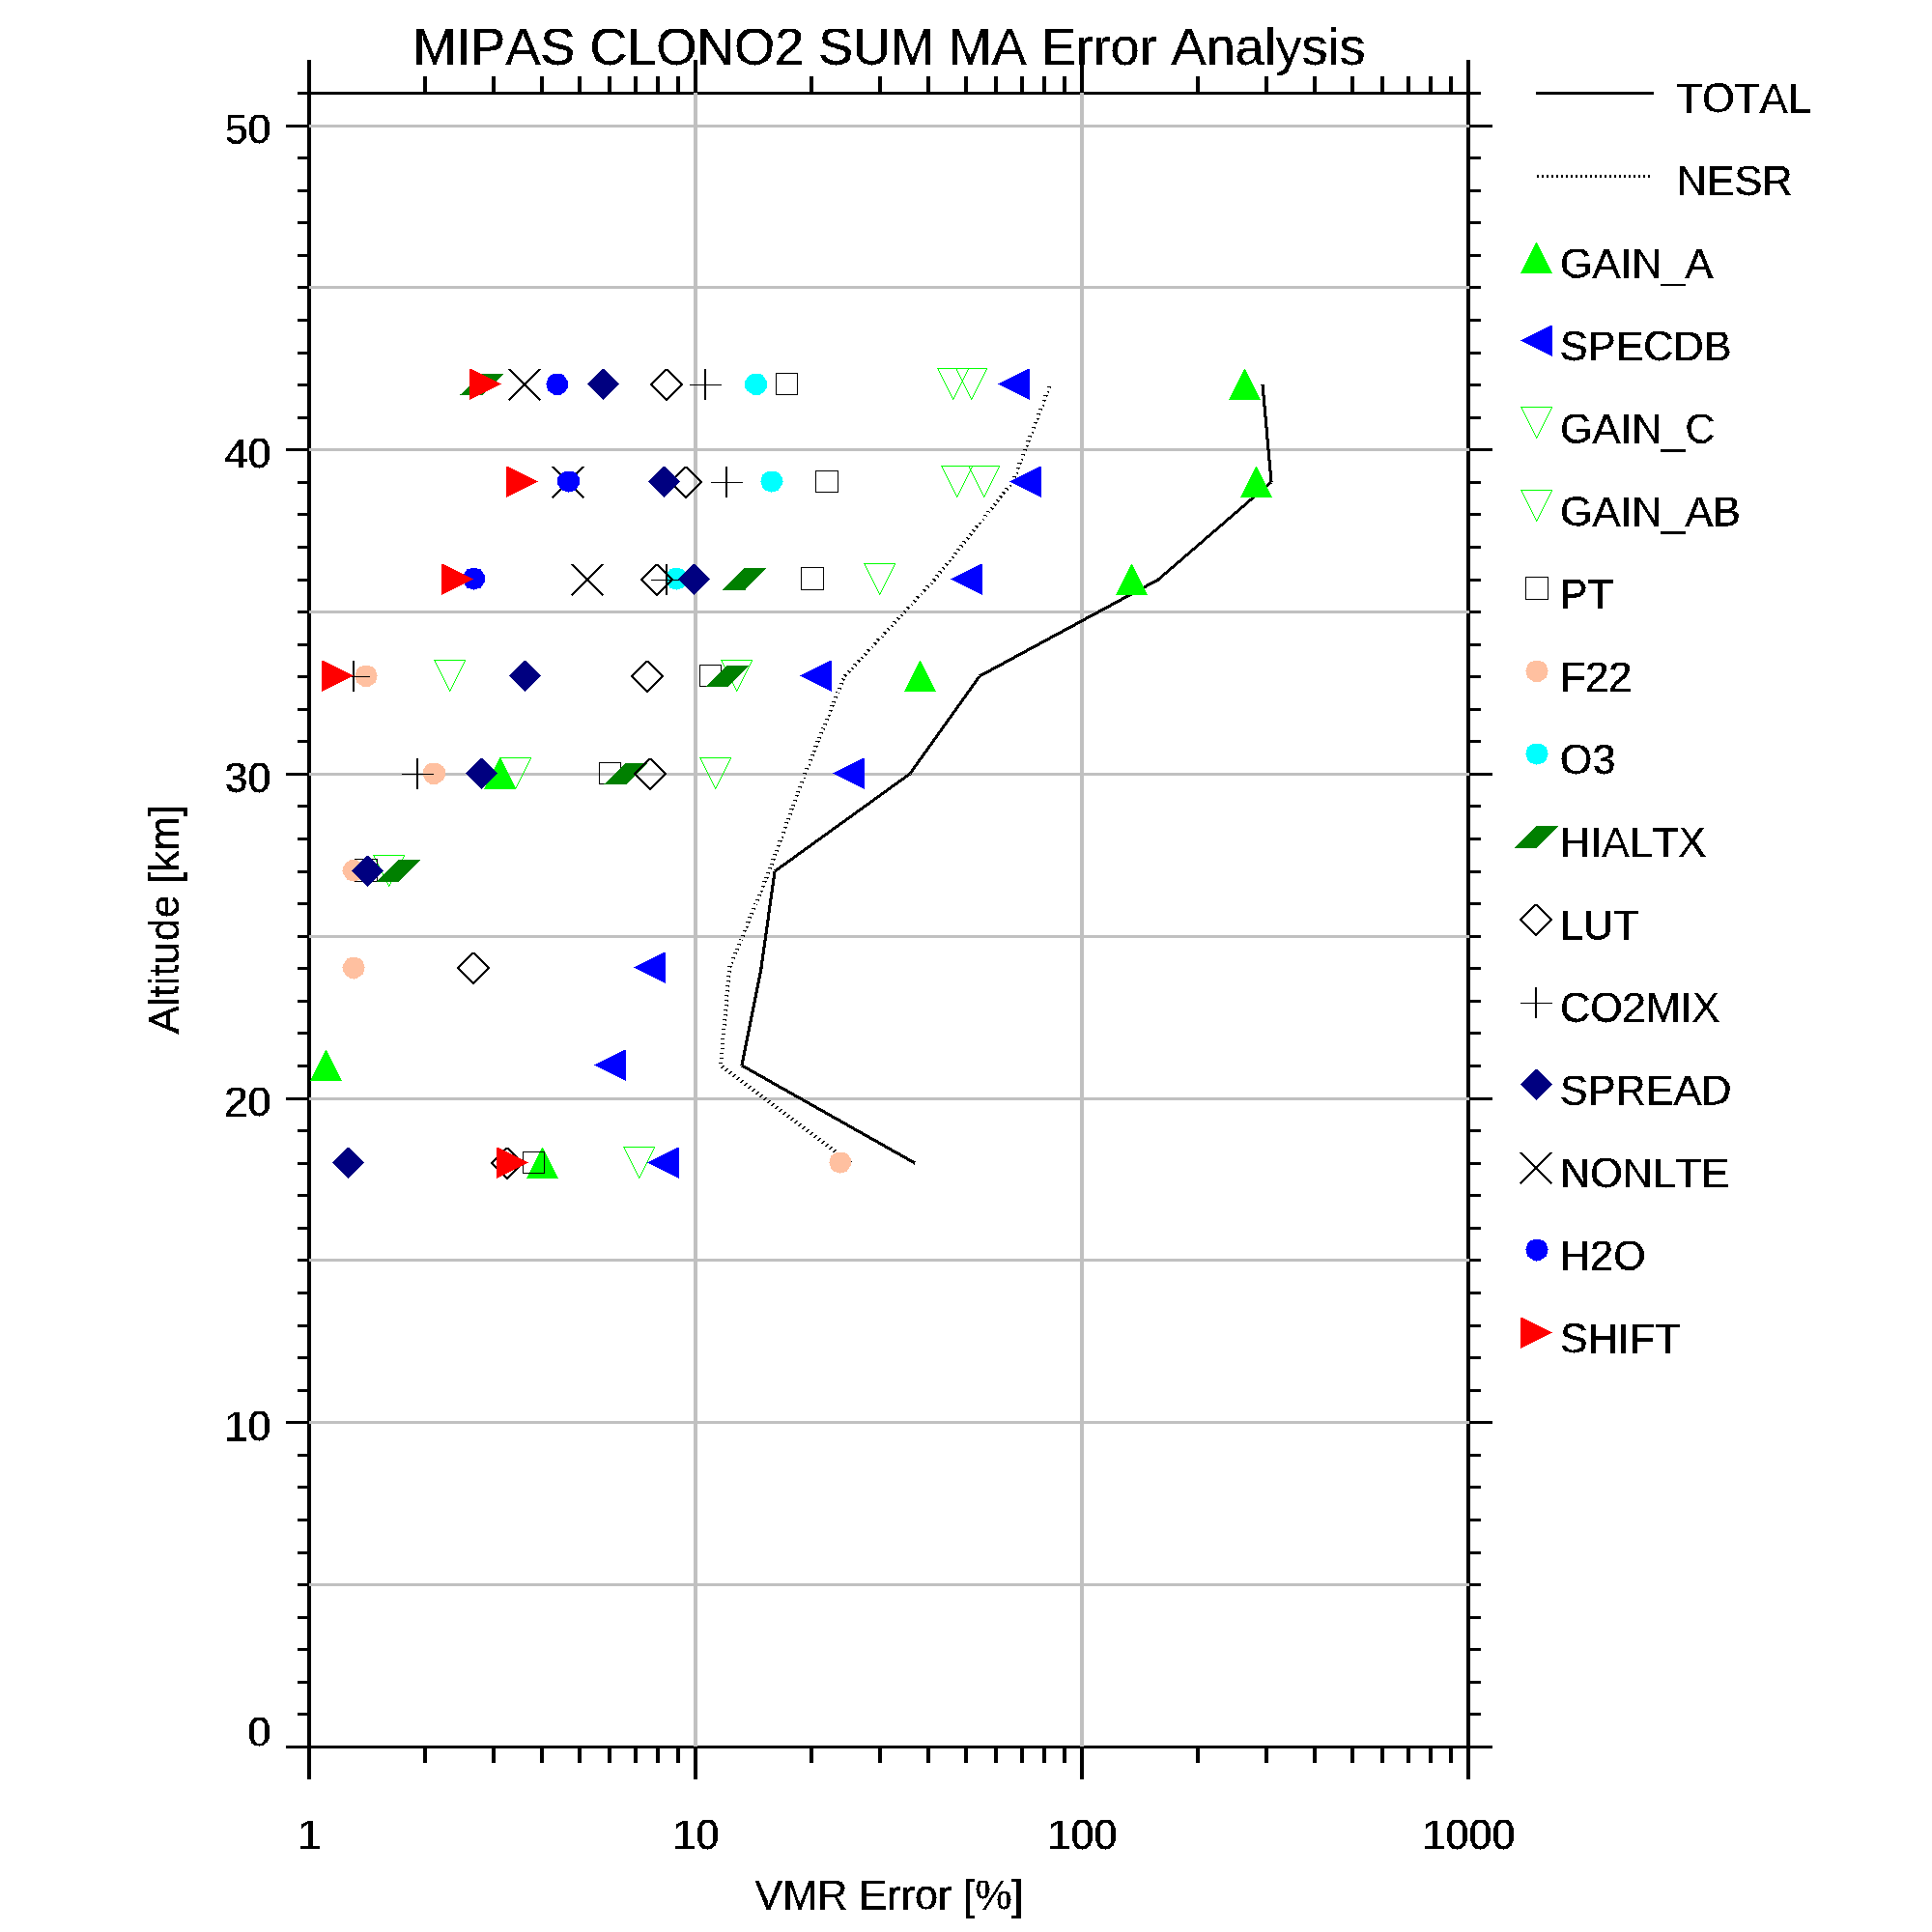
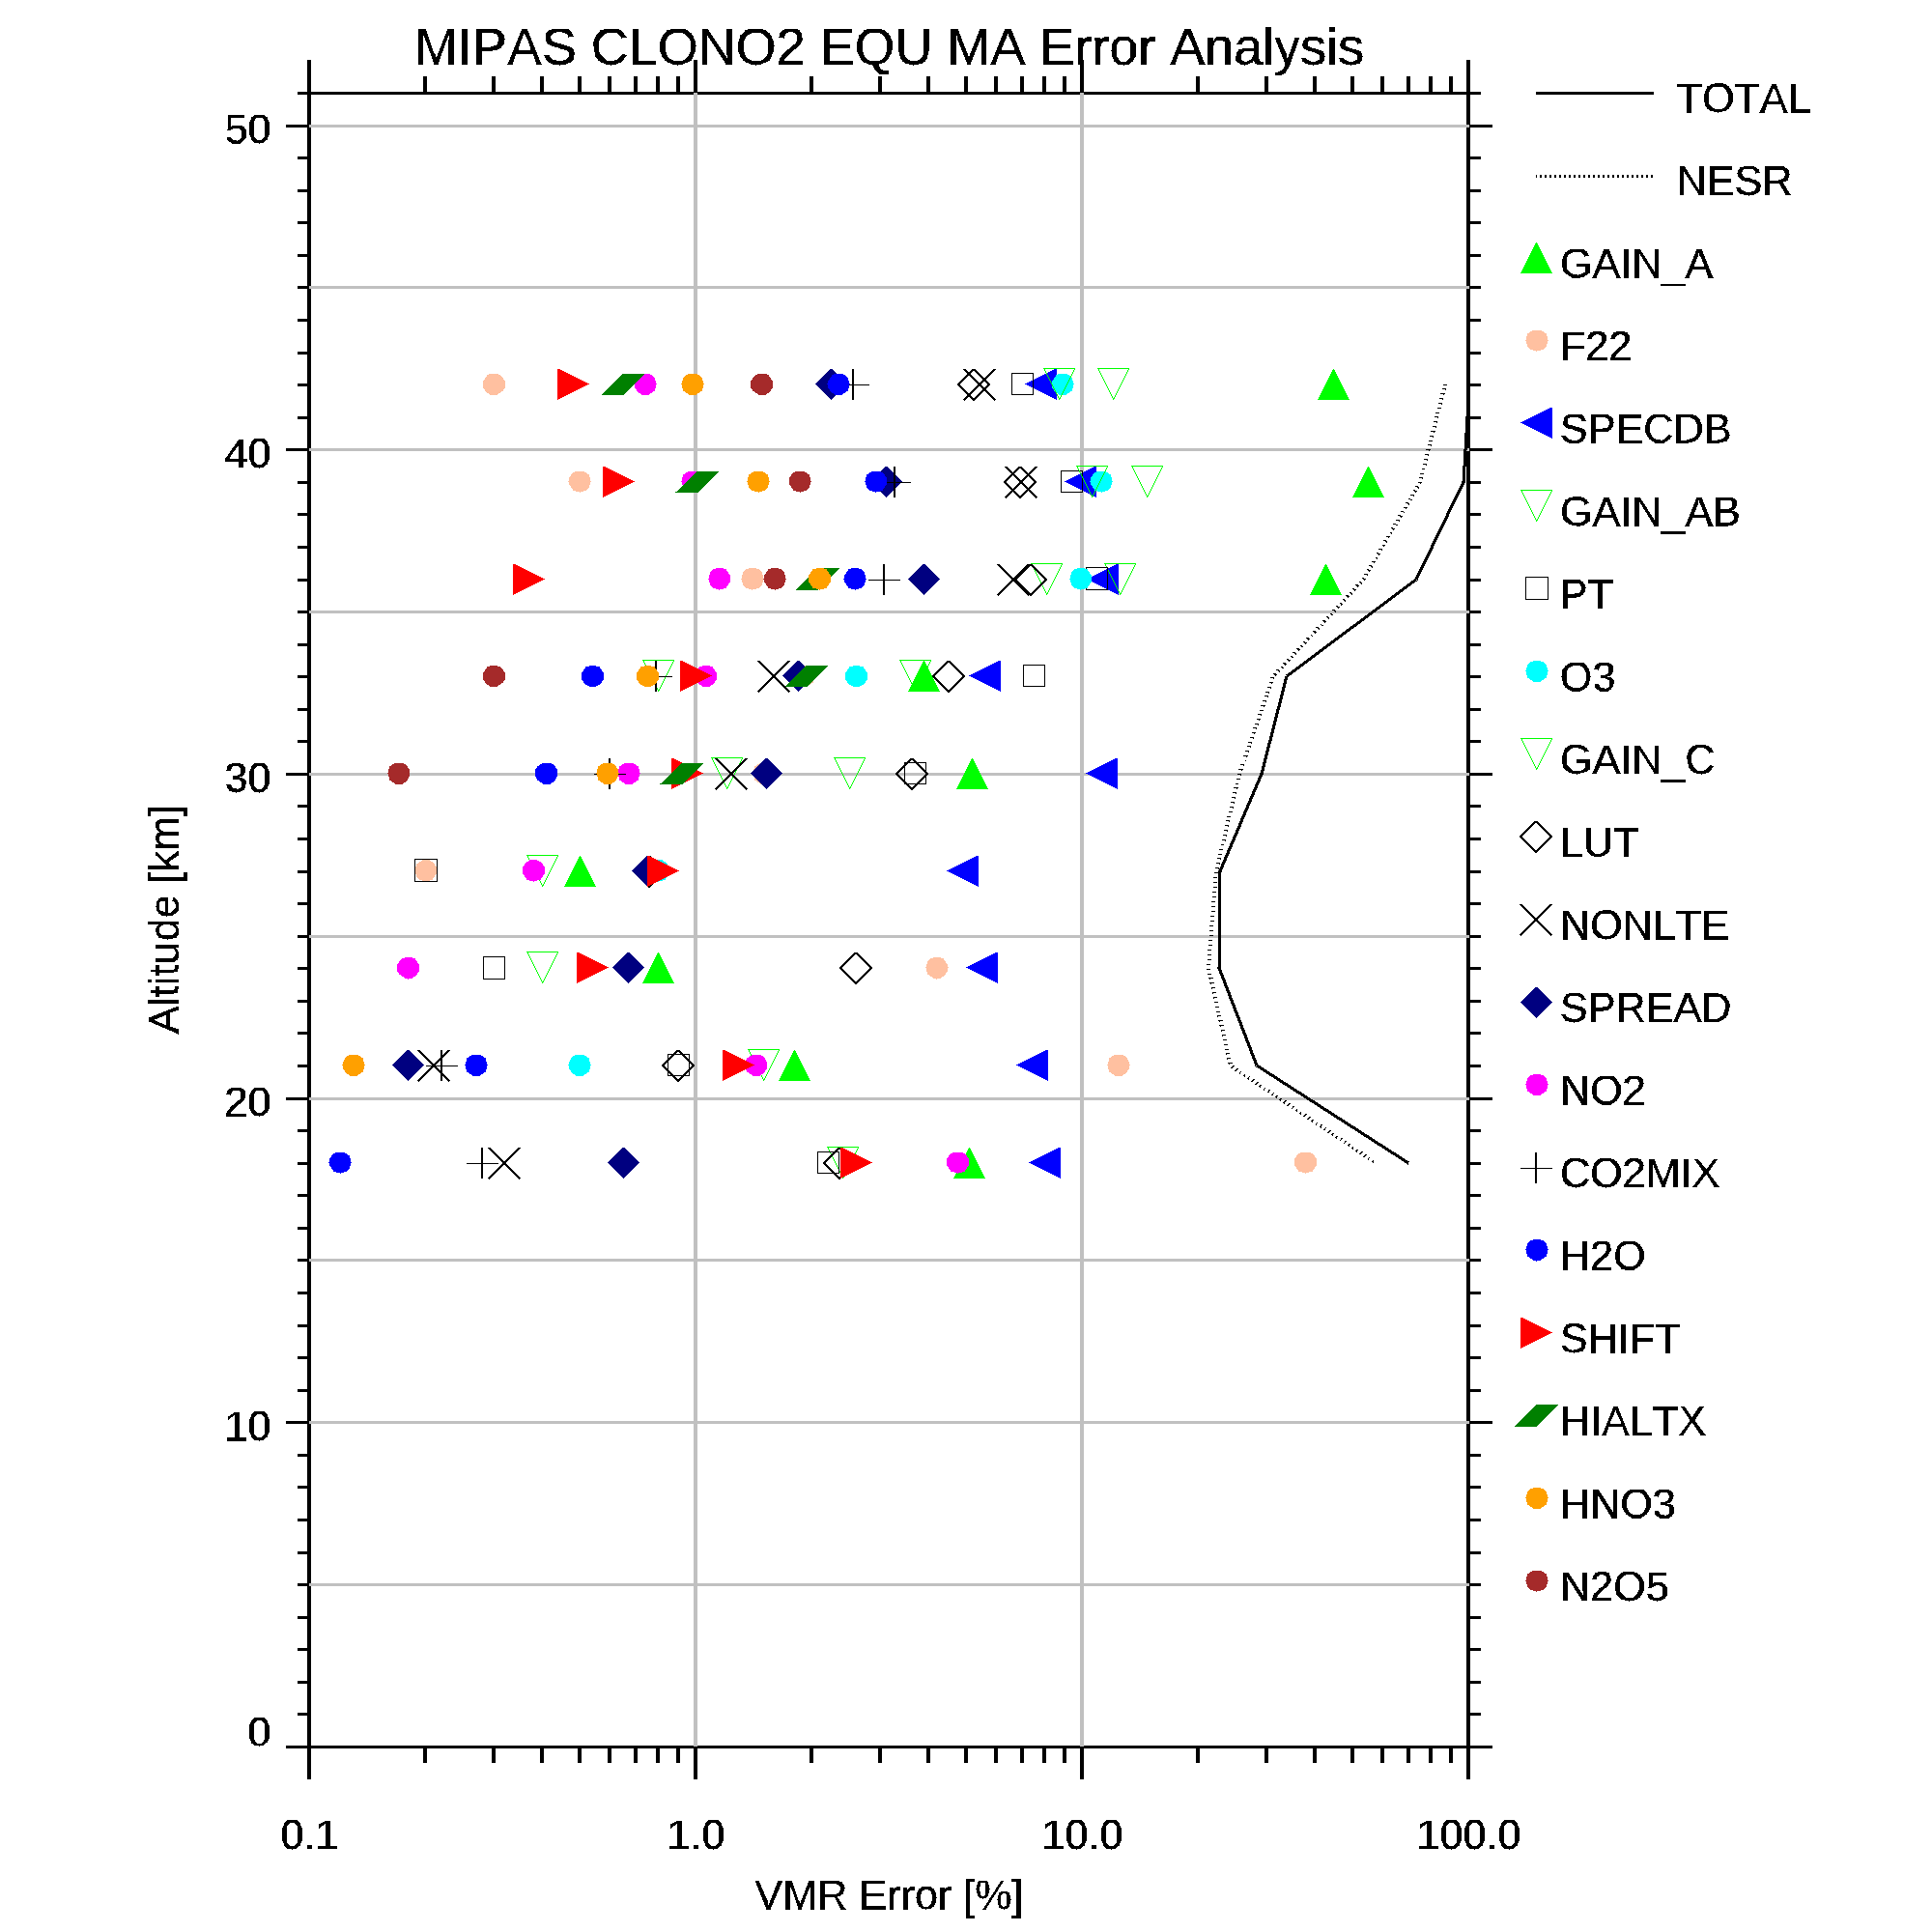
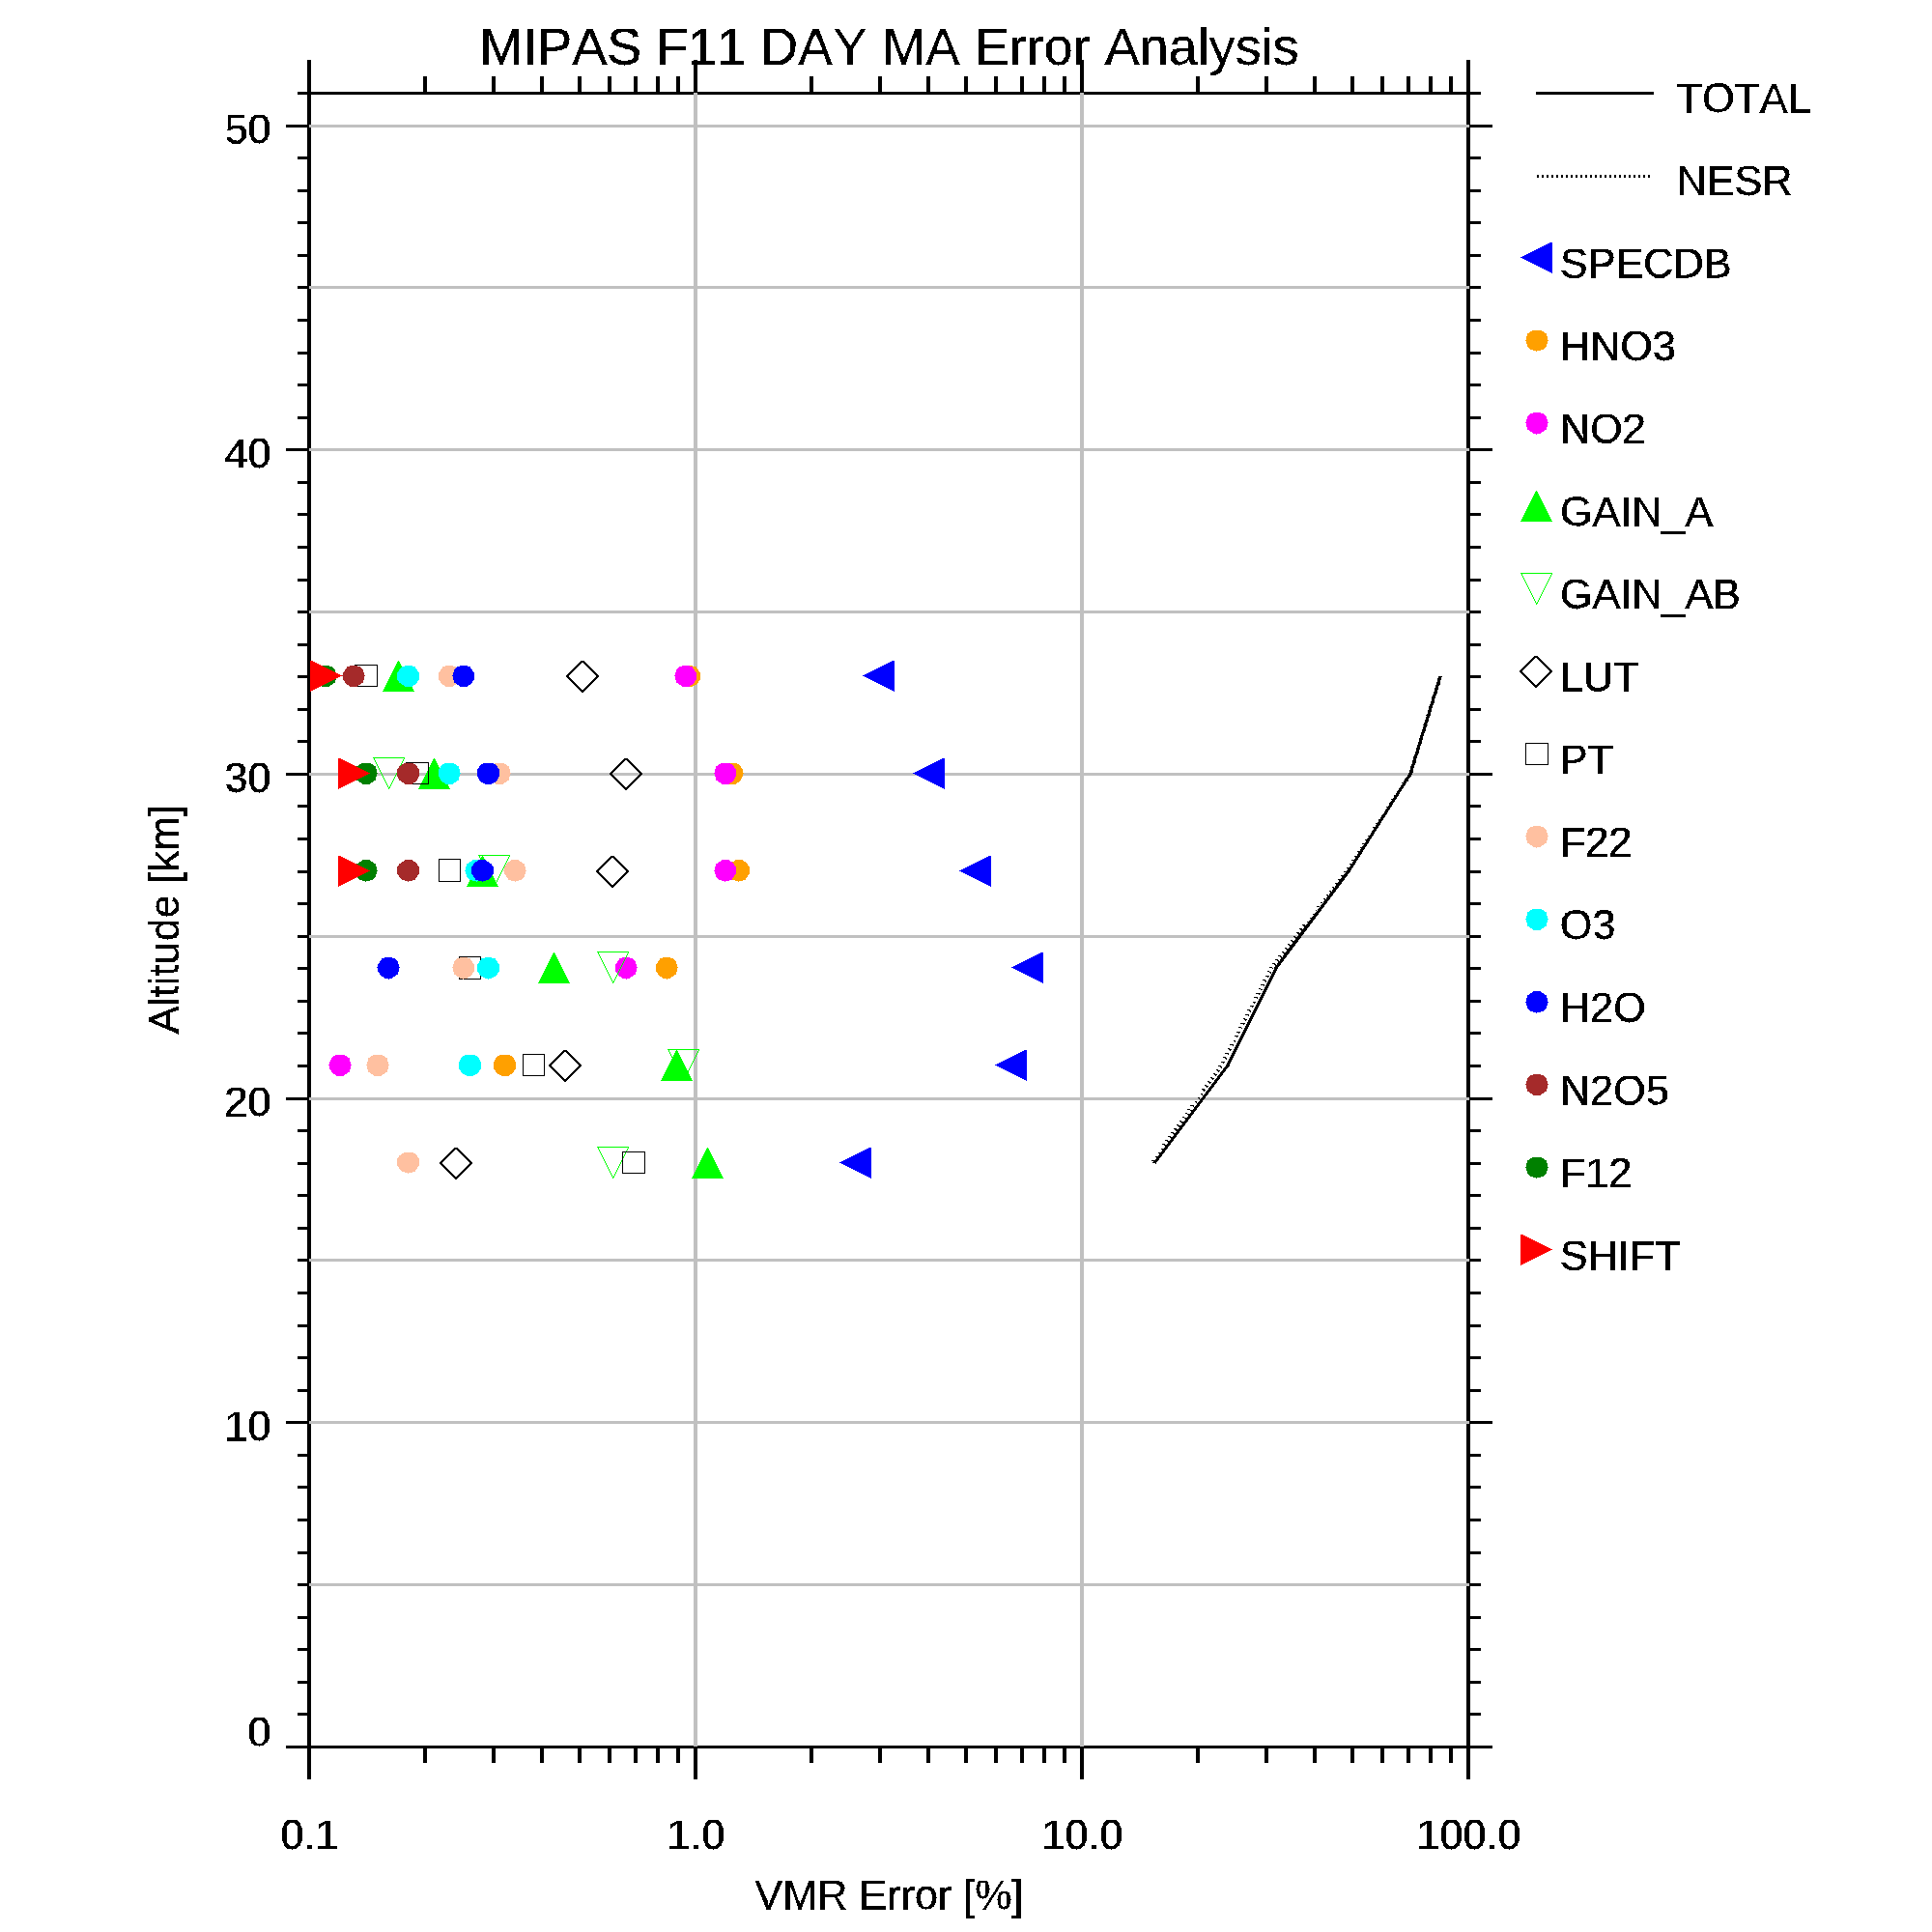
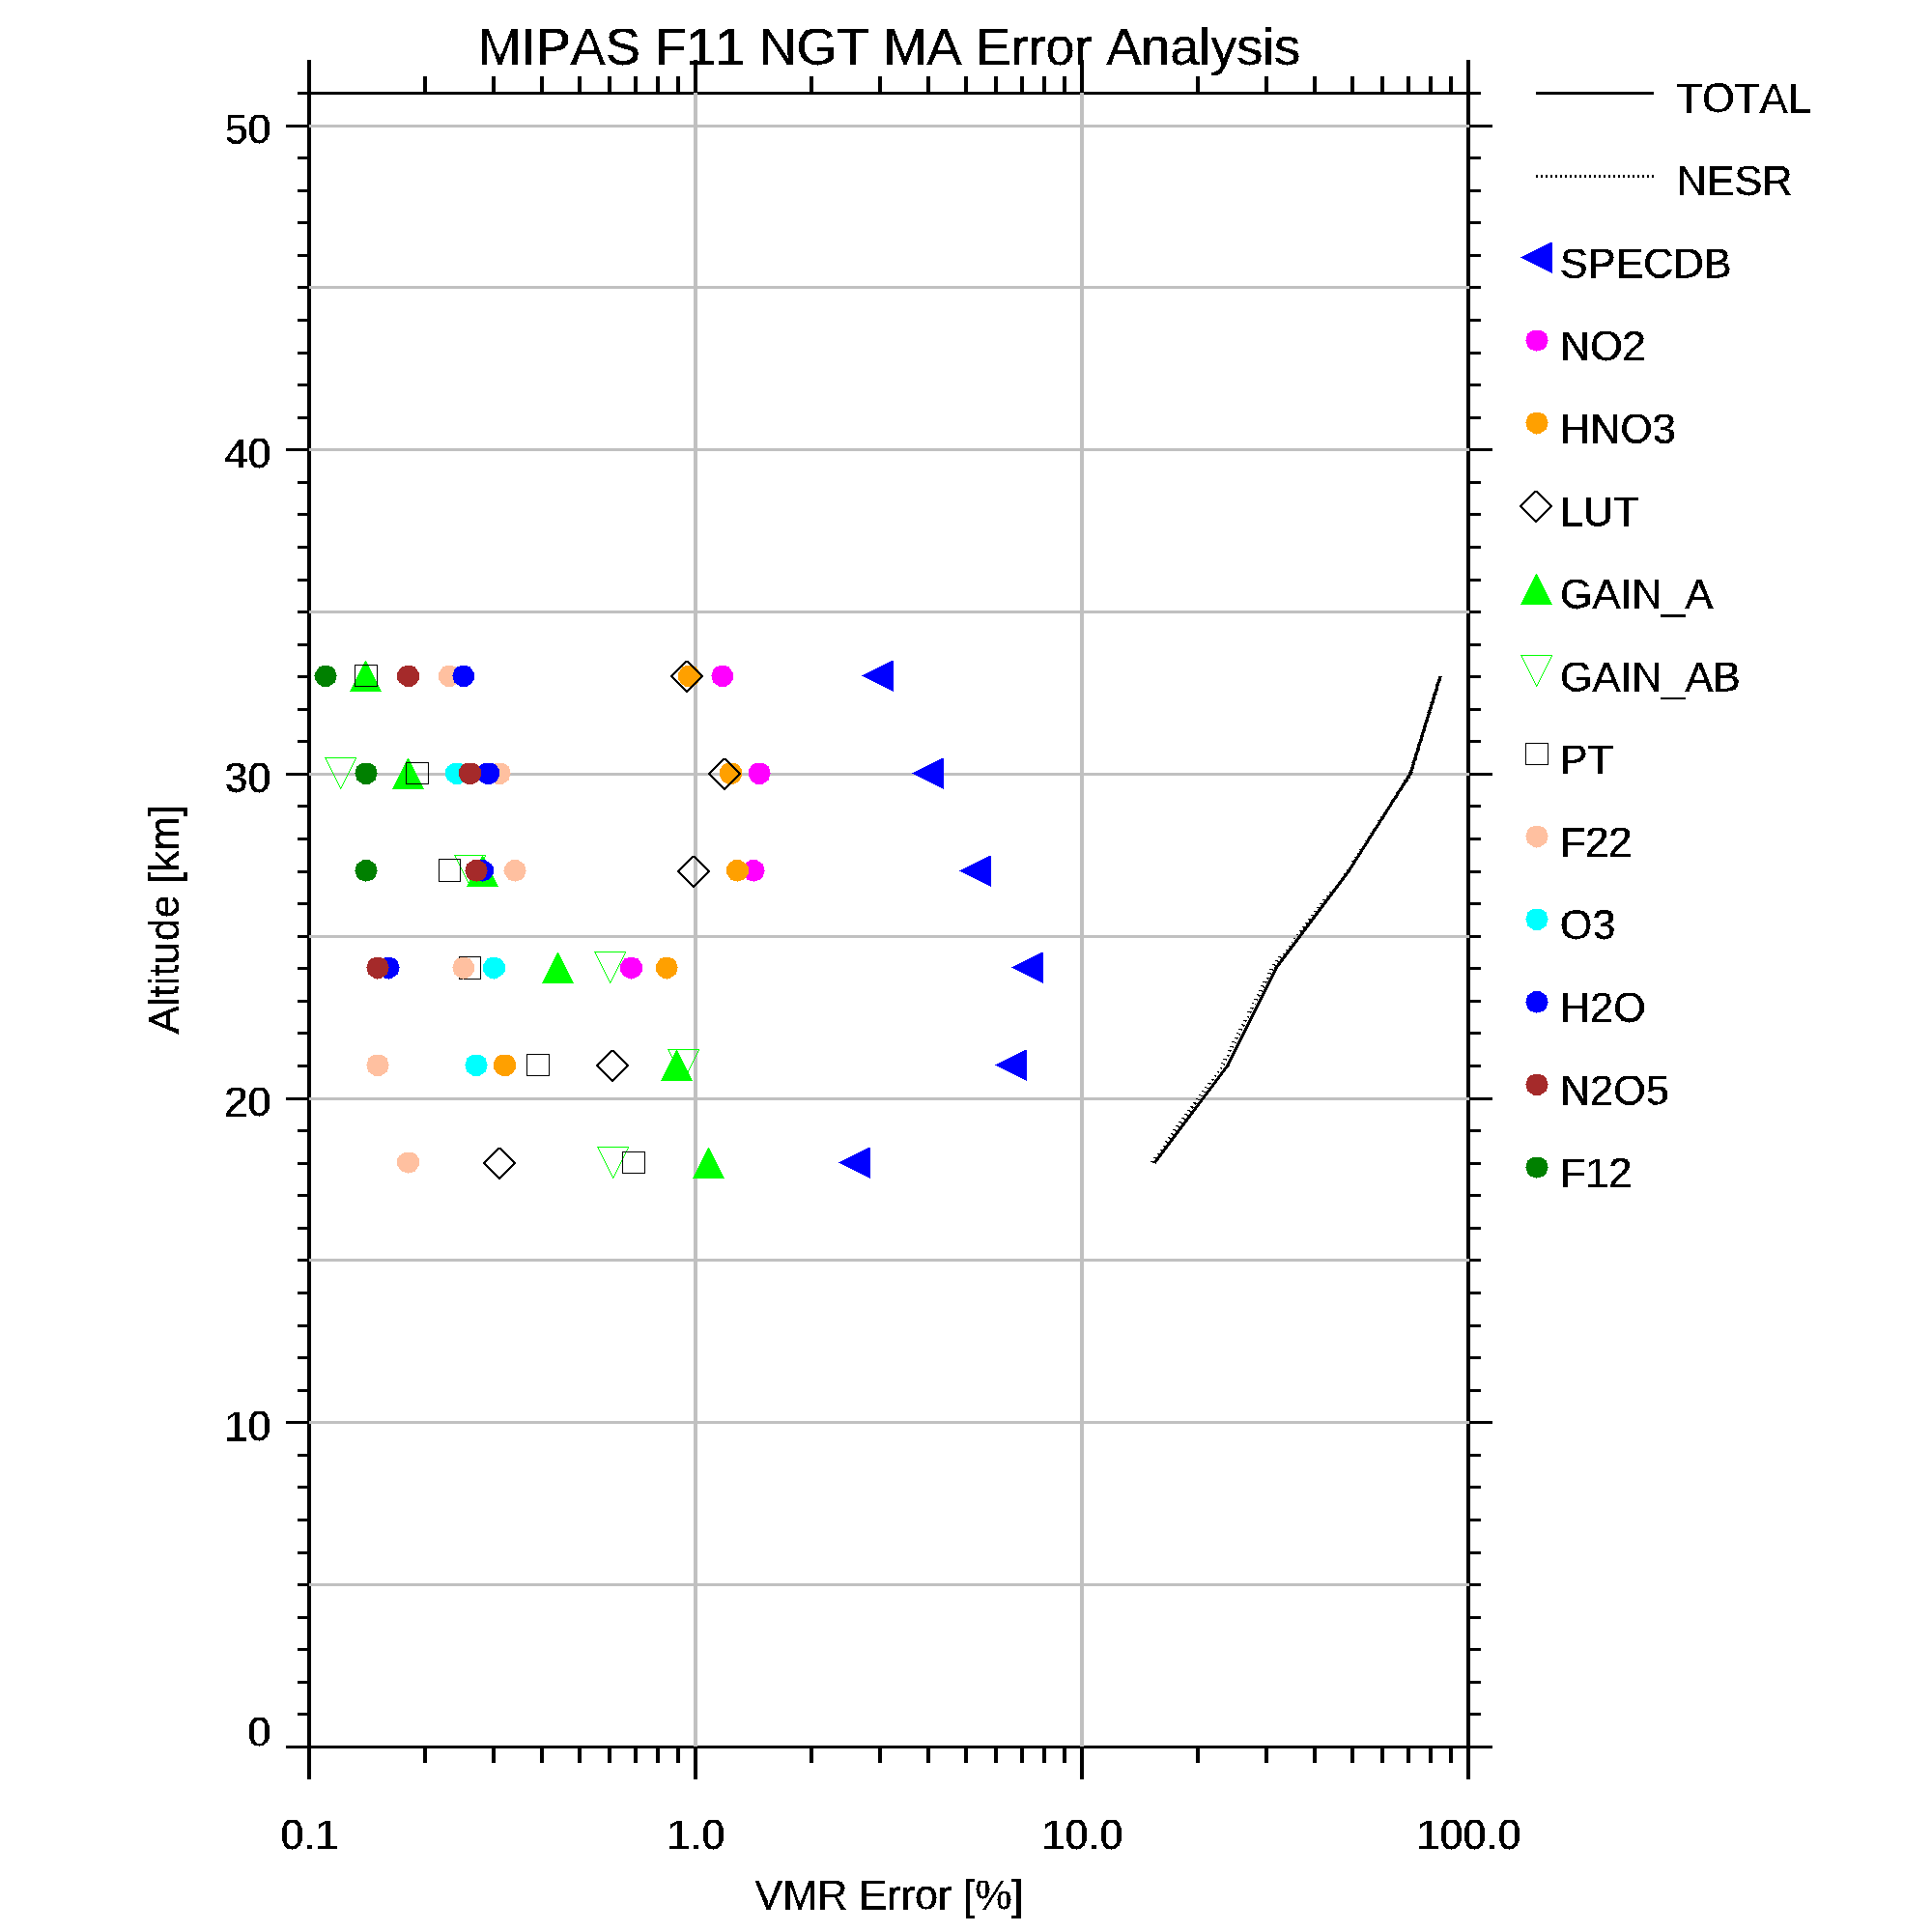
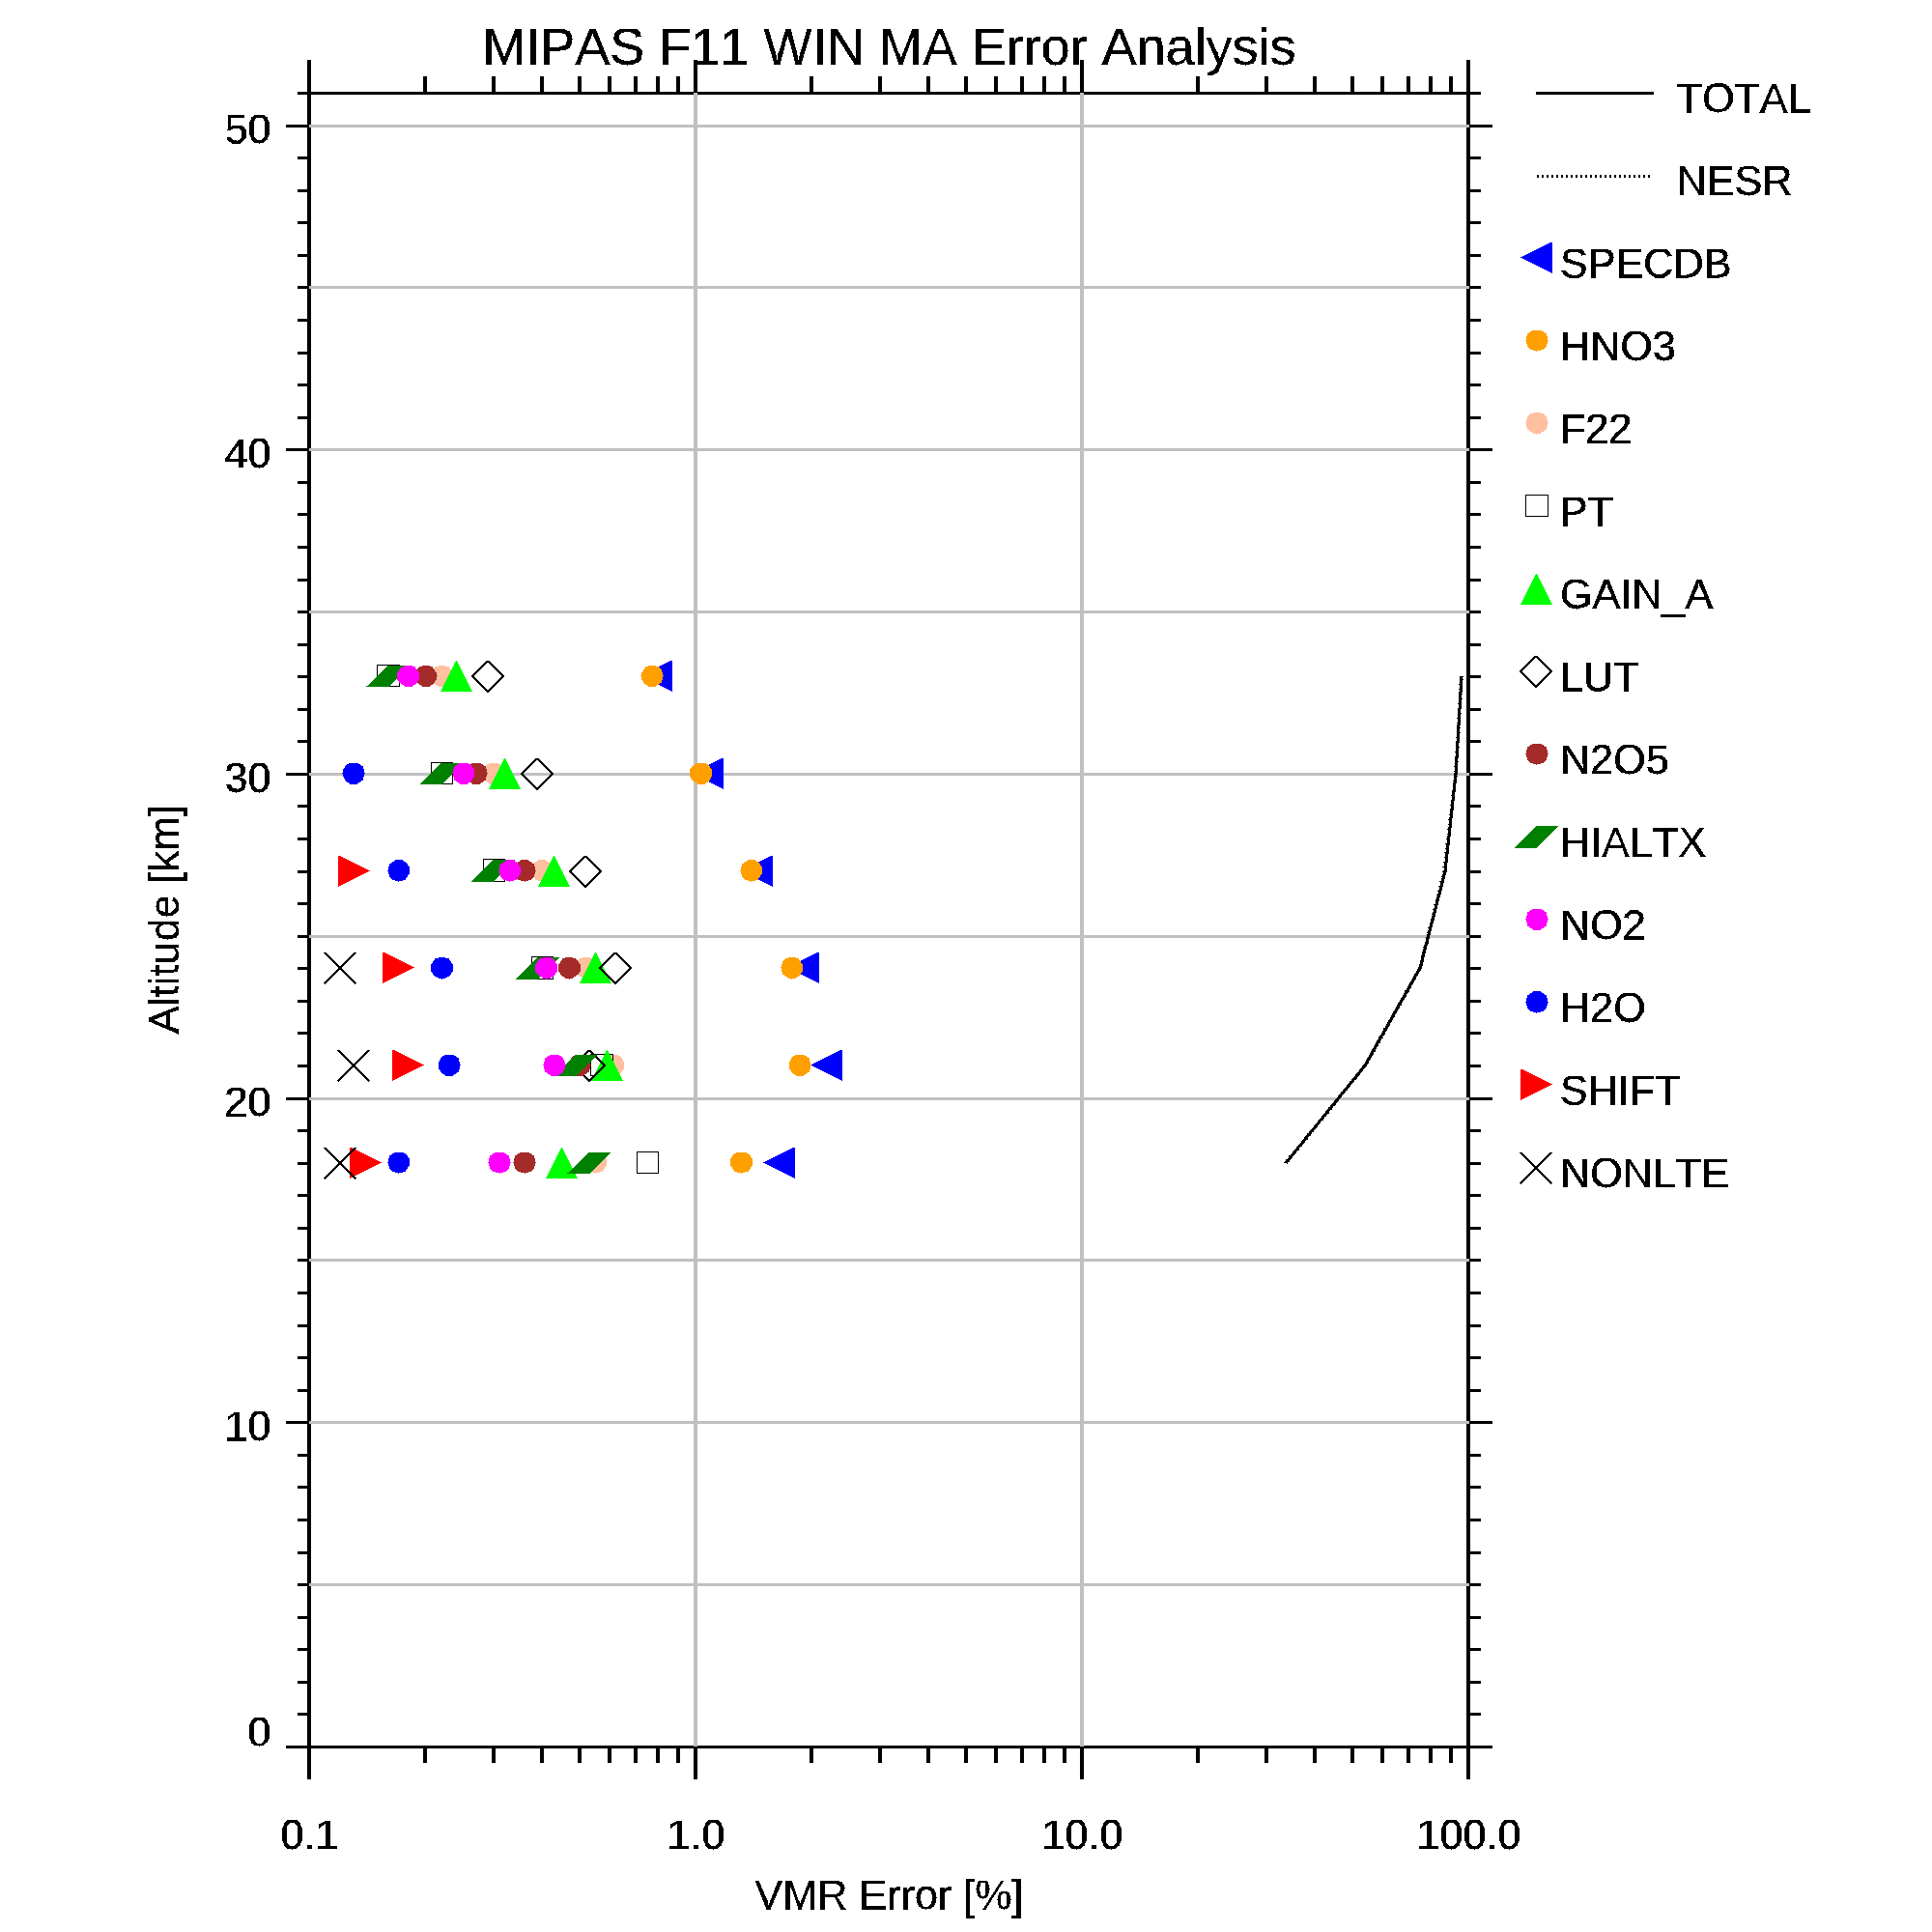
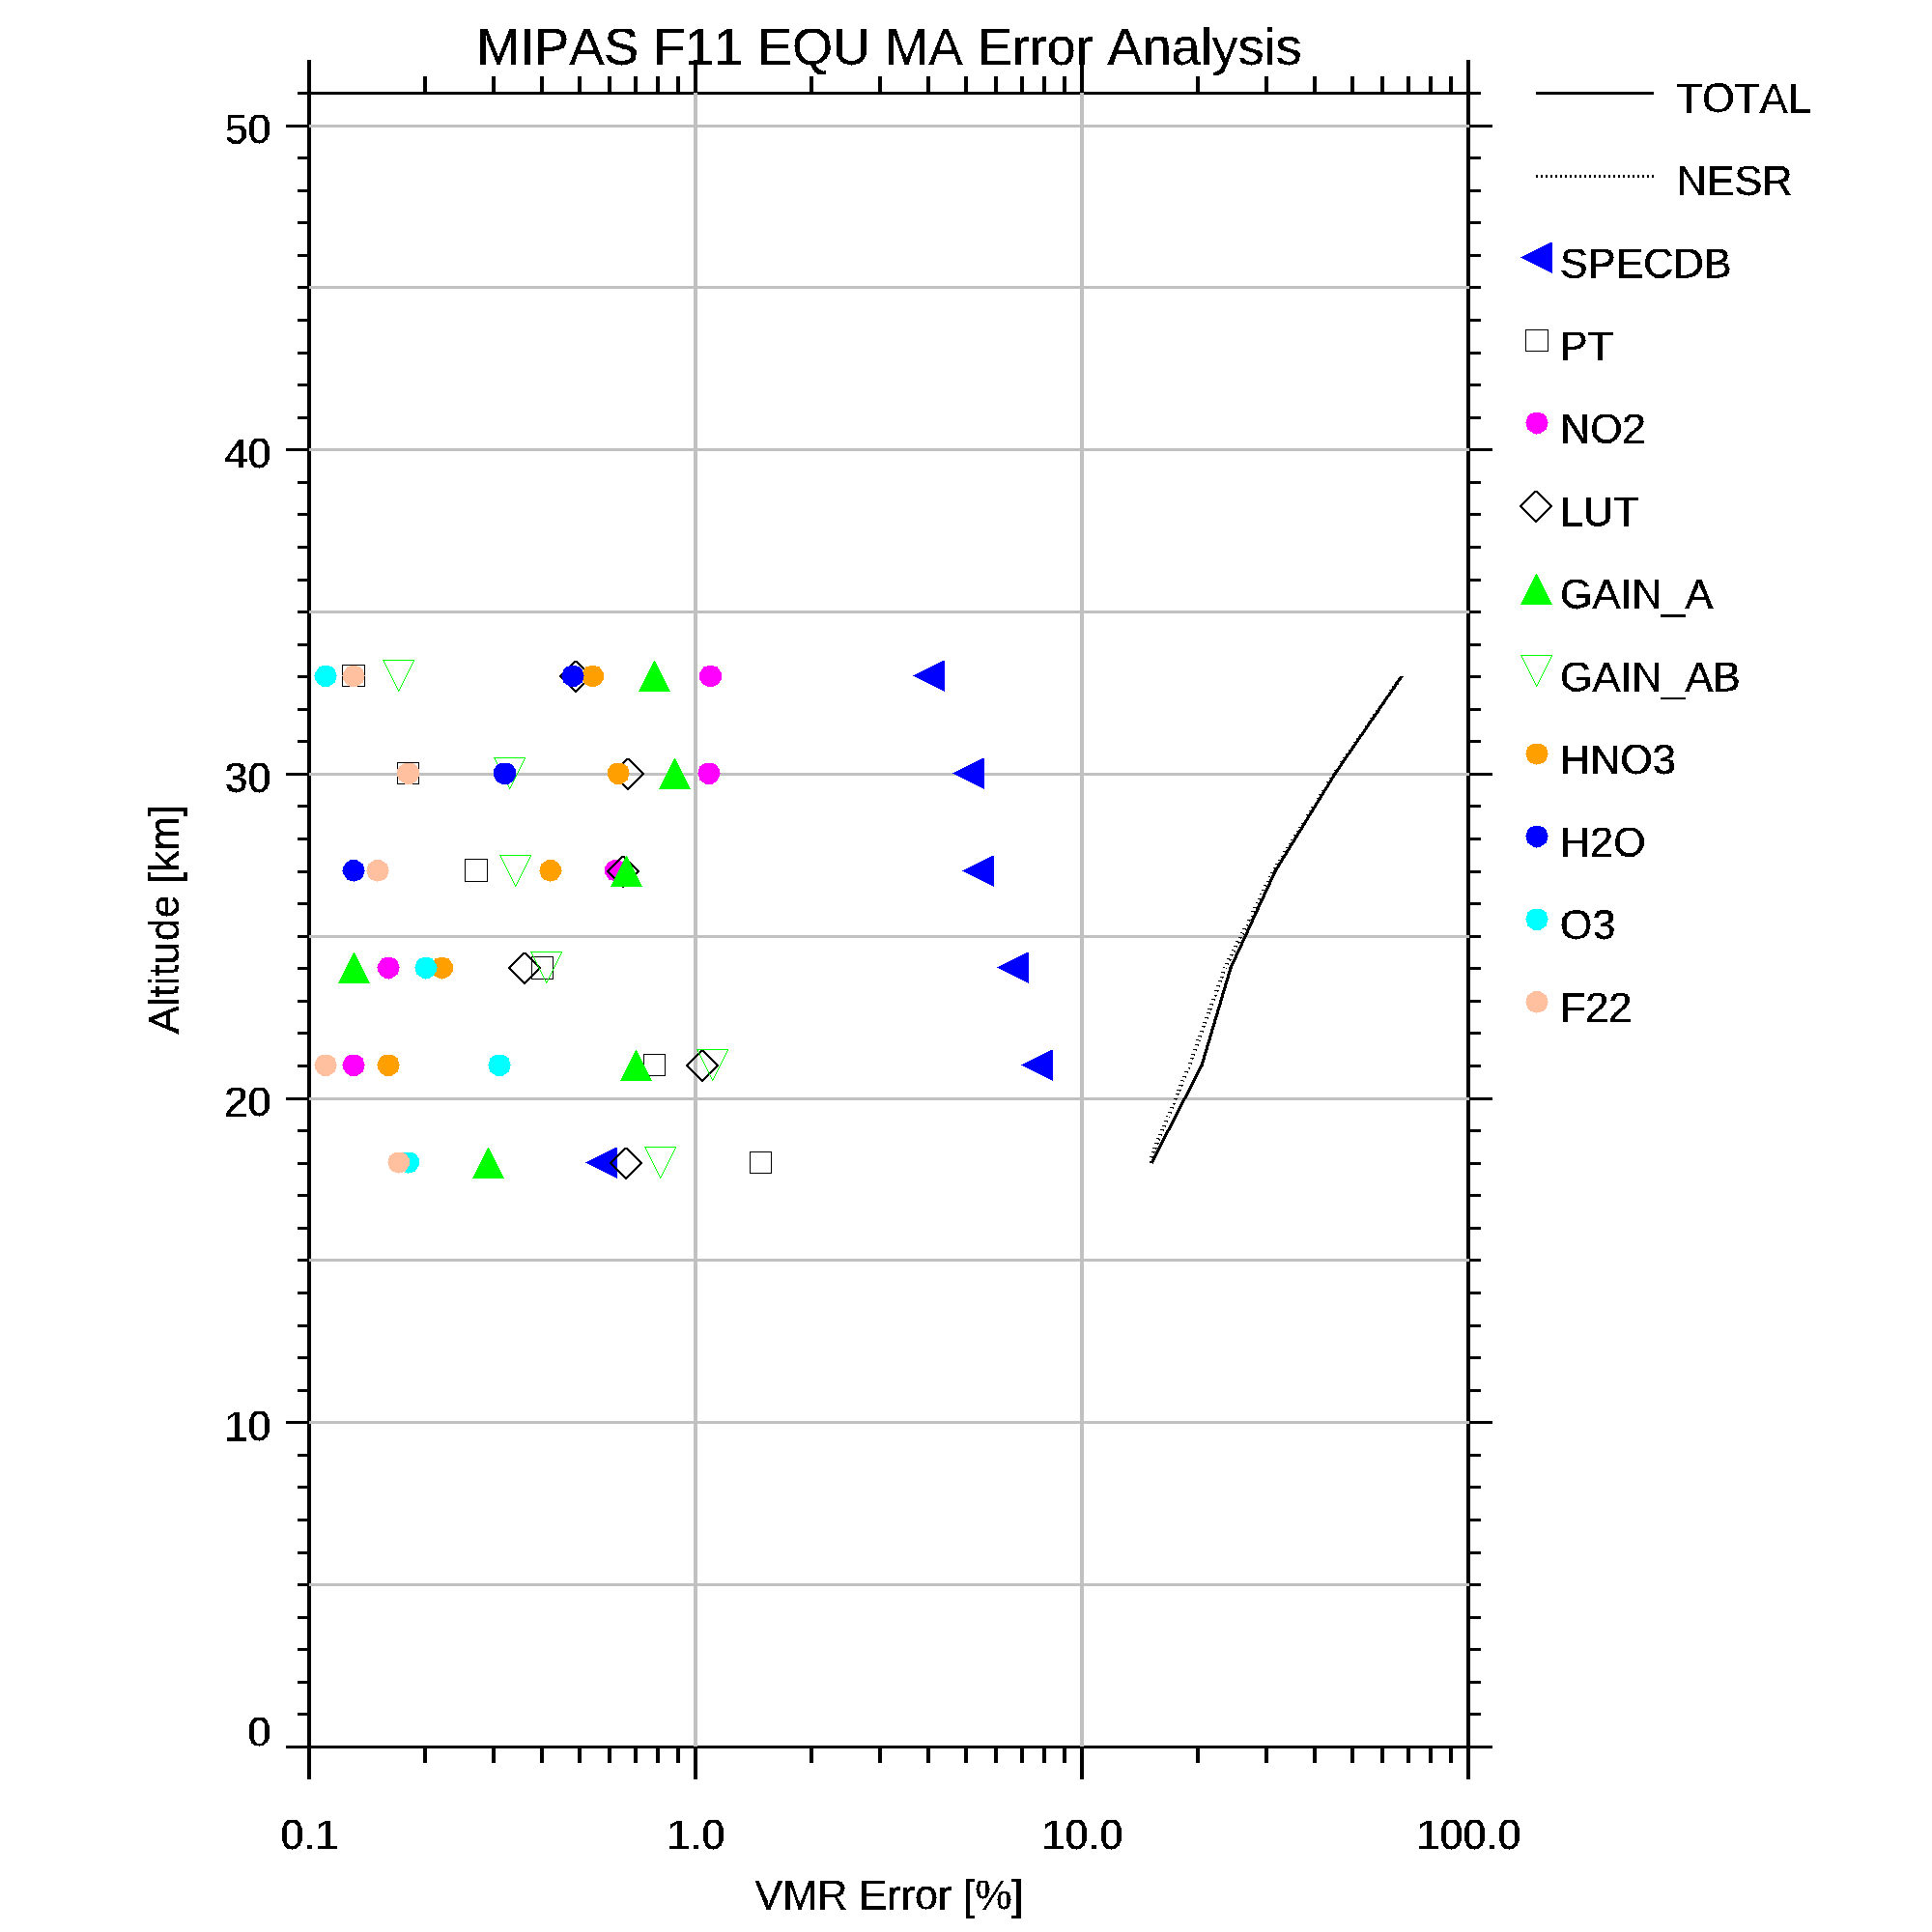
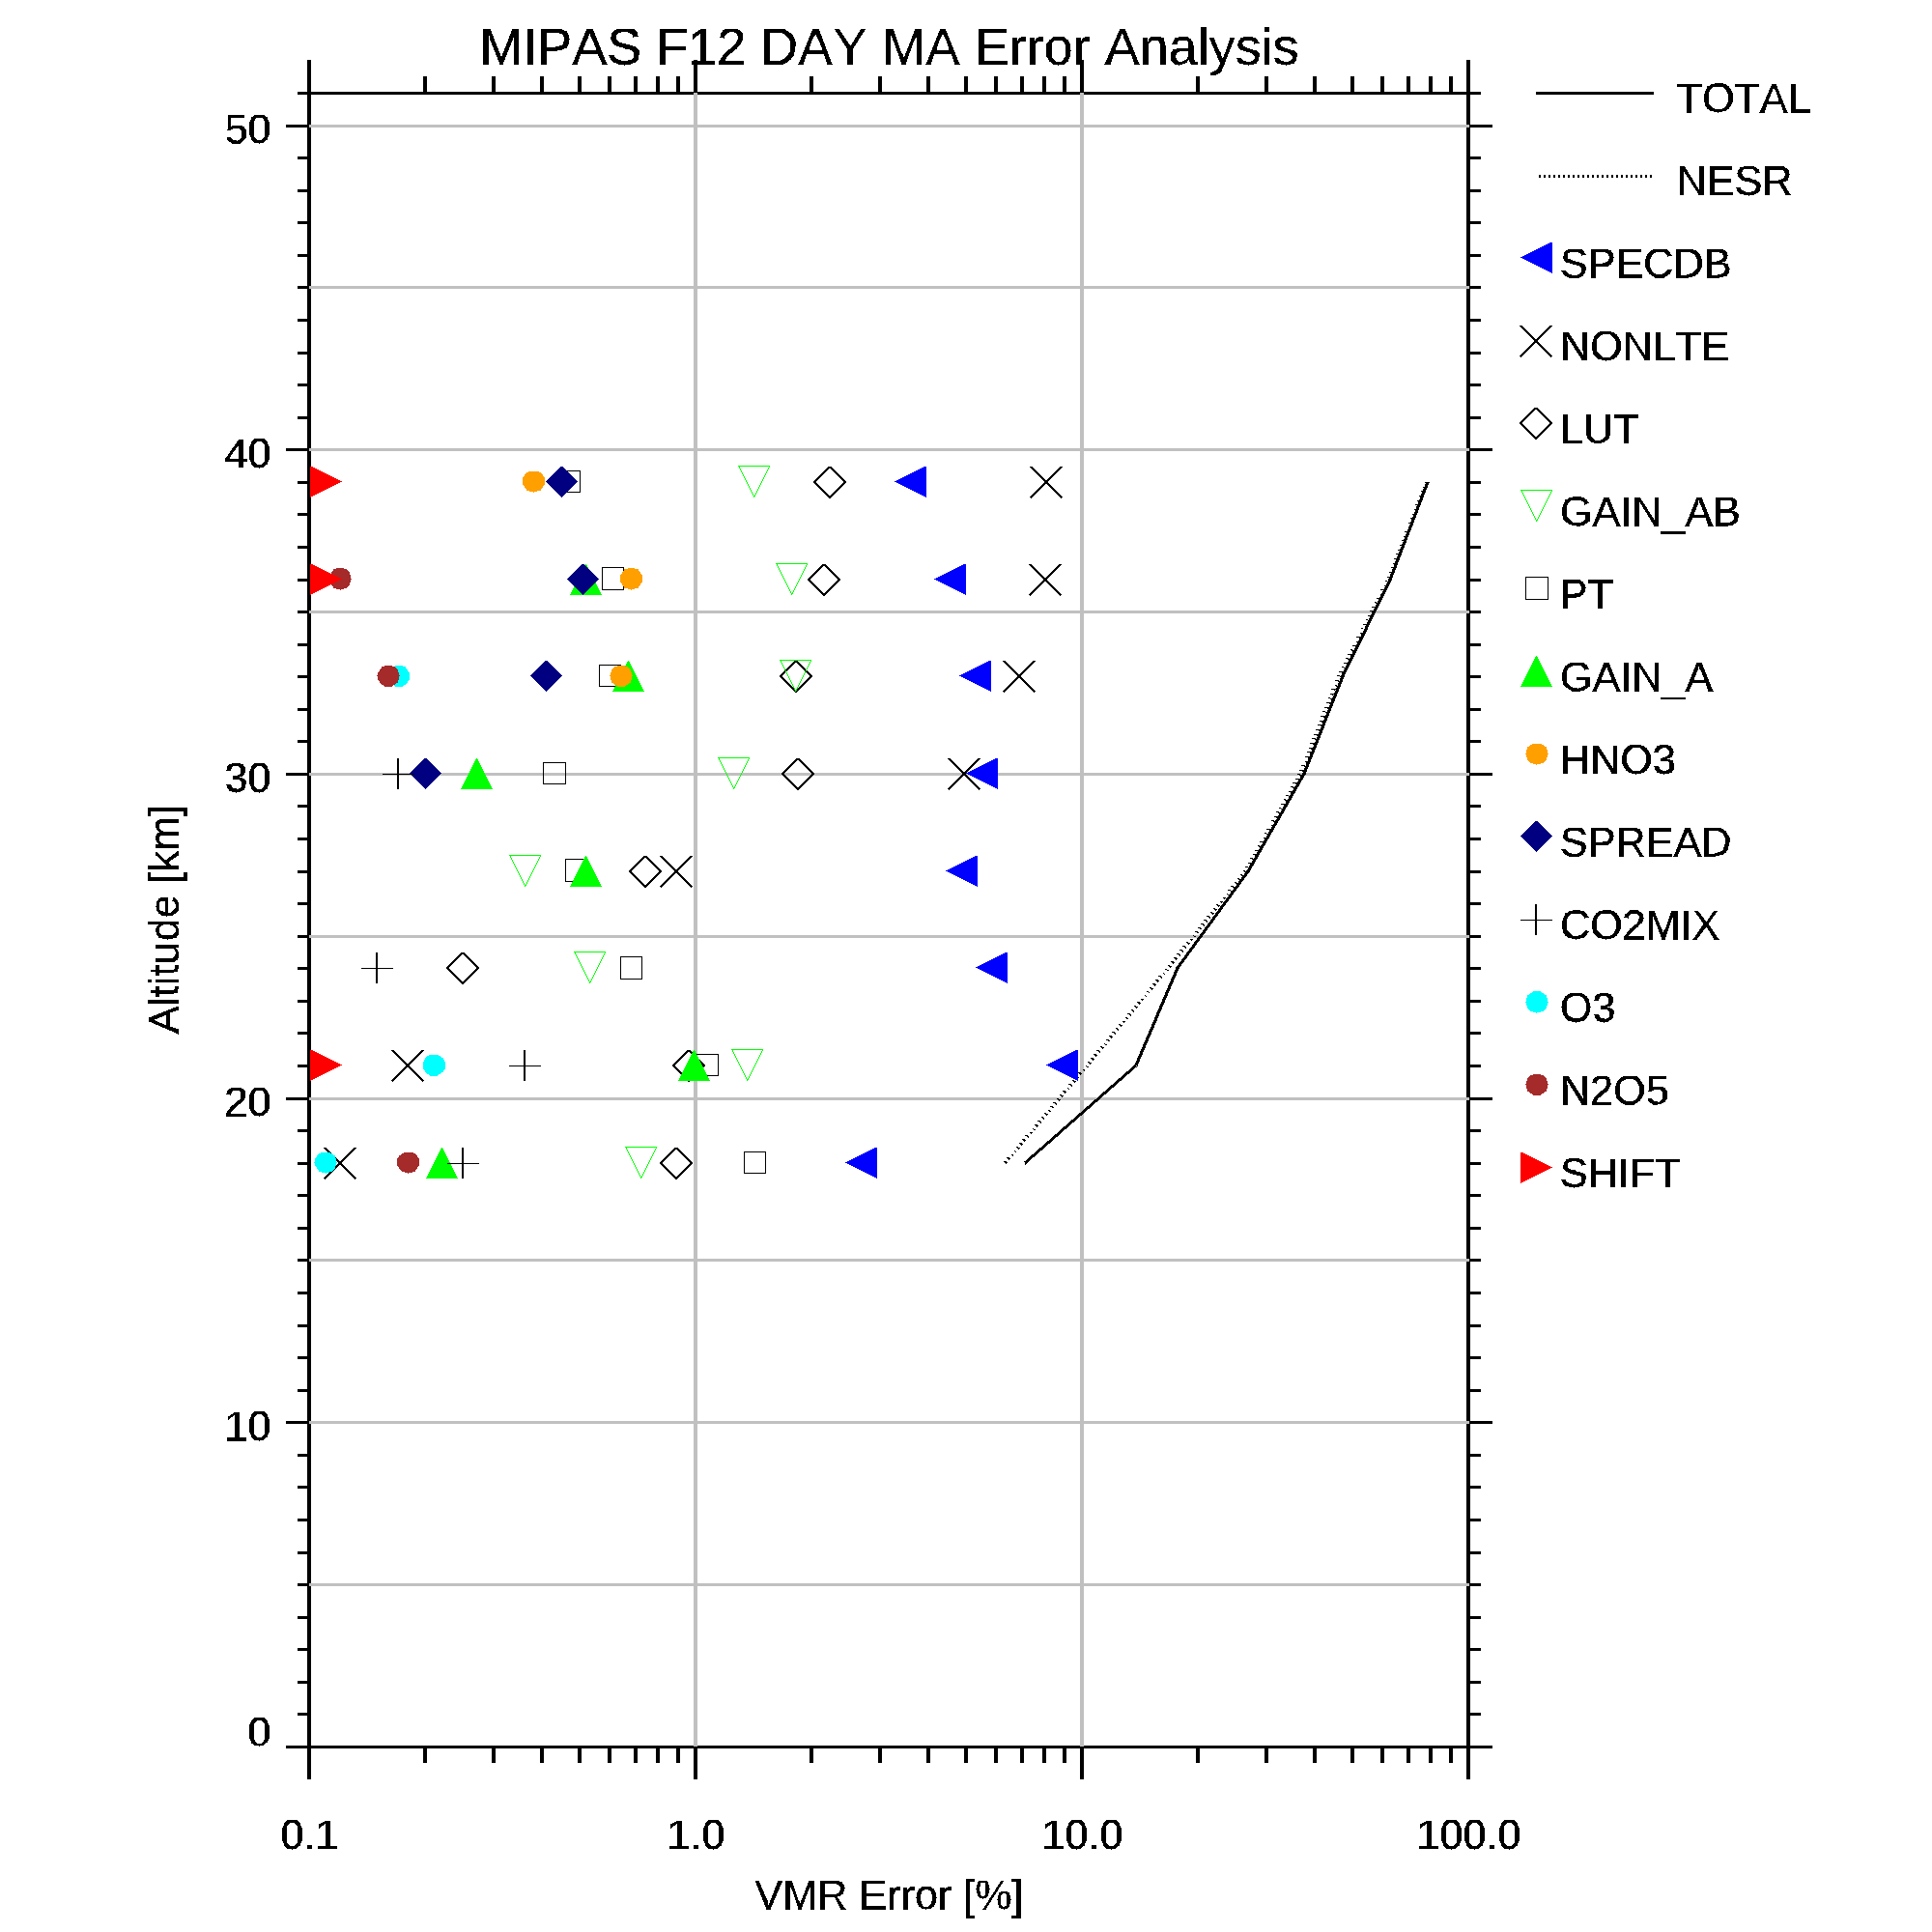
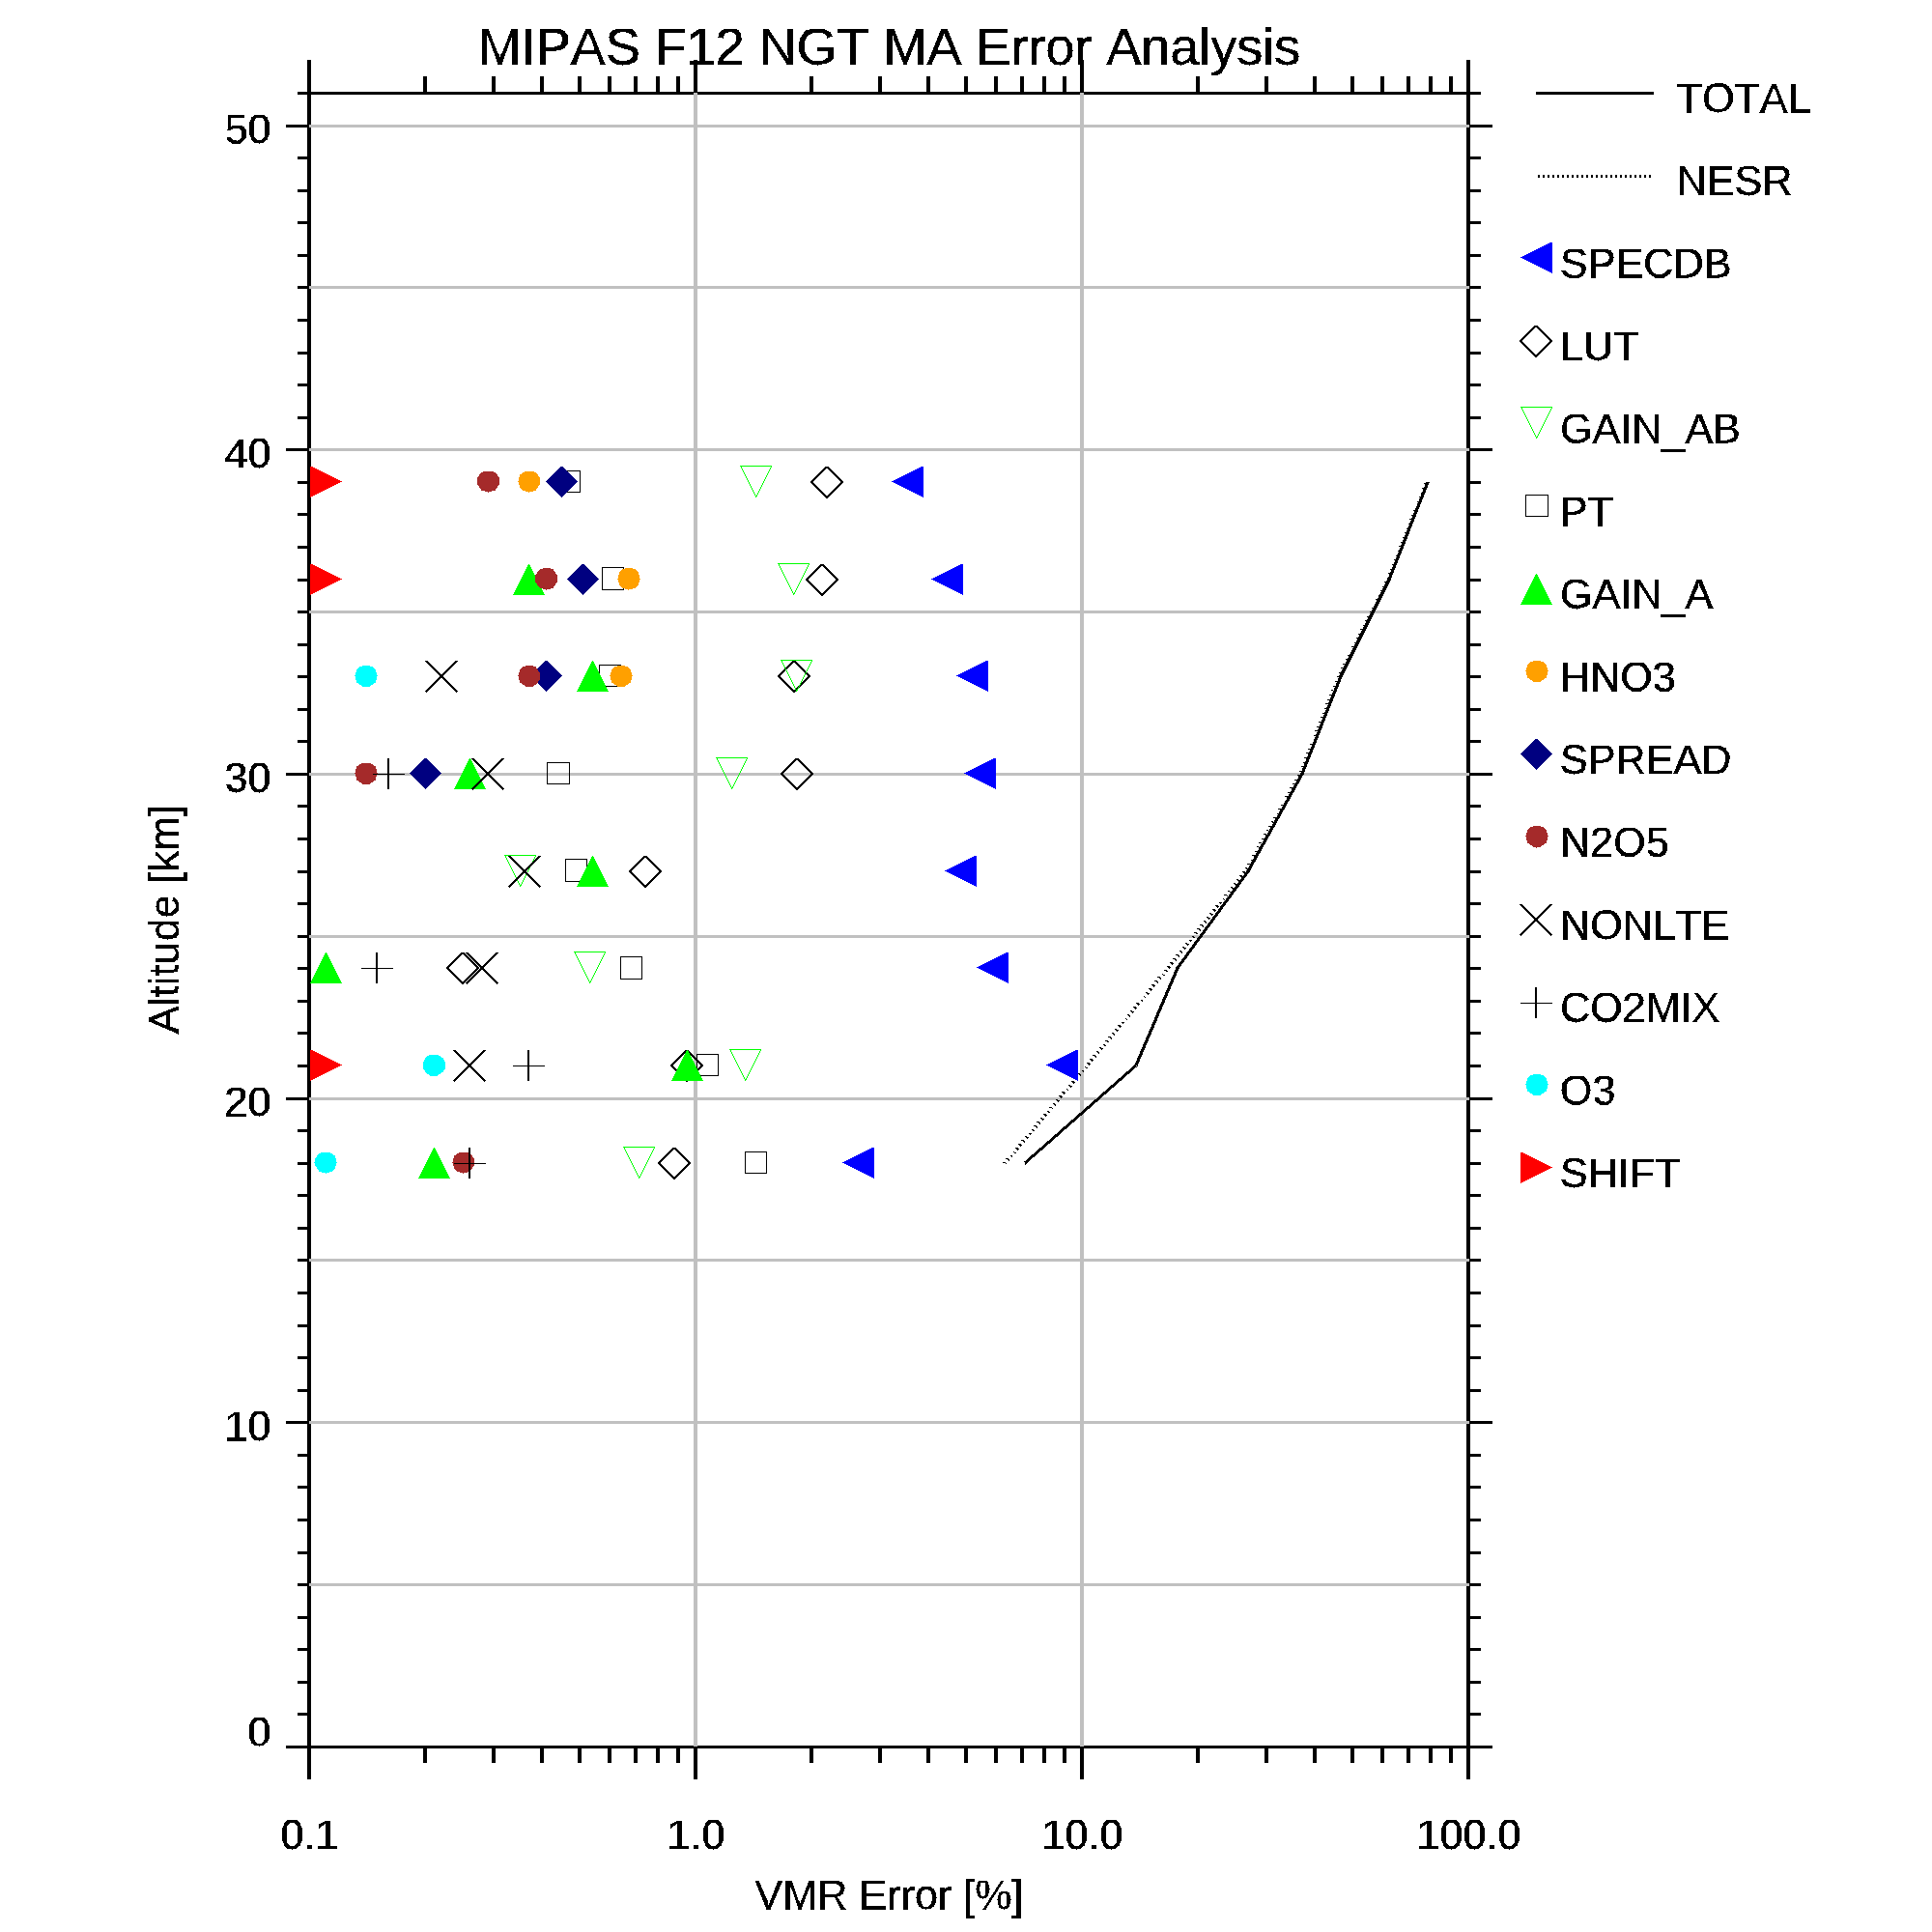
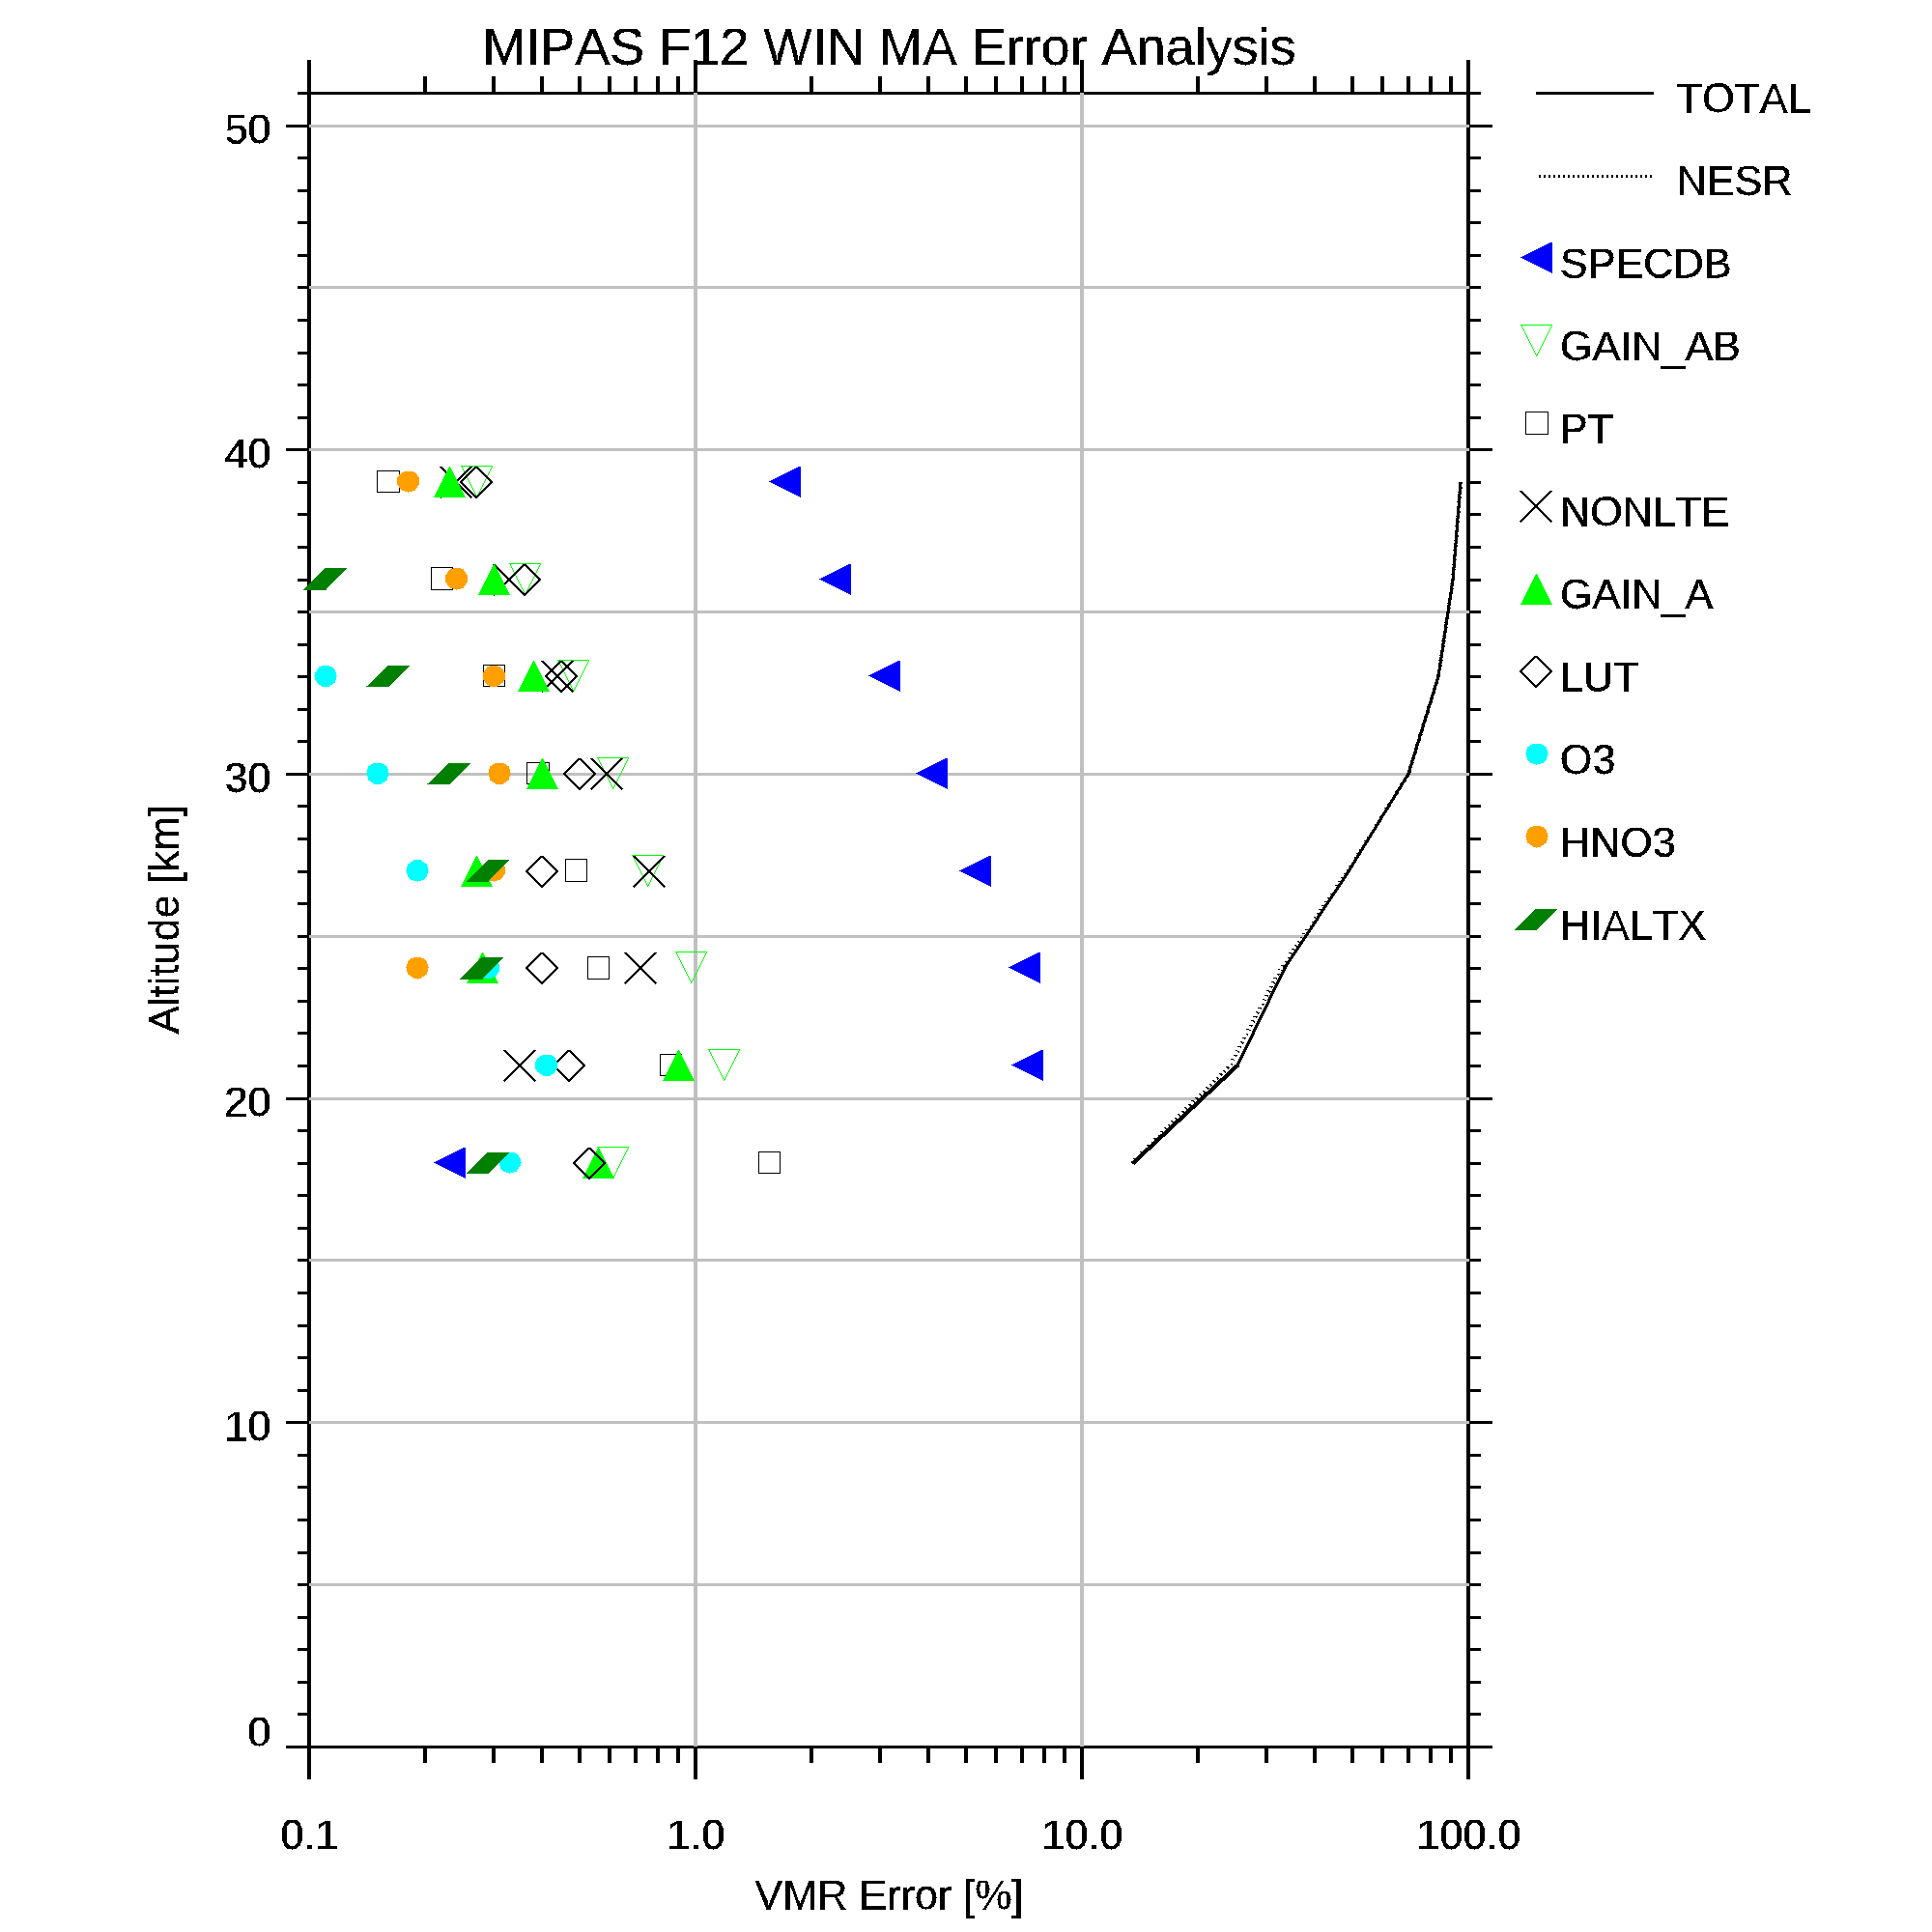
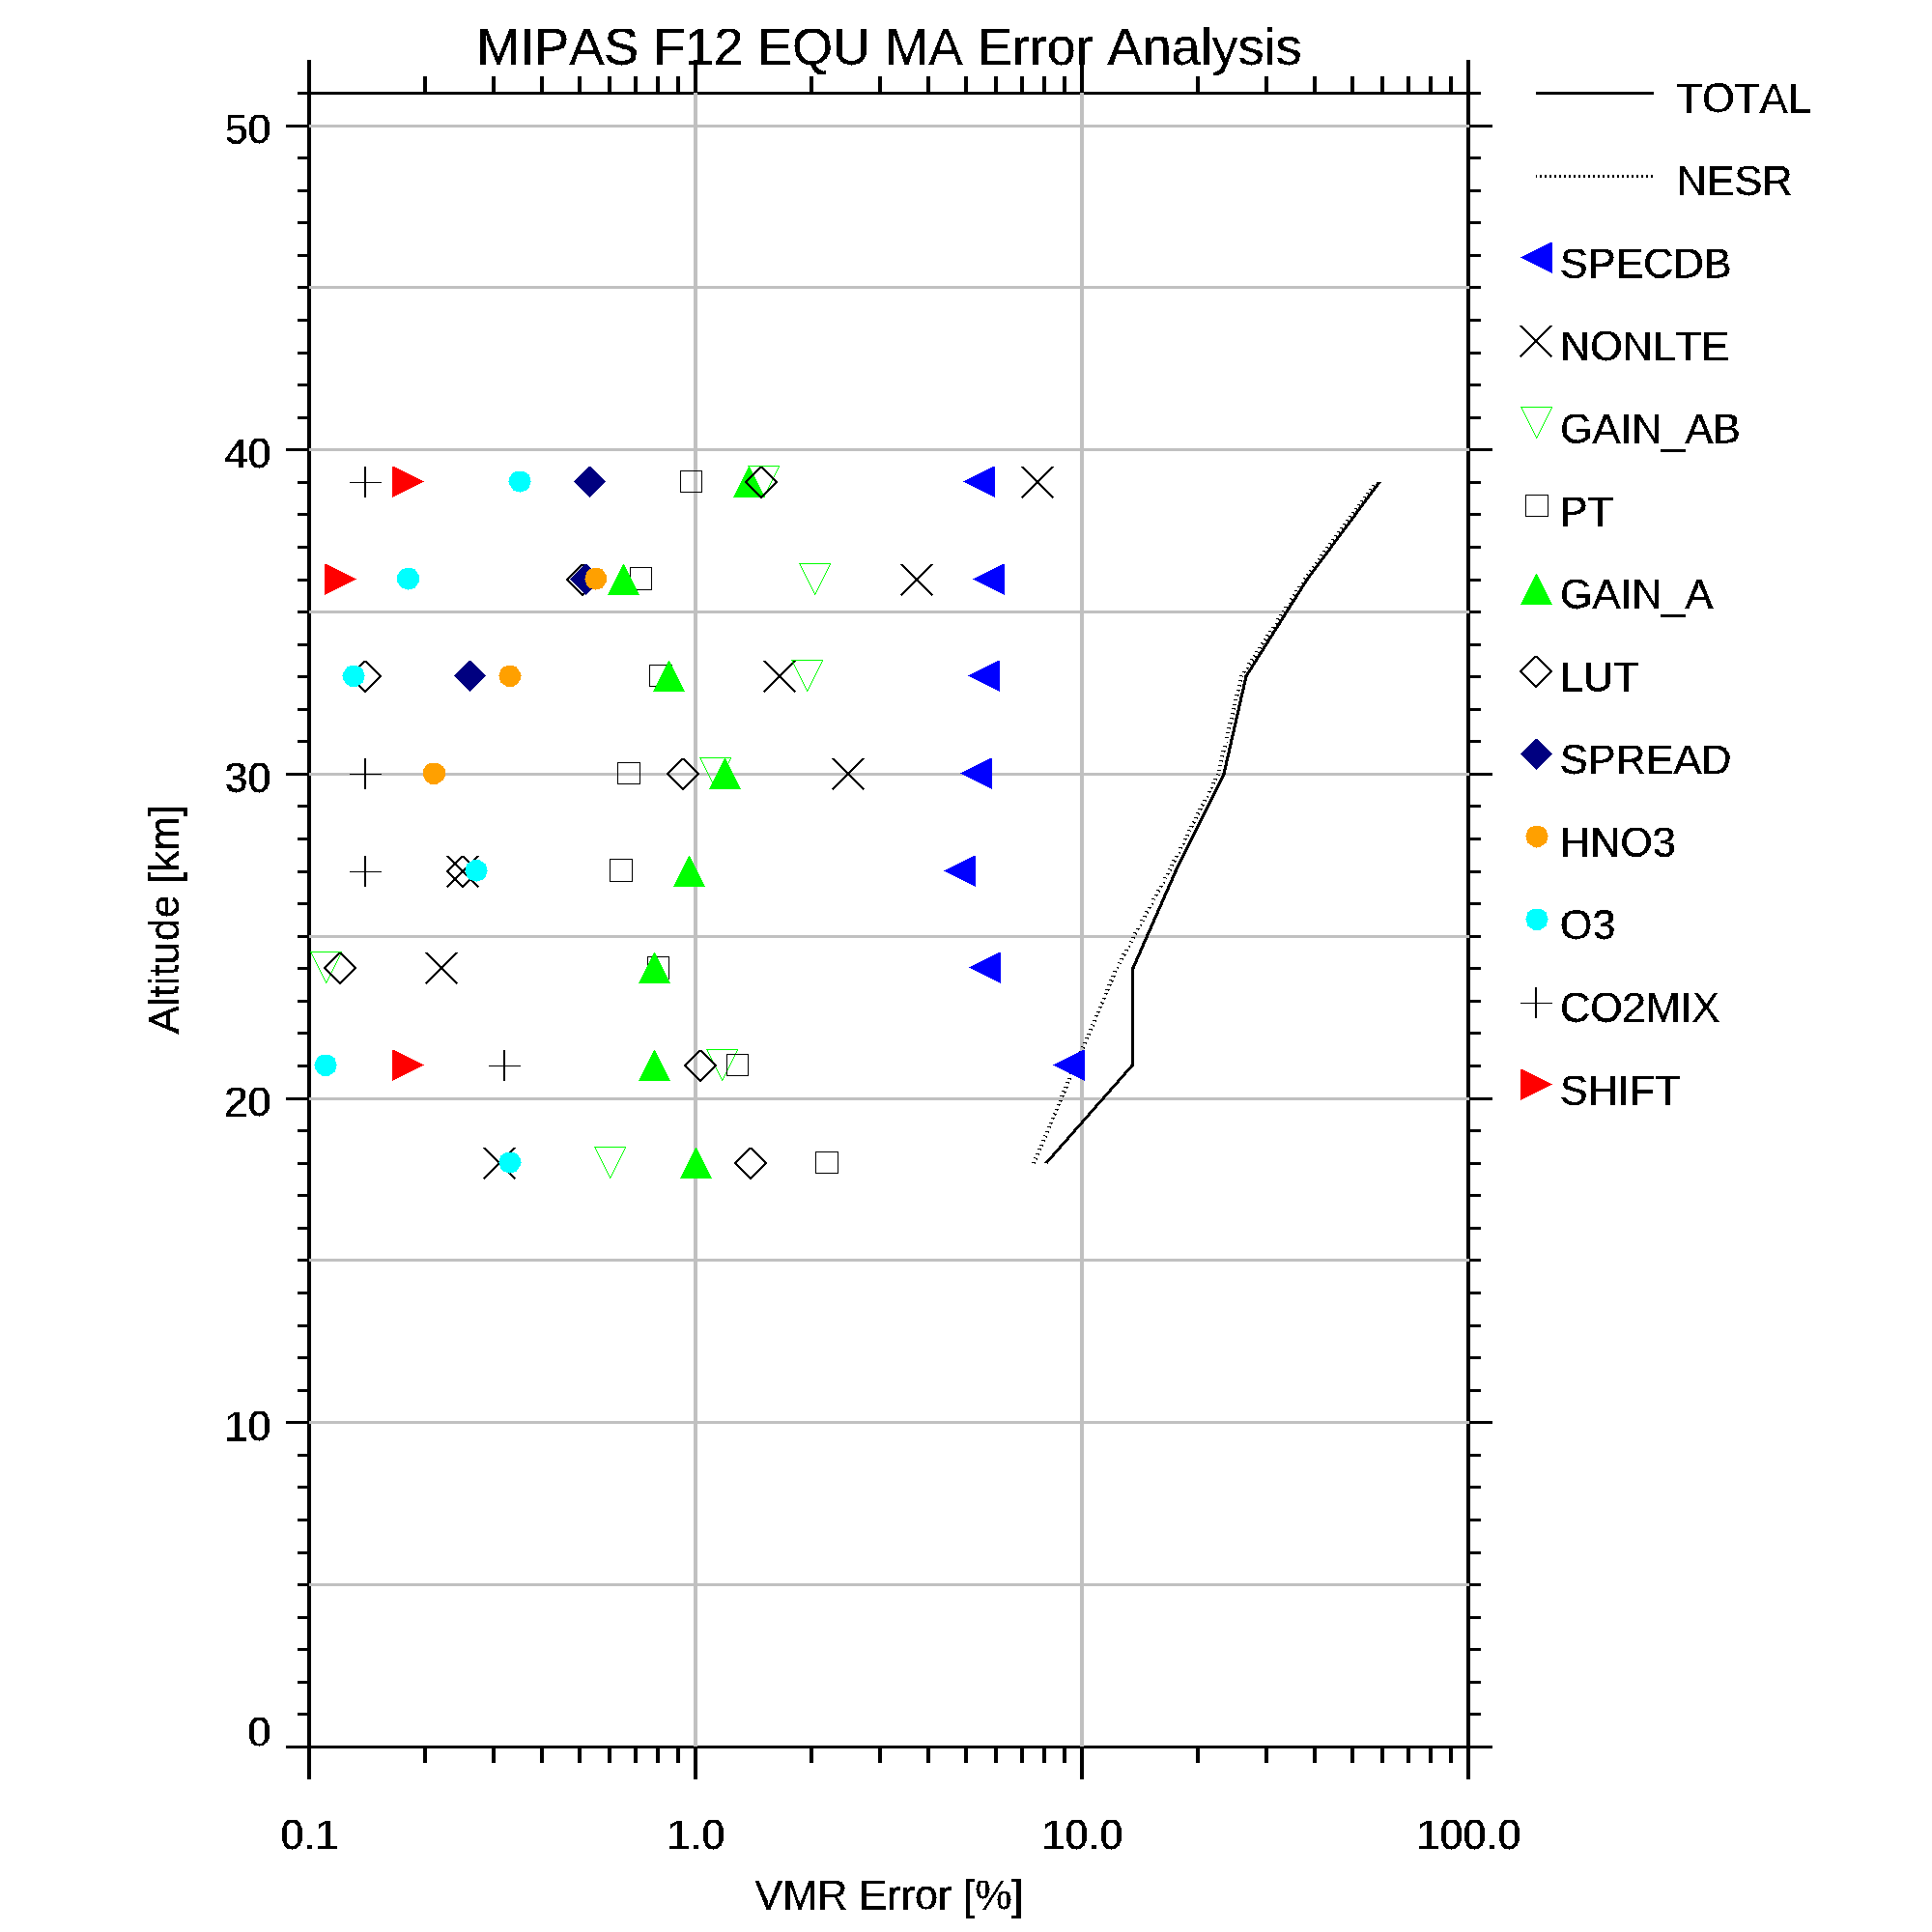
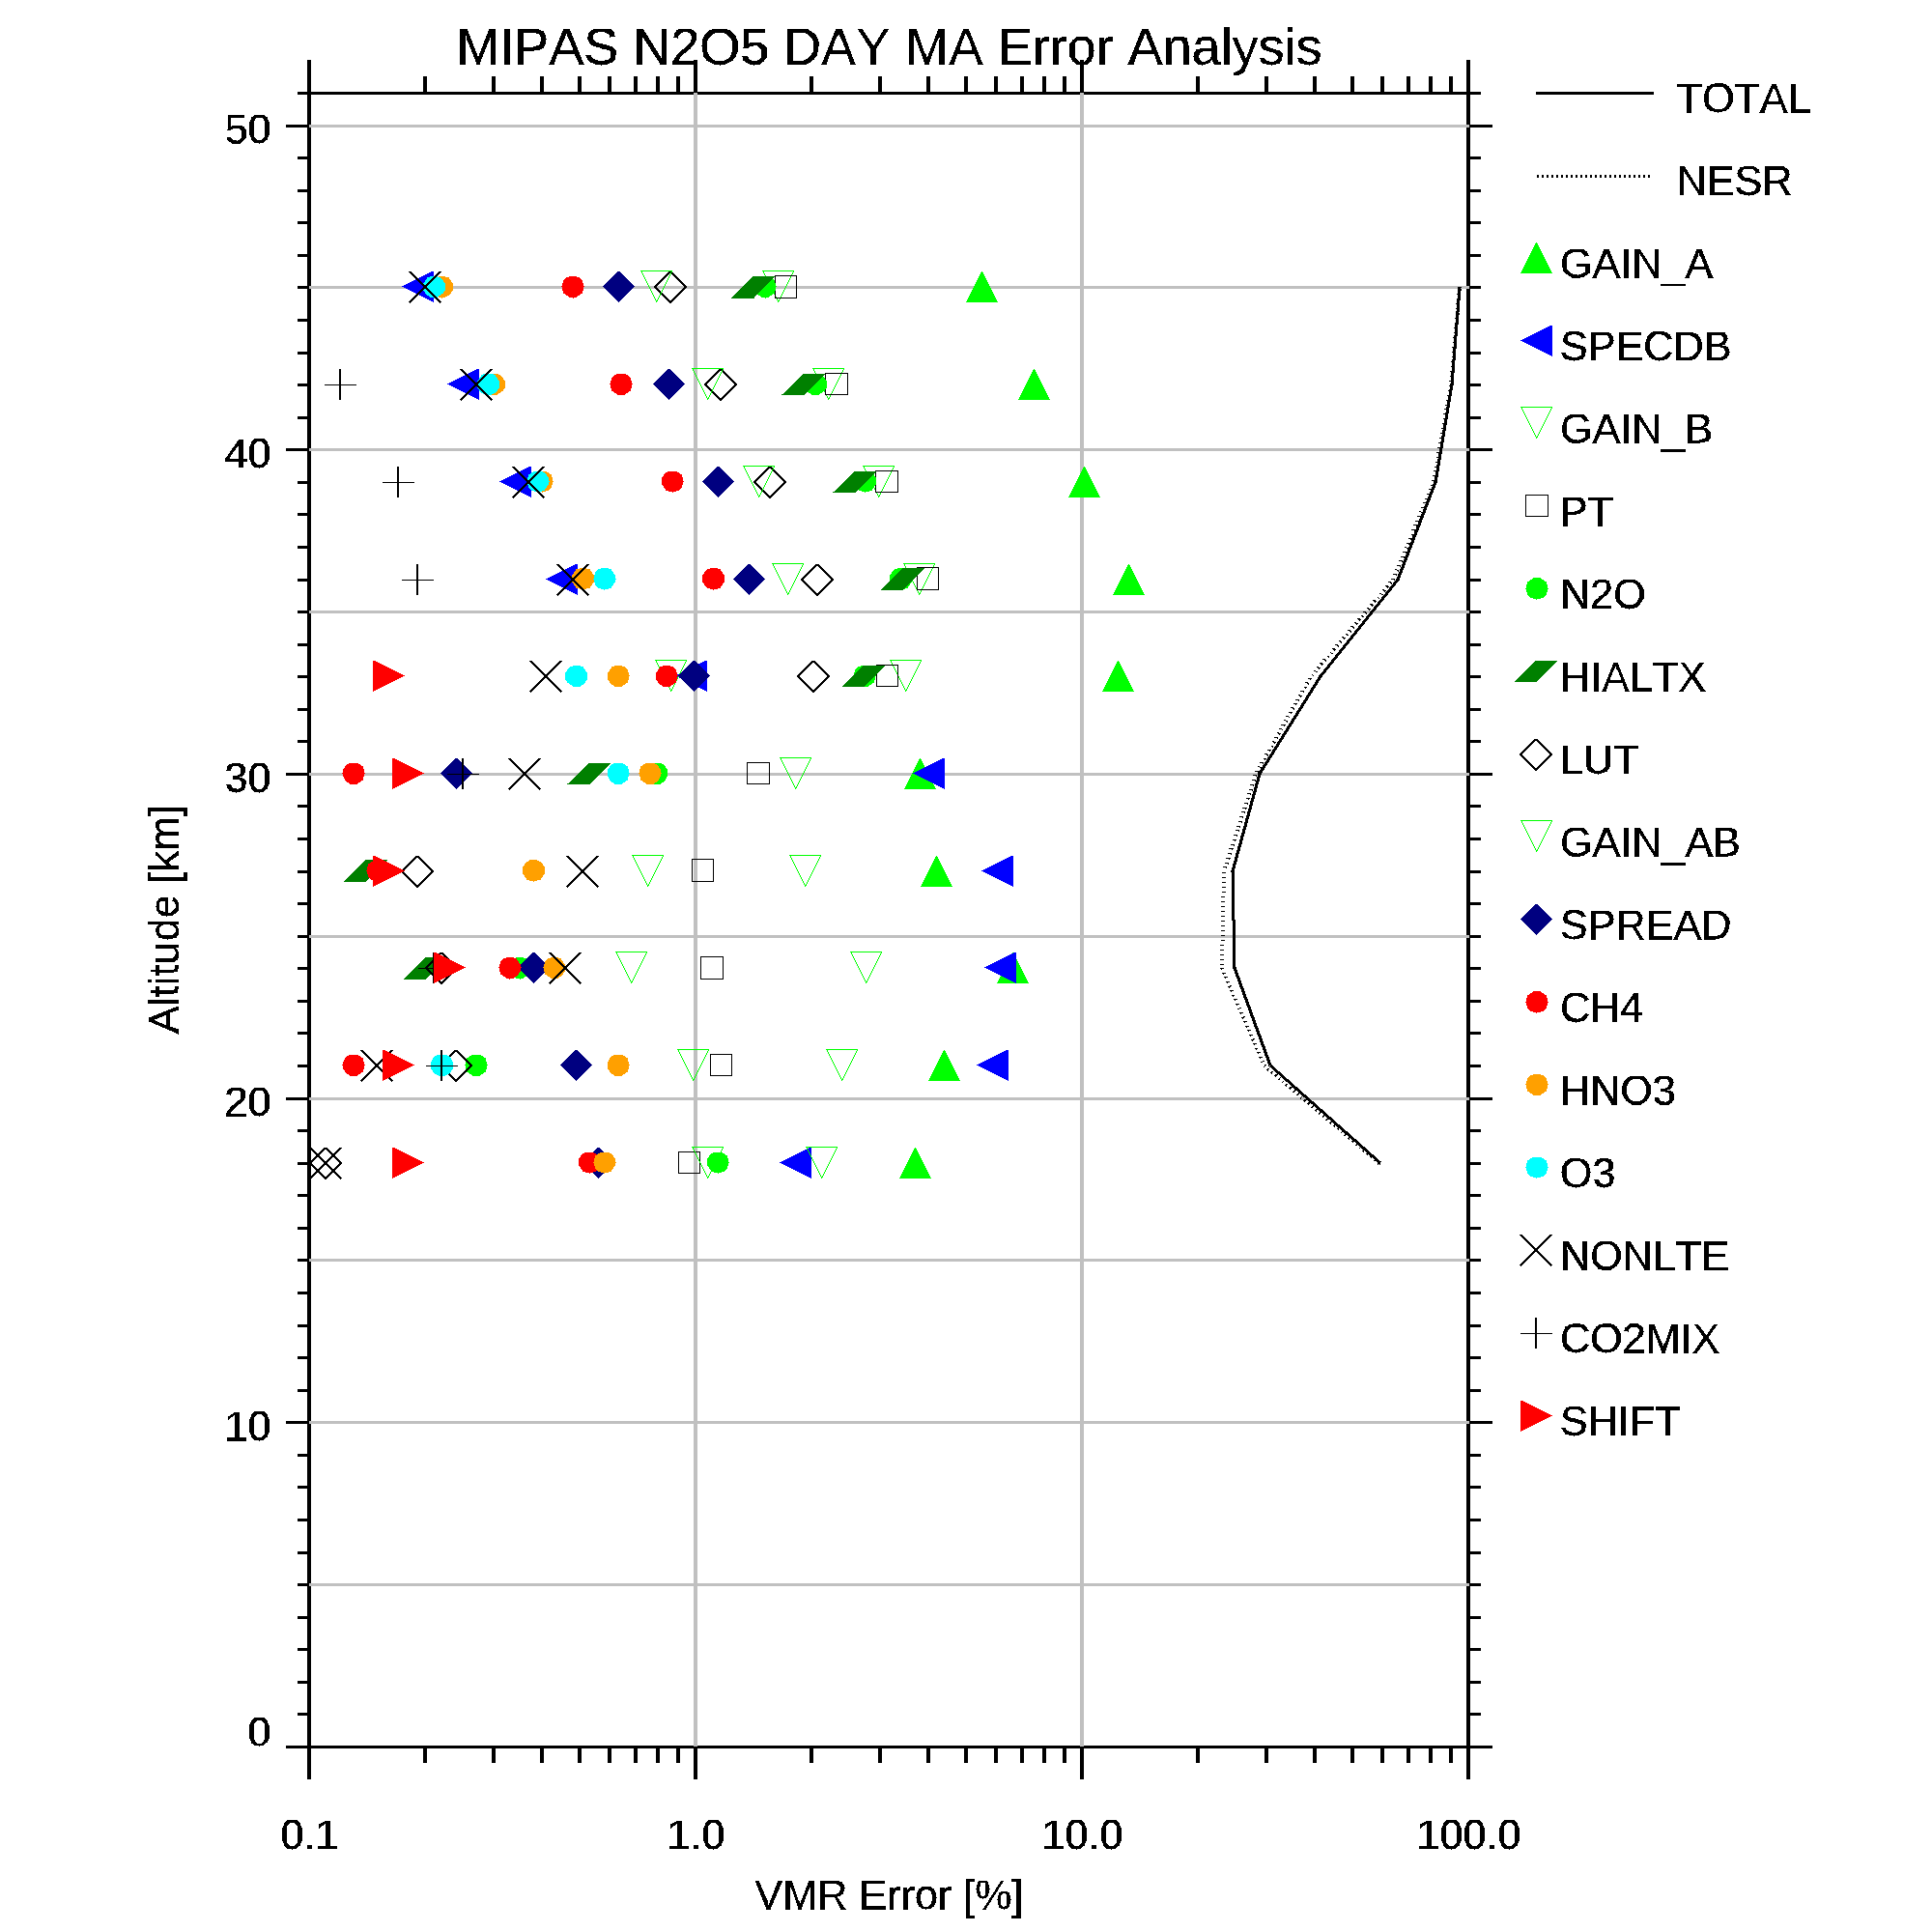
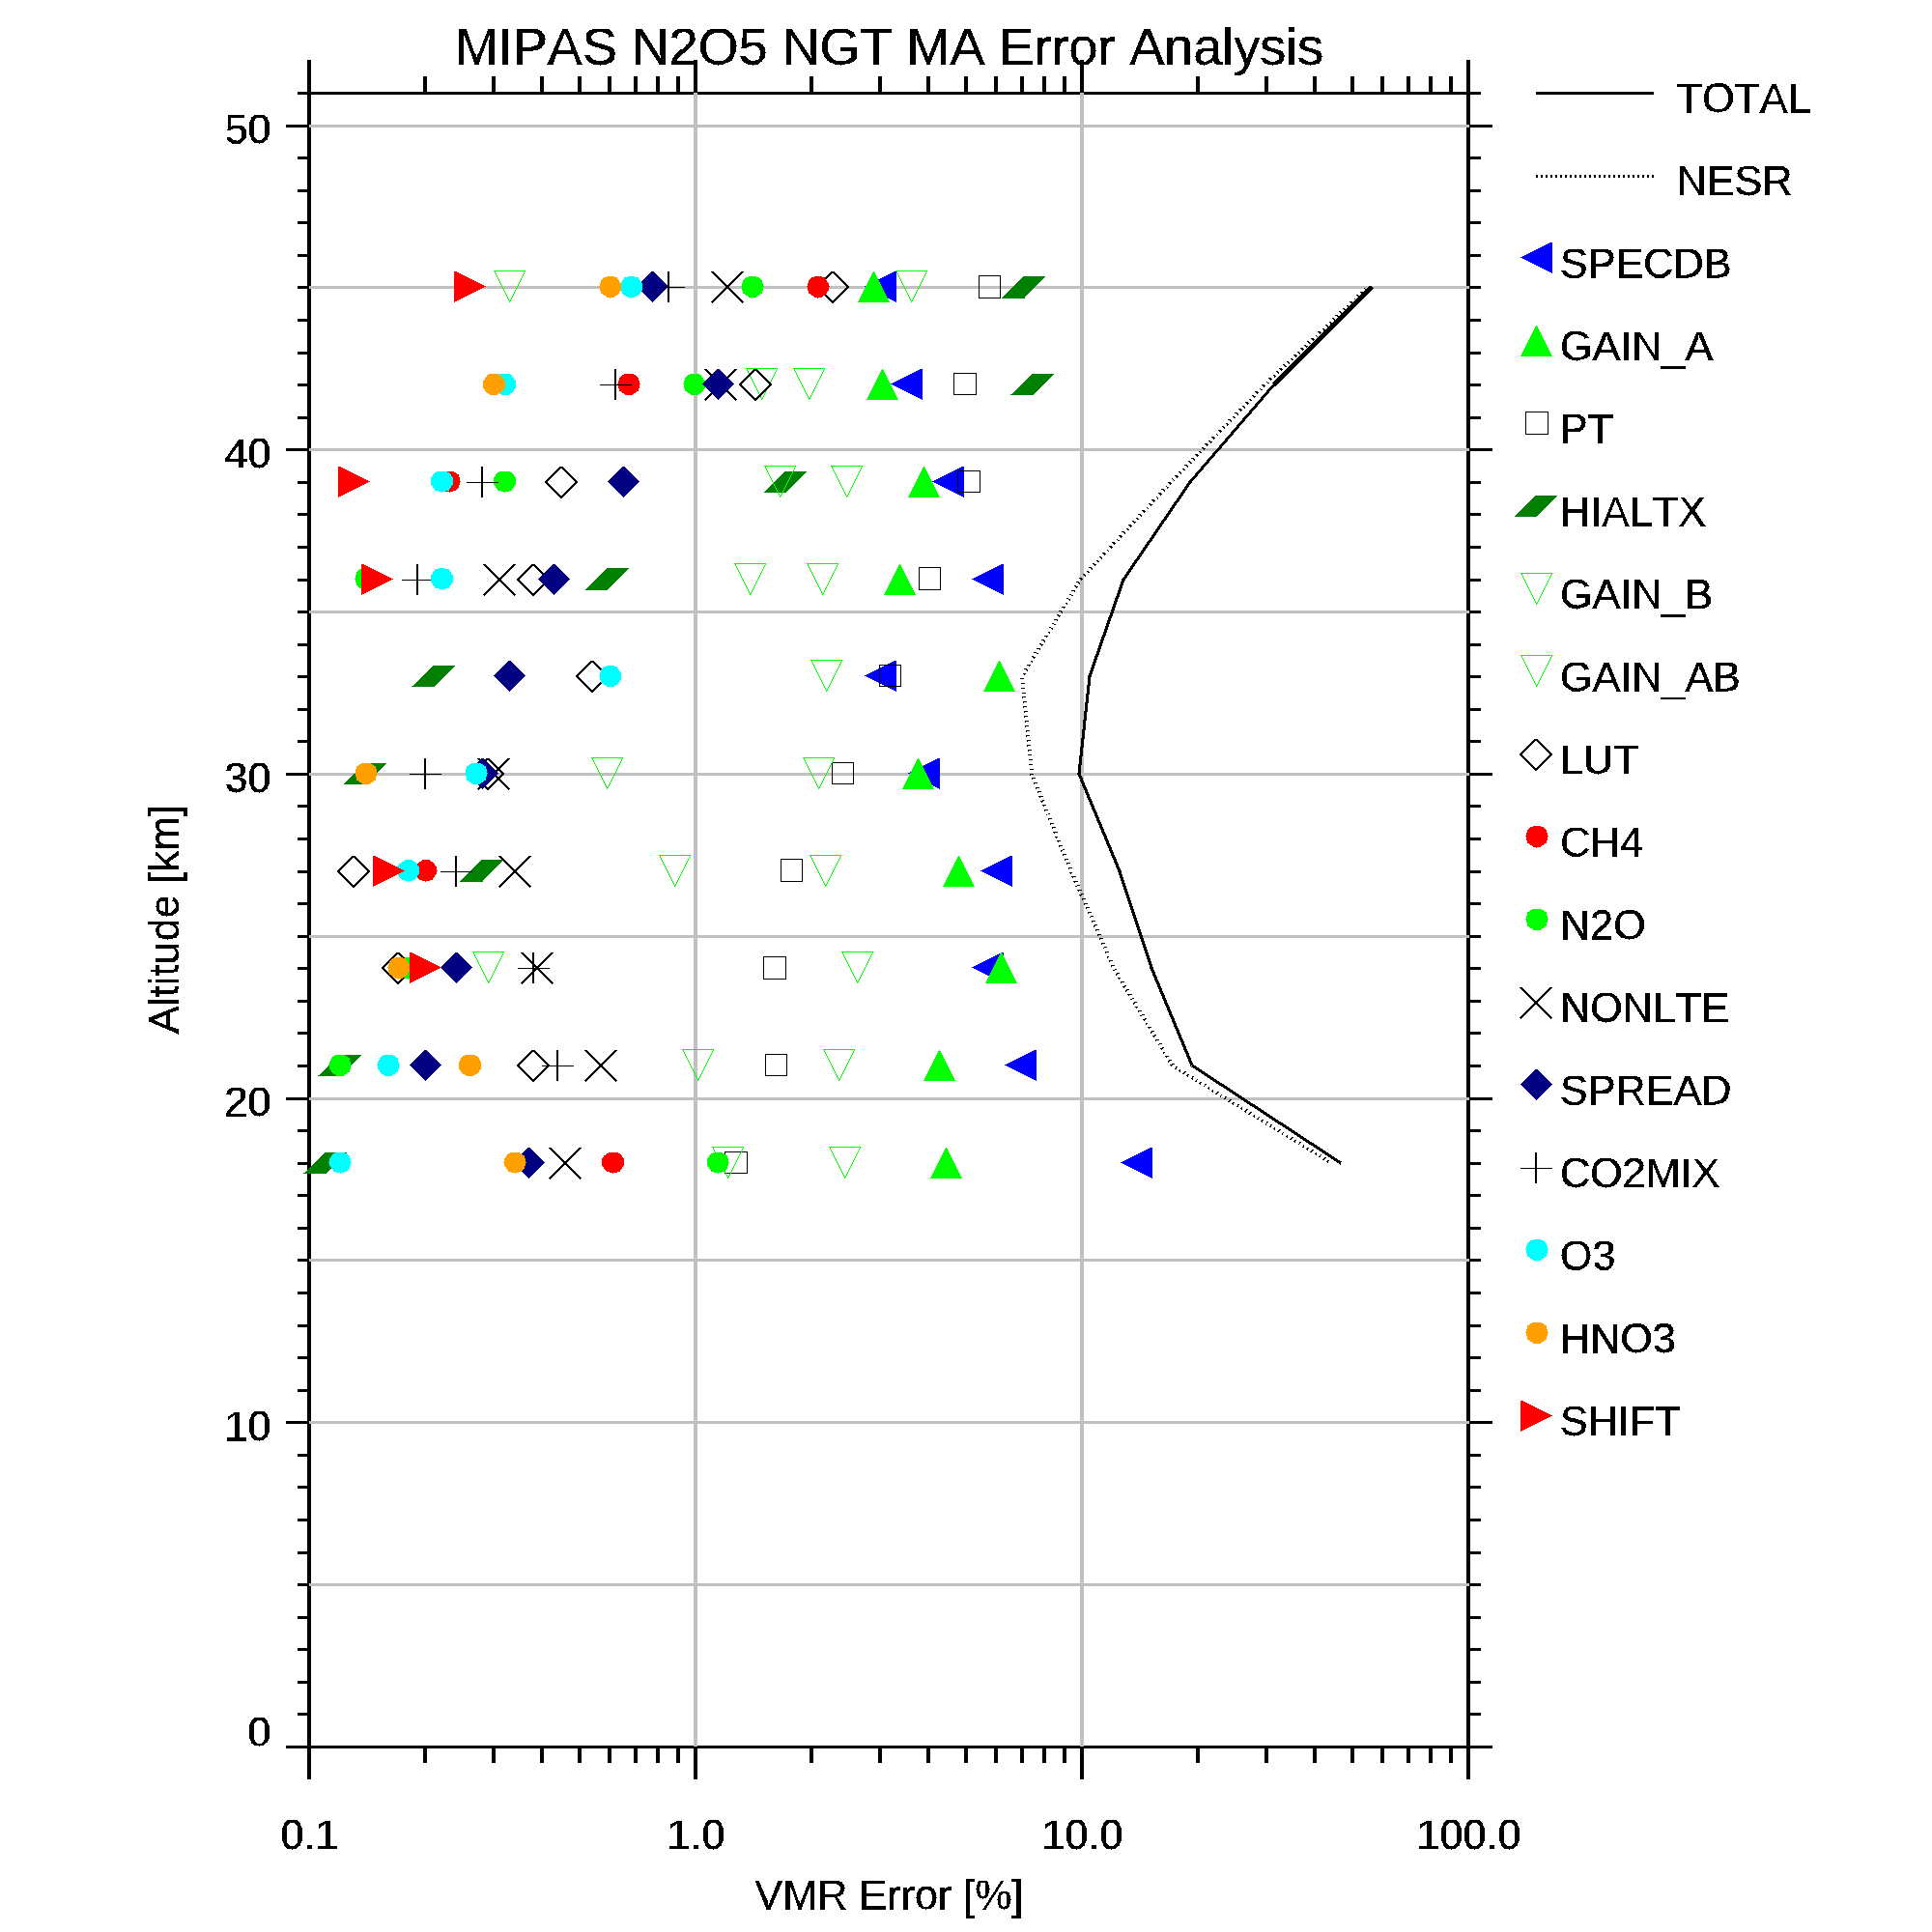
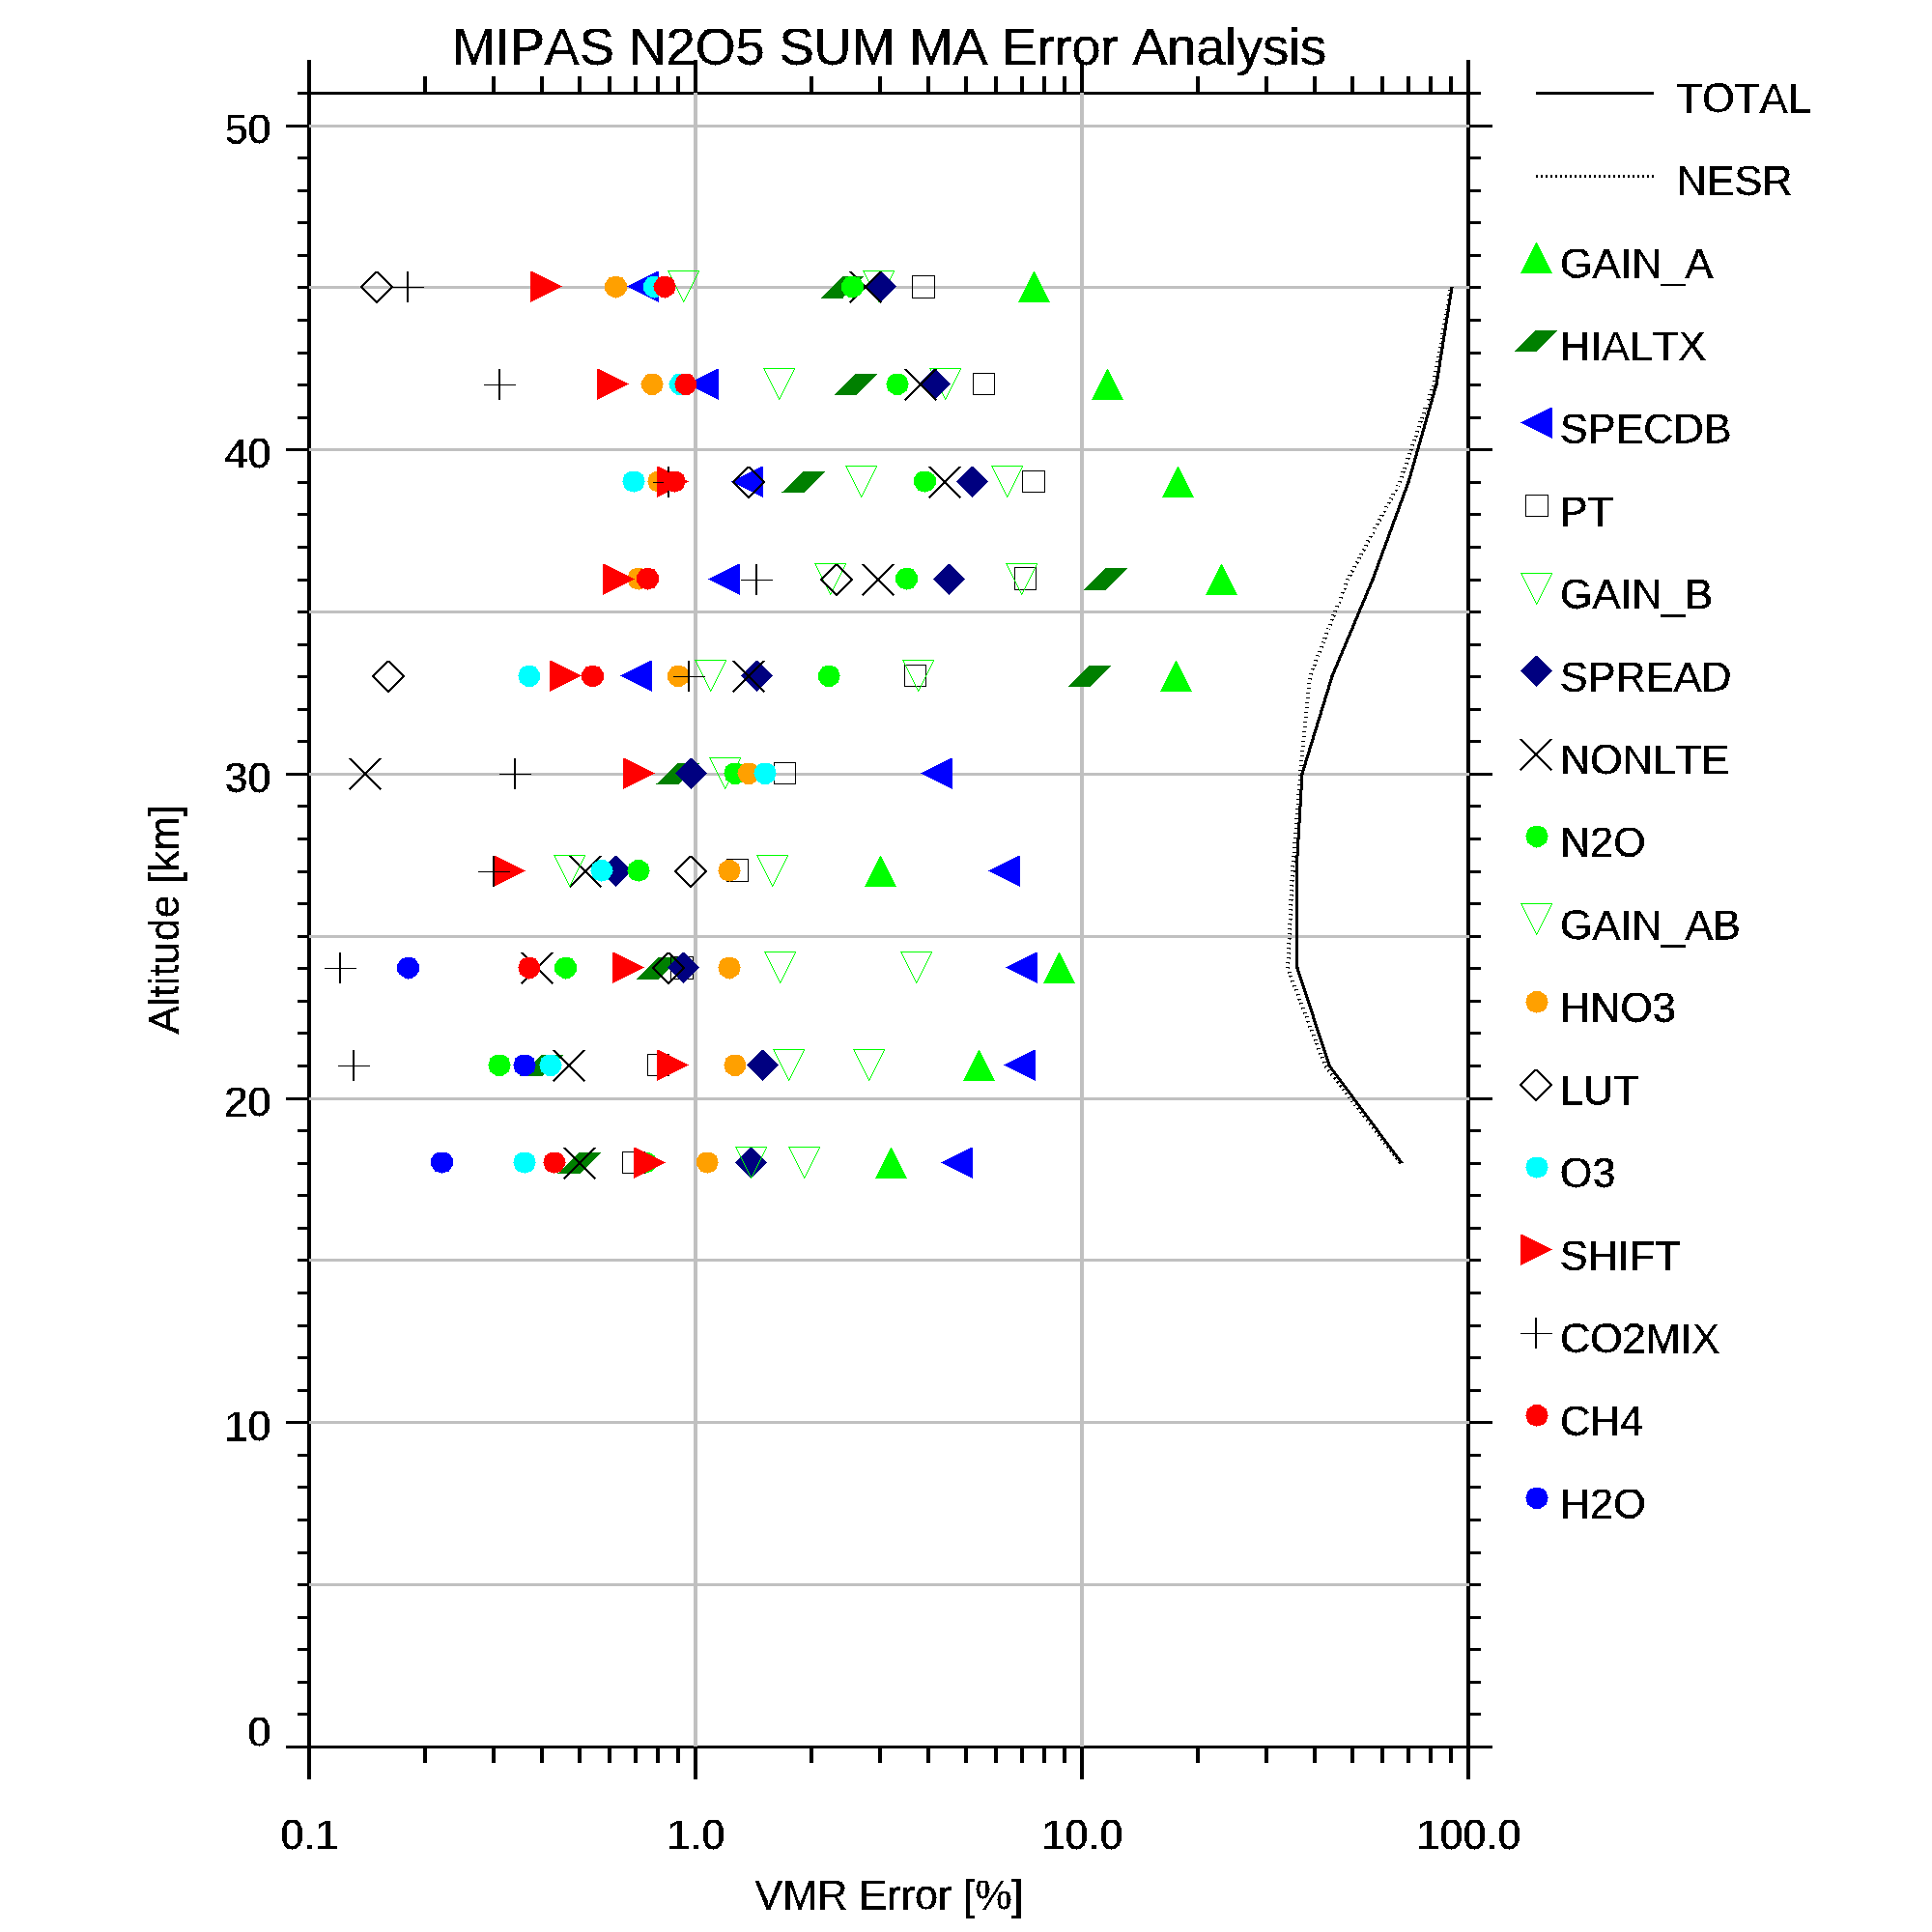
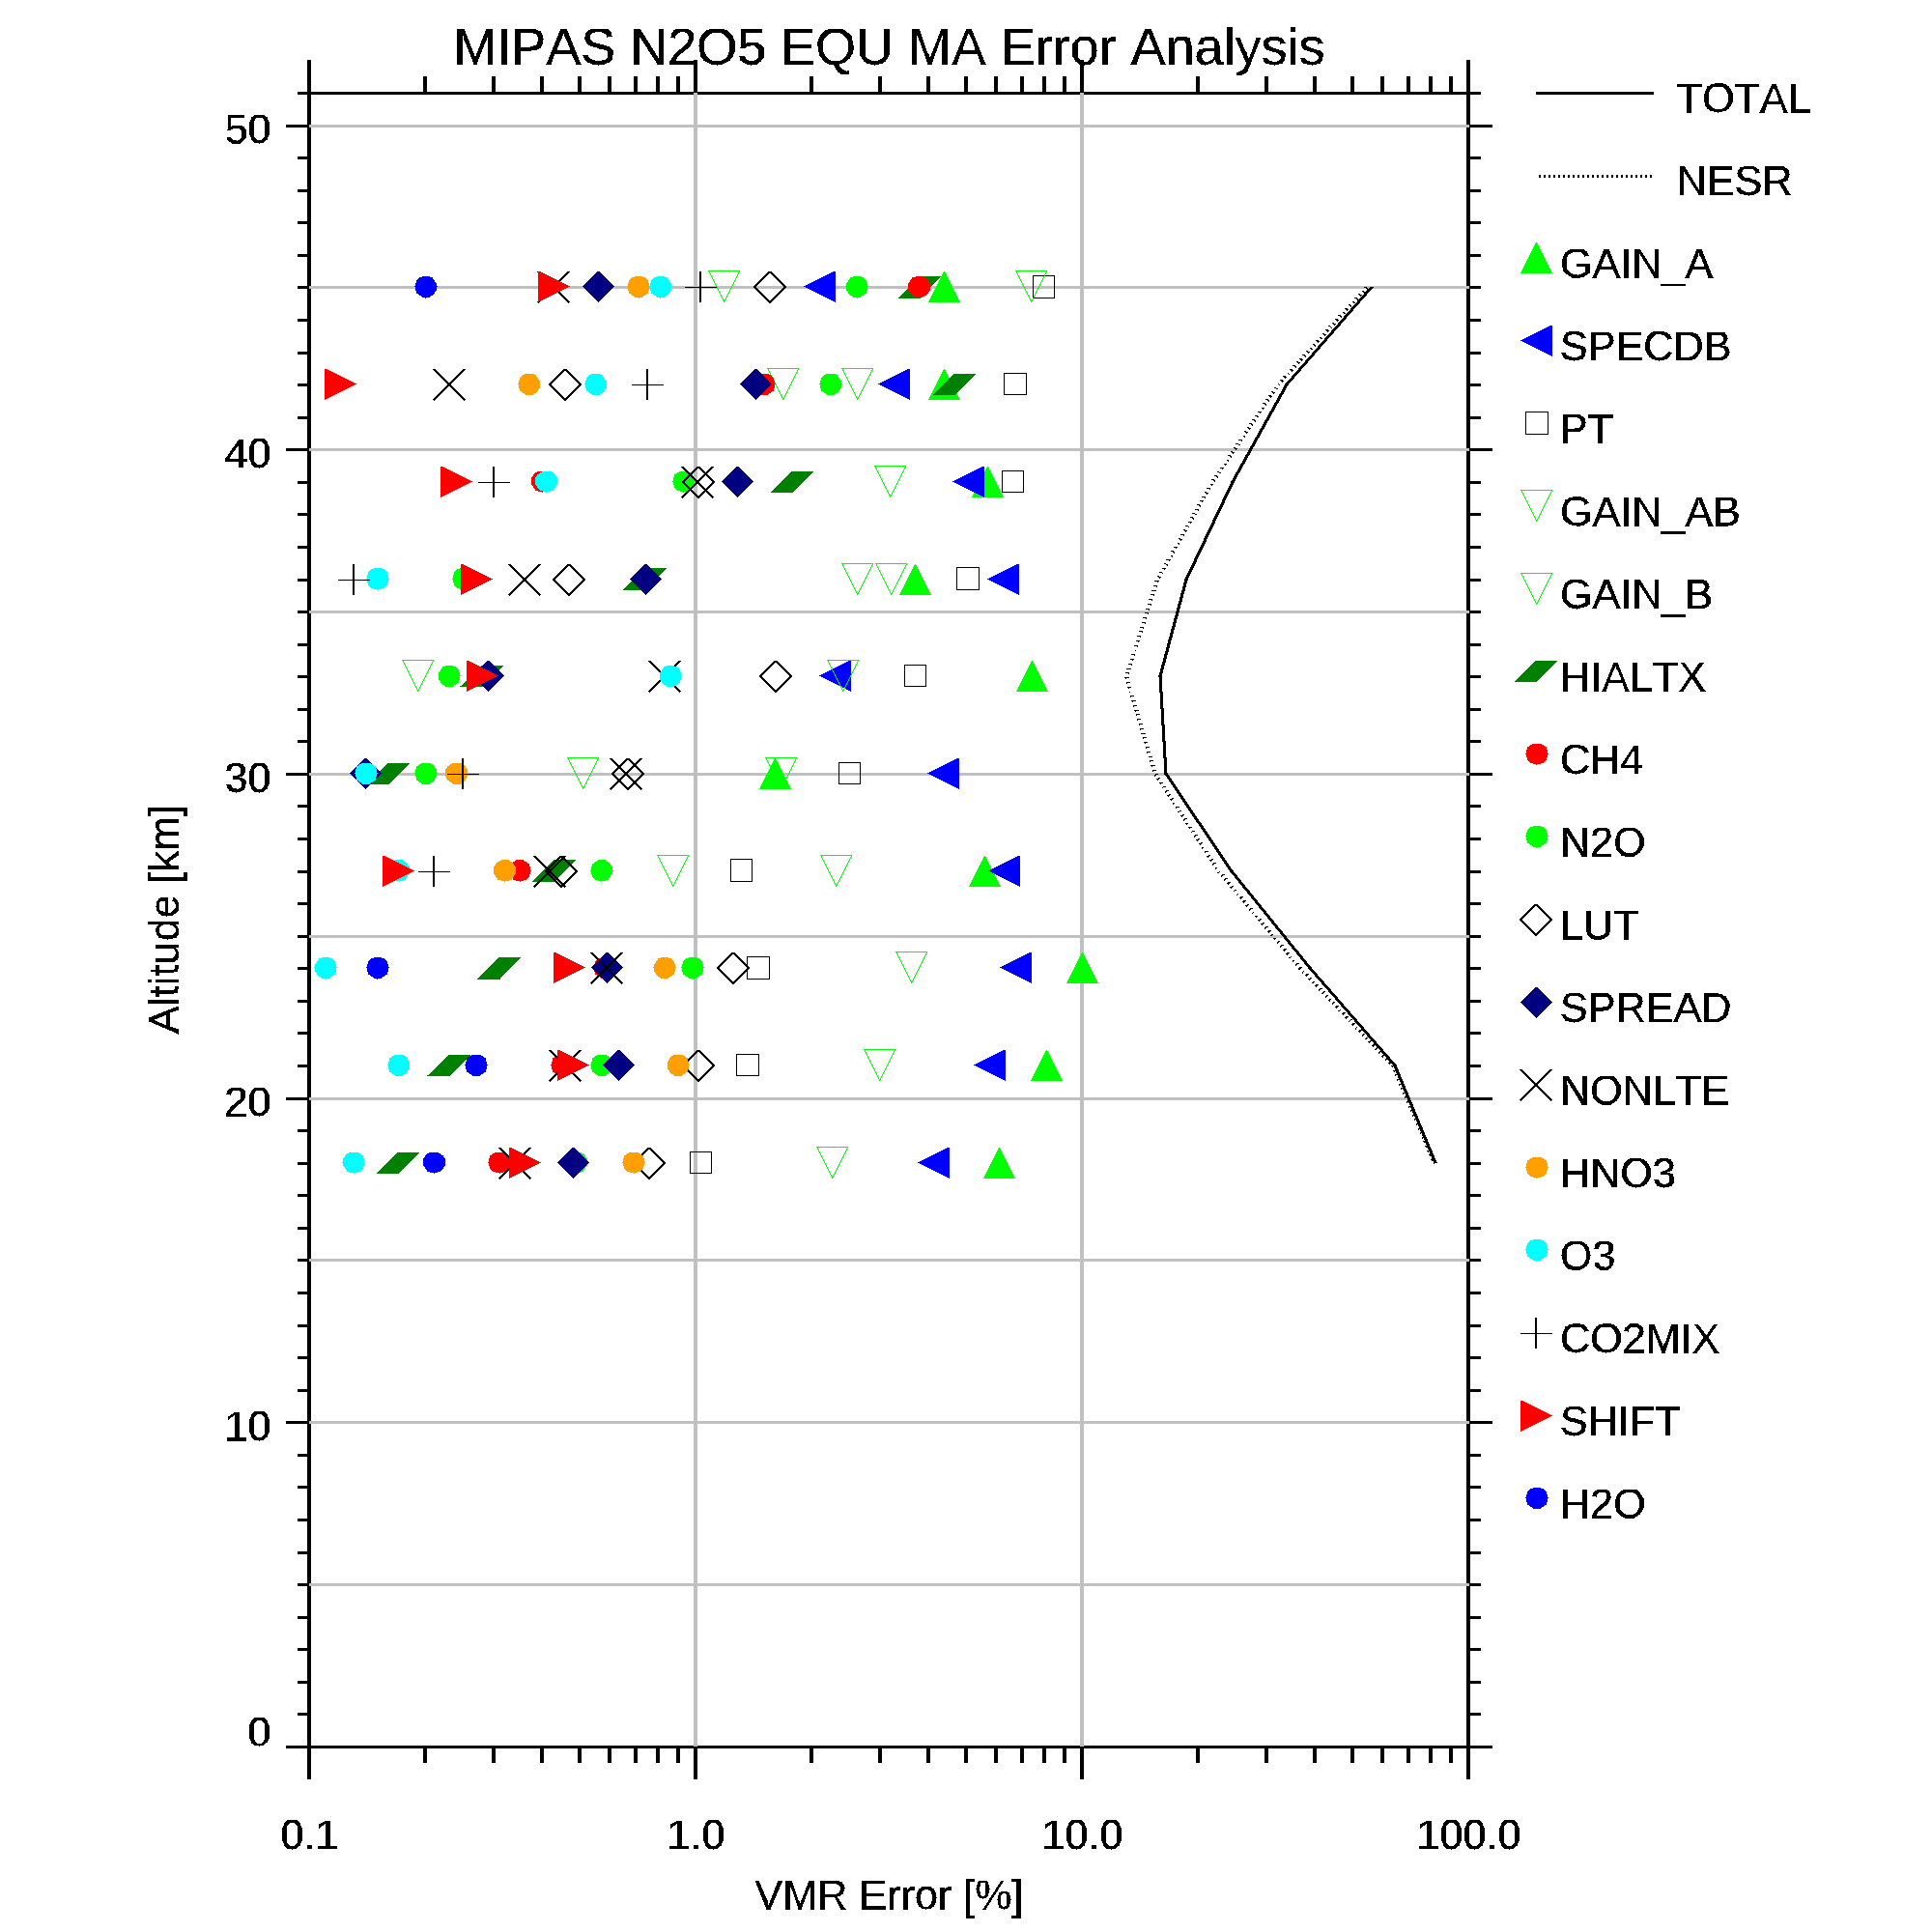
Click on 'Data' for the numerical data that has been plotted. In the plots, the same symbols are used for each error source (explained below) throughout, and listed in the key in the approximate order of significance for that plot. Only the most significant errors are plotted. Click on the atmosphere or species for plots of the atmospheric profiles assumed.
| MODE: MA (2005-2012, 29 sweeps @ 0.0625 cm-1 sampling) | ||||||
| Species | DAY | NGT | WIN | SUM | EQU | |
|---|---|---|---|---|---|---|
| TEM | [Prof] [MW] | [Plot] [Data] | [Plot] [Data] | [Plot] [Data] | [Plot] [Data] | [Plot] [Data] |
| PRE | [Prof] [MW] | [Plot] [Data] | [Plot] [Data] | [Plot] [Data] | [Plot] [Data] | [Plot] [Data] |
| H2O | [Prof] [MW] | [Plot] [Data] | [Plot] [Data] | [Plot] [Data] | [Plot] [Data] | [Plot] [Data] |
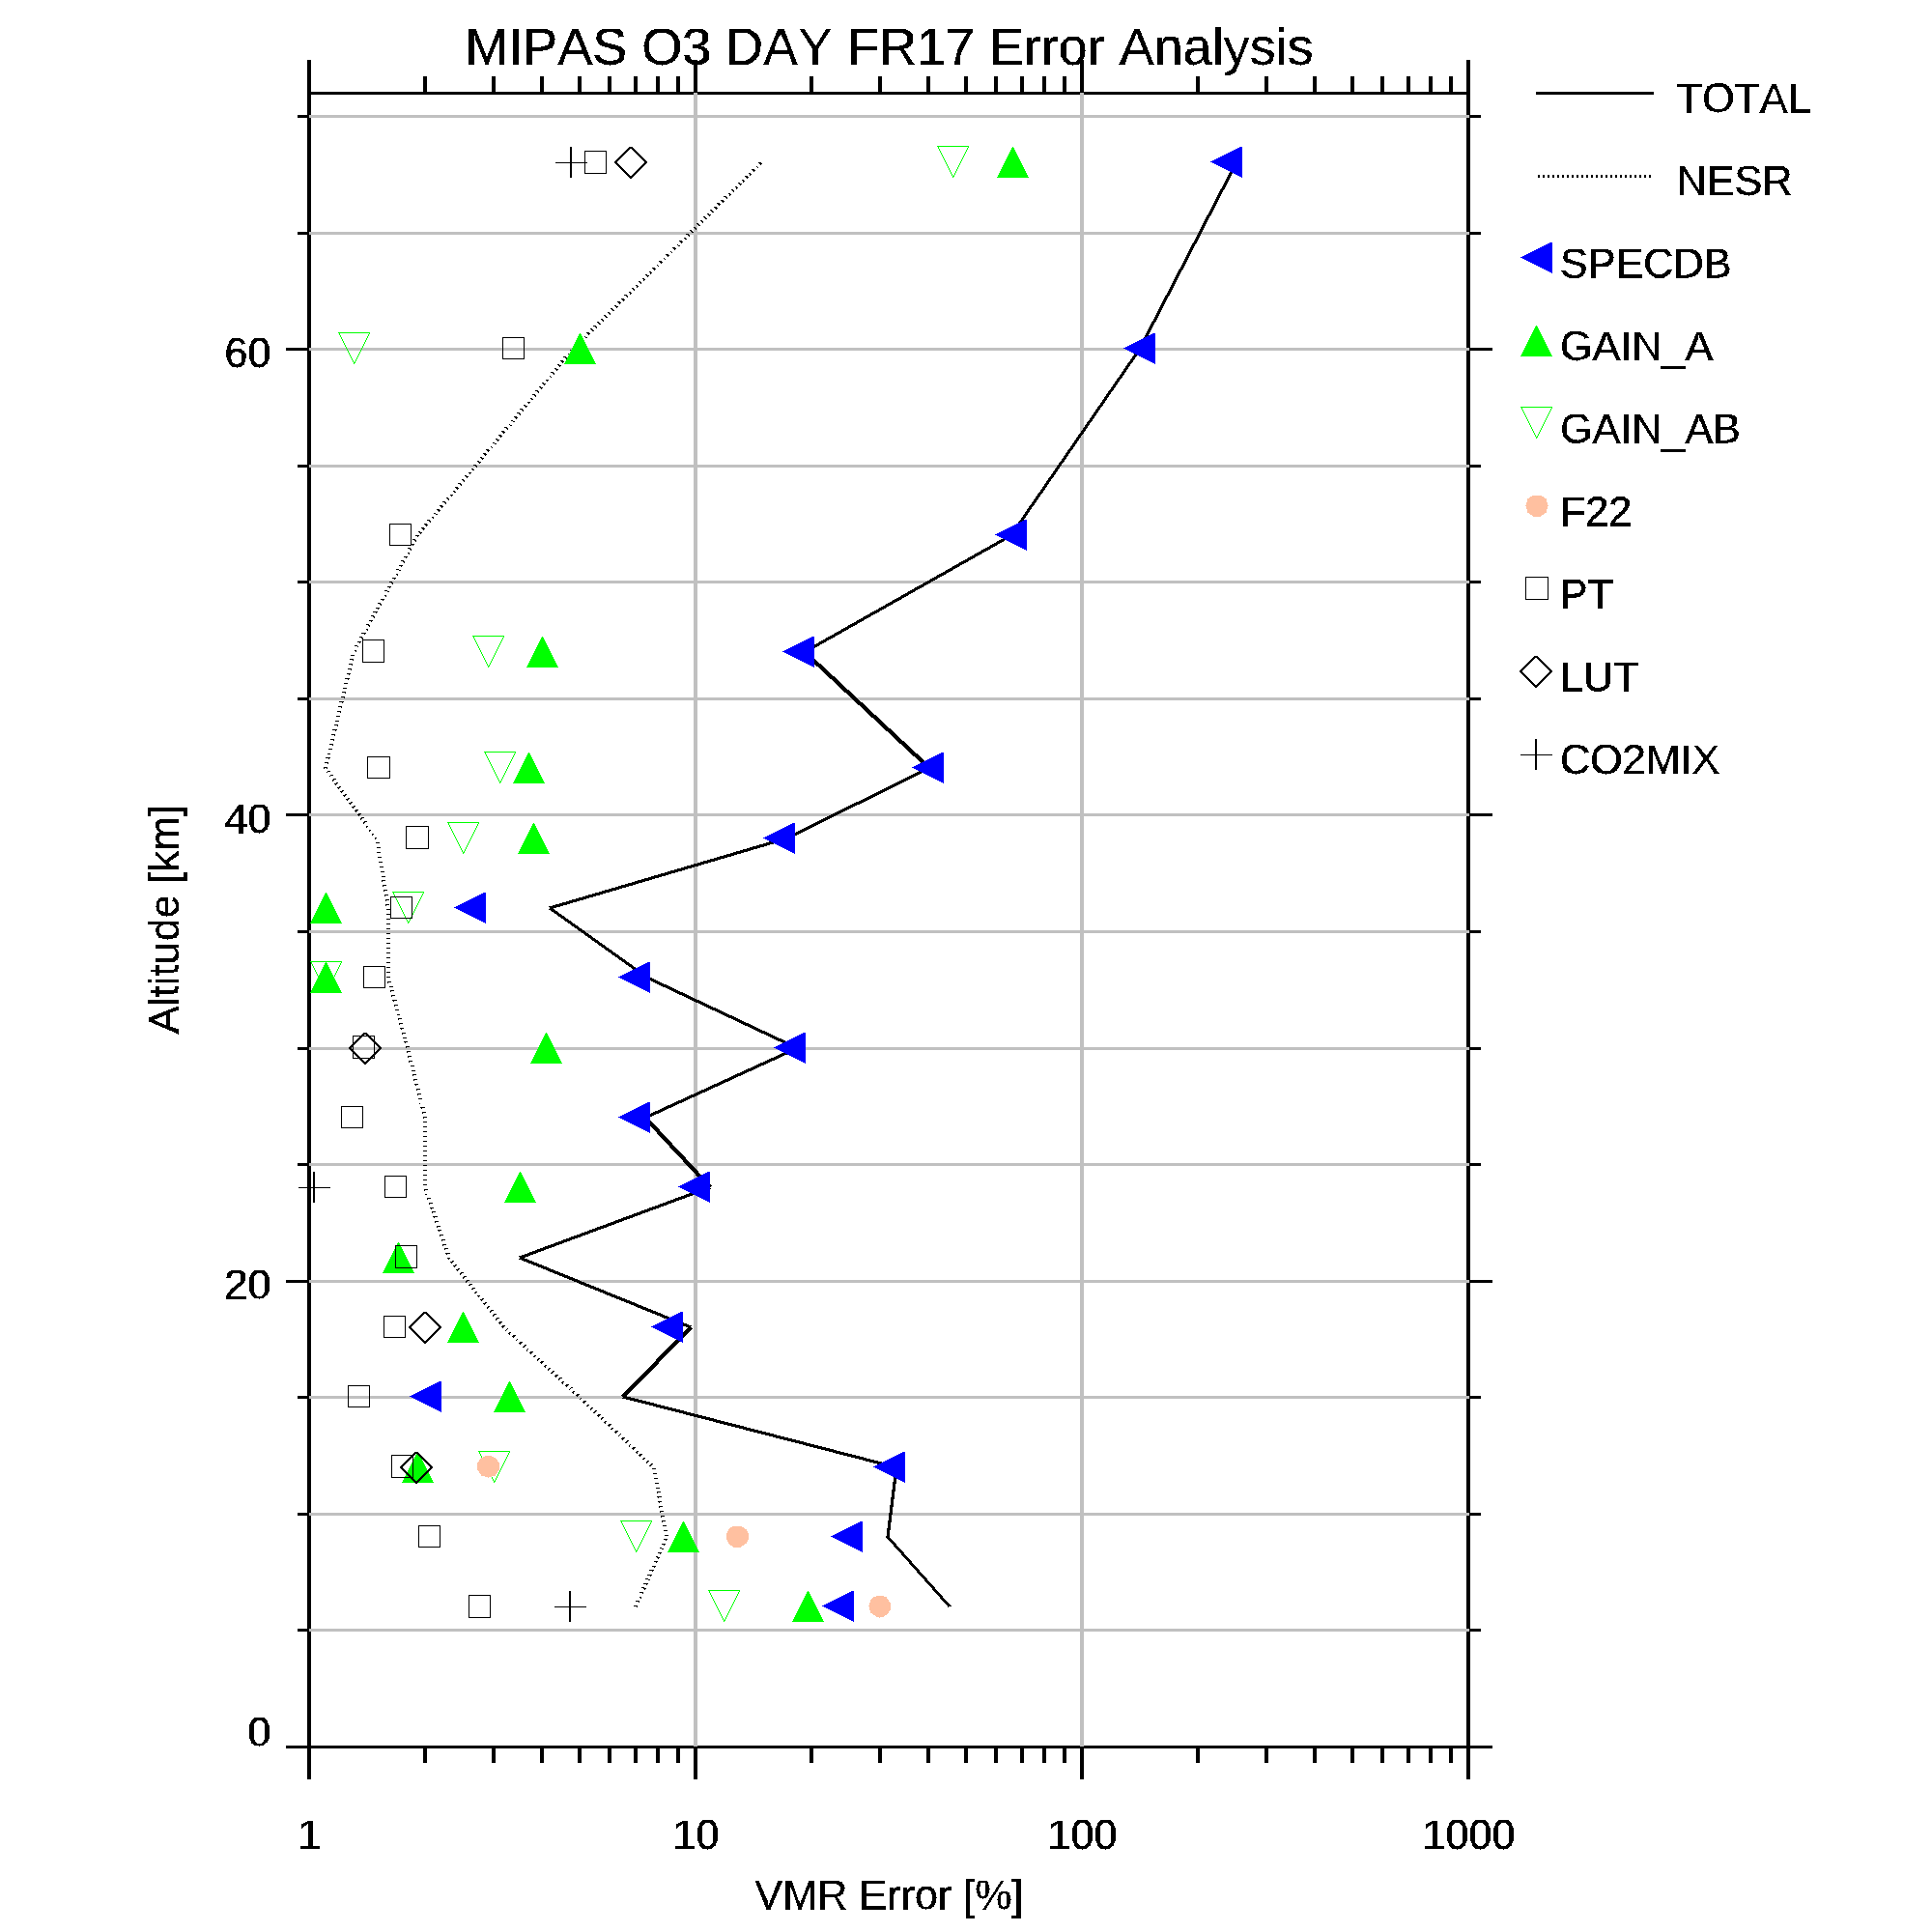
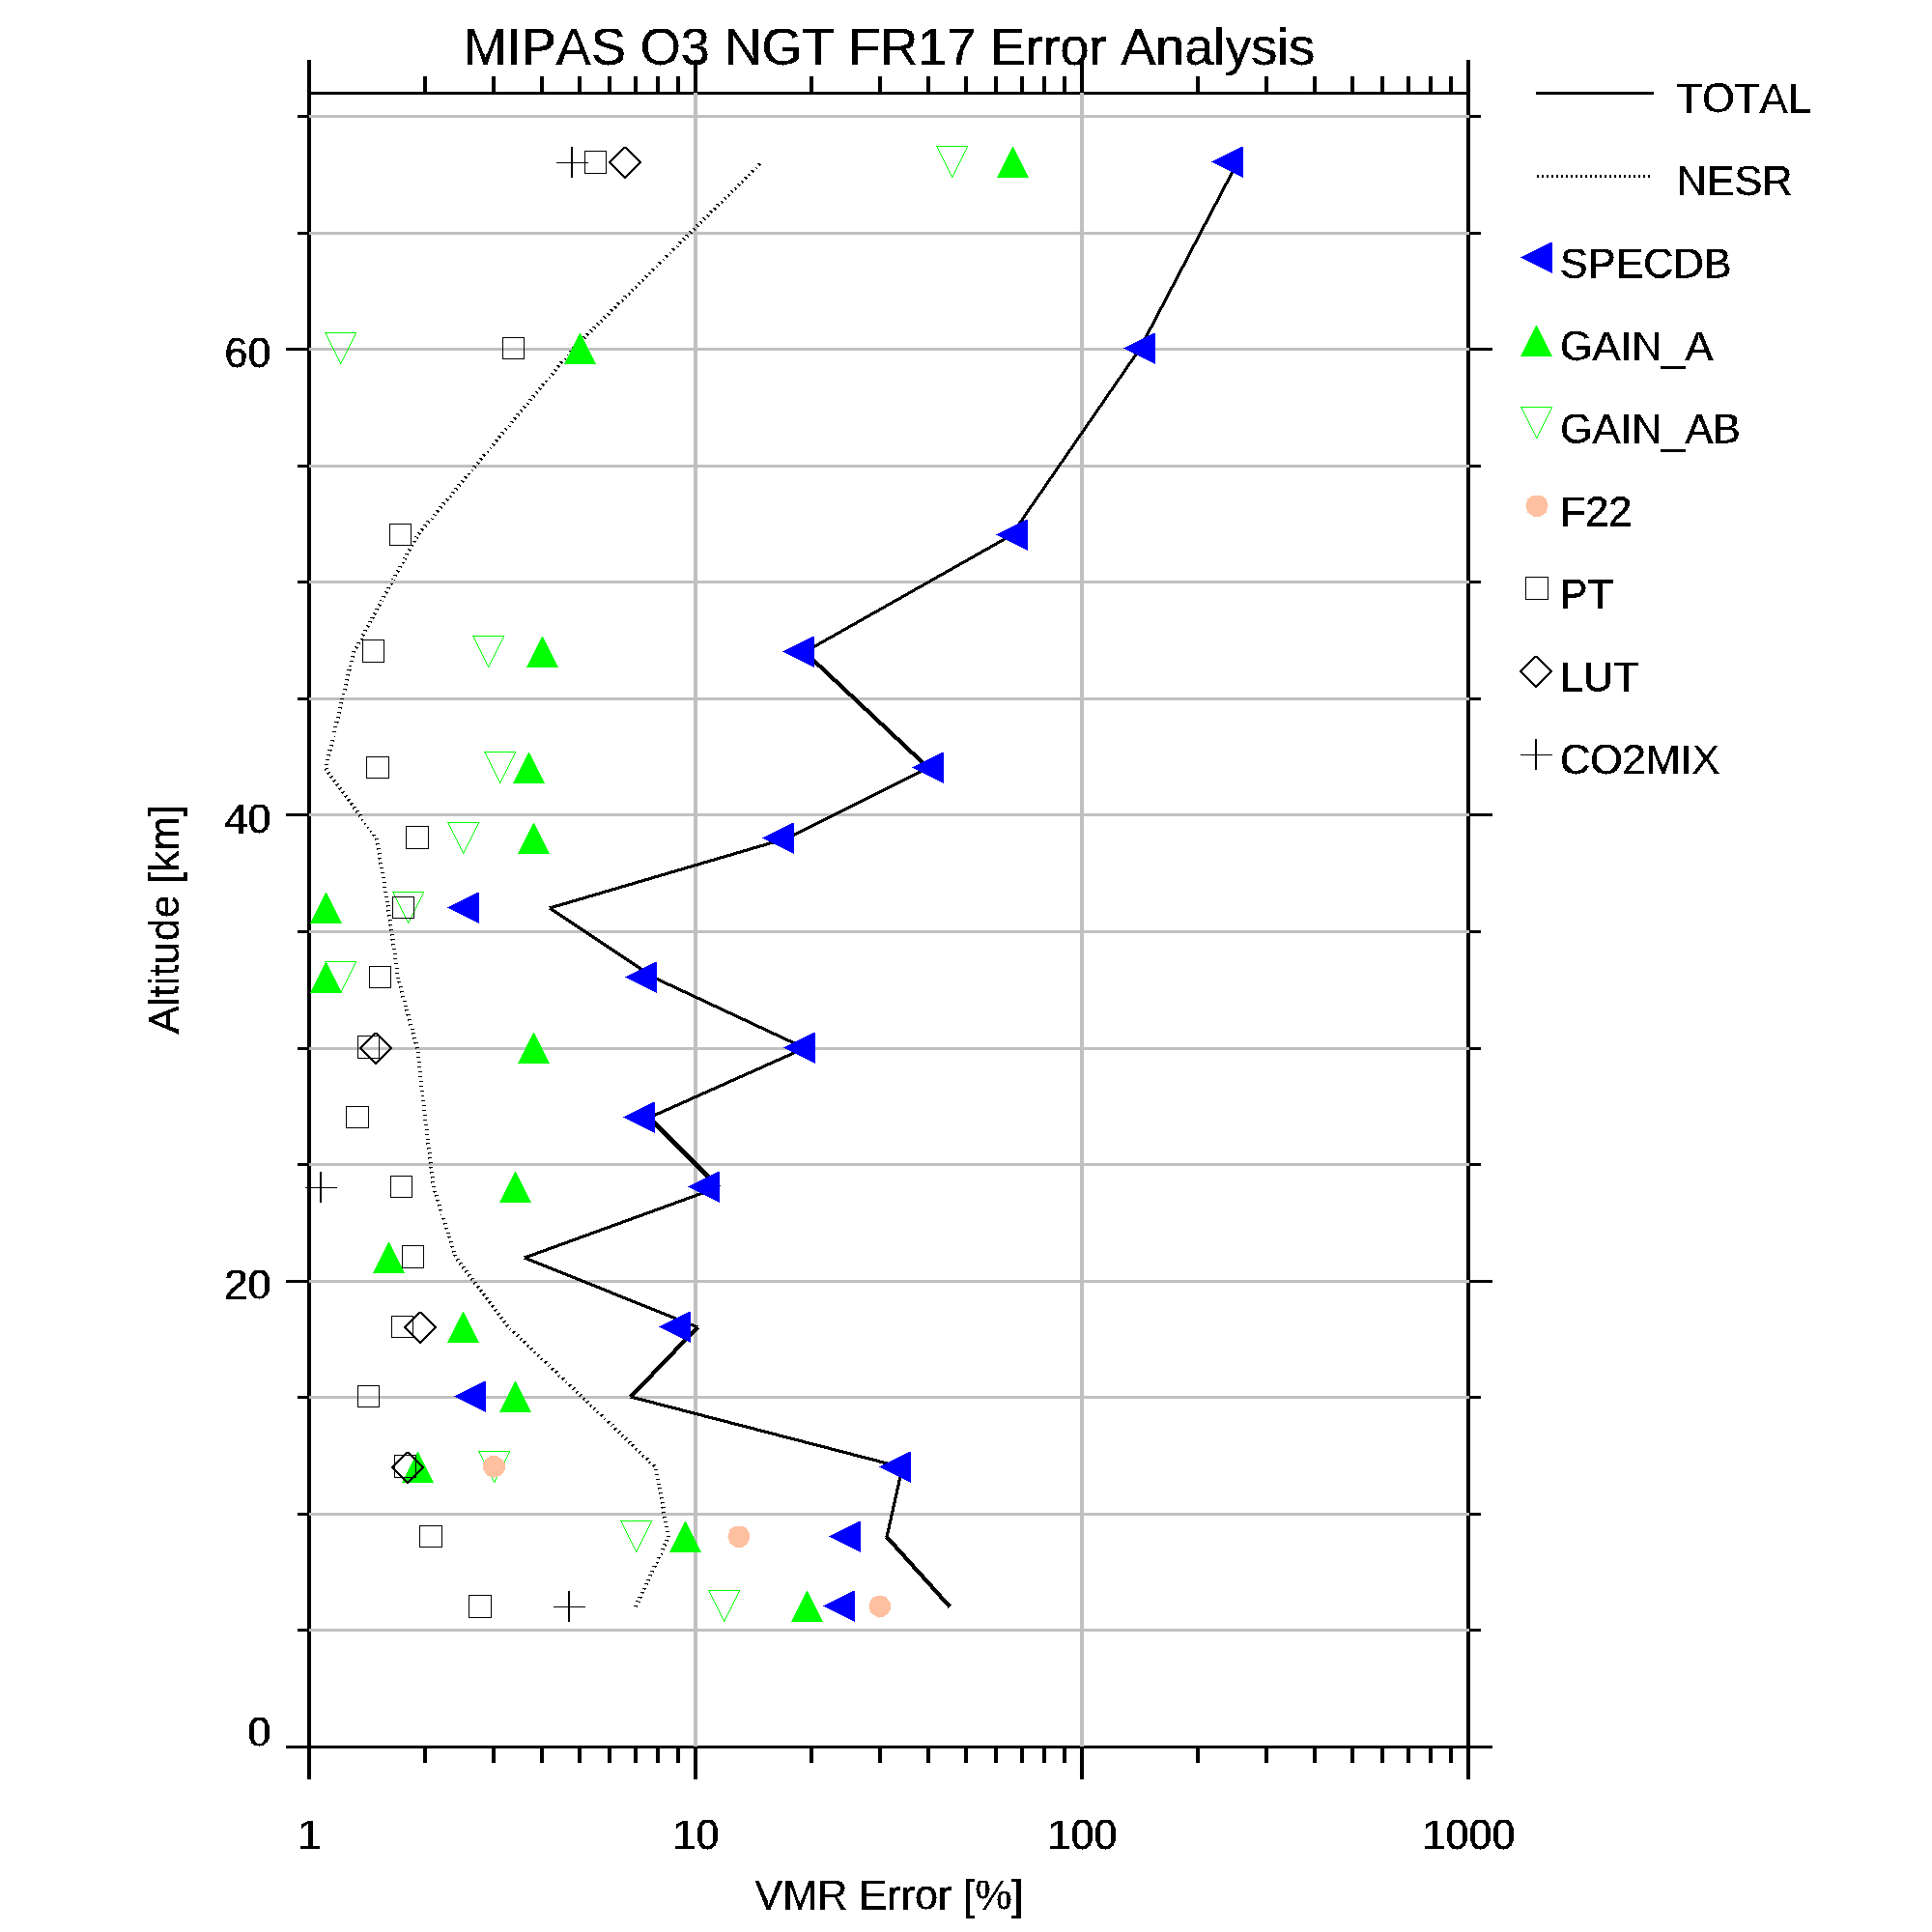
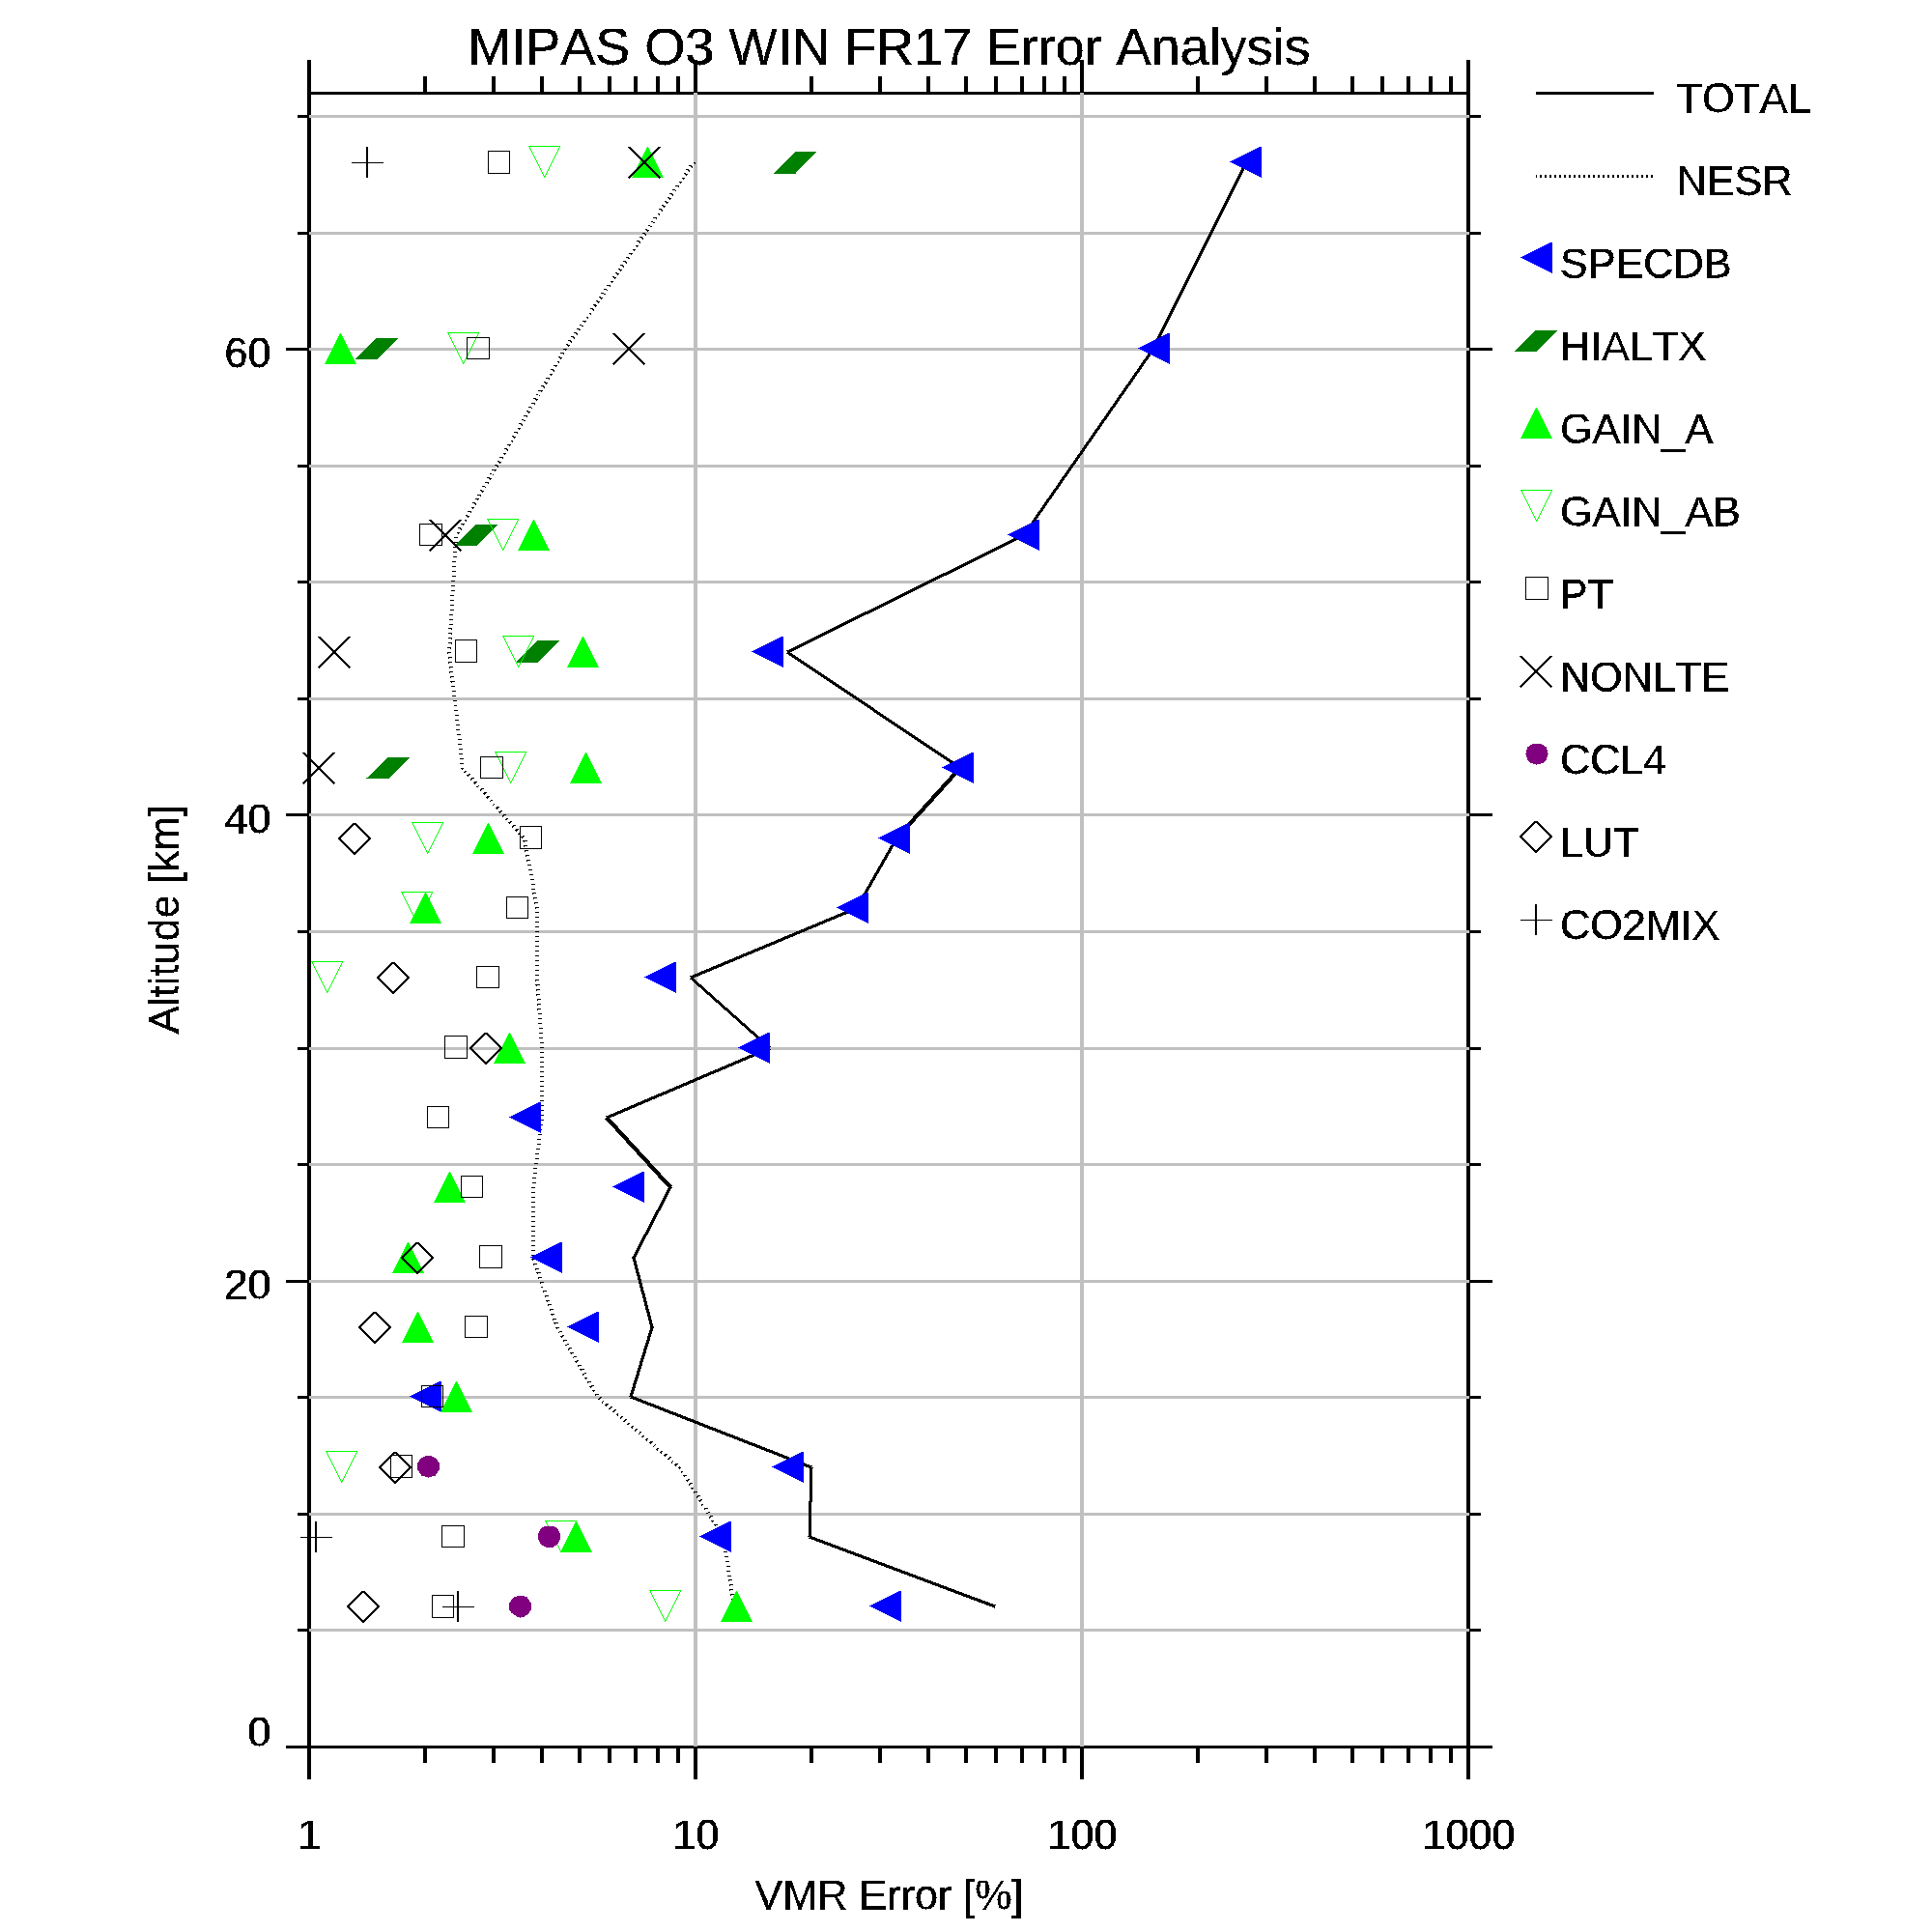
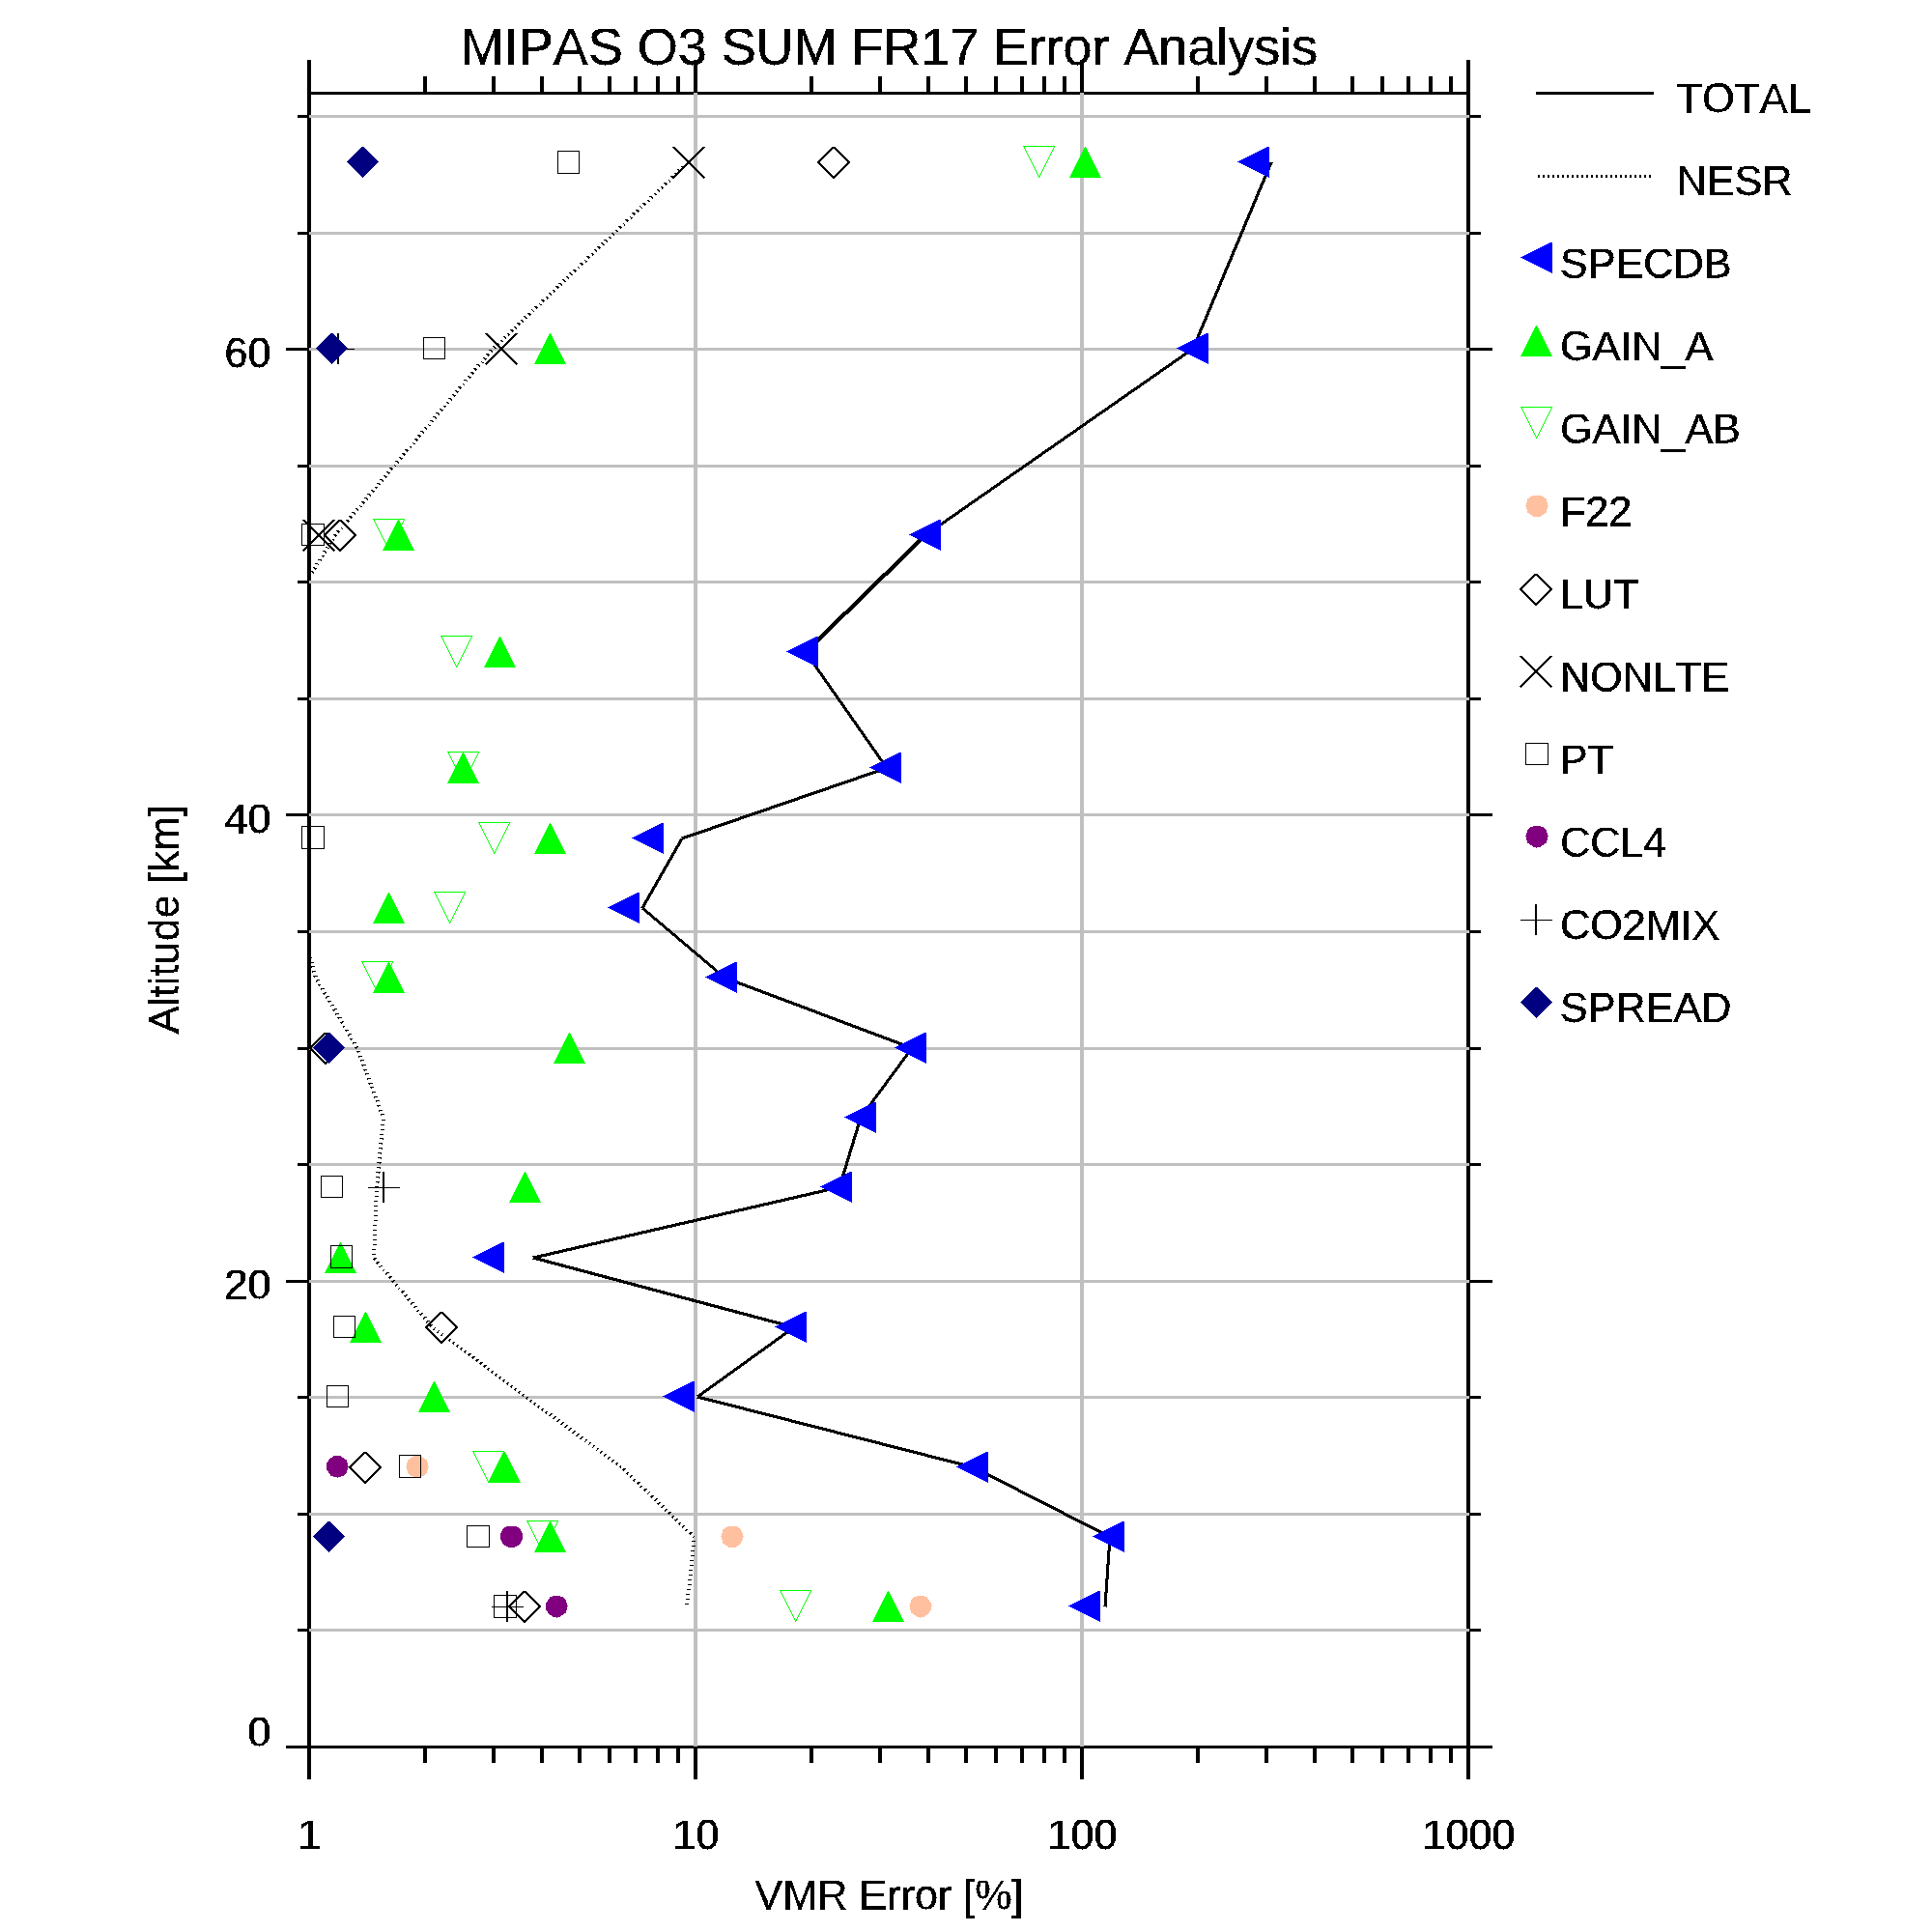
| O3 | [Prof] [MW] | [Plot] [Data] | [Plot] [Data] | [Plot] [Data] | [Plot] [Data] | [Plot] [Data] |
| HNO3 | [Prof] [MW] | [Plot] [Data] | [Plot] [Data] | [Plot] [Data] | [Plot] [Data] | [Plot] [Data] |
| CH4 | [Prof] [MW] | [Plot] [Data] | [Plot] [Data] | [Plot] [Data] | [Plot] [Data] | [Plot] [Data] |
| N2O | [Prof] [MW] | [Plot] [Data] | [Plot] [Data] | [Plot] [Data] | [Plot] [Data] | [Plot] [Data] |
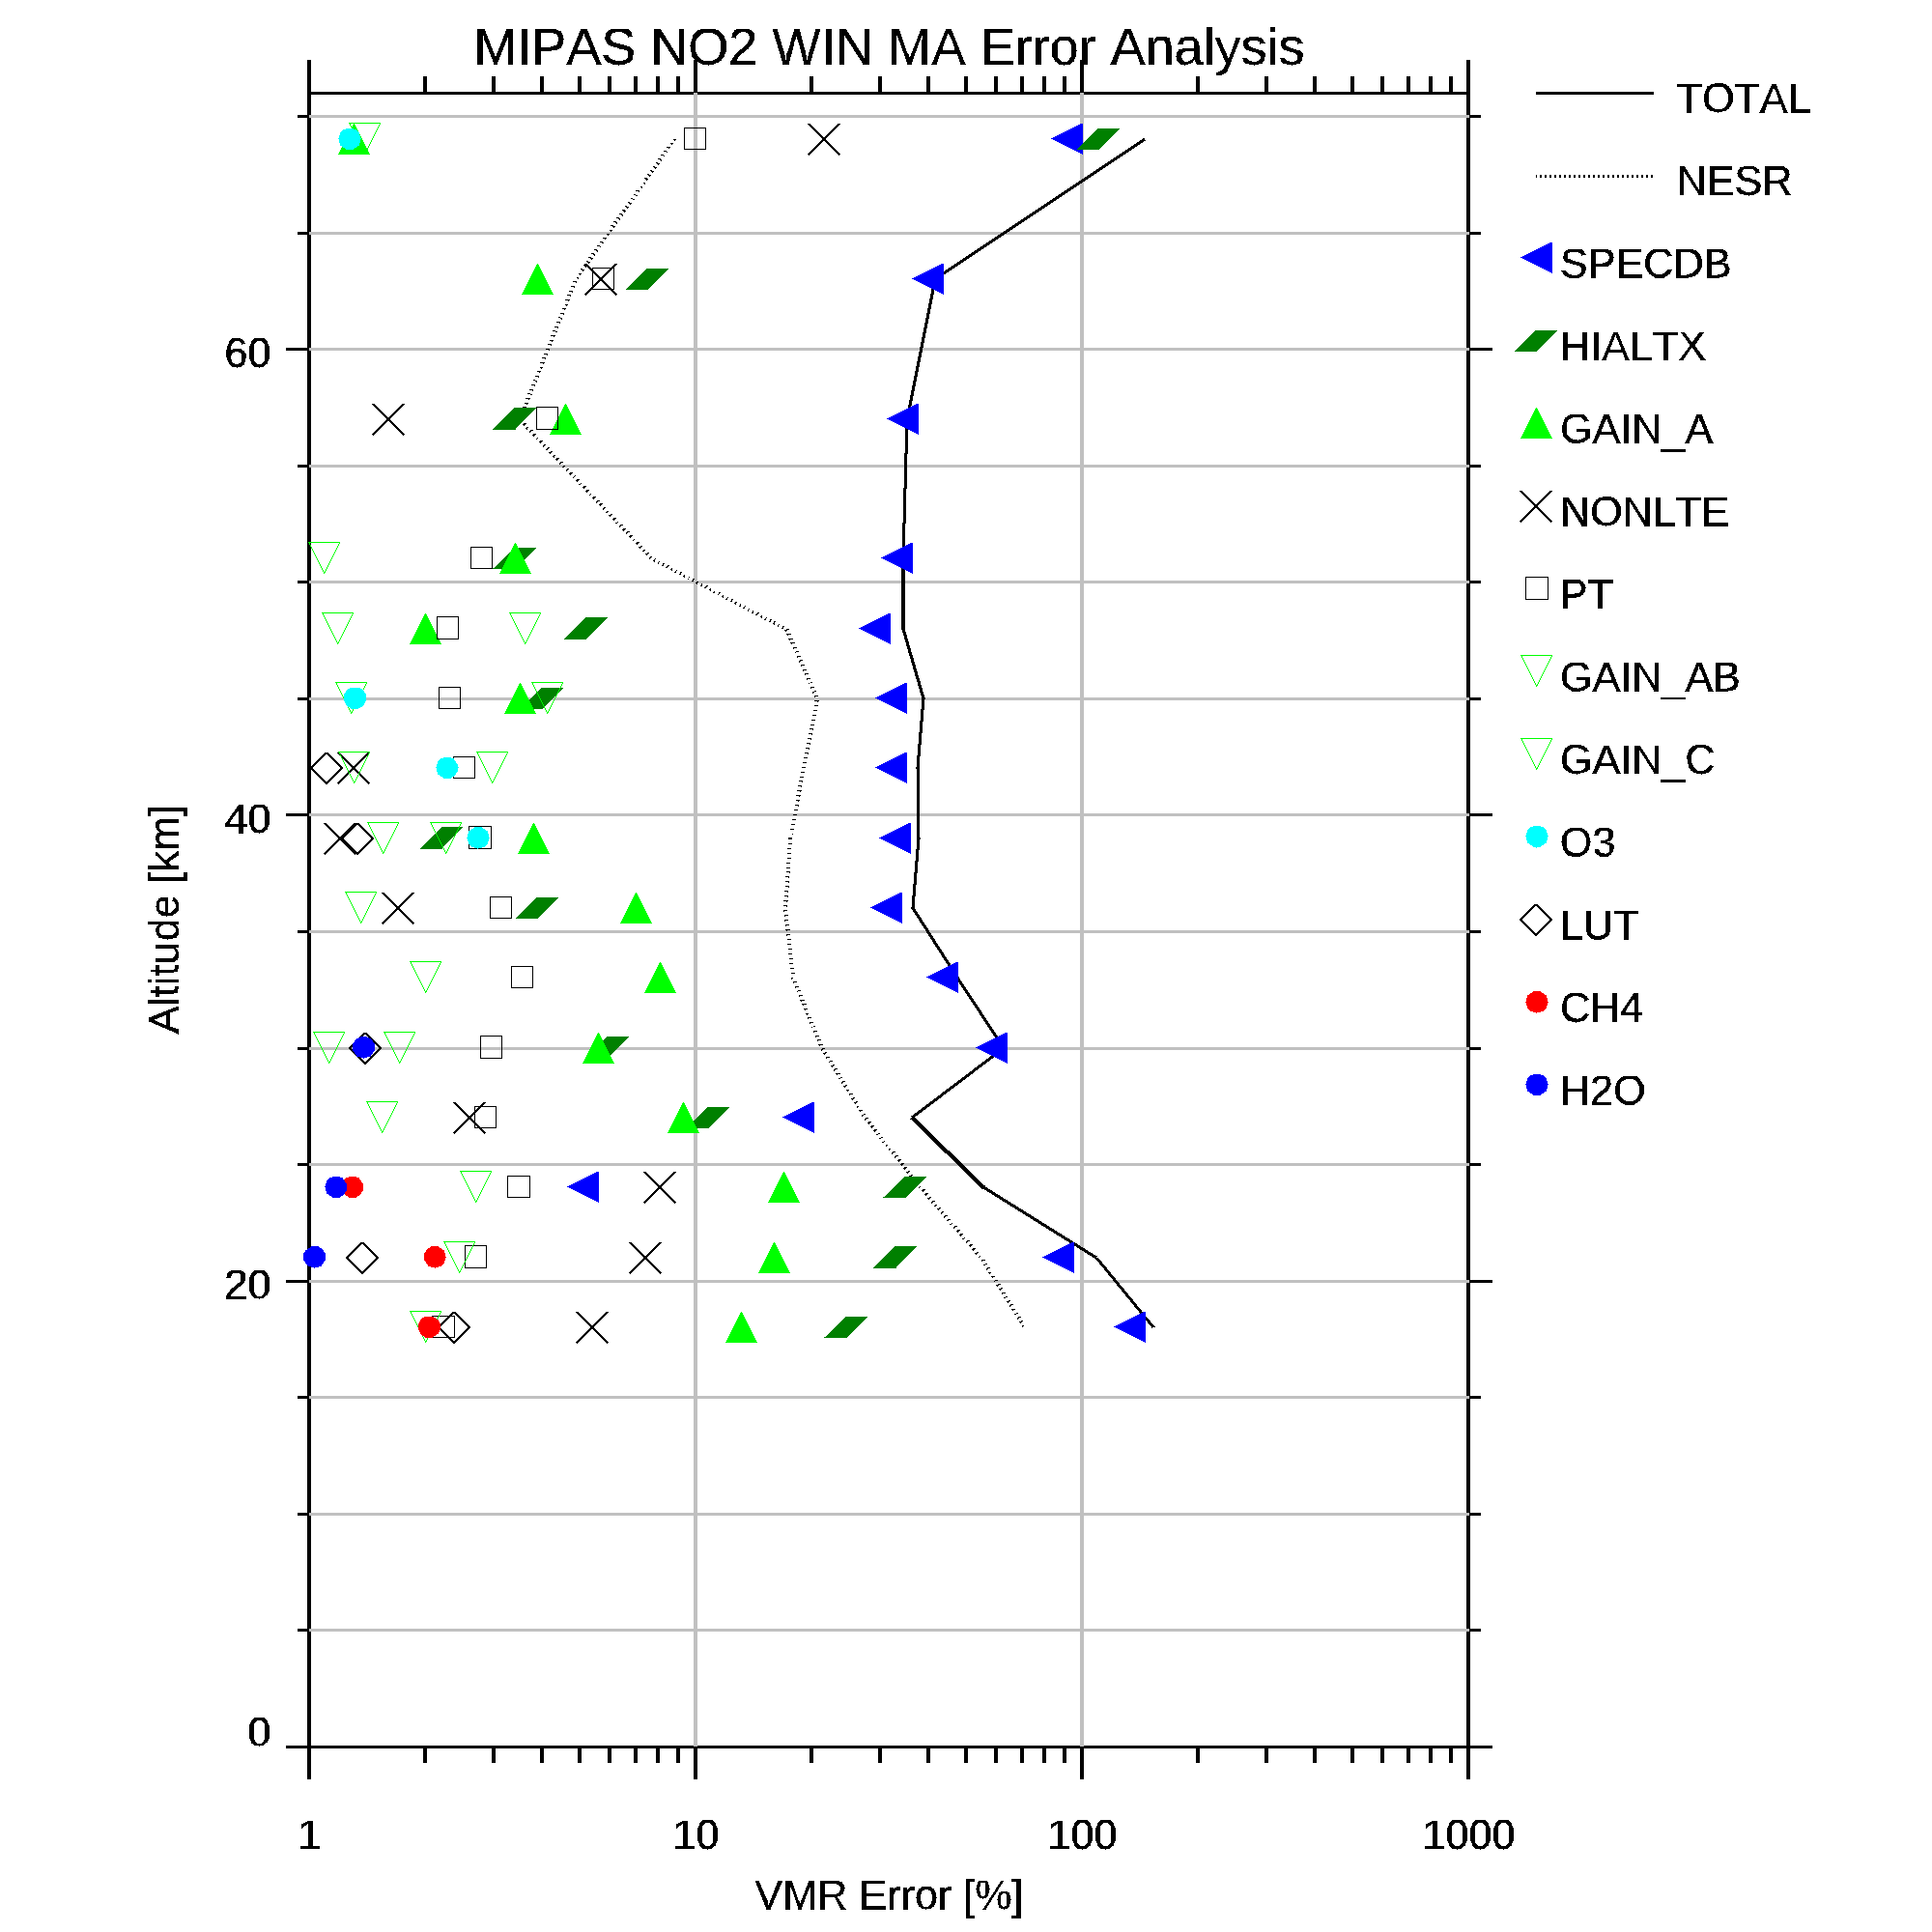
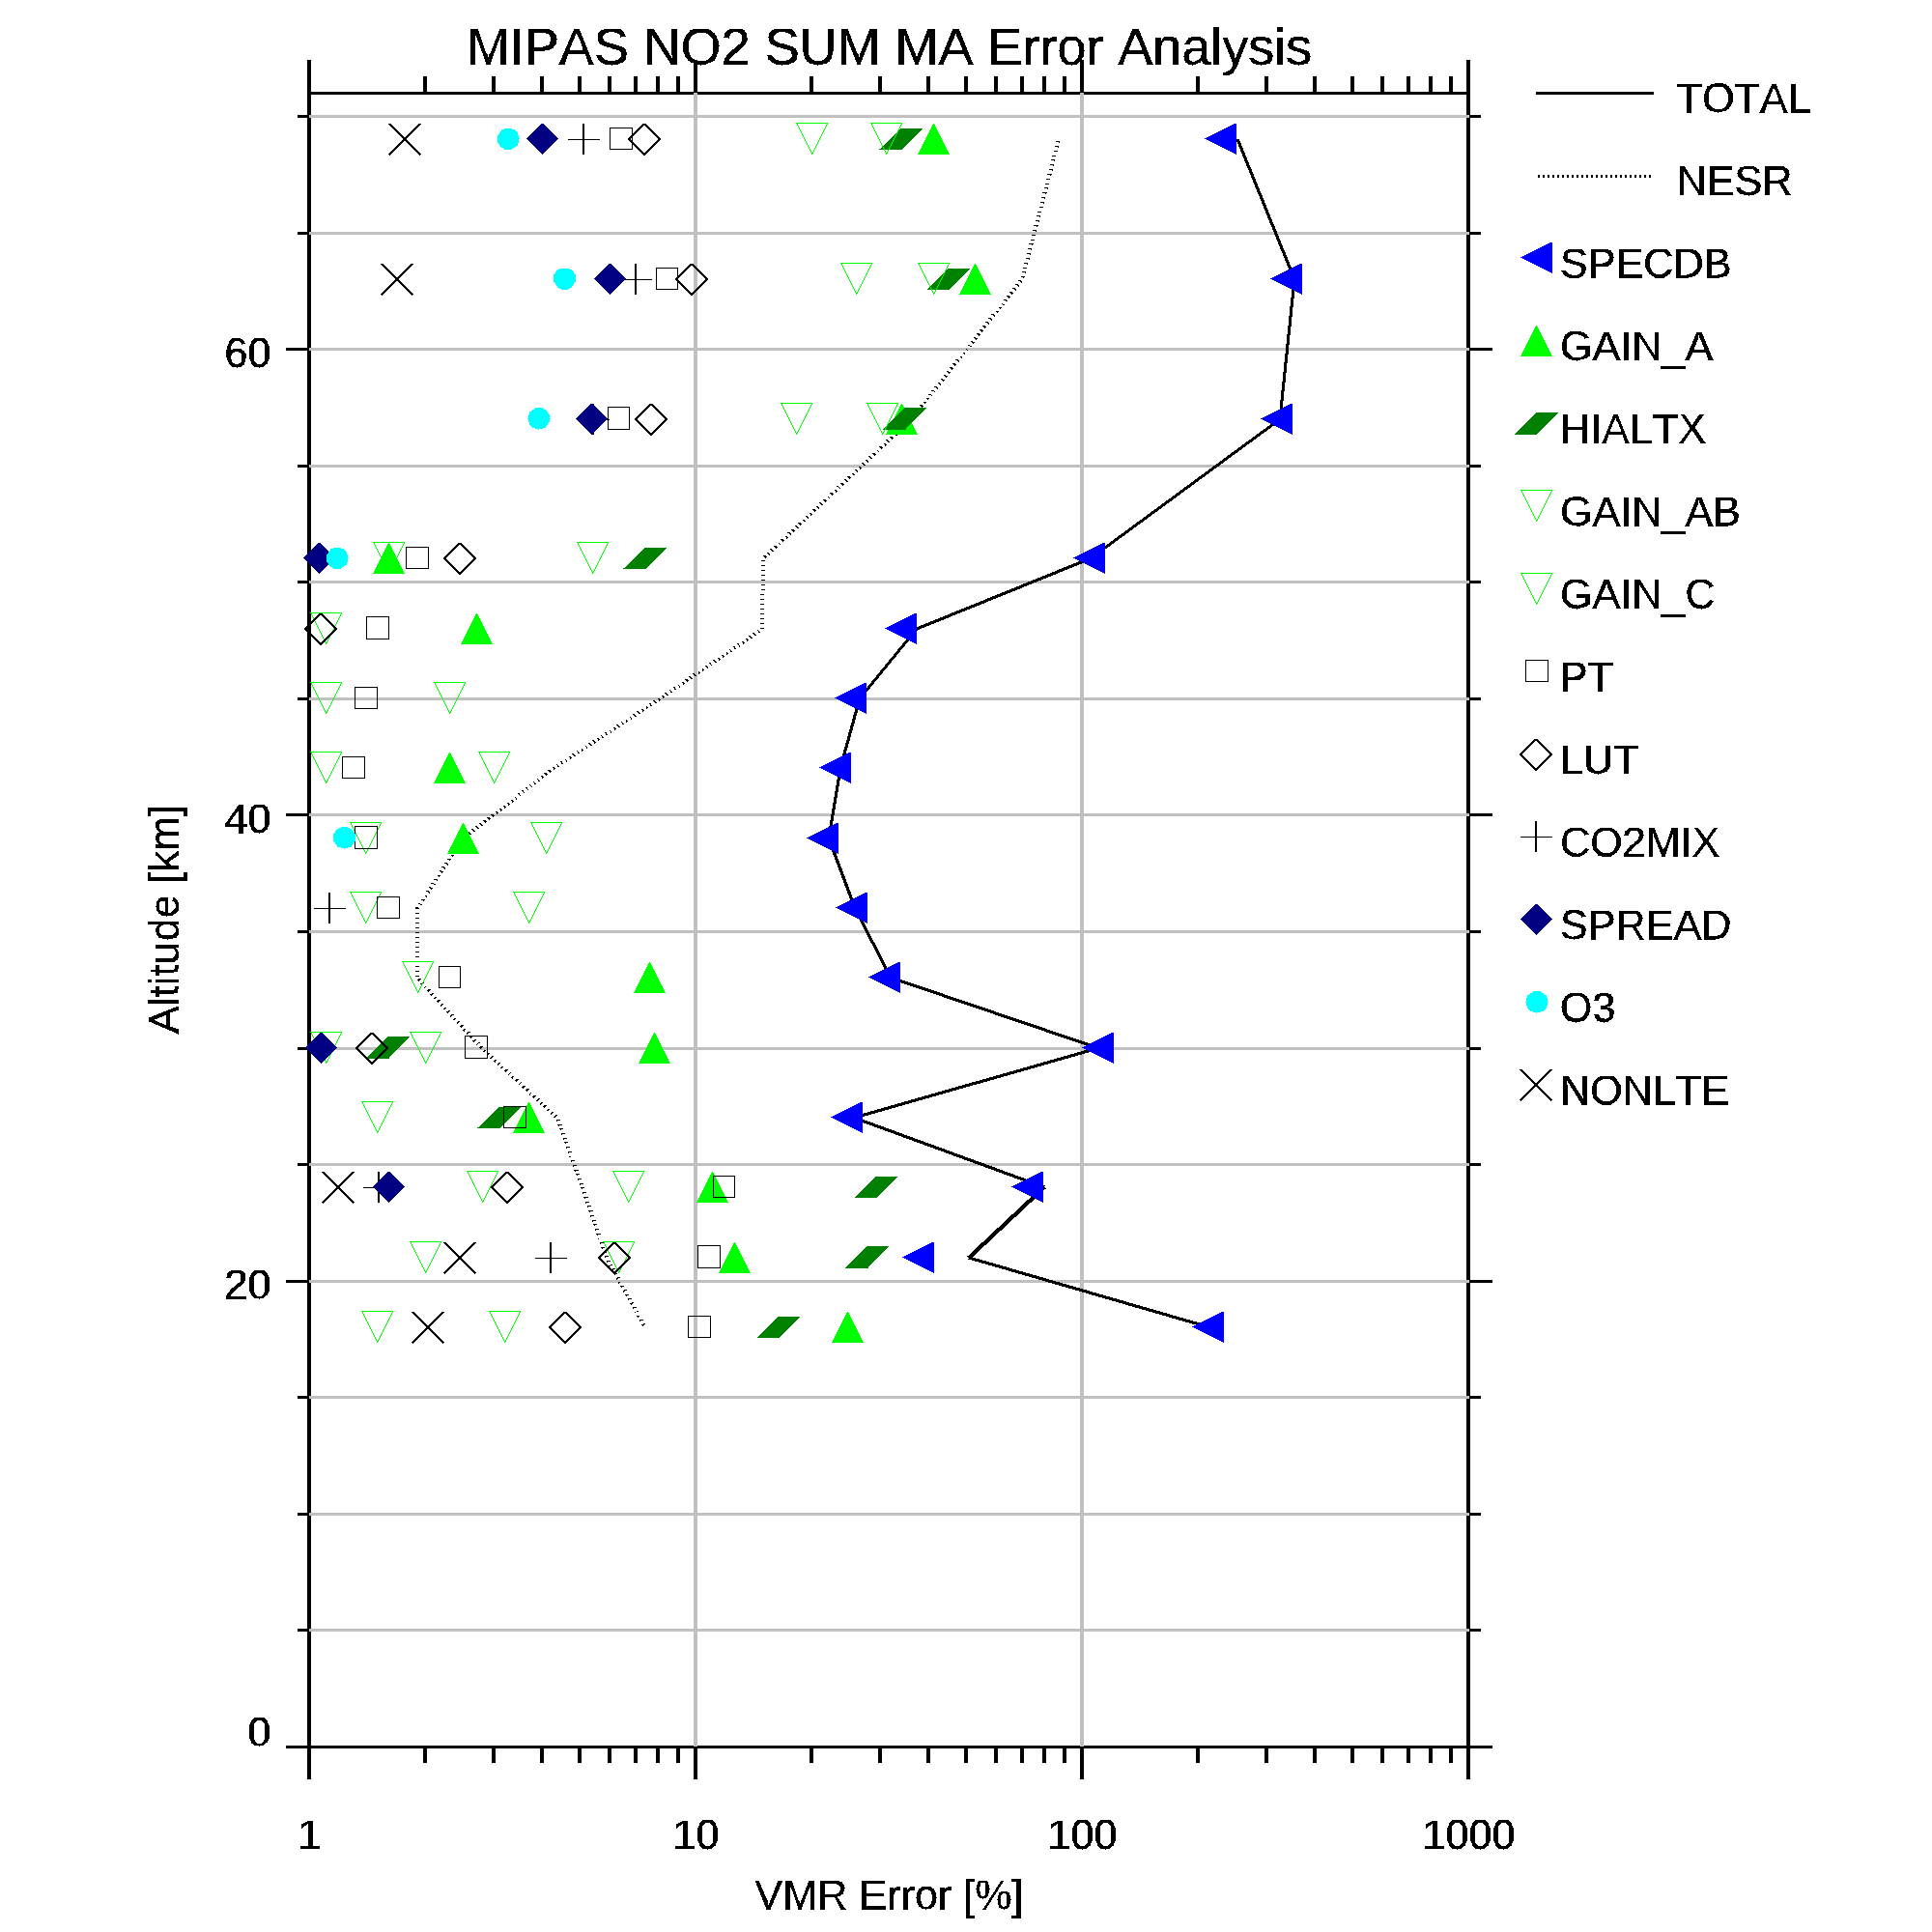
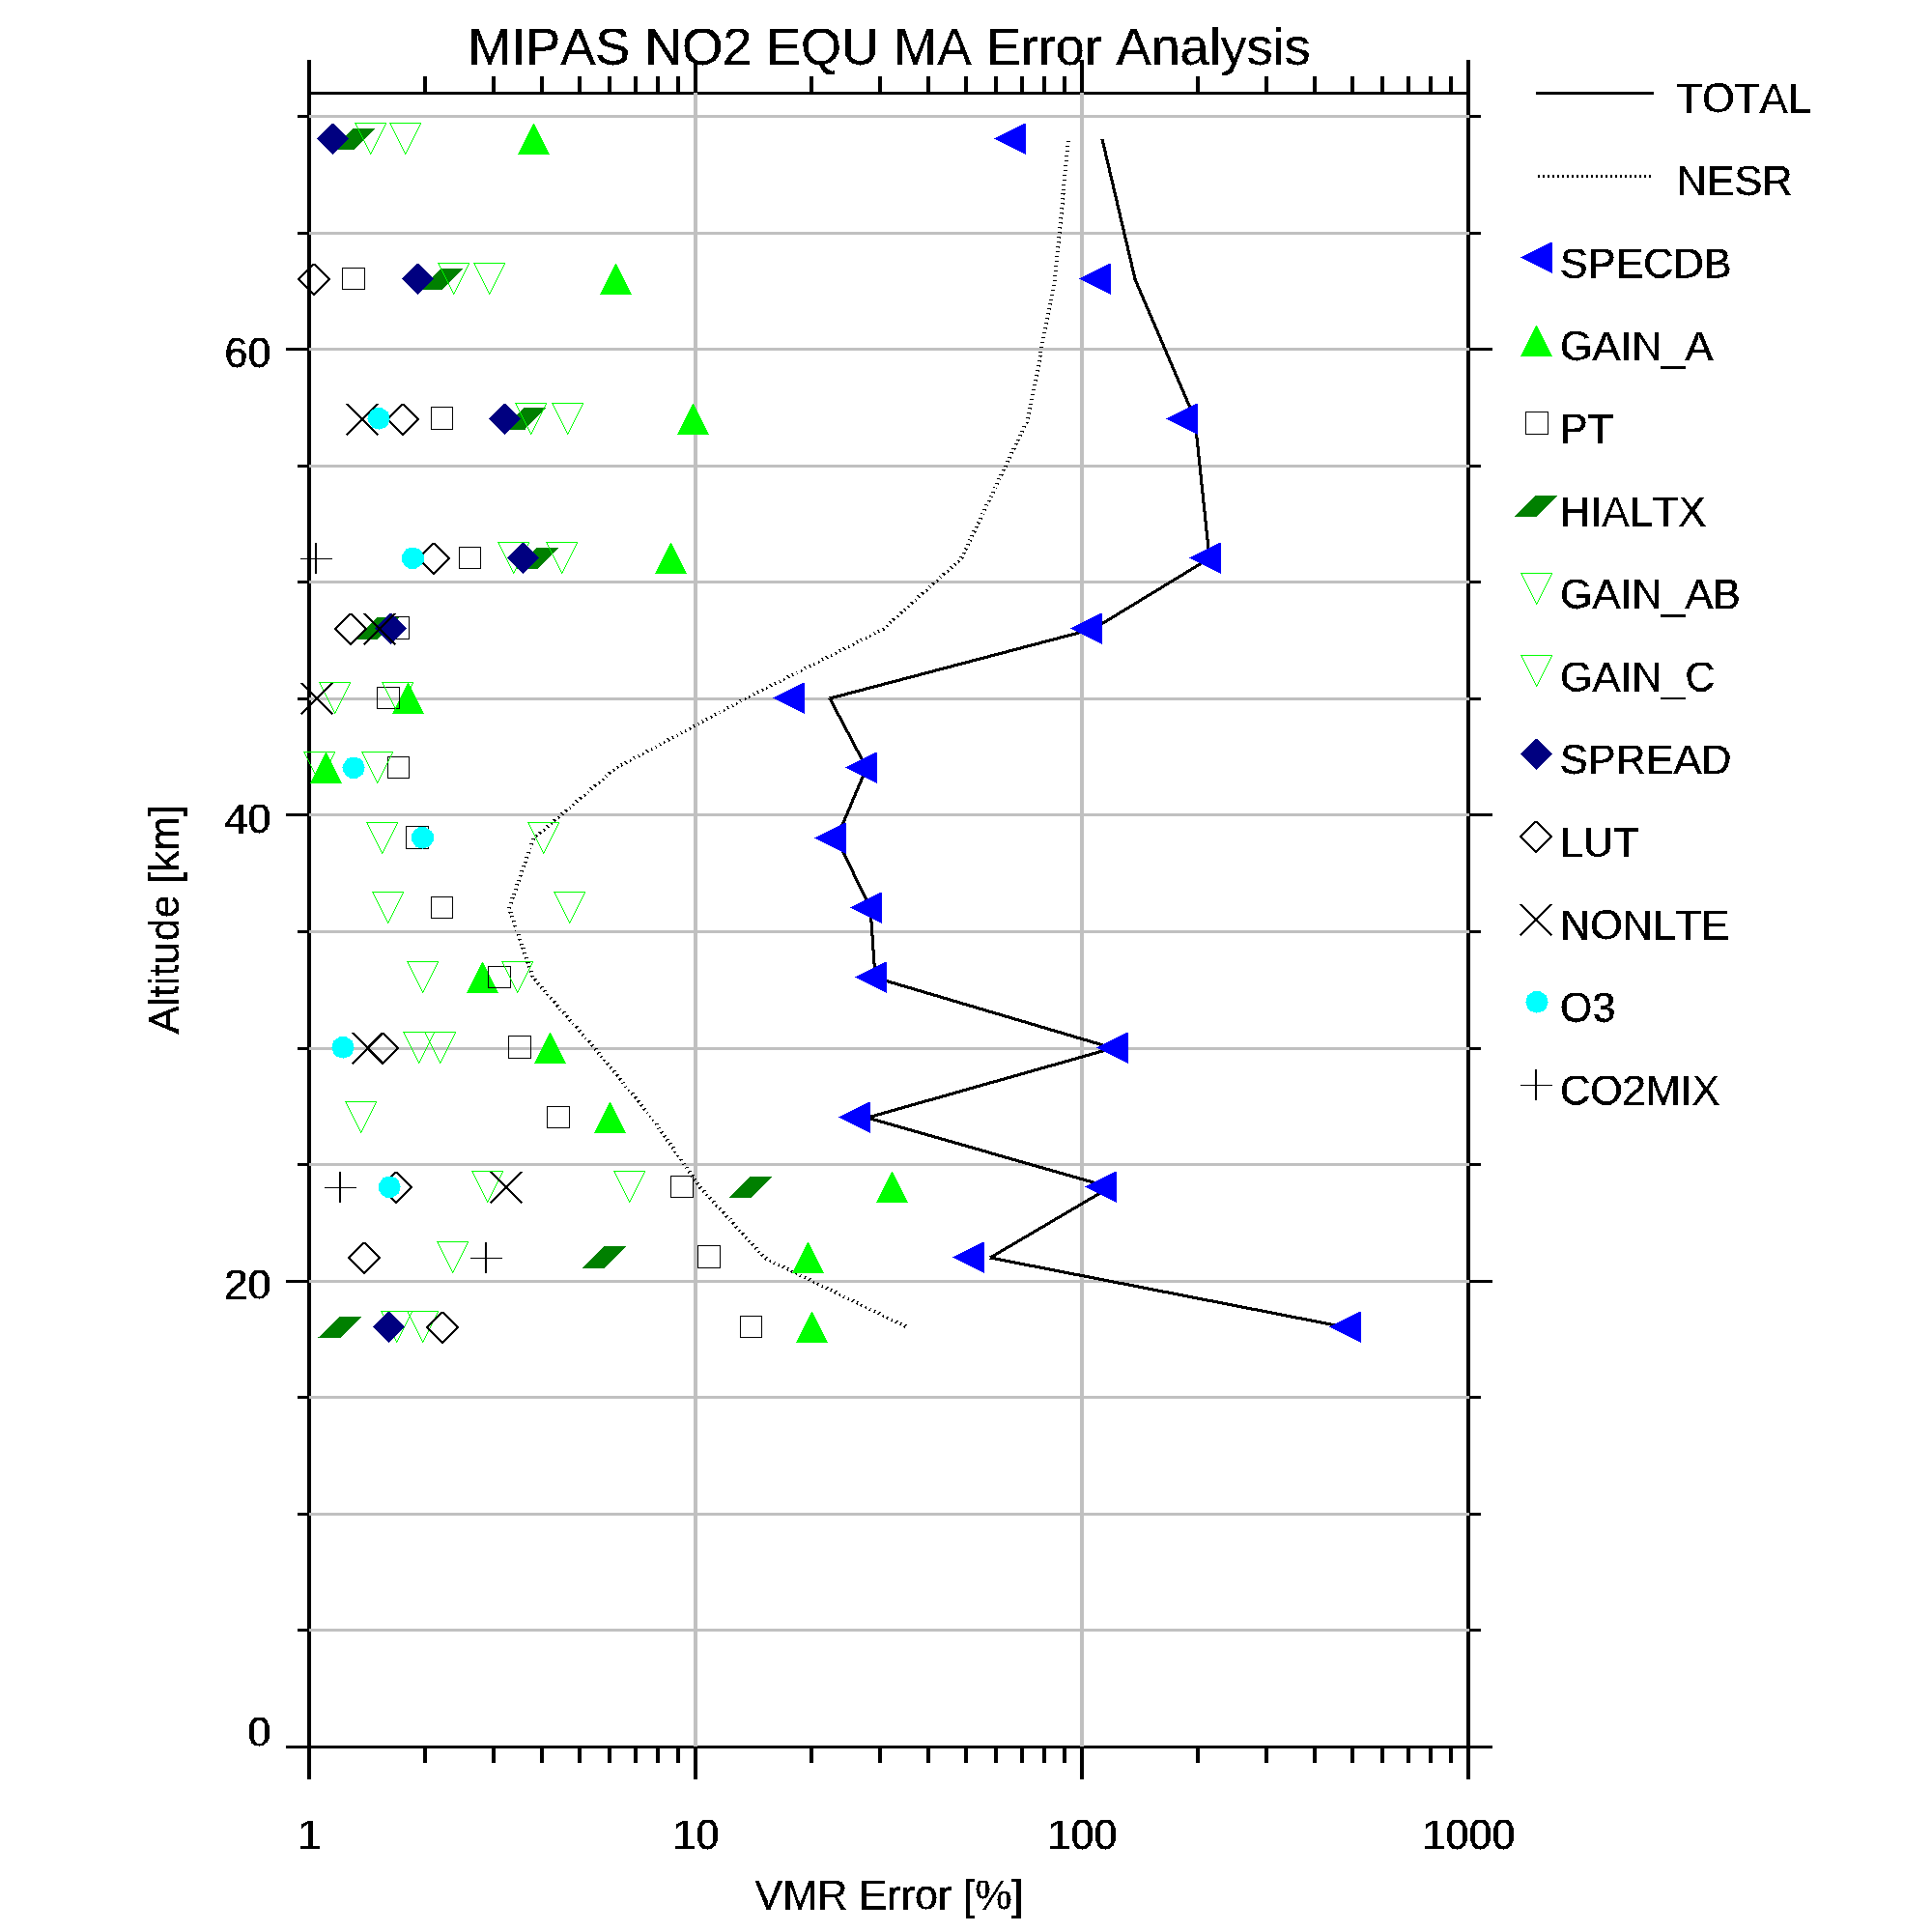
| NO2 | [Prof] [MW] | [Plot] [Data] | [Plot] [Data] | [Plot] [Data] | [Plot] [Data] | [Plot] [Data] |
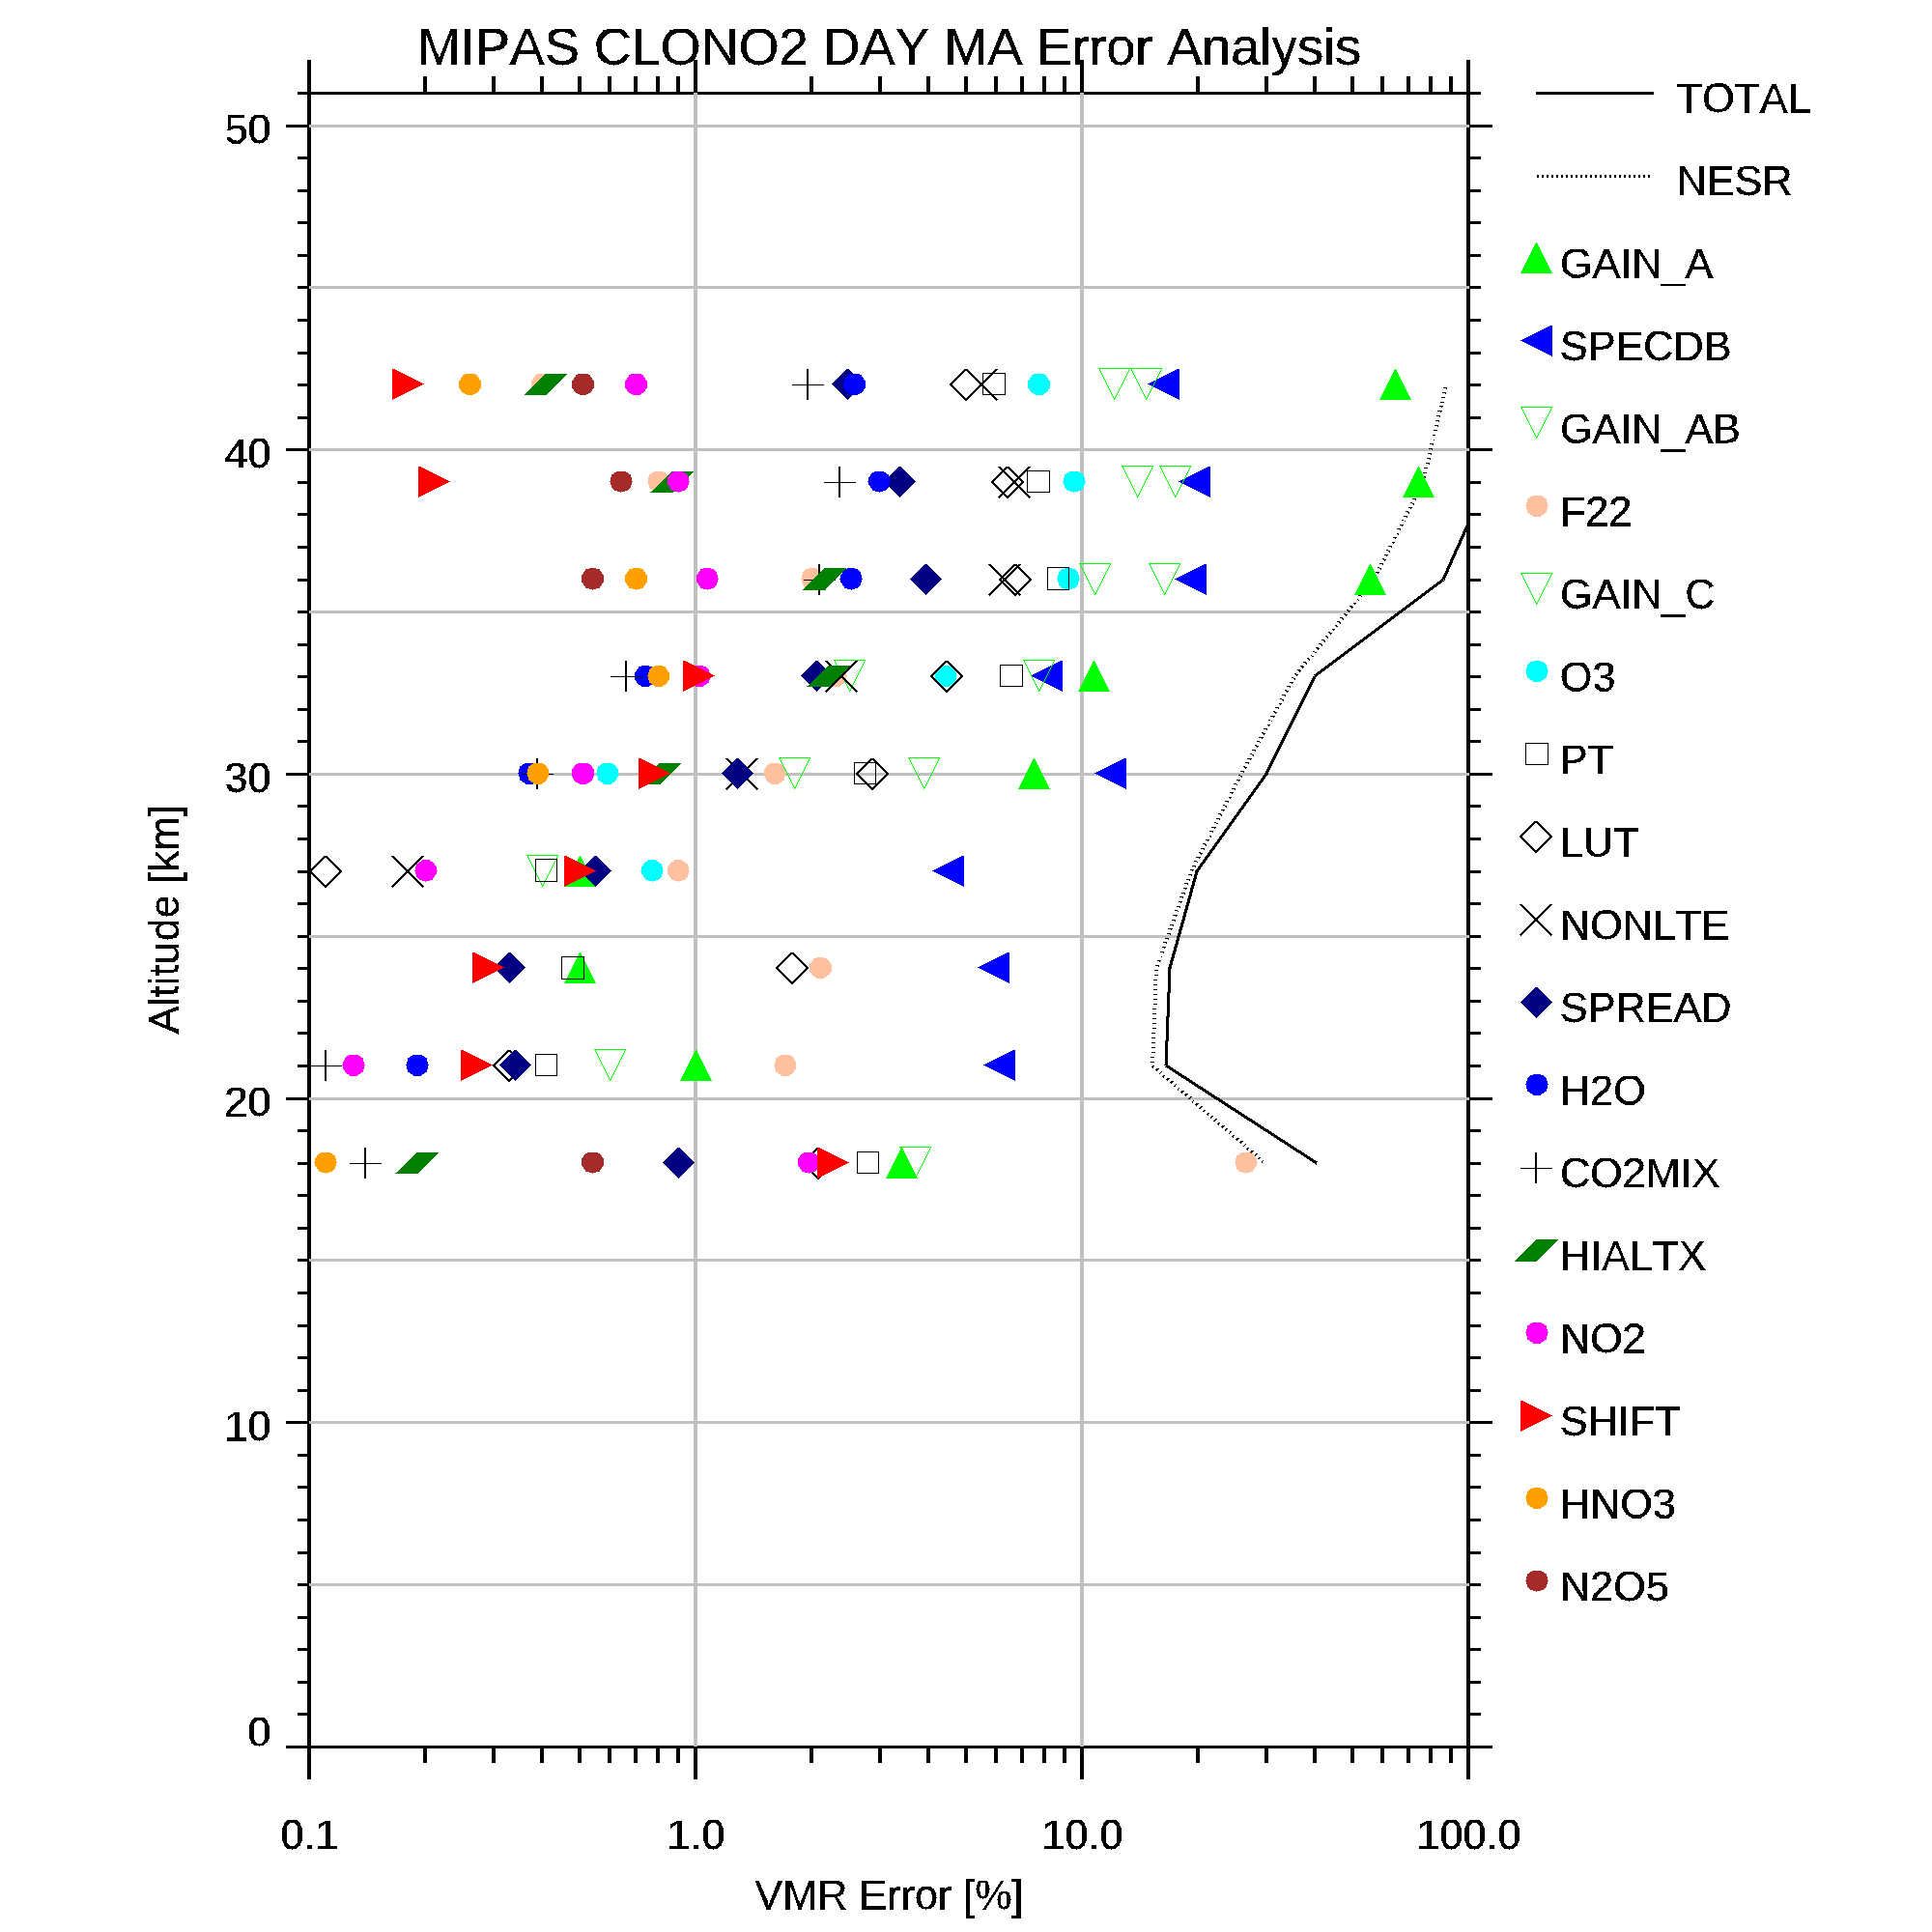
| CLONO2 | [Prof] [MW] | [Plot] [Data] | [Plot] [Data] | [Plot] [Data] | [Plot] [Data] | [Plot] [Data] |
| F11 | [Prof] [MW] | [Plot] [Data] | [Plot] [Data] | [Plot] [Data] | [Plot] [Data] | [Plot] [Data] |
| F12 | [Prof] [MW] | [Plot] [Data] | [Plot] [Data] | [Plot] [Data] | [Plot] [Data] | [Plot] [Data] |
| N2O5 | [Prof] [MW] | [Plot] [Data] | [Plot] [Data] | [Plot] [Data] | [Plot] [Data] | [Plot] [Data] |
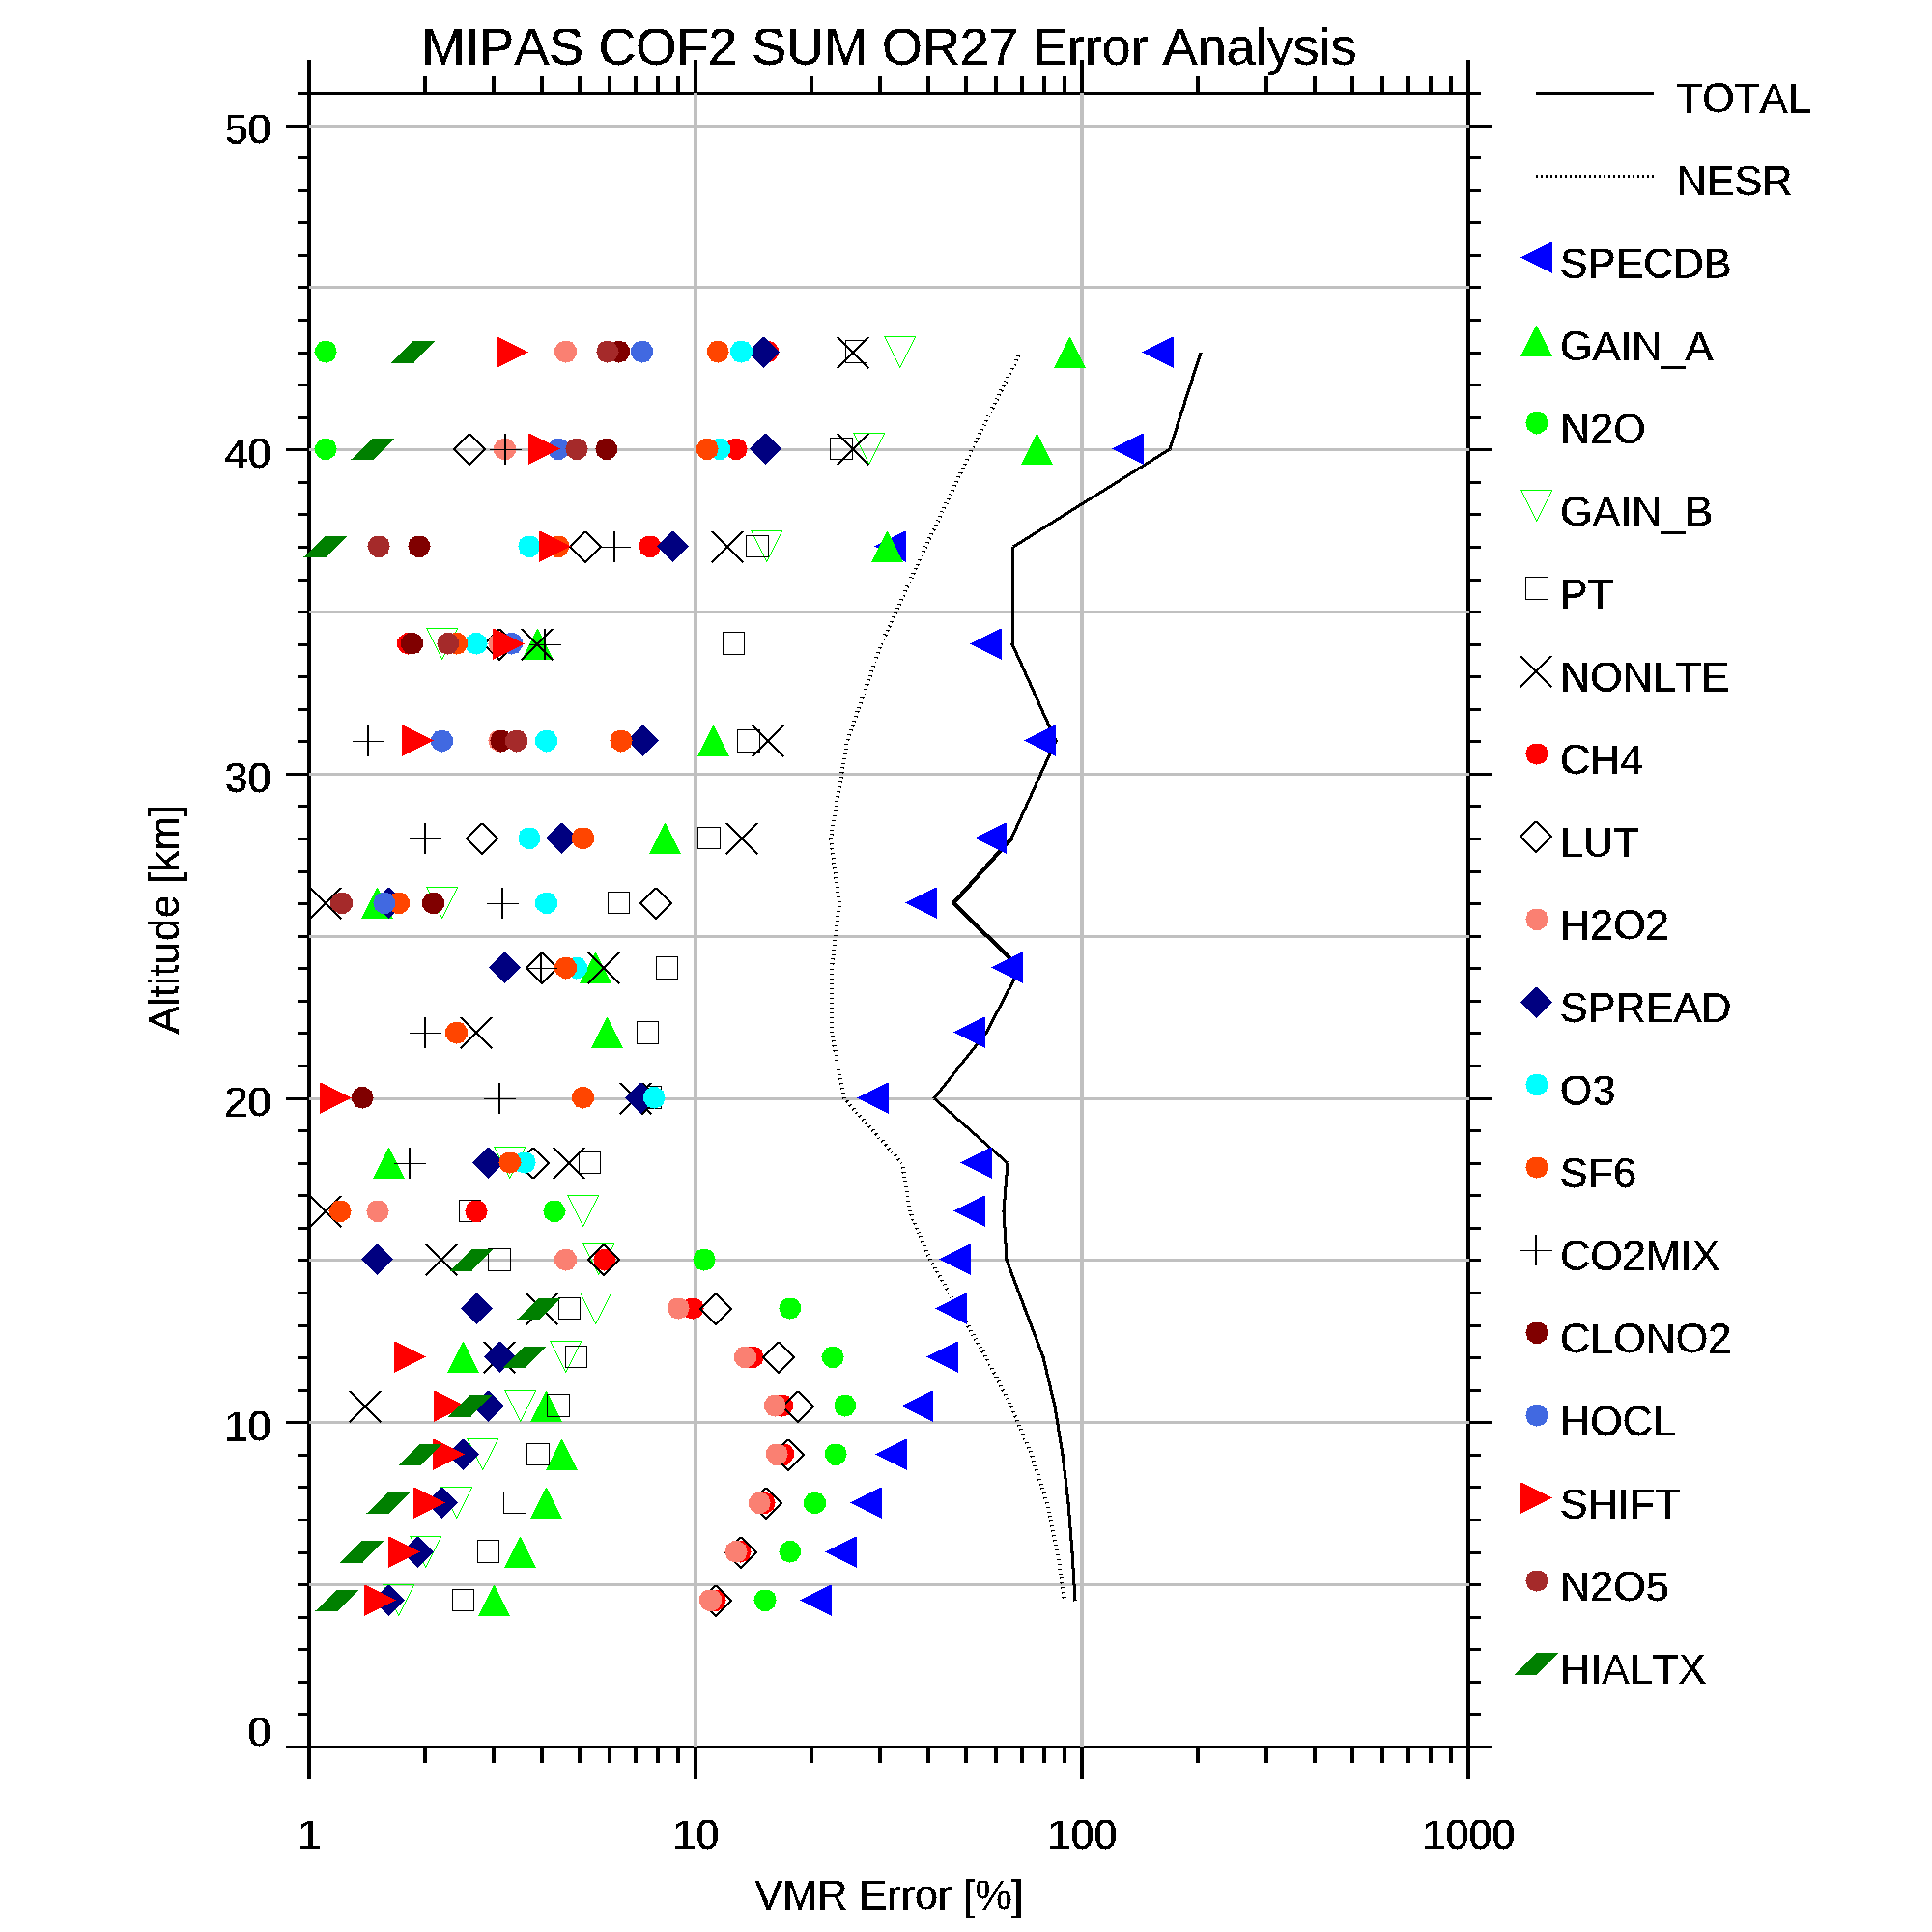
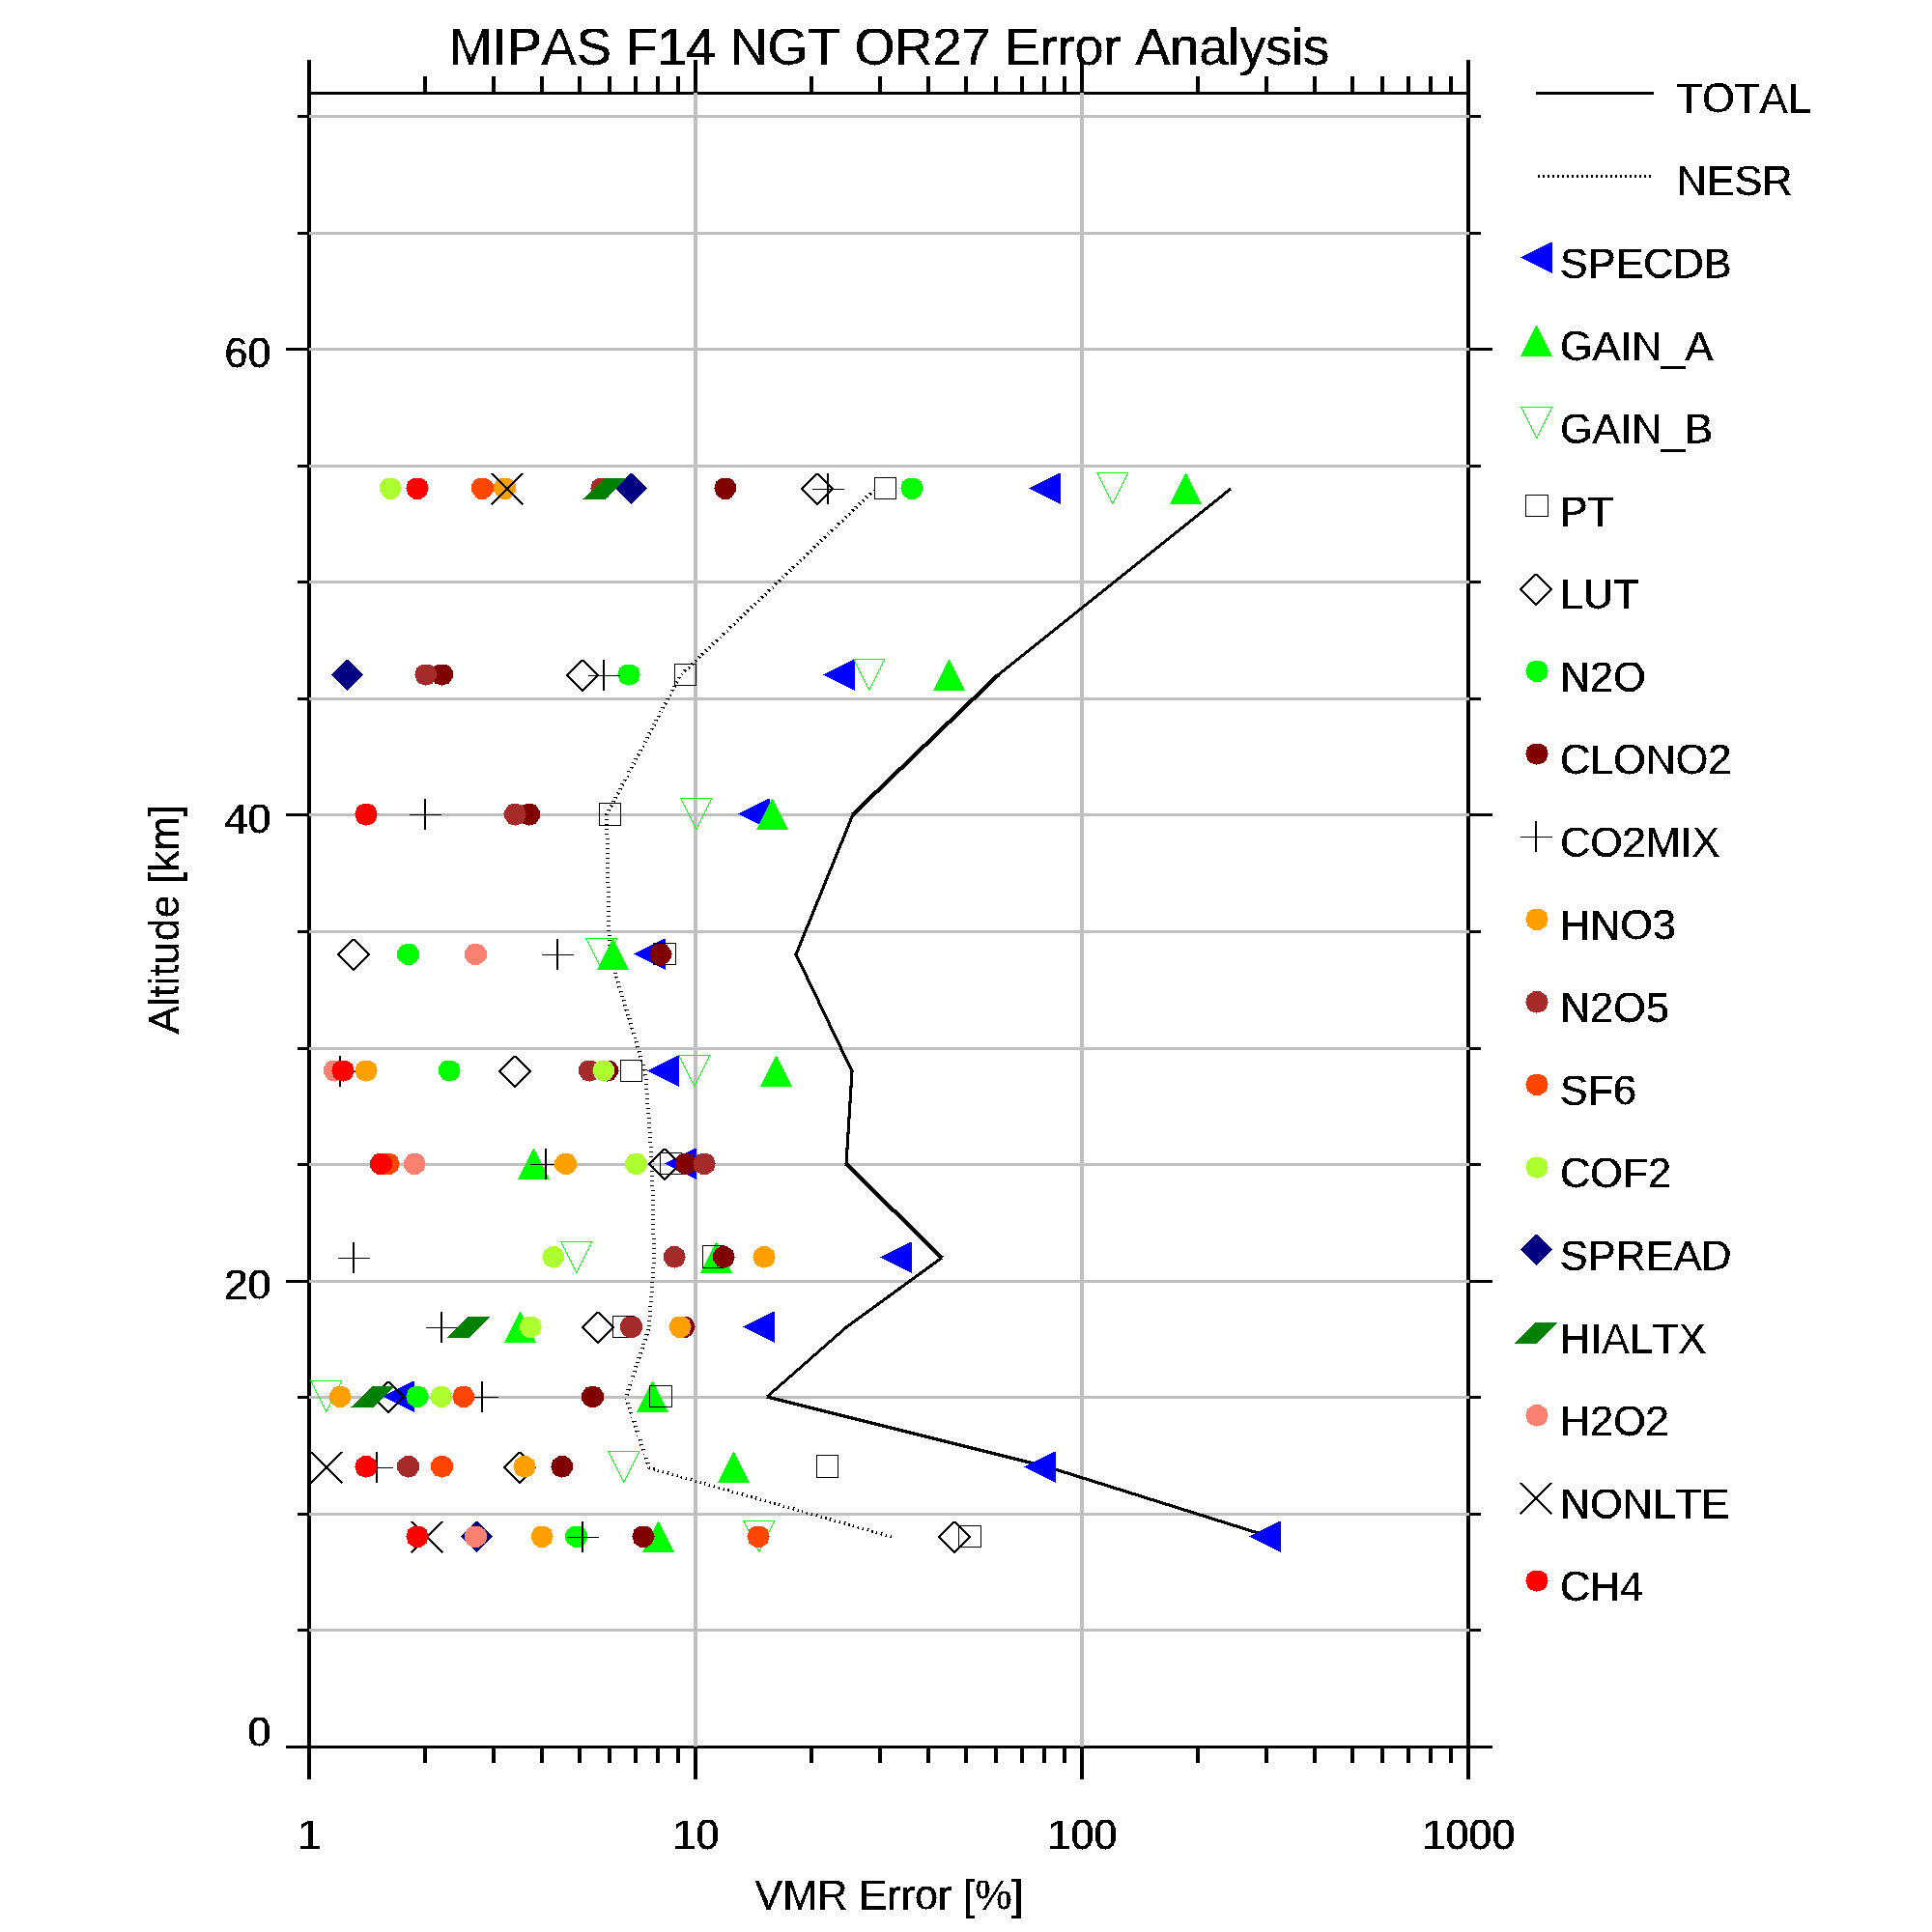
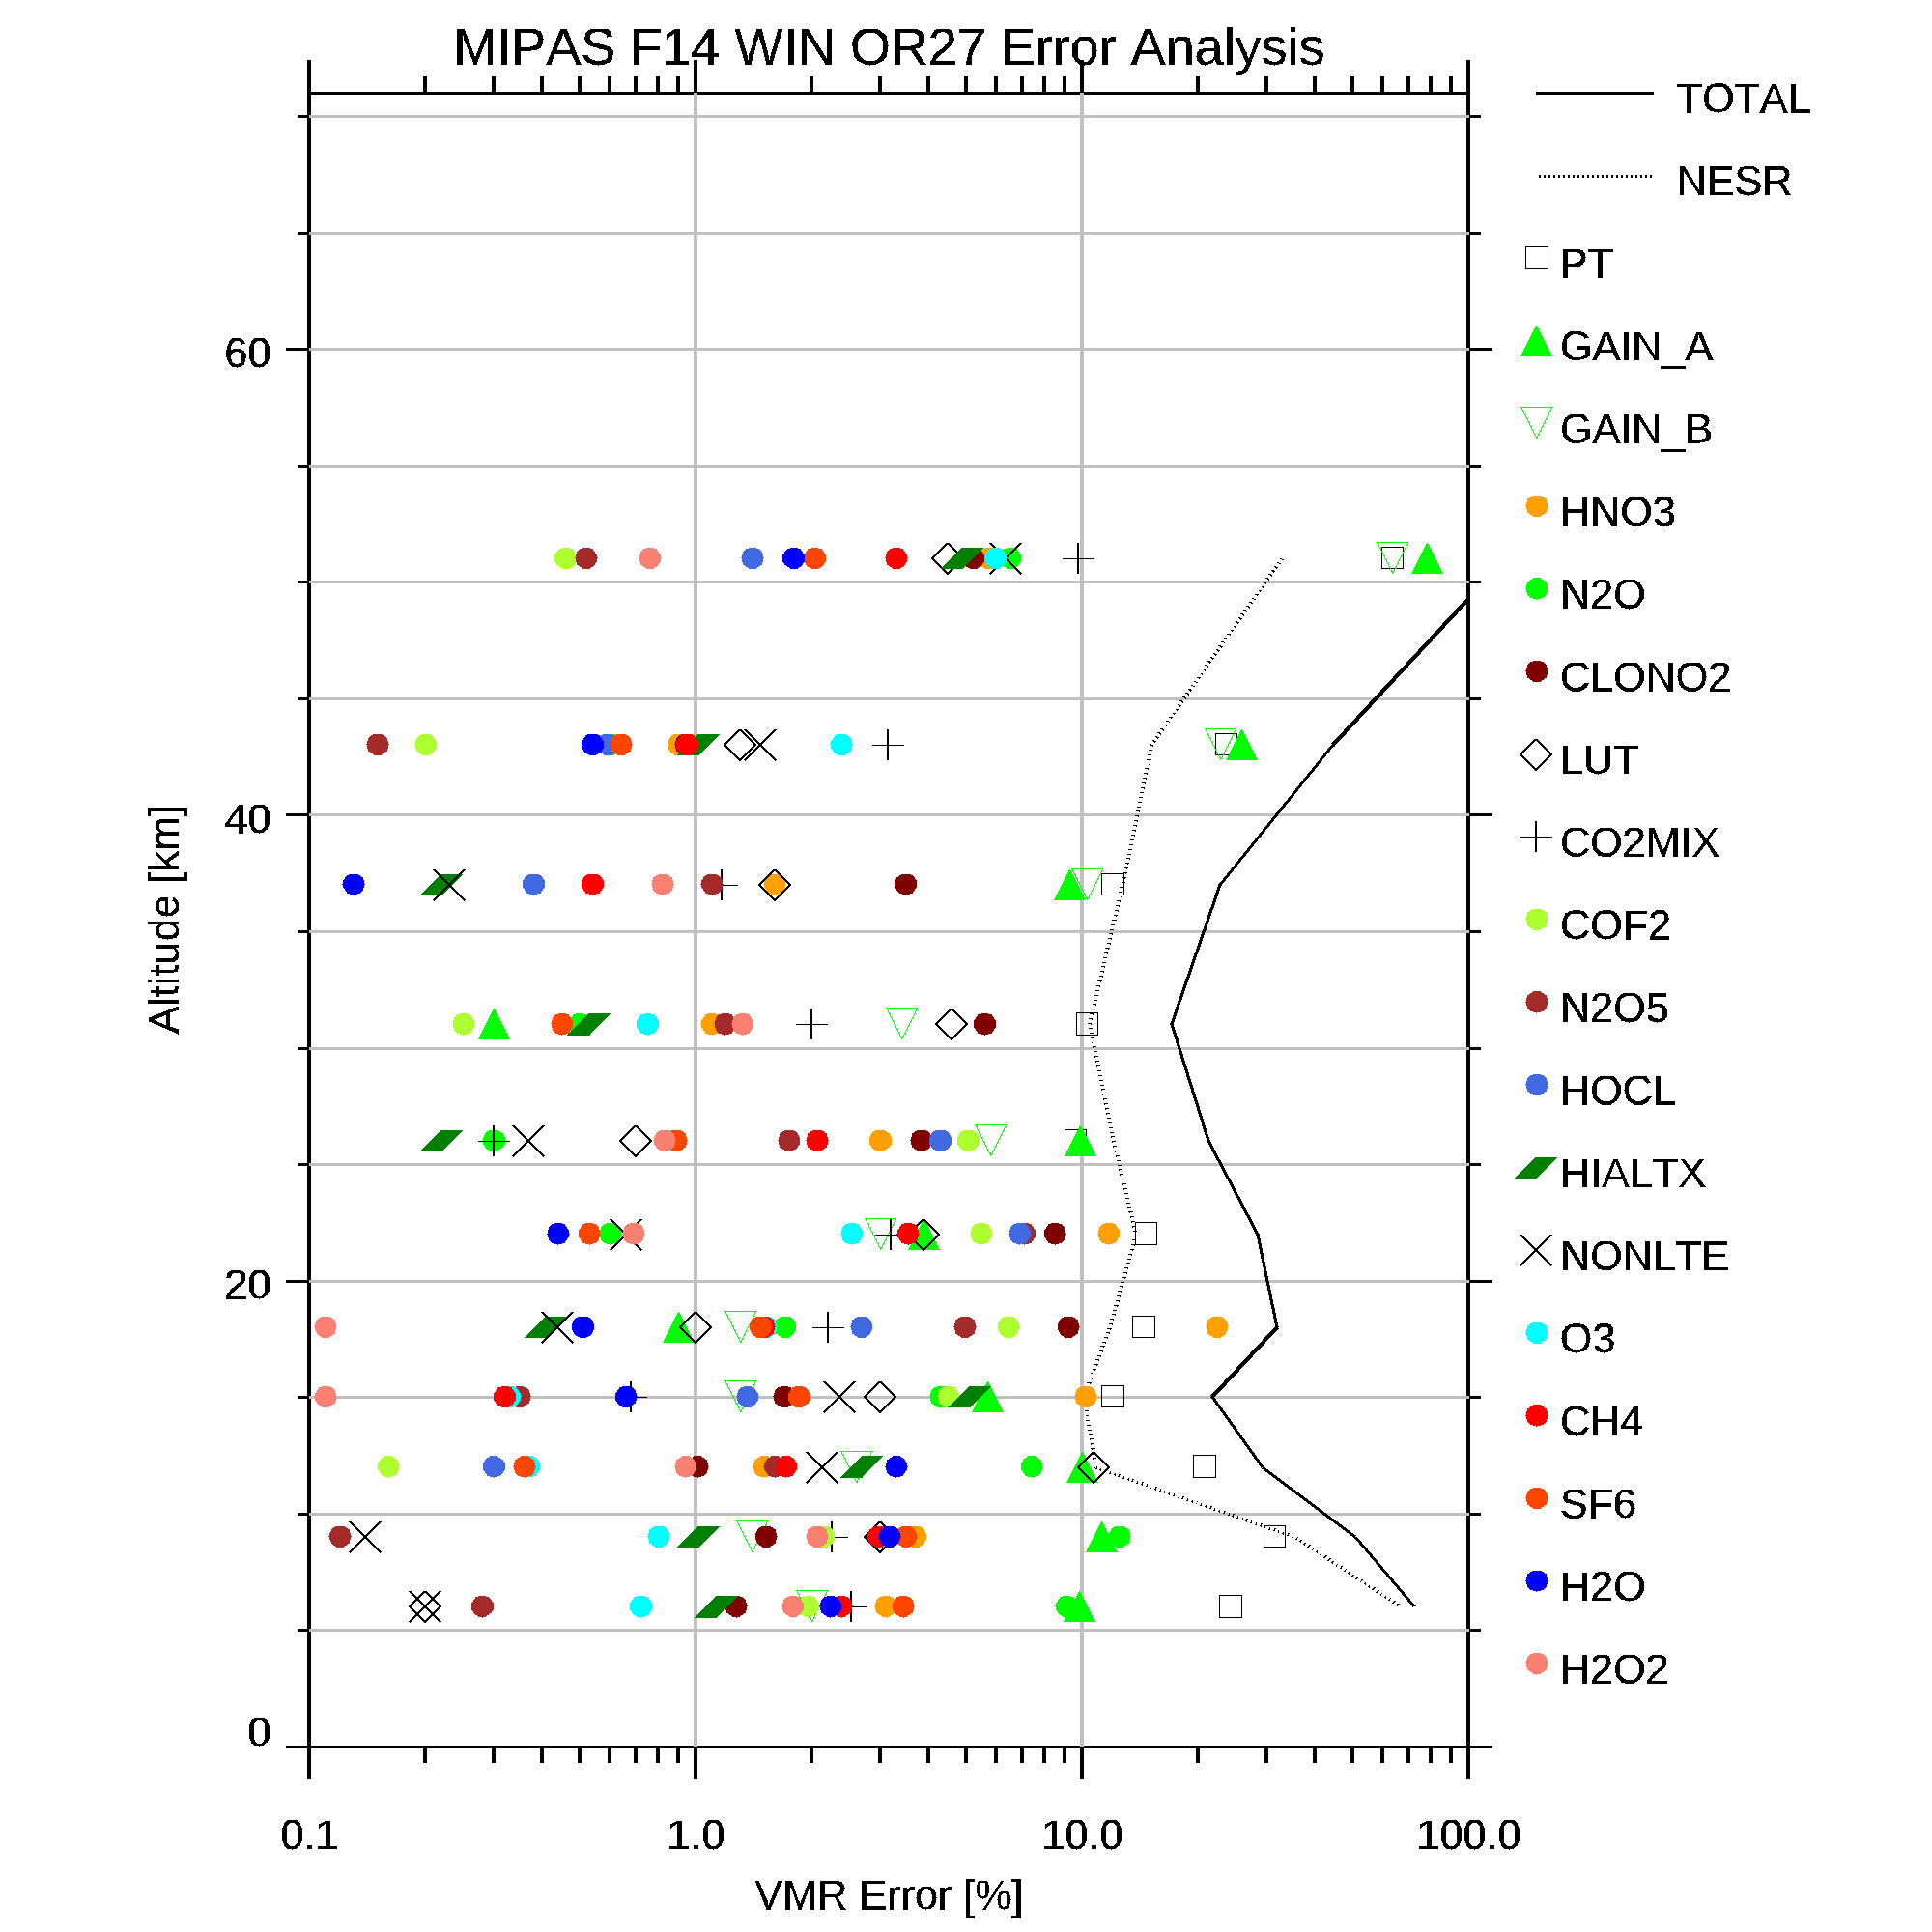
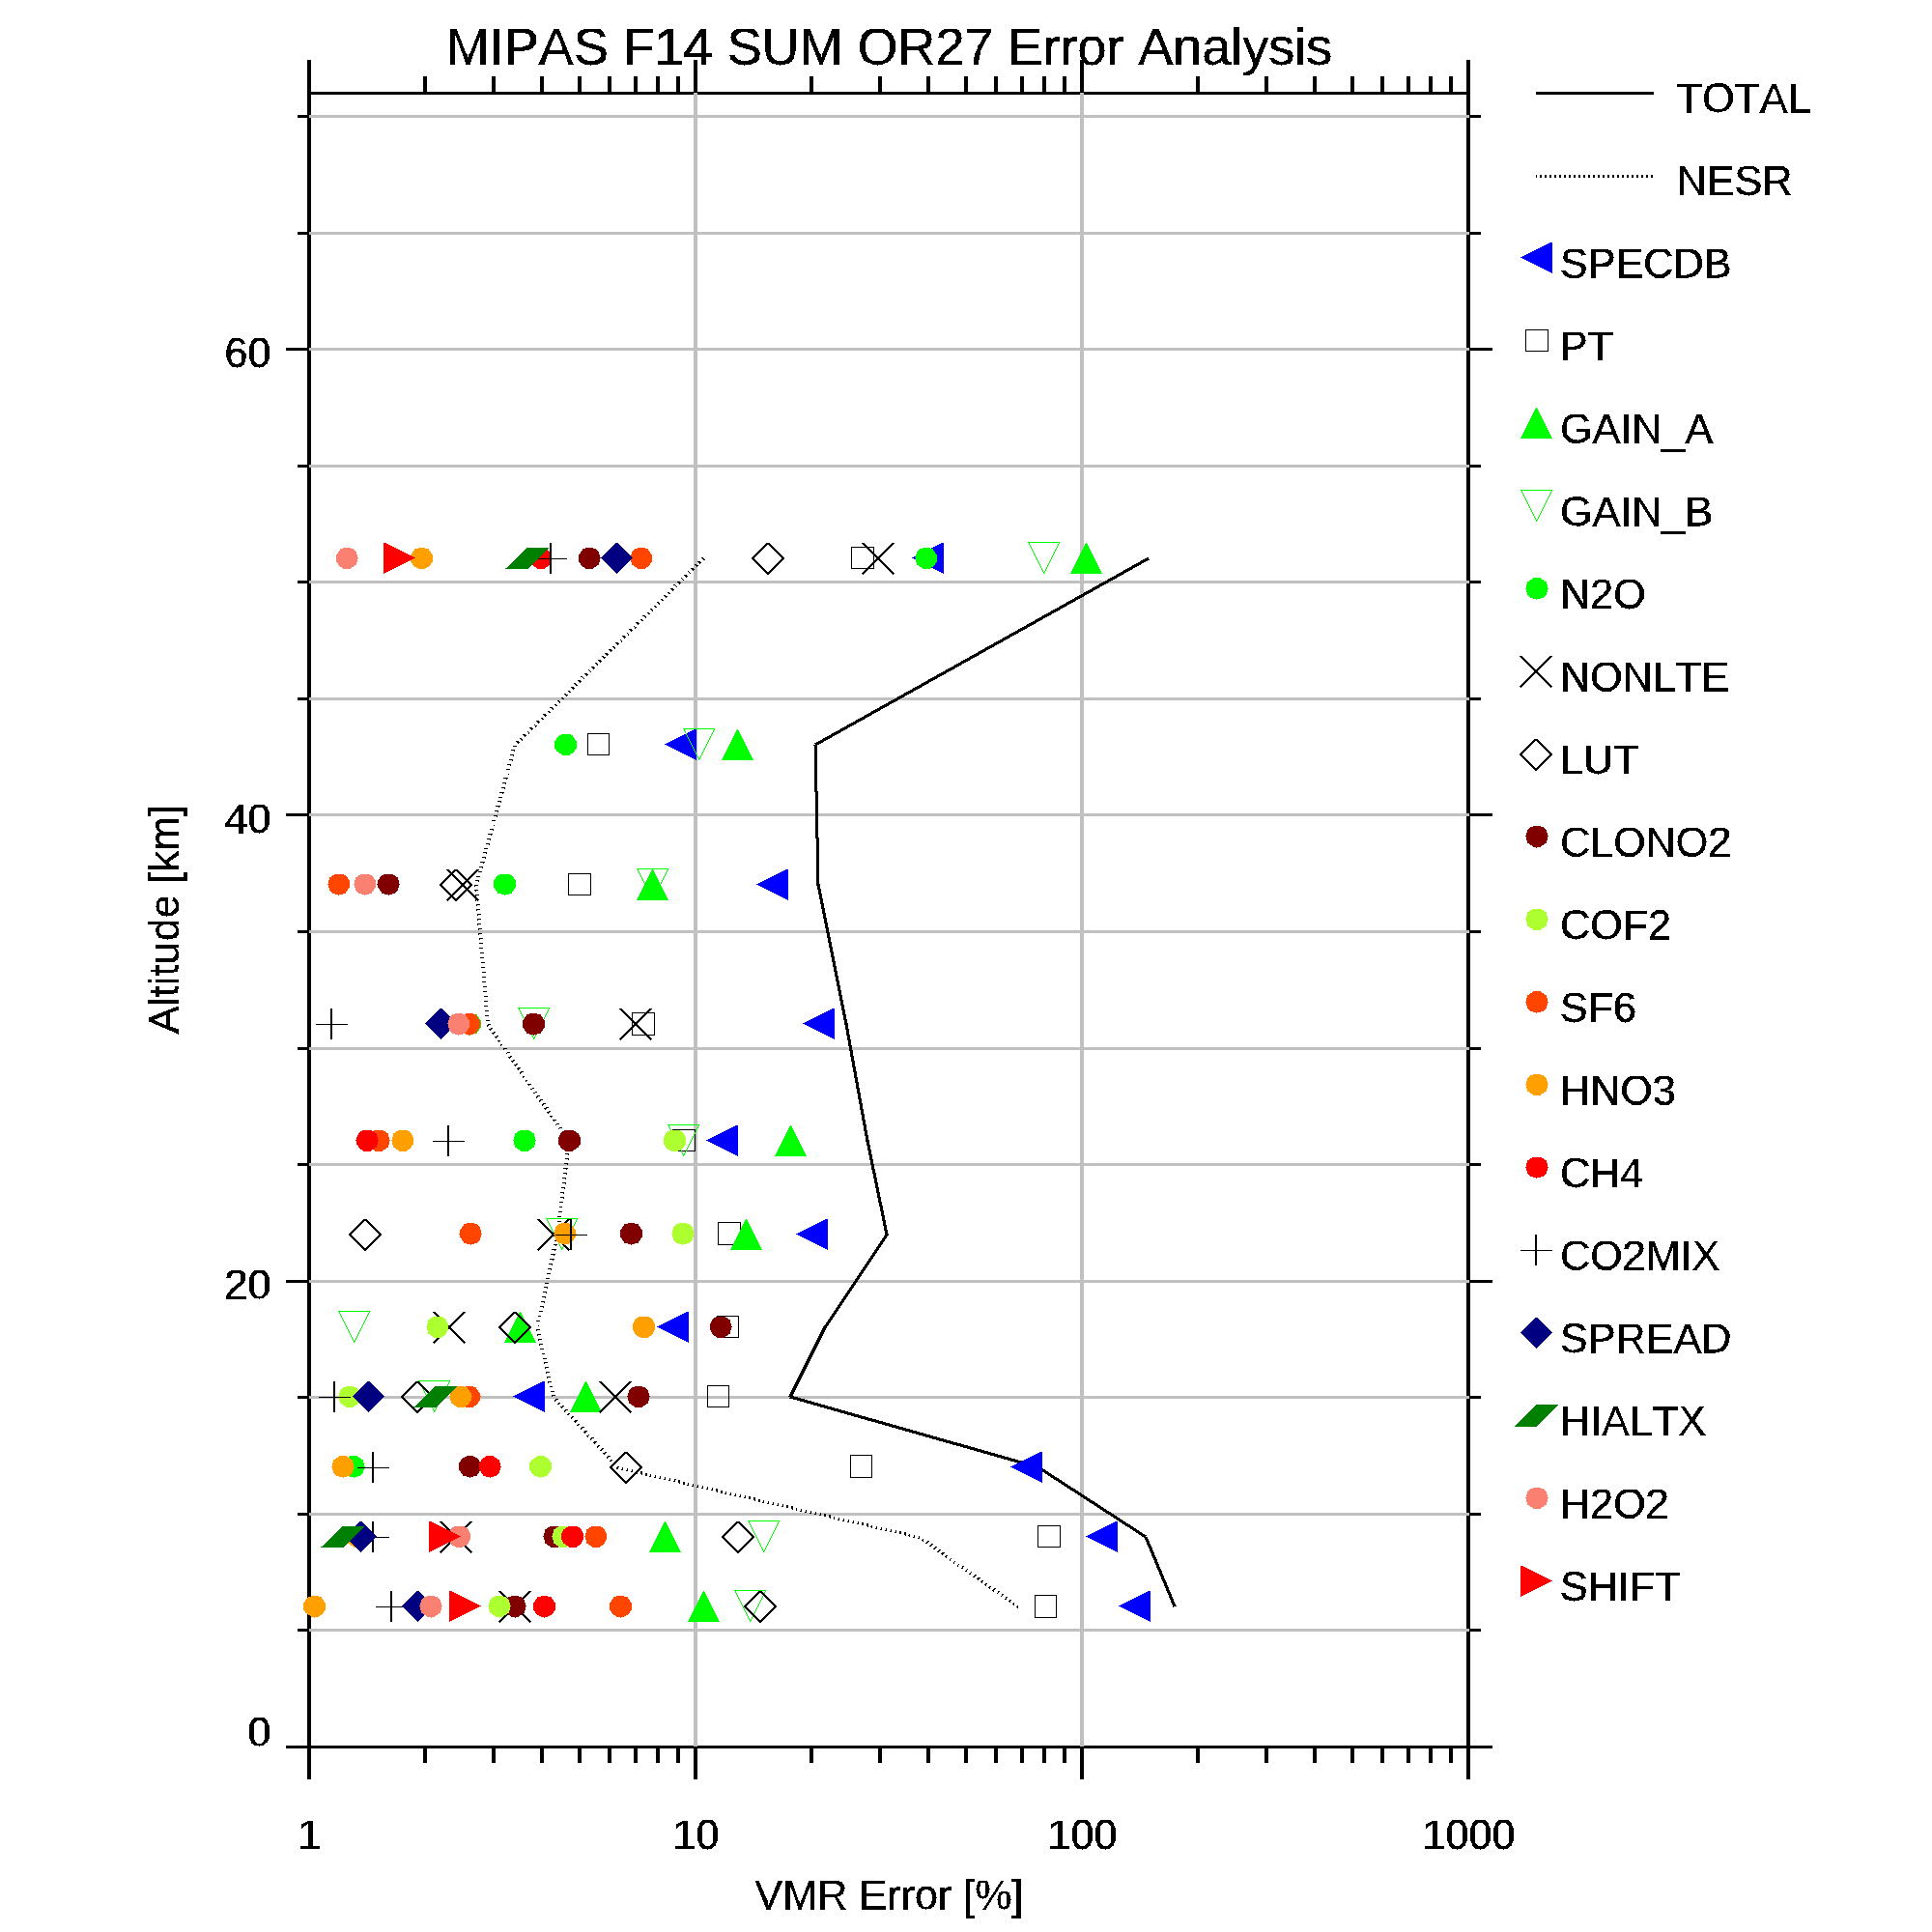
Fortunately, two of the larger systematic errors (PT and SPECDB) can be treated properly:
The pT propagation error (PT) is uncorrelated between any two MIPAS profiles (since it is just the propagation of the random component of the pT retrieval error through the VMR retrieval) so contributes to the SD of any profile comparison
Spectroscopic database errors (SPECDB) are constant but of unknown sign, so will always contribute to the Bias of any comparison, but note that the magnitude of these errors is very uncertain.
Of the other significant errors, the calibration-related errors (GAIN, SHIFT, SPREAD) should, in principle, be uncorrelated between calibration cycles however analysis of the residuals suggests that these errors are almost constant so could be included in the Bias.
The high altitude column (HIALT) and contaminant gas errors ([species]) are likely to be correlated over small areas (1000km) or times (weeks), hence contribute to the Bias for localised comparisons, but as the comparison datasets are extended these errors will contribute more to the SD.
Line mixing errors (CO2MIX) are also contribute towards the Bias but in principle the sign of these errors is known (unlike spectroscopic errors) so this bias could be removed. Non-LTE errors (NONLTE) should also, in principle, contribute a known Bias but these are highly variable (especially diurnally) so care has to be taken to make sure that representative conditions for the comparison are used.