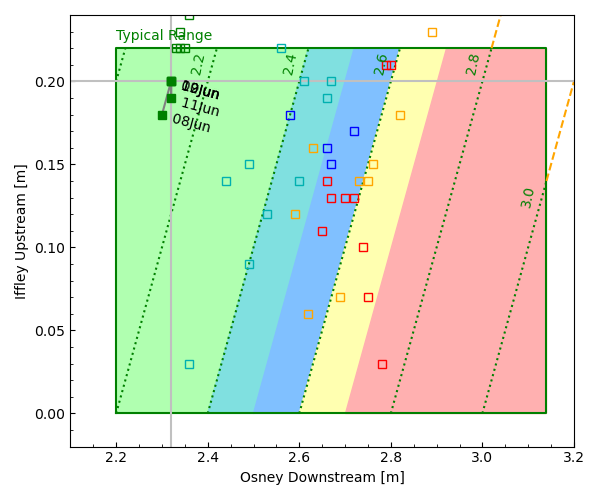
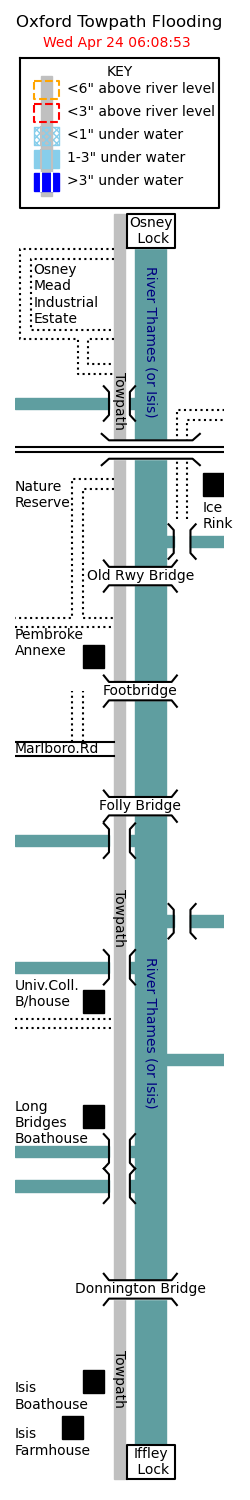
EA GaugesThe plot below shows recent levels recorded by the EA gauges at the upstream end of Iffley lock (IU) and the downstream end of Osney Lock (OD), which mark the lower and upper ends of the main part of the Isis within Oxford.
The green-bordered rectangle shows region within the EA definition of the 'Typical Range' for both gauges, with coloured bands indicating approximate ranges of different flag conditions (assuming that the flow speed is related to the OD-IU difference). Dotted lines are lines of constant (OD-IU) difference, i.e. approximately constant flow speed. Solid squares, with dates, show the last 5 days, open squares are the most recent data for each flag type.
Ongoing Sequence of Flag DaysFor Light Blue, Dark Blue and Amber flags this shows the number of days at that flag level or higher.
Comparison with Recent Years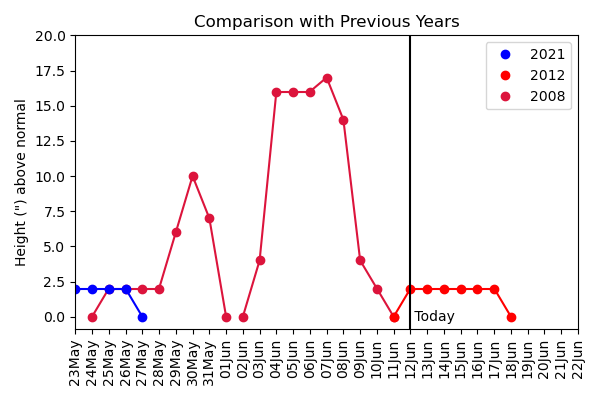
The plot above shows the river level (expressed in inches above normal at Friar's Wharf) at this time of year in recent years, indicated by different colours. The data extend back to 2007 but only years when the river reached Blue Flag conditions or higher are shown (Blue flag plotted as 2", Amber flag as 4", everything else Red Flag).
External links
|
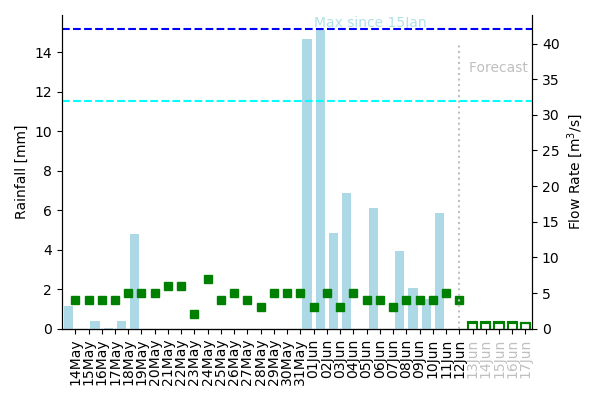
Flow Rate & RainfallThe Osney-Iffley river level difference, which controls the flow speed (distance/time) can vary rapidly from day-to-day as the weirs are opened or closed, but a more smoothly varying quantity is the flow rate (volume/time), which is the product of flow speed x cross-section area. This is expected to increase rapidly following heavy rainfall (after a delay of about a day or two), and then smoothly decay back to a 'normal' level.
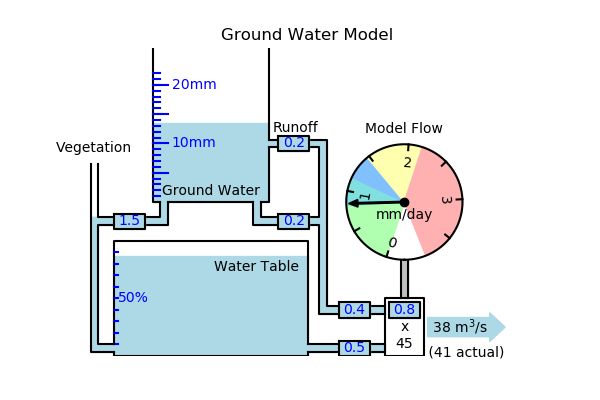
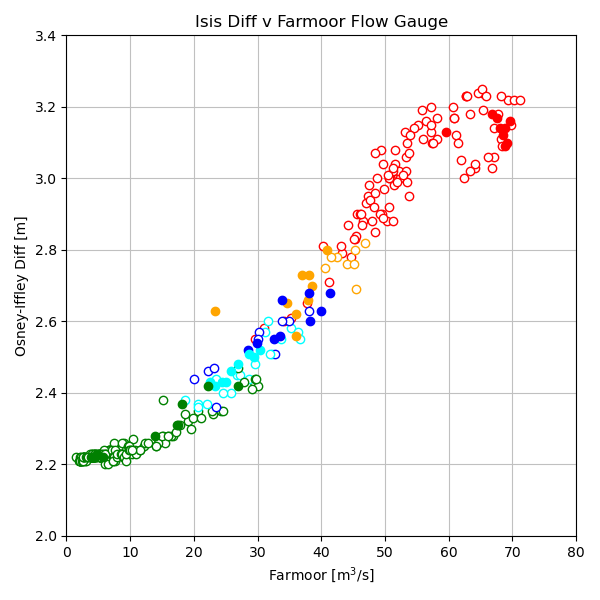
The plot above shows the past 30 days of daily rainfall (left-axis, bars), recorded by the AOPP Weather Station in central Oxford, and the estimated flow rate (right-axis, squares), derived as below. Flow rate F [m3/s] is estimated from The number 2.11m is the altitude difference between the reference points for the two locks. The factor 100 is chosen to convert to a flow rate which approximately matches the geometric average of the nearest Thames flow meters which are about 10 miles upstream (Farmoor) and 10 miles dowstream (Sutton Courtenay). This assumes a linear relationship although it actually deviates at high and low flow rates. The following plot shows the correlation between the modelled flow and the flow directly measured by the Farmoor gauge for the past year (the most recent 5 days are shown by solid symbols): ForecastThe Forecast in the above plot assumes no further rain, and since 1st January 2024 has been based on a ground water model whose current state is shown below.
Statistical ForecastAn alternative approach is simply to look for occurrences of the last three days' flags in the last 10 years, and base a forecast on the subsequent changes. Ideally this would be confined to occurrences around the same time of year ('Seasonal') but where fewer than 20 previous such patterns have been found, year-round data are used ('Annual'). Since the 'Light Blue' flag is a relatively recent innovation (2021) it will be under-predicted in favour of Blue.
|
