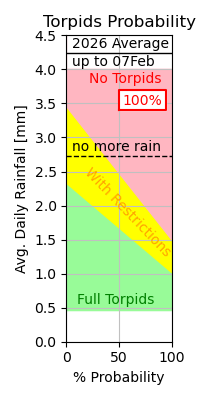
The plot shows the current average daily rainfall for 2026 (solid line) and the (Jan+Feb) average if there were no further rainfall (dashed line).
The background shading is based on (Jan+Feb) rainfall records going back to 1987 [here], with values ranging from 0.5mm (2023) to 4mm (2014) and a median of 1.7mm (2015).
So far 2026 has been wetter than any year other than 2014.
Torpids has never been run when the average daily rainfall for Jan+Feb has exceeded 3.5mm but has always been run (in some form) when the average is less than 1.5mm. Similarly, the 'Full' Torpids has always been run when the daily average was less than 1mm but has never been run when the average was above 2.3mm. I've just drawn straight lines between these points to define the three regions.
So, on that basis, 'Full' Torpids won't happen this year and, even in the absence of any more rain, we would be above the 1995 rainfall which is the highest in which any form of Torpids has happened.
To state the obvious, just taking the Jan+Feb rainfall as a single number is a crude basis for prediction. Rain at the end of February that will have a much bigger impact on Torpids than the same amount of rain in early January, but no allowance is made for this.