About EODG
People
Publications
Research
Aerosol Spectroscopy
MIPAS
ORAC
Volcanic Emissions
      Ash Spectroscopy
      Ash & SO2 Retrieval
      Eruption Monitor
      Eyjafjallajökull
      Grimsvötn
      Karthala
      Nabro
      Puyehue
Software & Databases
Local Information (restricted)
(printable)

Images of the Eruption


Click image to enlarge

Click image to enlarge

Click image to enlarge

Click image to enlarge

Click image to enlarge
The photo of Thorvaldseyri farm. (O. Eggertsson) Eyjafjallajökull eruption April 17 2010. (S. Holm) (O. Vandeginste) (O. Vandeginste) Eyjafjallajökull ash cloud. (P. Greenfield, OSU)


AOPP Oxford observations of April 2010 Eyjafjallajökull eruption


This page provides an overview of research performed within the Earth Observation Data Group (EODG) of the Atmospheric, Oceanic and Planetary Physics (AOPP) department at the University of Oxford, relating to the April 2010 eruption of the volcano at Eyjafjallajökull in Iceland. There are quite a few of us involved in this type of work within the Physics department. This work is funded mainly through grants from the UK Natural Environment Research Council (NERC), including the NERC National Centre for Earth Observation (NCEO).

All data and plots on this site should be considered preliminary work. Please contact us before reproducing these images elsewhere, or if you have further questions.

Our relevant research falls into four main fields, which are dealt with in more detail below:

  • Satellite observations of atmospheric aerosol (such as ash from the eruption) and cloud, from the Advanced Along-Track Scanning Radiometer (AATSR). This instrument flies aboard the European Space Agency (ESA) satellite Envisat.

  • Satellite observations of SO2 (sulphur dioxide), from the Infrared Atmospheric Sounding Interferometer (IASI), aboard the MetOp-A satellite.

  • Satellite observations of traces gases and high-altitude clouds, from the Michaelson Interferometer for Passive Atmospheric Sounding (MIPAS), also aboard Envisat.

  • Ground-based observations of aerosol and cloud from a lidar currently stationed at the Chilbolton Facility for Atmospheric and Radio Research (CFARR) in Hampshire.

On Wednesday 21st April, Dr. Andrew Sayer from the group was on BBC Radio Oxford discussing the eruption. Those in the UK can listen at the following link, with the relevant segment beginning approximately 1 hour and 5 minutes into the show.

Interested parties may also want to look at this page about monitoring volcanic eruptions from satellites, based on other work done within the group.

AATSR observations

A. M. Sayer, G. E. Thomas, E. Carboni, R. G. Grainger, H. Huang, C. Arnold, and colleagues at the Rutherford Appleton Laboratory

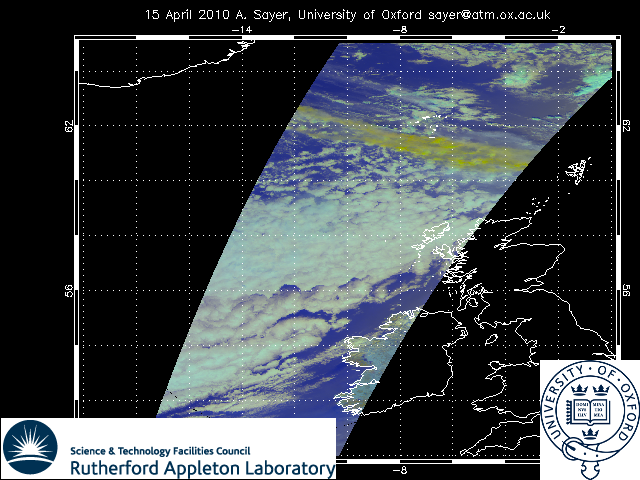
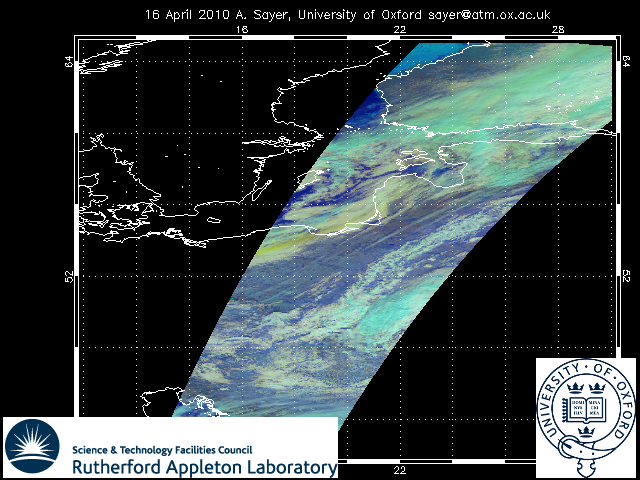
False-colour composite images from the visible and near-infrared channels on AATSR reveal the spectral distinction between thick ash plumes (appearing brown-yellow in these images) and liquid water or ice clouds (appearing in greys and pale blues, with sometimes a hint of yellow). Thick snow and ice cover also appear as an intense light blue. To the right is an example scene off the southern coast of Iceland on April 17.

For an image north of Scotland on April 15, click here. For one of central Europe on April 16, click here. For a slightly larger version of the image to the right, click here.

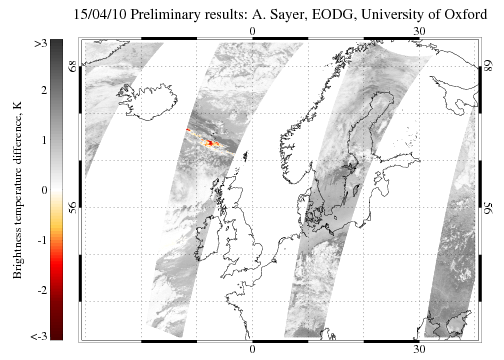
Maps showing the locations of dense ash plumes can be obtained from infrared (IR) measurements taken by AATSR. The figure to the right shows the brightness temperature difference (BTD) between 10.8 and 12 microns from AATSR observations over northern Europe on 15/04/10. Generally, negative BTDs (yellow and red colours) are characteristic of dense ash plumes. Positive BTDs (greys) are characteristic of water or ice clouds, and different surface types. When the ash is above a cloud, the negative BTD may be masked by the signal from the cloud.

Each orbit allows AATSR to measure a swath approximately 500 km wide. The revisit time depends on the latitude of interest, and global coverage is achieved approximately every 7 days.

An archive of recent BTD images we have created from AATSR data (in PNG format) may be found here.

For cloud-free regions, we are also able to determine the aerosol optical depth (AOD), which is a measure of the effectiveness by which small particles (known as `aerosols') in the atmosphere are absorbing or scattering light. This is typically reported referenced to a wavelength in the visible part of the spectrum (here, 550 nm). Higher AODs are associated with increased amounts of aerosol (such as, in this case, the plume).

Preliminary results showing the AOD retrieved from orbits on 15/04/10 are to the right; the high AODs of 1.5 or more in the plume correspond to regions of negative BTD in the top image. Typical background AODs for `clean and clear' conditions are in the range 0.05-0.2 for Europe. Other high values are observed in the vicinity of broken cloud fields.

An archive of recent AOD images we have created from AATSR data (in PNG format) may be found here.

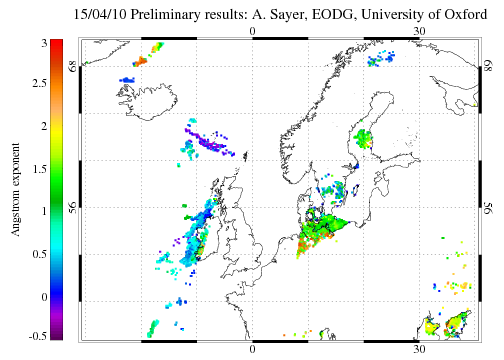
The Ångström exponent describes the variation of AOD with wavelength in the visible region of the spectrum. This is generally related to particle size, with large positive exponents for small particles (such as typical urban or rural continental aerosol) and small or negative exponents for larger particles (such as from volcanic ash, desert dust or maritime sea salt aerosol). Preliminary results showing the aerosol Ångström exponent from orbits on 15/04/10 are to the right; again, the ash plume is associated with negative exponents, typical for coarse volcanic ash.

An archive of recent Ångström exponent images we have created from AATSR data (in PNG format) may be found here.

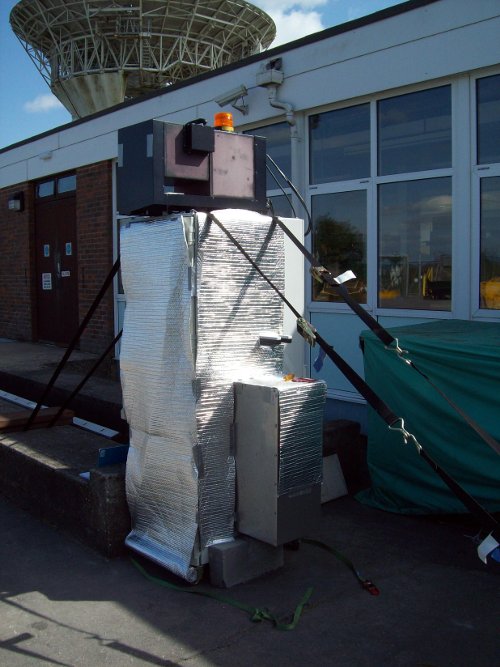
The AATSR aerosol and cloud research is carried out in collaboration with the Space Science and Technology Department (SSTD) at the Rutherford Appleton Laboratory (RAL) at Harwell Science Campus, near Didcot. This is in the framework of the Oxford-RAL Aerosol and Clouds (ORAC) project.


AATSR composite 17 APR 2010


AATSR BTD 15 APR 2010


AATSR AOD 15 APR 2010


AATSR Angstrom 15 APR 2010

IASI observations

J. Walker, E. Carboni, A. Dudhia

Gaseous sulphur dioxide (SO2) emitted during the eruption can be tracked by IASI. The figure to the right shows an animation of the enhancement of SO2 in the atmosphere, with higher values (warmer colours) indicating more of the gas. The top set of images shows IASI morning overpasses, and the bottom evening.

The volcanic plumes stretching from Iceland are clearly visible, and the curve of elevated SO2 corresponds well with the ash plume observed by AATSR above.

An erupting volcano may emit large amounts of SO2 in addition to water vapour and carbon dioxide. Since ordinary levels of SO2 in the atmosphere are extremely low, the detection of SO2 from space is a clear signal of a volcanic eruption and may be used as a proxy for the presence of volcanic ash dangerous to aviation, even when the volcanic ash itself may be difficult to observe above similar features such as cloud. Over time, however, the two separate as the ash drops to lower altitudes and may be carried along in another direction.


IASI SO2

MIPAS observations

A. Dudhia

MIPAS is a limb-viewing infrared fourier transform spectrometer, primarily intended for measuring the temperature and composition of the upper atmosphere. However it is also a very sensitive instrument for detecting high cloud, with good vertical resolution but relatively poor spatial resolution compared to nadir-viewing instruments (typically one measurement every few hundred km along each orbit track).

Oxford runs a near-real time retrieval of cloud-top height from MIPAS spectra provided by the European Space Agency. Since 17/04/10 these have been showing one or two measurements of unusually high cloud each day in the UK-Iceland area, shown by green squares on the plots (indicating a cloud height from 13.5-16.5 km).

Click on the links to the right to view plots of cloud parameters retrieved from MIPAS measurements for the day of interest.


Lidar observations

A. Povey, D. Peters, R. G. Grainger

In contrast to the satellites, the lidar allows measurements to be made more or less continuously, although only at a single location.

The term `lidar' stands for LIght Detection And Ranging, and operates on a similar principle to radar, except using light in the ultraviolet (UV), visible, or near-infrared (nIR) spectral ranges instead of radio waves. This gives it an improved sensitivity to small particles such as aerosols. Pulses of laser light are emitted by the instrument and the timing and strength of the echoes (`returns') provides information about what's in the atmosphere above the lidar.

The particular instrument `Rachel' used by DPhil student Adam Povey (operated in conjunction with Hovermere Ltd.) uses UV light at 355 nm.

The lidar is currently located alongside those operated by the Chilbolton Facility for Atmospheric and Radio Research (CFARR) in Hampshire. Some images of the lidar in these surroundings are provided to the right.

  • The top-left shows the whole instrument, for scale.

  • The top-right shows the laser which generates the pulses (silver box), together with the beam expander and some of the optics.

  • The lower shows the coolant system: essential to avoid overheating!


Lidar at Chilbolton  Lidar at Chilbolton


Lidar at Chilbolton

Some examples of lidar return profiles from Chilbolton obtained by Adam are shown in the bottom two figures. Analysis of these can provide useful information about the state of the atmosphere.

The horizontal axis indicates the time, and the vertical the altitude from which returns originate. The colour scale indicates the strength of returns from a particular altitude, with warmer colours (greens, yellows and reds) indicating more returns.

The first image from Friday 16/04/10 shows the first ash plume reaching Chilbolton Hampshire at about 12:30, descending from an altitude of about 3 km. Over the next few hours it settles onto the top of the planetary boundary layer (PBL; the yellow region at the bottom of the atmosphere at approximately 1 km and lower).

The ash remained here, forming a complex layered structure and mixing into the PBL, until the morning of Tuesday 20/04/10 when a weak frontal system moved over the site. This system `cleaned' out the ash, which can be seen on the second figure at about 10:00 where the clouds (strong signals in the range 1.5 km - 2 km) appear.

Observations continued to be taken for several more days although no further distinct ash layers were observed.


Lidar measurements at  Chilbolton 16/04/10


Lidar measurements at  Chilbolton 16/04/10

All data and plots on this site should be considered preliminary work. Please contact us before reproducing these images elsewhere, or if you have further questions.


© EODG, 2010 | Maintained by Don Grainger | Contact us | Last update 01/07/10 17:21

Oxford logoNCEO logo

University of Oxford Physics Department. Page last updated: @12:49 GMT 07-May-2012