Images of the Eruption
Click image to enlarge
|
Click image to enlarge
|
Click image to enlarge
|
Click image to enlarge
|
Click image to enlarge
|
|
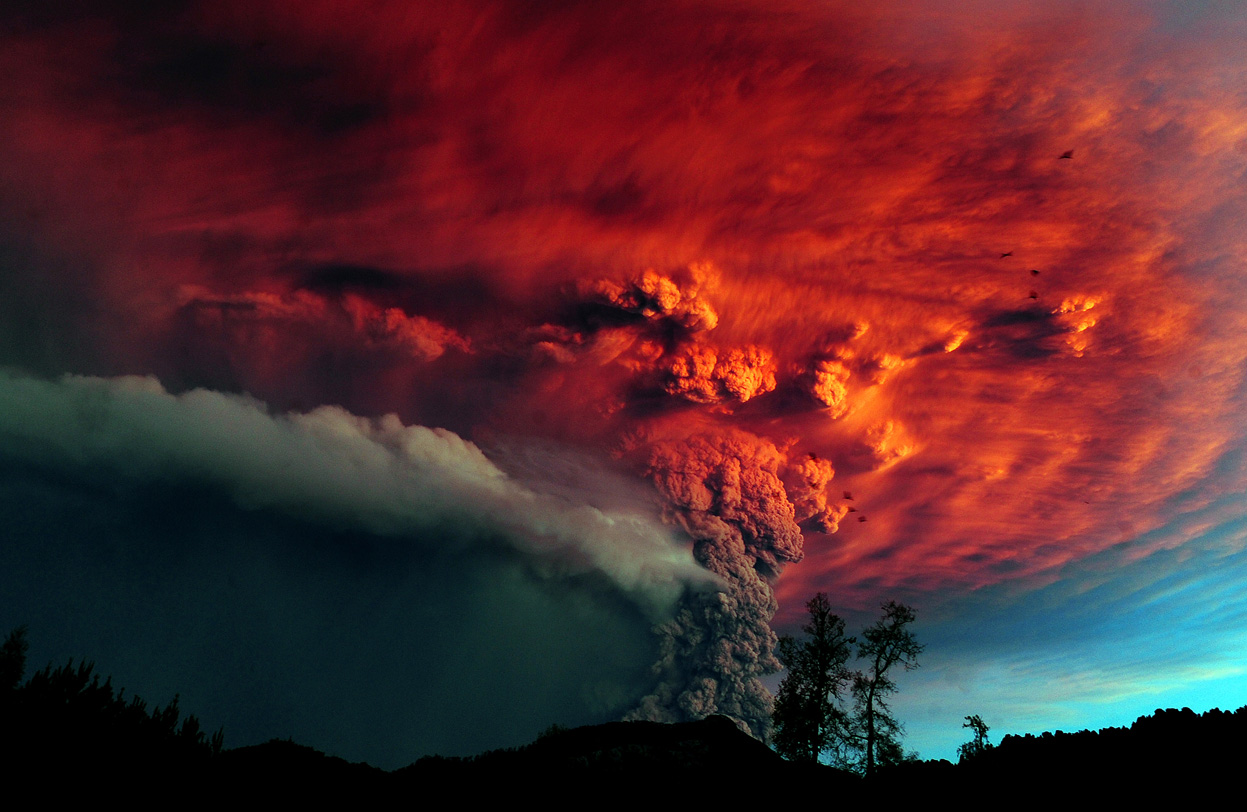
A cloud of ash billowing from Puyehue volcano near Osorno in southern
Chile, 870 km south of Santiago, on June 5, 2011. (Claudio Santana/AFP/Getty Images)
|
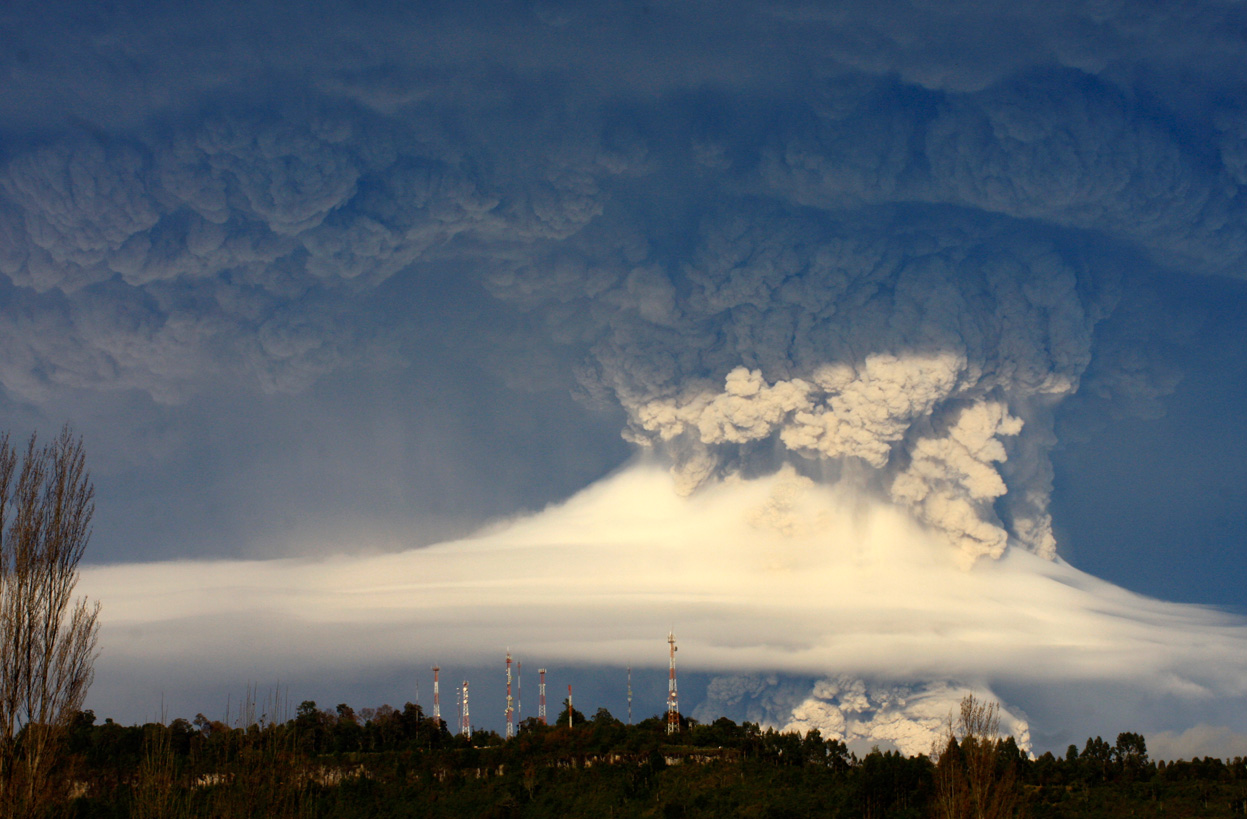
A view of the ash plume above the Puyehue-Cordon Caulle volcano chain
near Entrelagos, on June 5, 2011. (Reuters/Carlos Gutierrez)
|
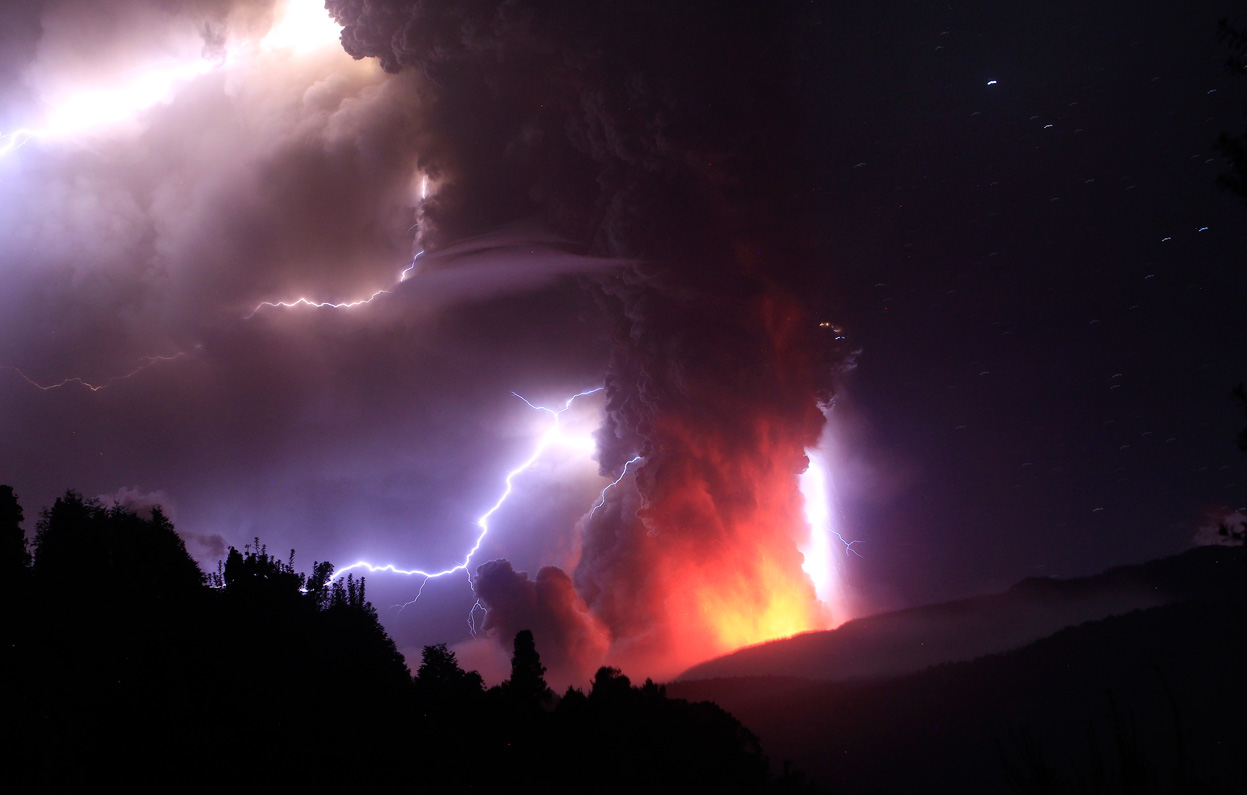
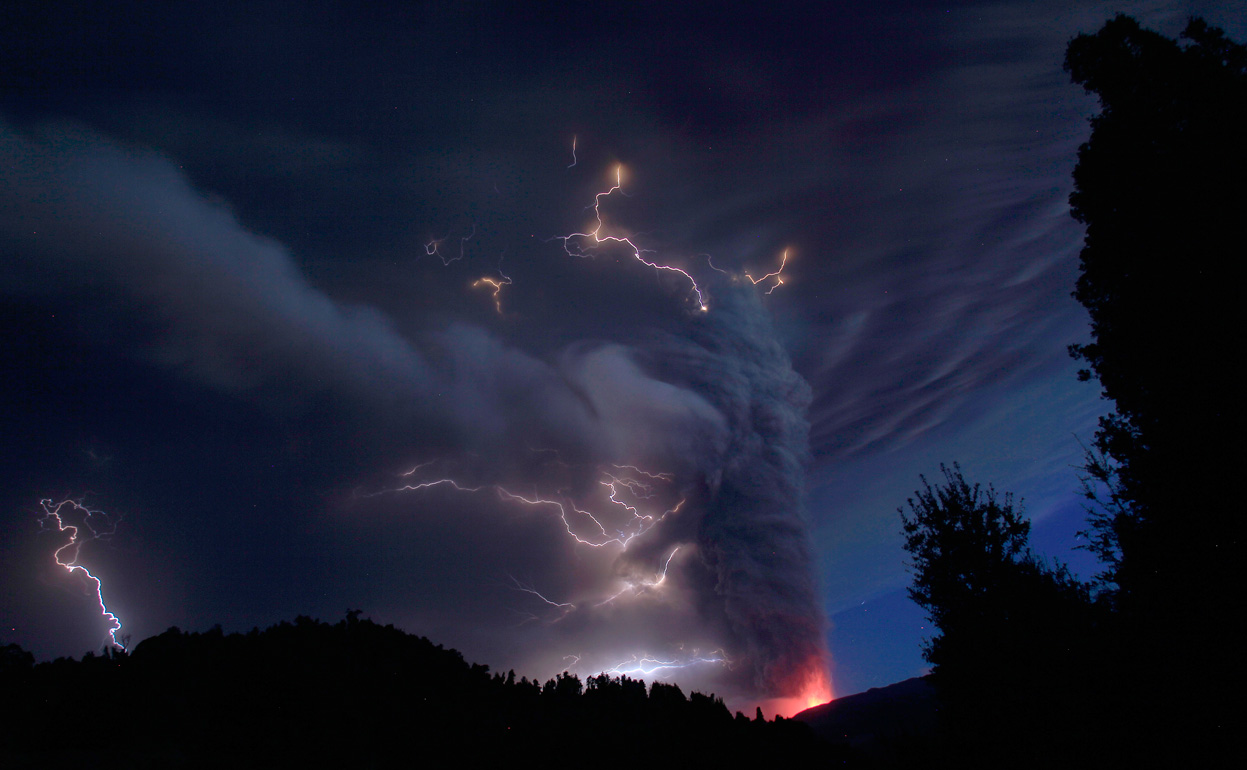
Lightning bolts strike around the Puyehue-Cordon Caulle volcanic chain
near southern Osorno city, on June 5, 2011. (Reuters/Ivan Alvarado)
|
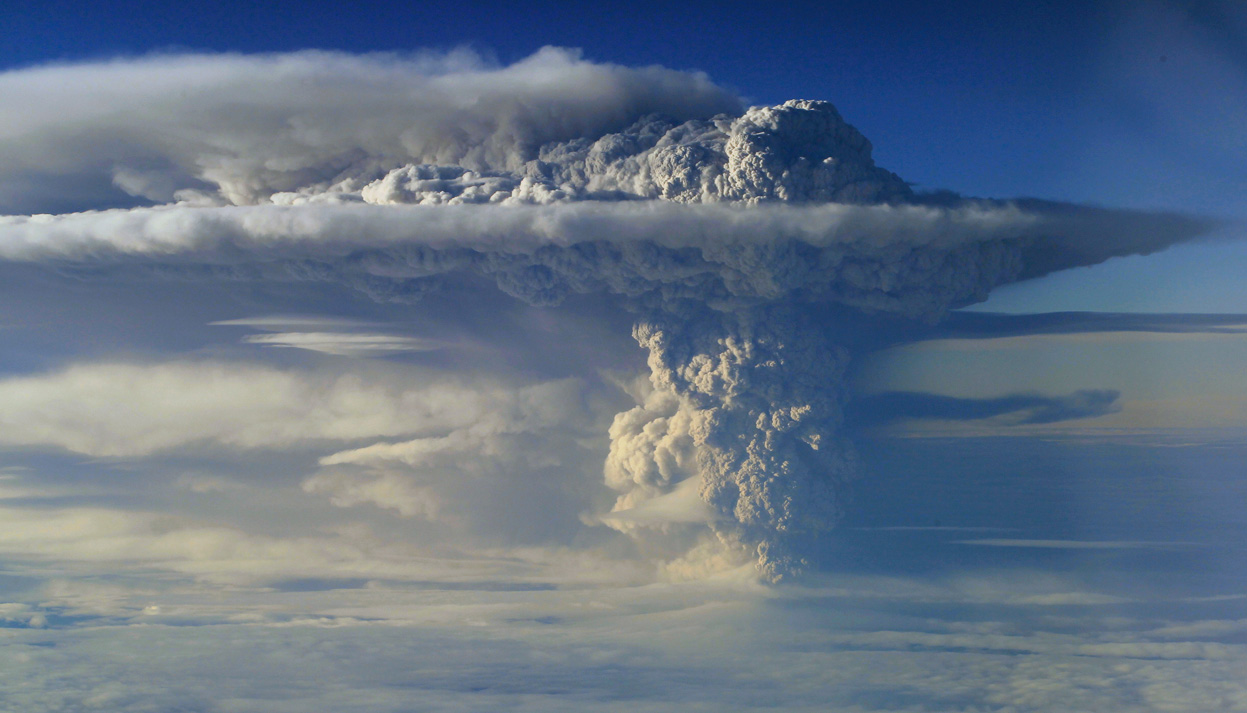
An aerial view of the ash plume from an eruption in the Puyehue-Cordon
Caulle volcanic chain near Osorno city in south-central Chile, on June
5, 2011. Picture taken through an airplane window. (Reuters/Ivan
Alvarado)
|
Lightning bolts strike around an eruption of the Puyehue-Cordon Caulle
volcanic chain near southern Osorno city, on June 5,
2011. (Reuters/Ivan Alvarado)
|
AOPP Oxford observations of June 2011 Puyehue-Cordón Caulle eruption
This page provides an overview of research
performed within the Earth Observation Data Group (EODG) of the
Atmospheric, Oceanic and Planetary Physics (AOPP) department at the University of Oxford, relating to the
June 2011 eruption of Puyehue-Cordón Caulle in
Chile. This work is funded mainly through grants from the UK
Natural Environment Research Council (NERC), including the NERC National
Centre for Earth Observation (NCEO).
Puyehue volcano
erupted for the first time in half a century on June 4, 2011, and sent ash over 6 miles (10 km) into
the sky.
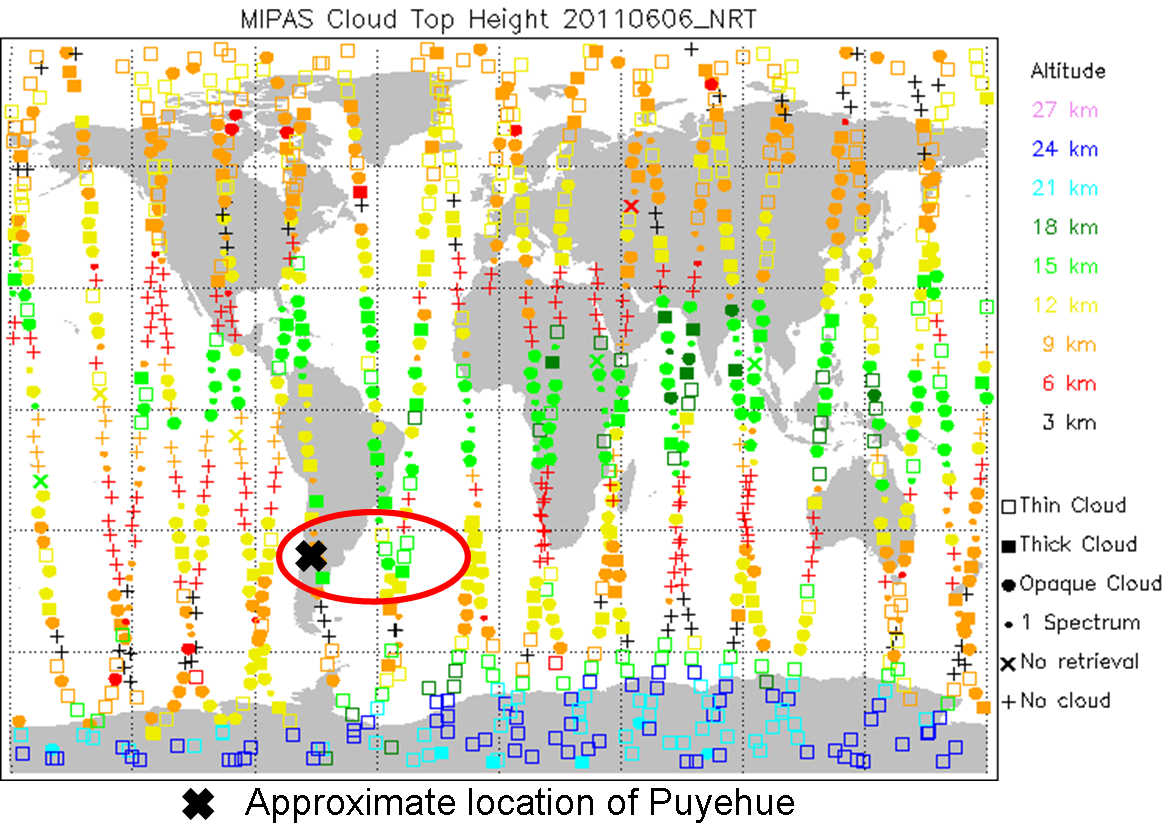
6 June 2011
Click image to enlarge
|
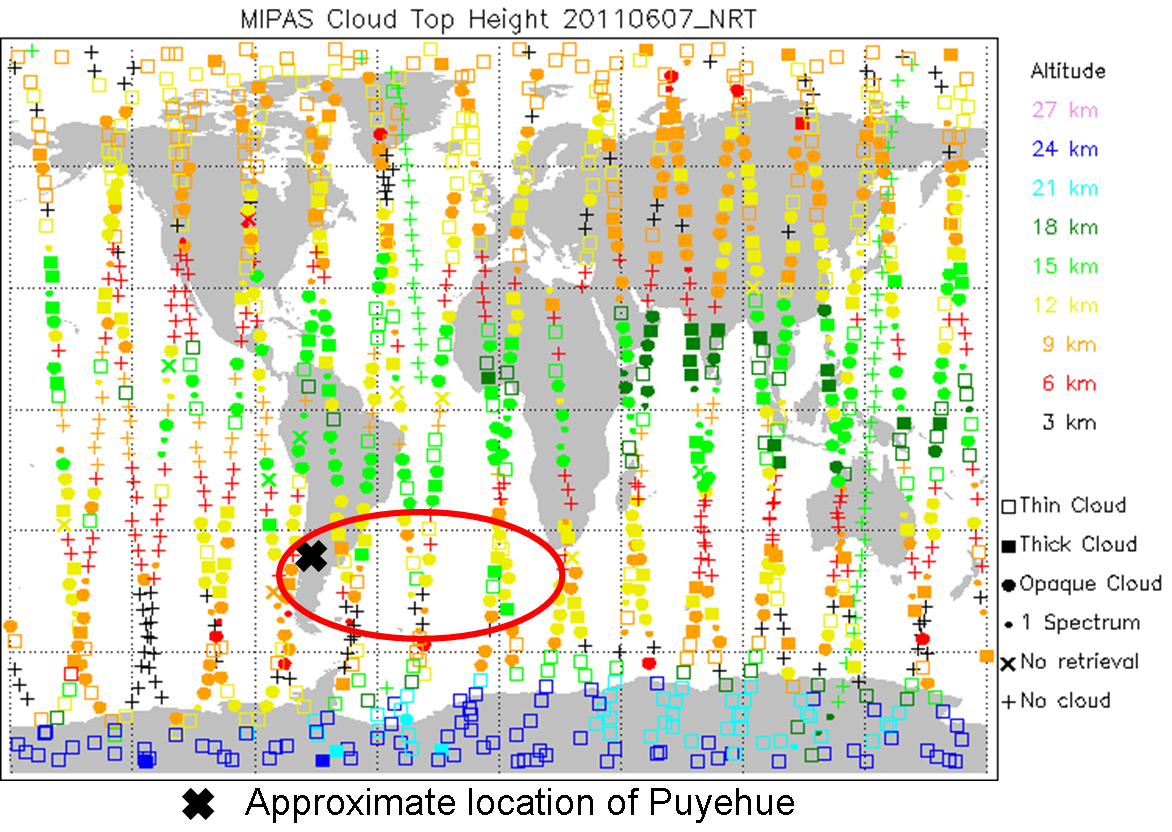
7 June 2011
Click image to enlarge
|
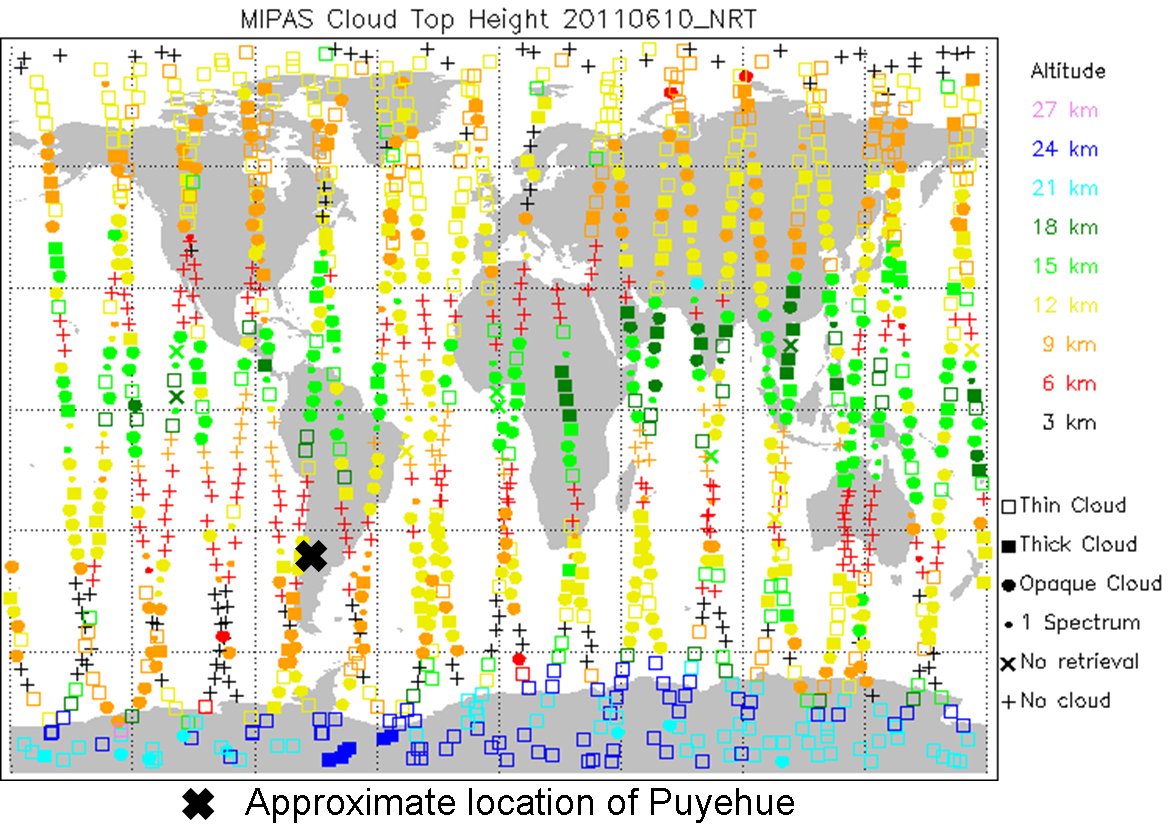
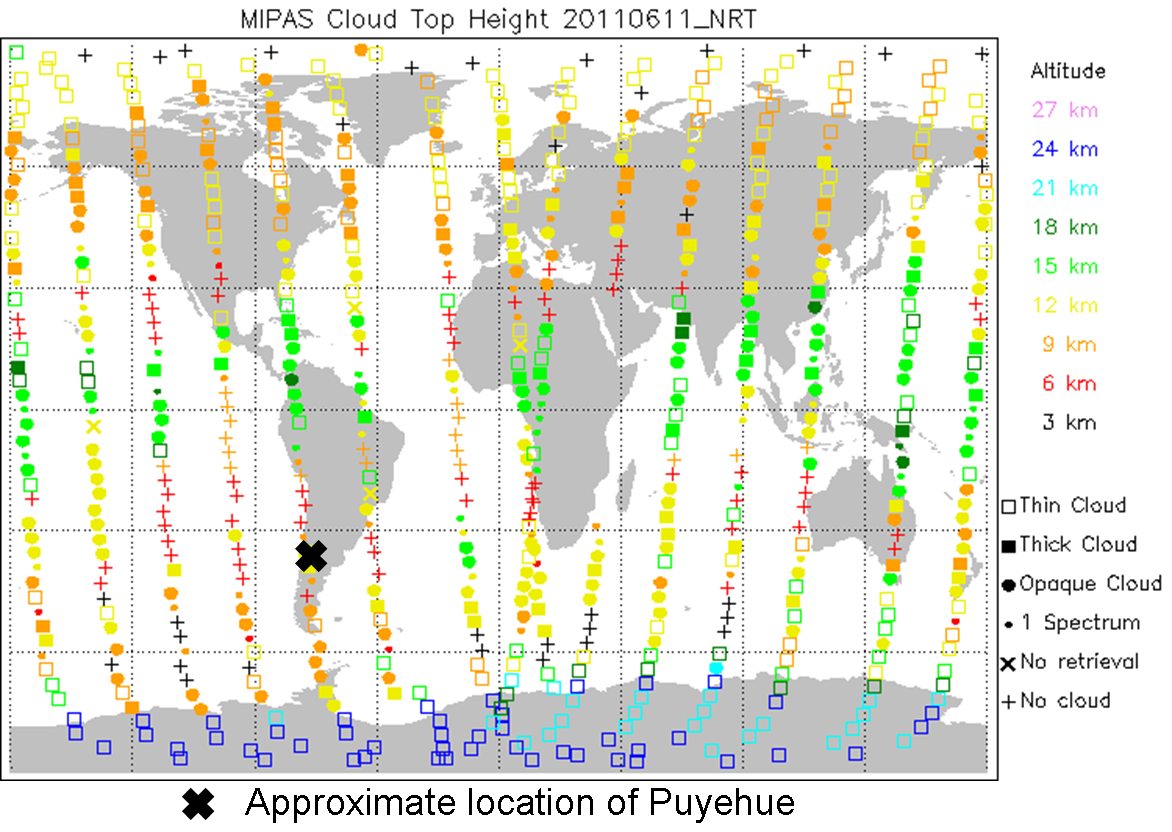
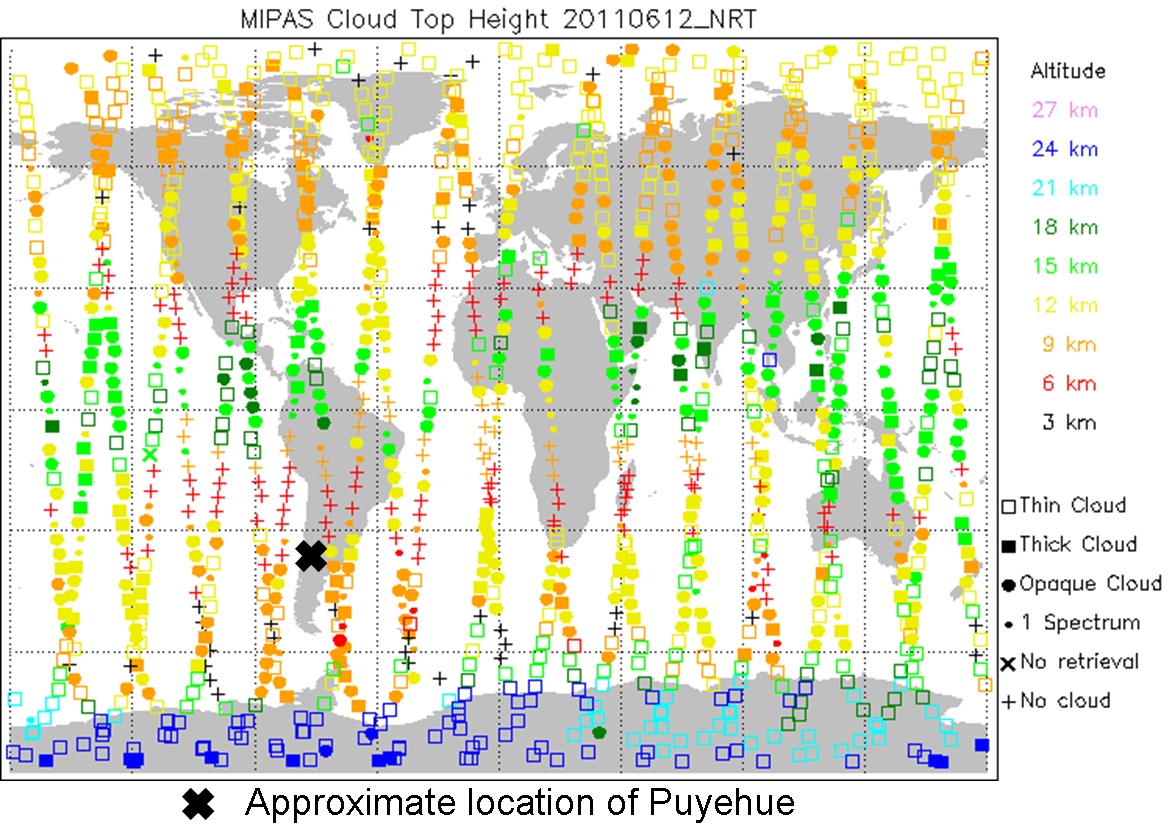
MIPAS measurements of cloud top height. Ash from Puyehue is identified in a number of atmospheric scans downwind of the volcano at a height of about 15 km (light green box represents a thick cloud).
Credit Dr Anu Dudhia.
|
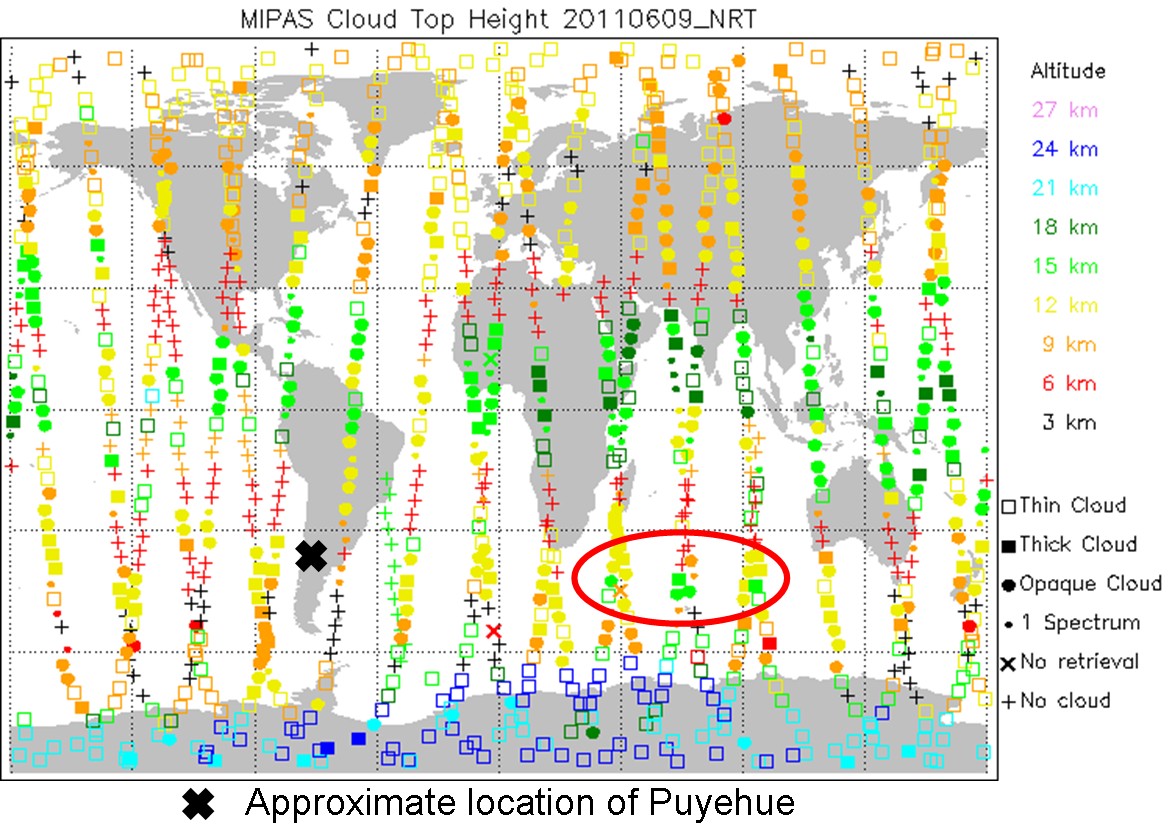
9 June 2011
Click image to enlarge
|
10 June 2011
Click image to enlarge
|
11 June 2011
Click image to enlarge
|
12 June 2011
Click image to enlarge
|
|
|
6 June 2011
Click image to enlarge
|
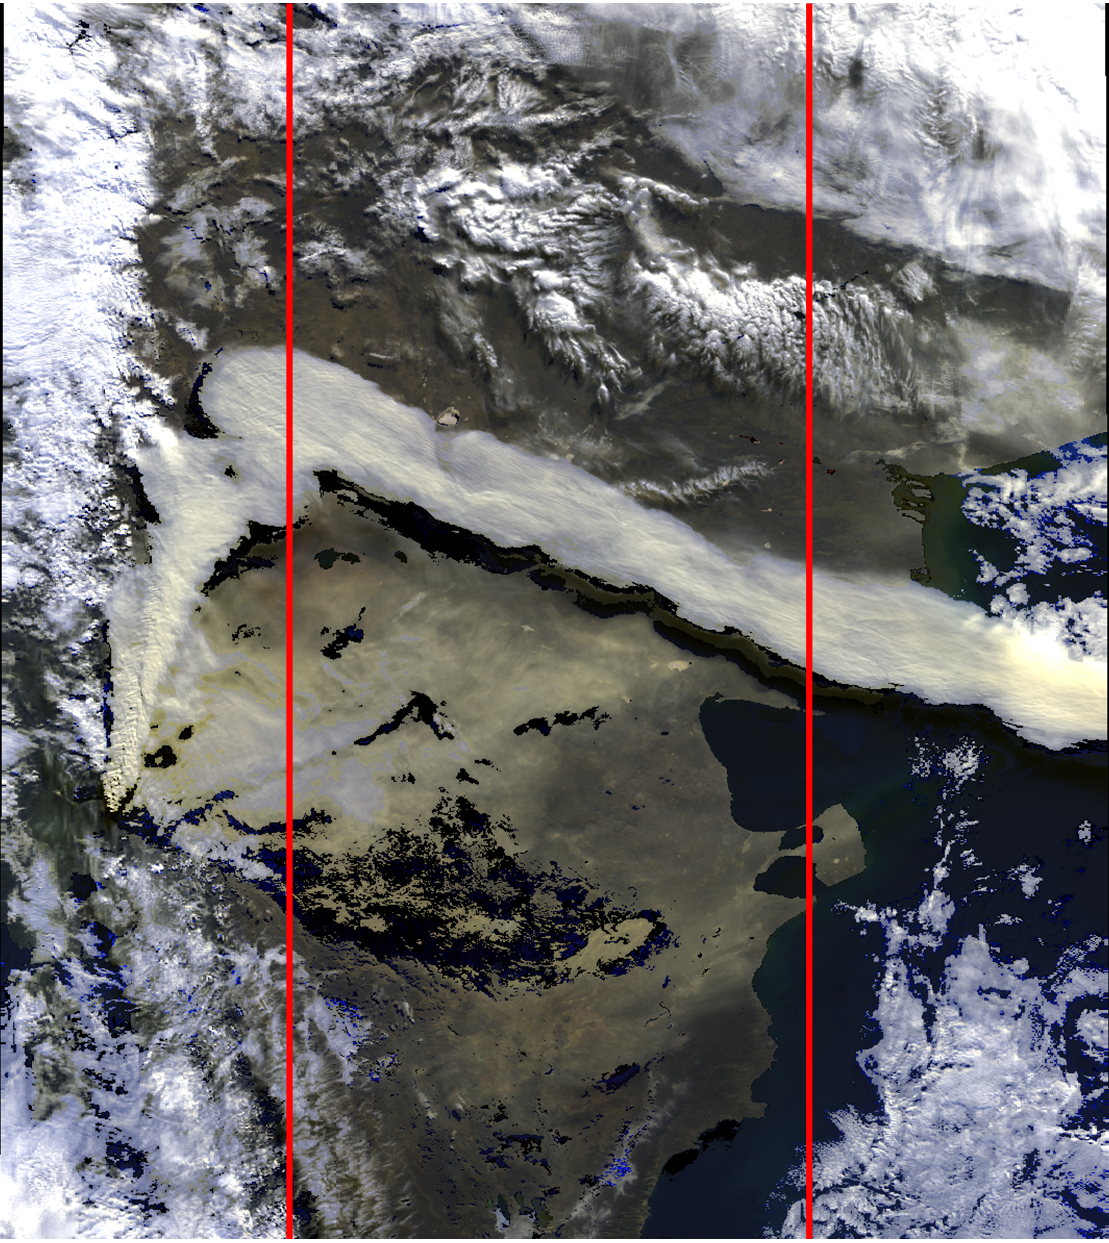
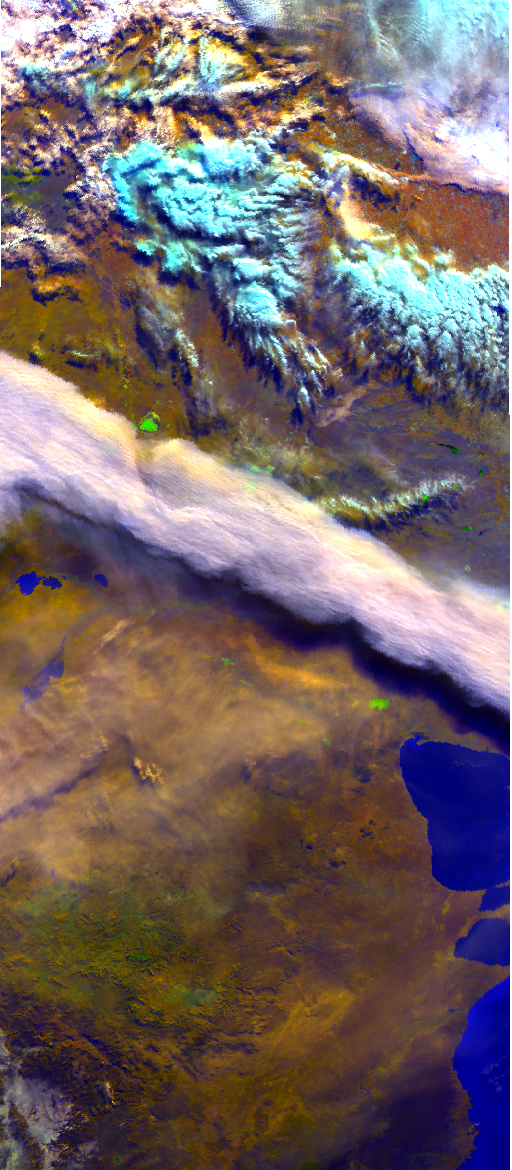
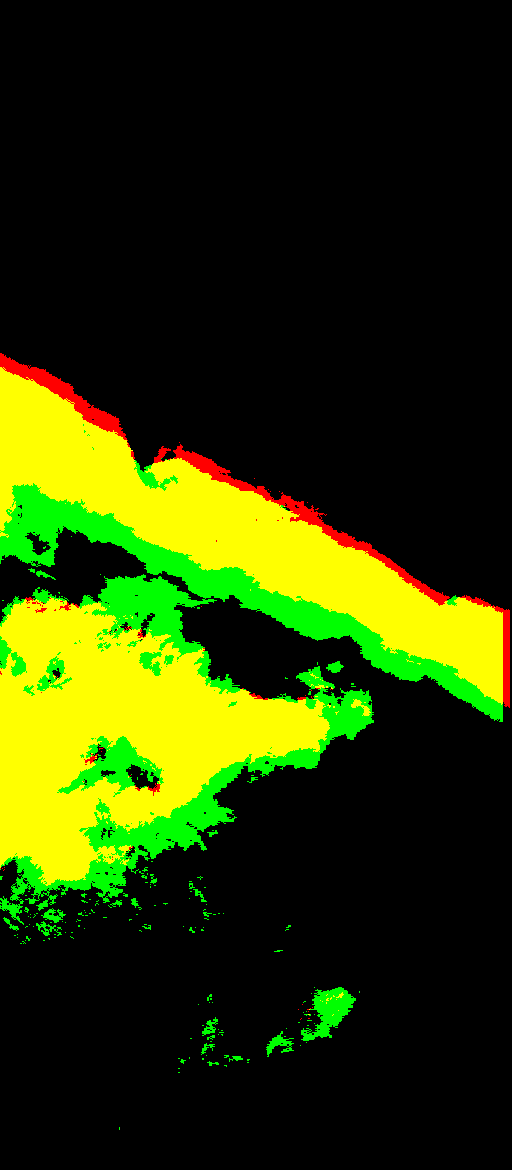
MERIS (left) and AATSR (below left) false colour images of the
eruption on 6 June 2011. AATSR has a small swath width so its
approximate location is indicated on the MERIS image by red
lines. These instruments are carried on the ENVISAT platform.
The area of the AATSR image identified as ash is shown in the
figure below right. AATSR provides two near-simultaneous views of the Earth,
the first looking "forward" along the satellite track at 55 degrees
from the vertical, the second looking at nadir. Ash identified from the
forward view appears green in the image below, detection in the nadir
view is shown as red, and detection in both views appears
yellow. There is clear parallax (due to the height of the ash cloud
above the ground) apparent in this image, which makes determination of
the plume height possible. In addition to the main ash plume, to the
south there is an extensive area of much thinner ash.
Credit Dr Gareth Thomas.
|
6 June 2011
Click image to enlarge
|
6 June 2011
Click image to enlarge
|
6 June 2011
Click image to enlarge
|
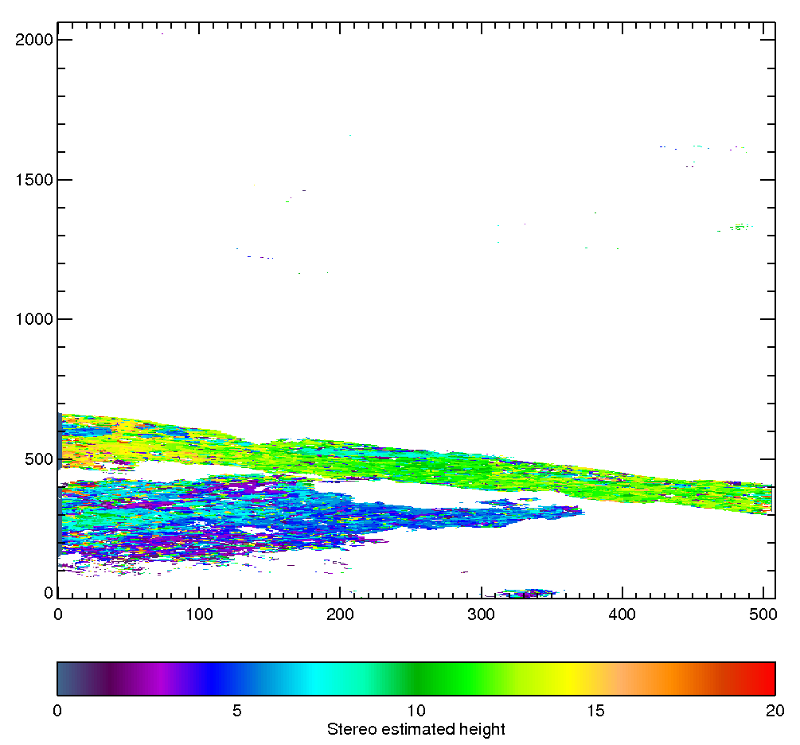
The image on the left gives the height of the plume using a stereo
matching technique. The images covers the same area as the AATSR
images above but with a different aspect ratio. The main plume appears
at about 15 km but descends to about 12 km quite quickly. The plume
to the south is much lower - typically around 5 km in altitude.
Credit Dr Gareth Thomas.
|
6 June 2011
Click image to enlarge
|
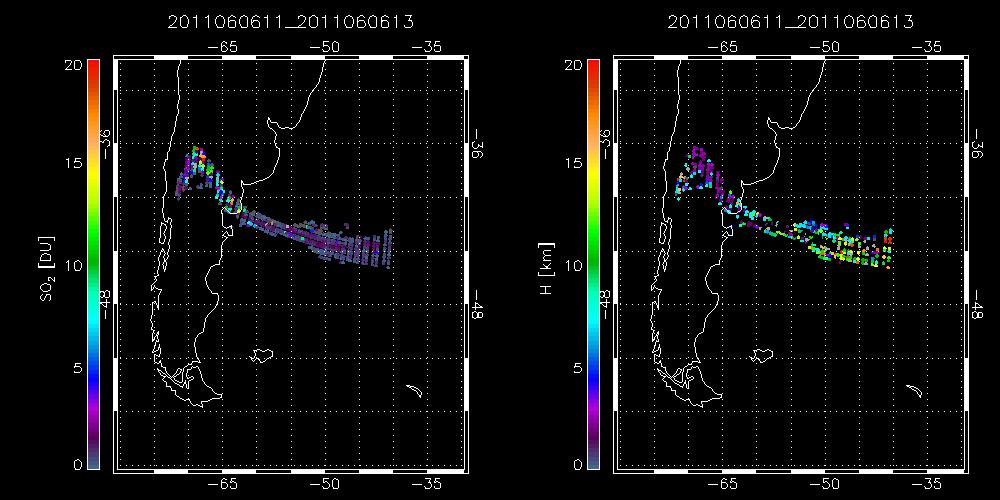
The image on the left give SO2 amount and altitude determined from IASI measurements on the 6 June 2011. The SO2 is colloced with the ash plume measured by AATSR suggesting that both gas and ash were injected at similar altitudes.
Credit Dr Elisa Carboni.
|
5-13 June 2011
Click image to enlarge
|
SO2 amount and altitude over South America and the South Atlantic.
Credit Dr Elisa Carboni.
|
5-30 June 2011
Click image to enlarge
|
SO2 amount and altitude as the SO2 plume disperses through the Southern Hemisphere.
Credit Dr Elisa Carboni.
|
All data and plots on this site should be considered preliminary work. Please contact us before reproducing these images elsewhere, or if you have further questions.
© EODG, 2010 | Maintained by Don Grainger | Contact us | Last update 28/05/11 12:15
 
|


