About EODG
People
Publications
Research
Aerosol Spectroscopy
MIPAS
ORAC
Volcanic Emissions
      Ash Spectroscopy
      Ash & SO2 Retrieval
      Eruption Monitor
      Eyjafjallajökull
      Grimsvötn
      Karthala
      Nabro
      Puyehue
Software & Databases
Local Information (restricted)
(printable)

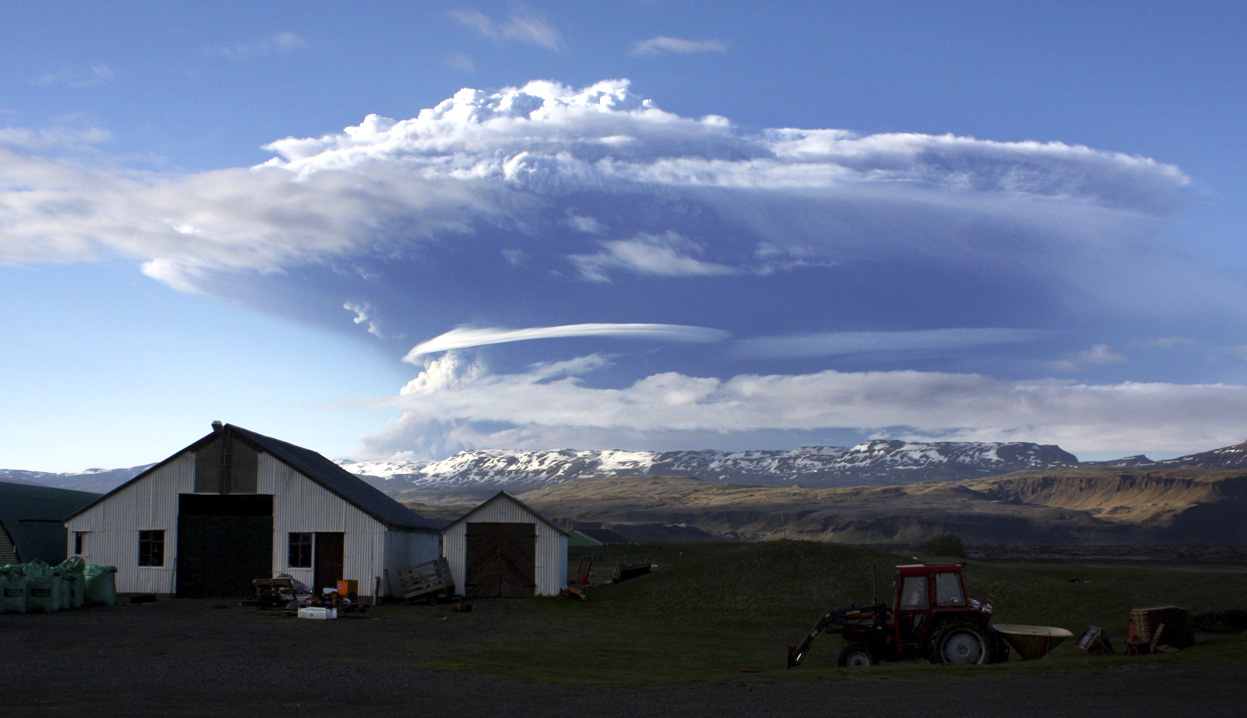
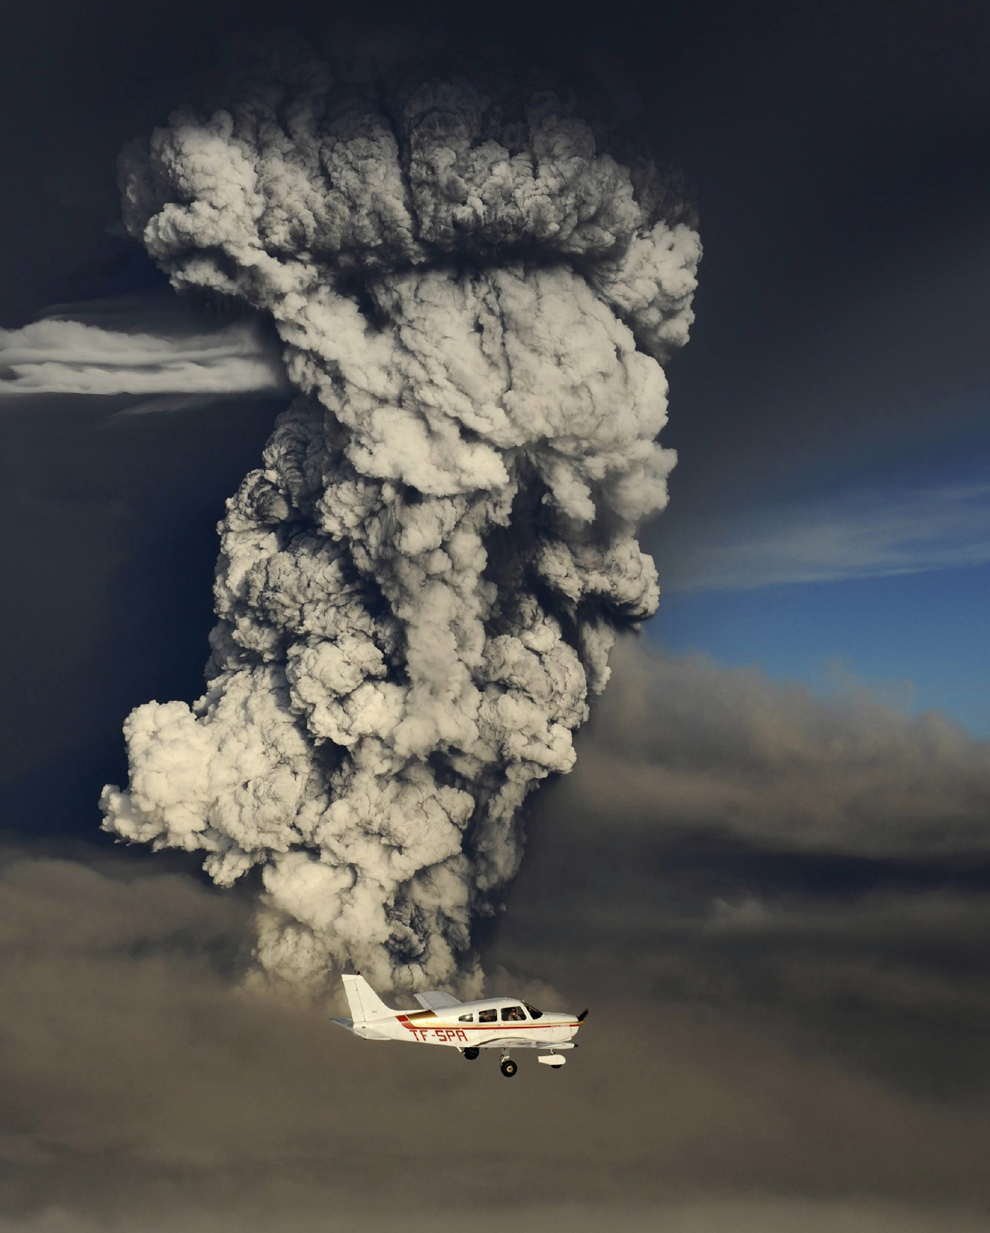
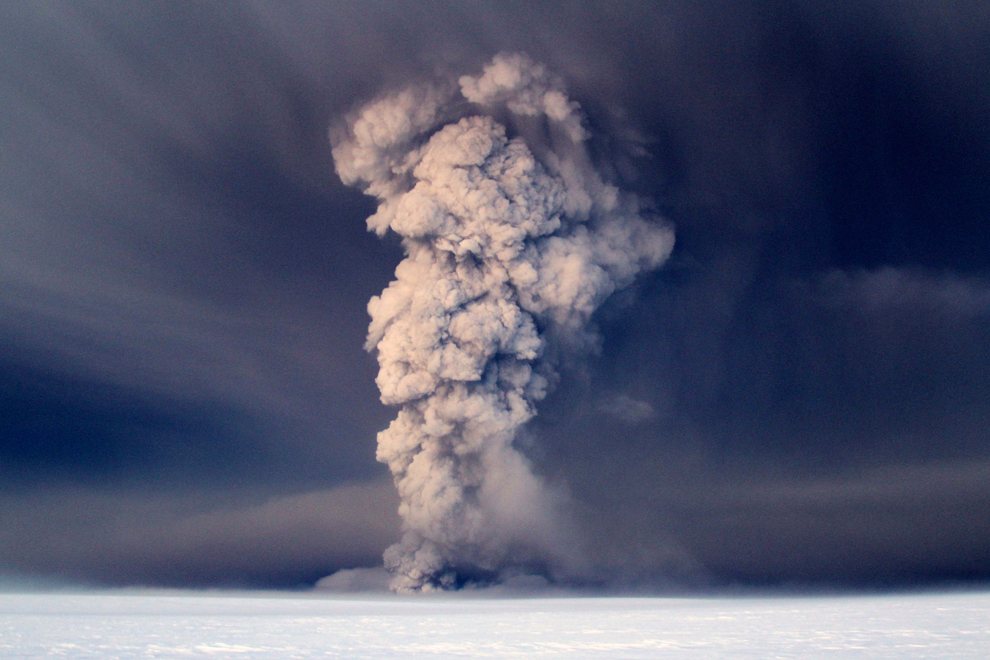
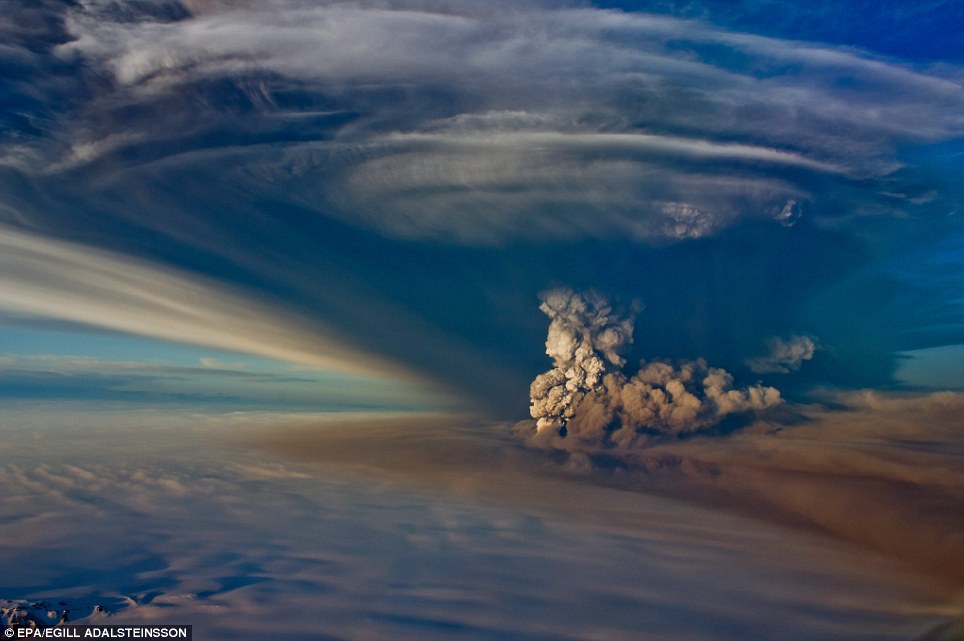
Images of the Eruption


Click image to enlarge

Click image to enlarge

Click image to enlarge

Click image to enlarge

Click image to enlarge
A cloud of smoke and ash is seen over the Grimsvötn volcano on Iceland on May 21, 2011. (Sigurlaug Linnet/AFP/Getty Images) A plane flies past a smoke plume resulting from the eruption of the Grimsvötn volcano, May 21, 2011. (Olafur Sigurjonsson/Reuters) (Jon Gustafsson/Associated Press) Aerial view of the eruption of the volcano Grimsvötn. Smoke plume from the Grimsvötn volcano.

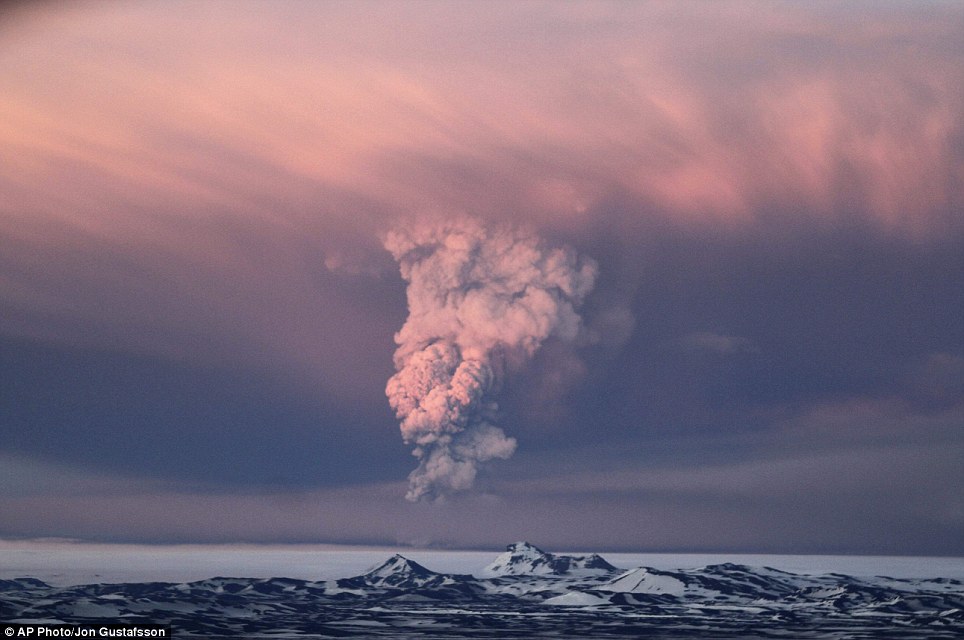
AOPP Oxford observations of May 2011 Grimsvötn eruption

This page provides an overview of research performed within the Earth Observation Data Group (EODG) of the Atmospheric, Oceanic and Planetary Physics (AOPP) department at the University of Oxford, relating to the May 2011 eruption of the volcano at Grimsvötn in Iceland. This work is funded mainly through grants from the UK Natural Environment Research Council (NERC), including the NERC National Centre for Earth Observation (NCEO). The Grimsvotn volcano lies under the Vatnajokull glacier, about 120 miles, (200 kilometers) east of the capital, Rejkjavik. The volcano began erupting around 1900 GMT on May 21, 2011 for the first time since 2004. In less than an hour the cloud had reached an altitude of 11 kilometers (6.8 miles).

AATSR False Colour 23 May 2011
22 May 2011 am Click image to enlarge
A false colour image from the AATSR instrument of the Grimsvötn volcanic eruption in Iceland on the 22nd of May. The image covers an area of approximately 500 x 700 km and is coloured to highlight volcanic ash clouds, which appear as a rusty-brown colour. Water clouds appear white in the image, while ice-clouds, snow and glacial ice appear pale blue. The main volcanic plume is clearly visible near the centre of the image, casting a shadow toward the North-West. Wind blown ash clouds can also be seen extending to both the North and South of the volcano itself, overlying both water and ice clouds, which suggests they are at an altitude of at least a few km. This image was collected at approximately 1:30 pm BST, 22/05/2011. The Advanced Along Track Scanning Radiometer (AATSR) is a British instrument flying on board ESA's Envisat satellite. Credit Dr Gareth Thomas.
IASI SO2 Flag 21 - 26 May 2011
21 - 26 May 2011 Click image to enlarge
SO2 fractional enhancment obtained from IASI data. This is a flag that shows anomalously high concentrations of SO2. Often SO2 and ash is injected at the same height to that they are colocated for serveral days after the eruption. However some eruptions inject ash and SO2 at different altitudes so that they subsequently follow different trajectories. Credit Dr Elisa Carboni.

IASI SO2 Flag 24 May 2011 am
24 May 2011 am Click image to enlarge
IASI SO2 Flag 24 May 2011 pm
24 May 2011 pm. Click image to enlarge
SO2 frames for the 24 May. Credit Dr Elisa Carboni.
IASI SO2 Retreivals 21 - 26 May 2011
21 - 26 May 2011 Click image to enlarge
(Left) Amount of SO2 (in Dobson Units) retrieved from IASI data. (Right) Approximate height of the SO2 plume. Credit Dr Elisa Carboni.
AATSR False Colour 24 May 2011, nadir view
24 May 2011 Click image to enlarge
AATSR False Colour 24 May 2011, forward view
24 May 2011 Click image to enlarge
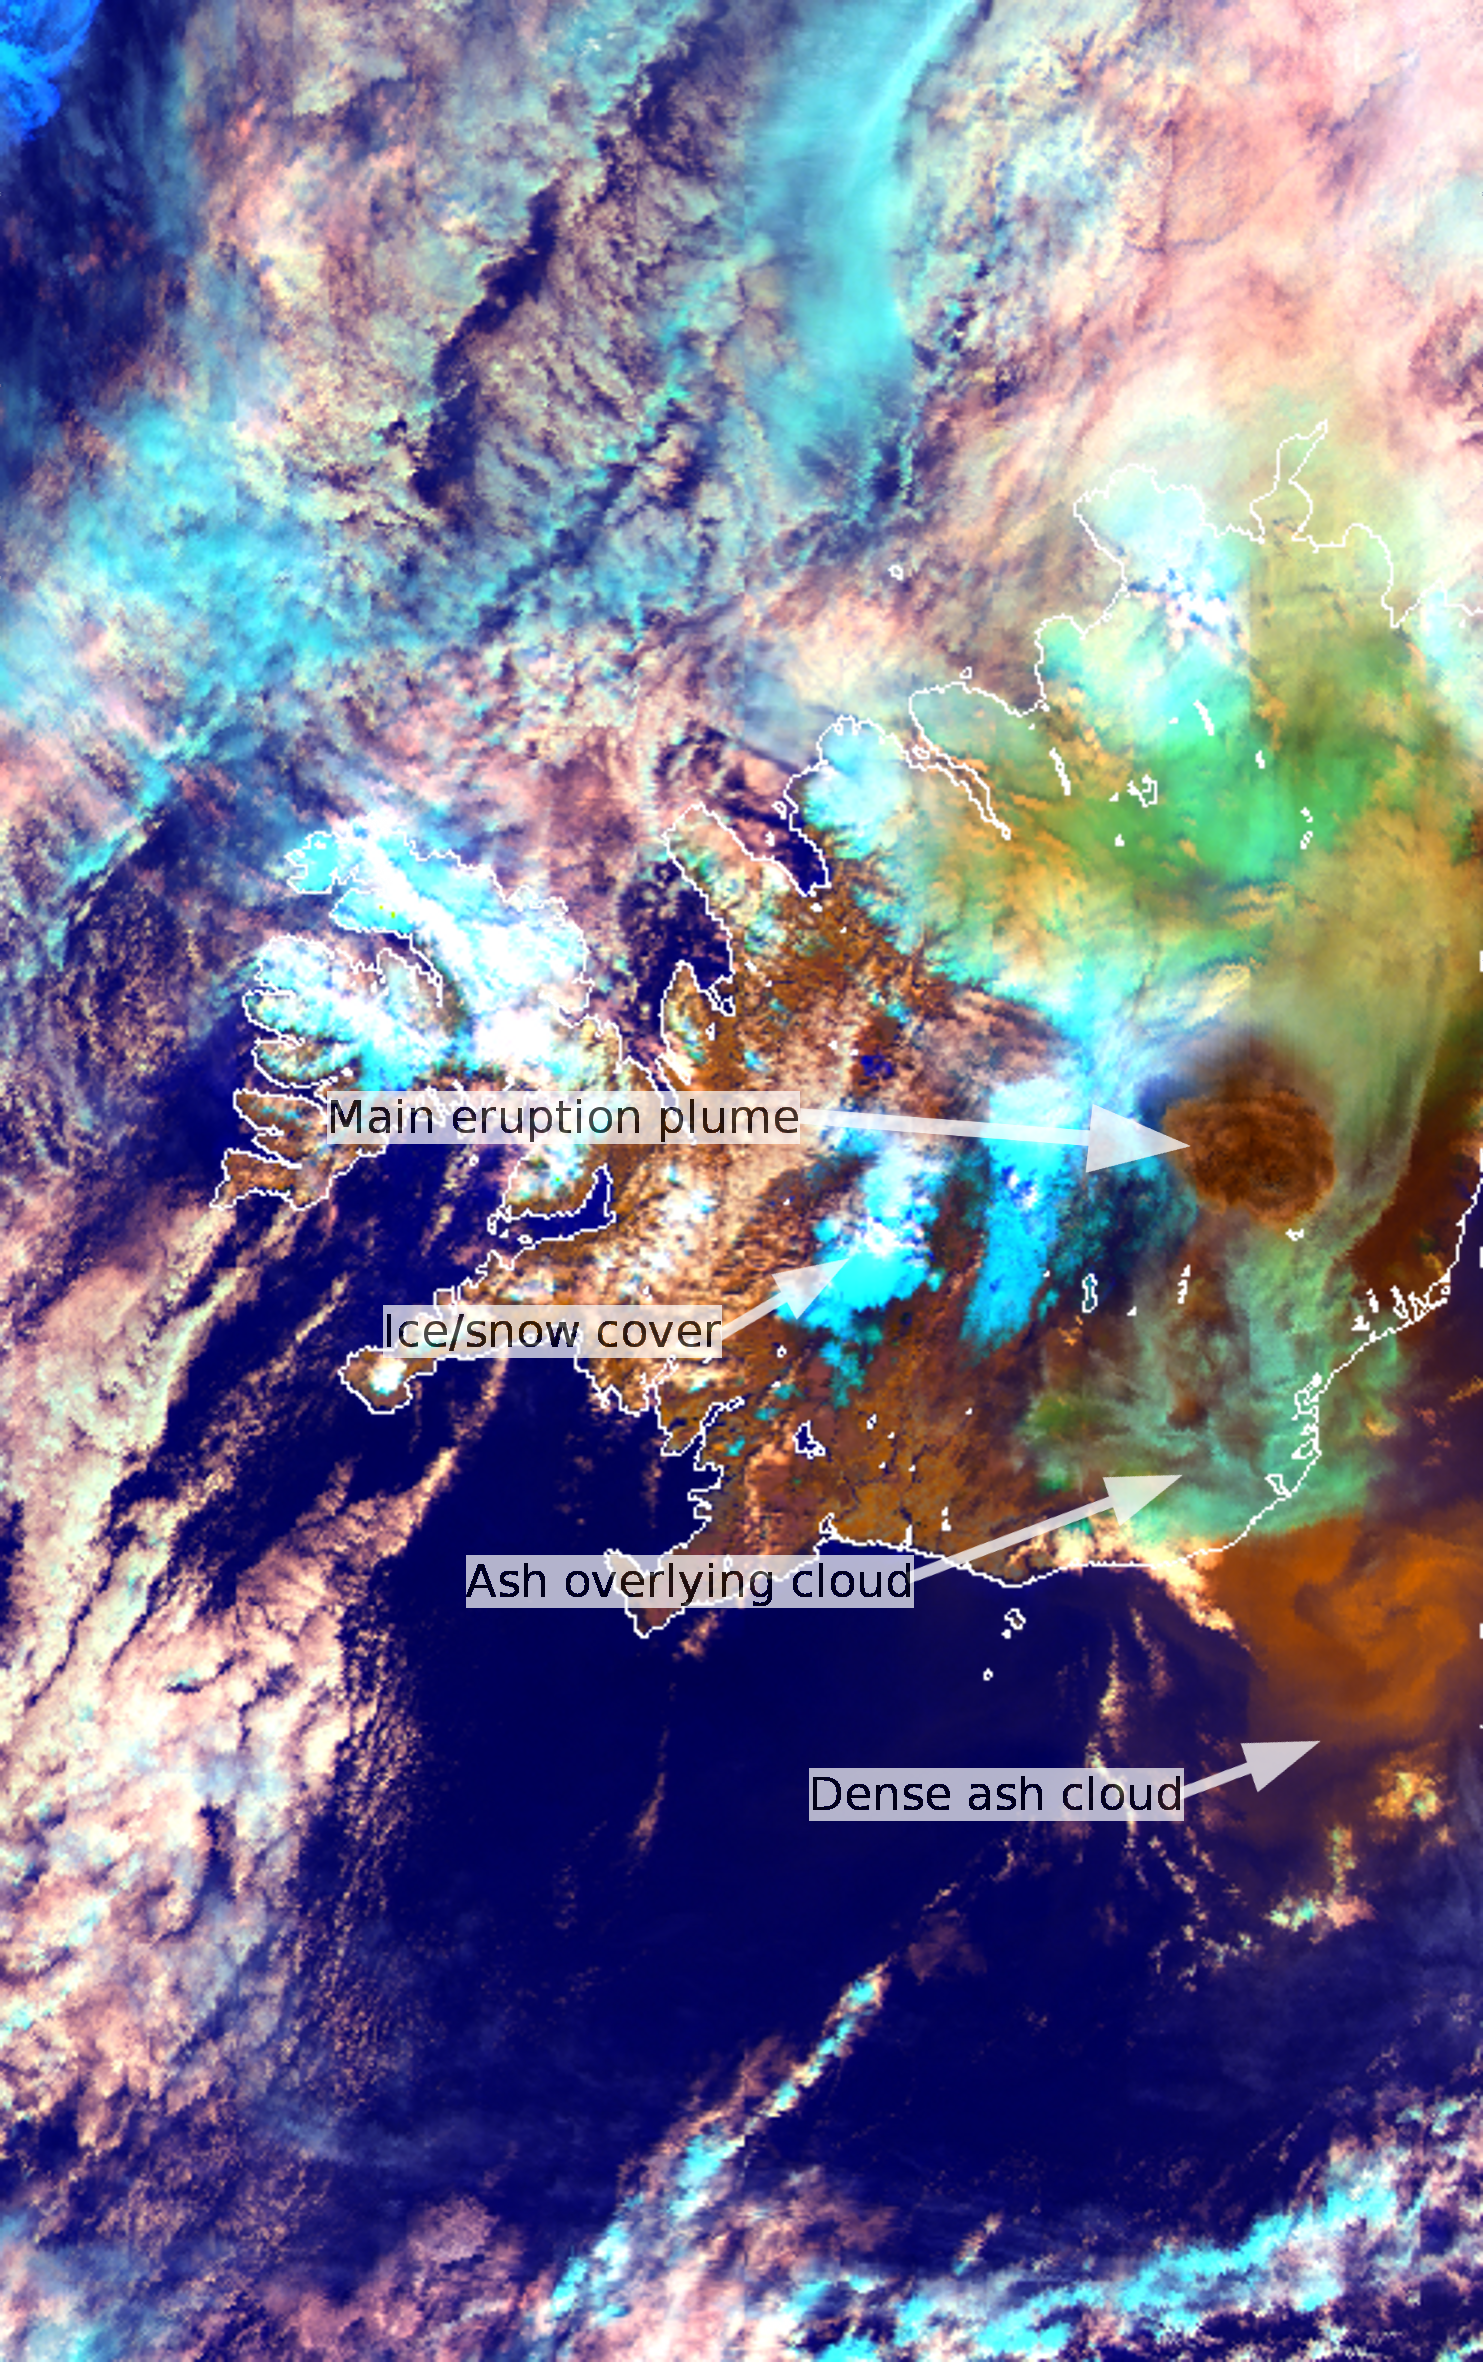
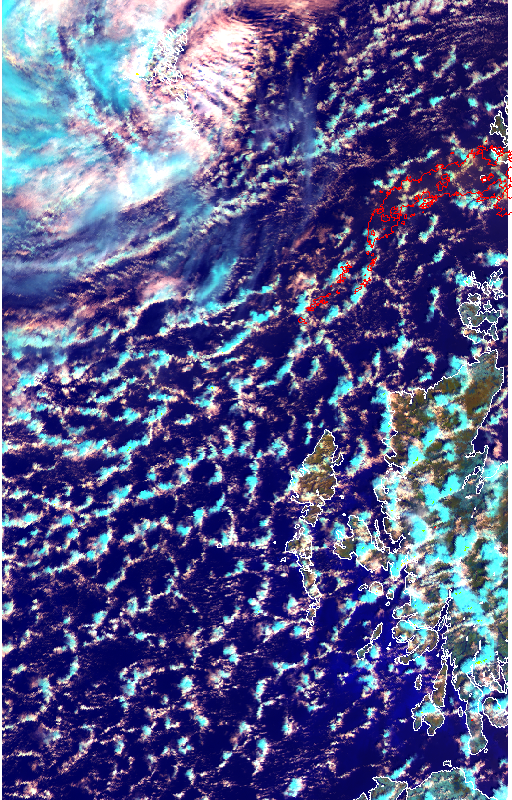
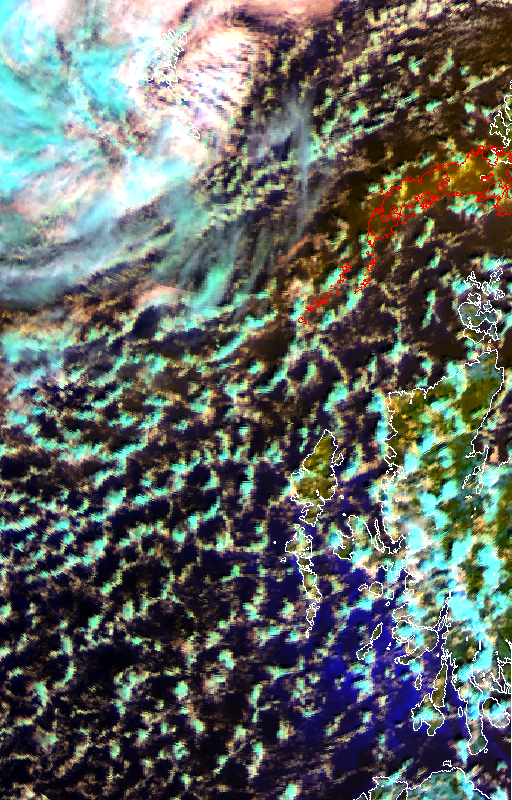
False colour images from the AATSR instrument, showing the presence of a significant volcanic ash cloud off the North-West coast of Scotland at approximately 12:30 pm BST on the 24th of May 2011. Images from both views of AATSR are shown, with the left image showing the nadir (i.e. vertically down) view and the right showing the forward view (where the instrument looks towards the South at an angle of approximately 55o). The forward view provides more sensitivity to the semi-transparent ash cloud, making it much more apparent.
The images also indicate the region identified as ash by an automated detection algorithm developed by EODG, which is outlined in red. The densest part of the ash cloud has been identified, however there is some hint of thinner ash extending further West than the identified region.
If compared to the images from IASI above, the ash cloud can be seen to be associated with the SO2 plume seen near Scotland in the morning image, and other images show some ash associated with the region of enhanced SO2 seen to the North of Iceland. Credit Dr Gareth Thomas.

All data and plots on this site should be considered preliminary work. Please contact us before reproducing these images elsewhere, or if you have further questions.


© EODG, 2010 | Maintained by Don Grainger | Contact us | Last update 28/05/11 12:15

Oxford logoNCEO logo

University of Oxford Physics Department. Page last updated: @12:52 GMT 07-May-2012